Article

The Structure and Magnetic Properties of Rapidly Quenched Fe72Ni8Nb4Si2B14 Alloy

by
Lukasz Hawelek
1,*,
Tymon Warski
1,
Patryk Wlodarczyk
1,
Marcin Polak
1,
Przemyslaw Zackiewicz
1,
Wojciech Maziarz
2,
Anna Wojcik
2,
Magdalena Steczkowska-Kempka
1 and
Aleksandra Kolano-Burian
1
1
Lukasiewicz Research Network—Institute of Non-Ferrous Metals, 5 Sowinskiego str., 44-100 Gliwice, Poland
2
Institute of Metallurgy and Materials Science, Polish Academy of Sciences, 25 Reymonta str., 30-059 Krakow, Poland
*
Author to whom correspondence should be addressed.
Materials 2021, 14(1), 5; https://doi.org/10.3390/ma14010005
Submission received: 30 October 2020 / Revised: 14 December 2020 / Accepted: 17 December 2020 / Published: 22 December 2020
(This article belongs to the Special Issue Nanocomposite Magnetic Materials for Energy Conversion)

Abstract

:
The complex structural and magnetic studies of the annealed rapidly quenched Cu-free Fe72Ni8Nb4Si2B14 alloy (metallic ribbons form) are reported here. Based on the calorimetric results, the conventional heat treatment process (with heating rate 10 °C/min and subsequent isothermal annealing for 20 min) for wound toroidal cores has been optimized to obtain the least lossy magnetic properties (for the minimum value of coercivity and magnetic core losses at 50 Hz). For optimal conditions, the complex permeability in the 104–108 Hz frequency range together with core power losses obtained from magnetic induction dependence up to the frequency of 400 kHz was successfully measured. The average and local crystal structure was investigated by the use of the X-ray diffraction method and the transmission electron microscopy observations and proved its fully glassy state. Additionally, for the three temperature values, i.e., 310, 340 and 370 °C, the glass relaxation process study in the function of annealing time was carried out to obtain a deeper insight into the soft magnetic properties: magnetic permeability and cut-off frequency. For this type of Cu-free soft magnetic materials, the control of glass relaxation process (time and temperature) is extremely important to obtain proper magnetic properties.

1. Introduction

Soft magnetic materials (SMMs) are still of great interest in motor [1], power converter [2,3], switched-mode power supplies [4] and sensor applications [5]. Currently, amorphous and nanocrystalline Fe-, Co- and Ni-based alloys (or combination of ferromagnetic metals) can be used for this purpose [6,7,8,9]. There are two main approaches in developing and optimizing of novel SMMs. The first one is aimed at maximizing saturation induction (Bs), while the second one in minimizing coercivity (Hc) and core losses (Ps). The FeCo- and Co-based alloys are reported to have very high induction saturation, good thermal stability and improved mechanical properties. Unfortunately, Co is relatively expensive and is classified as a critical material [10]. It was also recently found that only alloys with low Co content can have good soft-magnetic properties such as low Hc and high effective permeability (µe) [11,12]. FeNi-based SMMs are a newer class of materials for perspective application at higher frequencies for motors and converters, in which the most important advantage is extremely low coercivity and core losses value, as it was shown in the previous studies [13,14]. In these studies, the structural and magnetic properties of the Cu-free (Fe100−xNix)80Nb4Si2B14 alloys were investigated. The magnetization measurements performed on heat-treated samples shown that Bs value is decreasing almost linearly from 1.6 T for Ni = 10 at.% to 0.75 T for Ni = 70 at.% content. The Curie temperature of as-cast ribbons is increasing from 320 °C for Ni = 10 at.% up to 400 °C for Ni = 30 at.% and then it is decreasing for higher Ni content alloys. The Curie point was found to be lower than the temperature of primary crystallization peak observed by calorimetry. However, K. Suzuki et al. in 2001 [15] showed that nanocrystallization of the Cu-free Fe-Nb-B alloys is most likely caused by a high homogenous nucleation rate in the supercooled liquid regime as well as a delayed growth rate induced by a large redistribution of Nb. Additionally, the most present study shows that for Cu-free alloys the lowest value of Hc exists before the nanocrystallization in the so called “stress relief” stage [16]. Therefore, the detailed studies of crystalline structure and magnetic properties evolution in the function of annealing temperature (Ta) for Cu-free FeNi-based alloys are of great importance.
In the present work, the complex structural and magnetic study of Fe72Ni8Nb4Si2B14 amorphous alloy are presented. Thermal stability, structure and nanostructure evolution of annealed samples are examined by the use of differential scanning calorimetry (DSC), X-ray diffraction (XRD) and transmission electron microscopy (TEM) observations. Magnetic parameters were obtained by measurements of B(H) hysteresis loops, Hc, Bs, core losses (Ps), complex permeability µ and Ps in the frequency range (50 Hz–400 kHz). Additionally, the controlled aging process at three different temperatures has been performed to verify the magnetic permeability and cut-off frequencies as a function of annealing time.

2. Materials and Methods

Precursors for amorphous Fe72Ni8Nb4Si2B14 alloy were prepared from pure chemical elements Fe (3N), Ni (3N), Si (4N) and the binary compounds FeB18 (2.5N), FeNb65 (2.5N) using an induction furnace in an argon atmosphere (heating at 1450 °C for 20 min, casting at 1250 °C). The amorphous alloy in the form of ribbons 28 µm thick and 6.5 mm wide by the melt spinning technique (at 30 m/s Cu wheel speed and casting temperature at 1250 °C). To achieve the optimal magnetic parameters (min. value of Hc and Ps at 50 Hz and B = 1T), the toroidal cores (inner and outer diameter of 20 and 30 mm, respectively) were isothermally annealed for 20 min in a vacuum furnace (5·10−4 mbar) at different temperatures (from 340 to 440 °C). Additionally, the effect of aging at three different temperatures: 310, 340 and 370 °C (far below the crystallization temperature) for up to 6200 min has been checked and the evolution of magnetic permeability and cut-off frequency have been monitored. The amorphousness of the as-spun and annealed ribbons were studied by X-ray diffraction (XRD) at room temperature using Rigaku MiniFlex 600 diffractometer (Rigaku, Tokyo, Japan) equipped with copper tube CuKα. The crystallization processes have been monitored by the differential scanning calorimetry (DSC) with a heating rate of 5 –30°C/min using thermal analyzer Netzsch 404C Pegasus (NETZSCH-Gerätebau GmbH, Selb, Germany). The transmission electron microscopy (TEM) images in the bright-field (BF) mode and selected area diffraction patterns (SADPs) were recorded using Tecnai G2 F20 (200kV) electron microscope (Thermo Fisher Scientific, Waltham, MA, USA). Thin foils for TEM observations were prepared with TenuPol-5 double jet electropolisher using an electrolyte of perchloric acid (80%) and methanol (20%) at temperature near −20 °C. The Remacomp C-1200 (MAGNET-PHYSIK Dr. Steingroever GmbH, Köln, Germany) magnetic measurement system was used to determine B(H) and Ps. The complex magnetic permeability in the frequency (f) range 104–108 Hz at room temperature of the toroidal cores was measured using impedance analyzer Agilent 4294A (Agilent, Santa Clara, CA, USA).

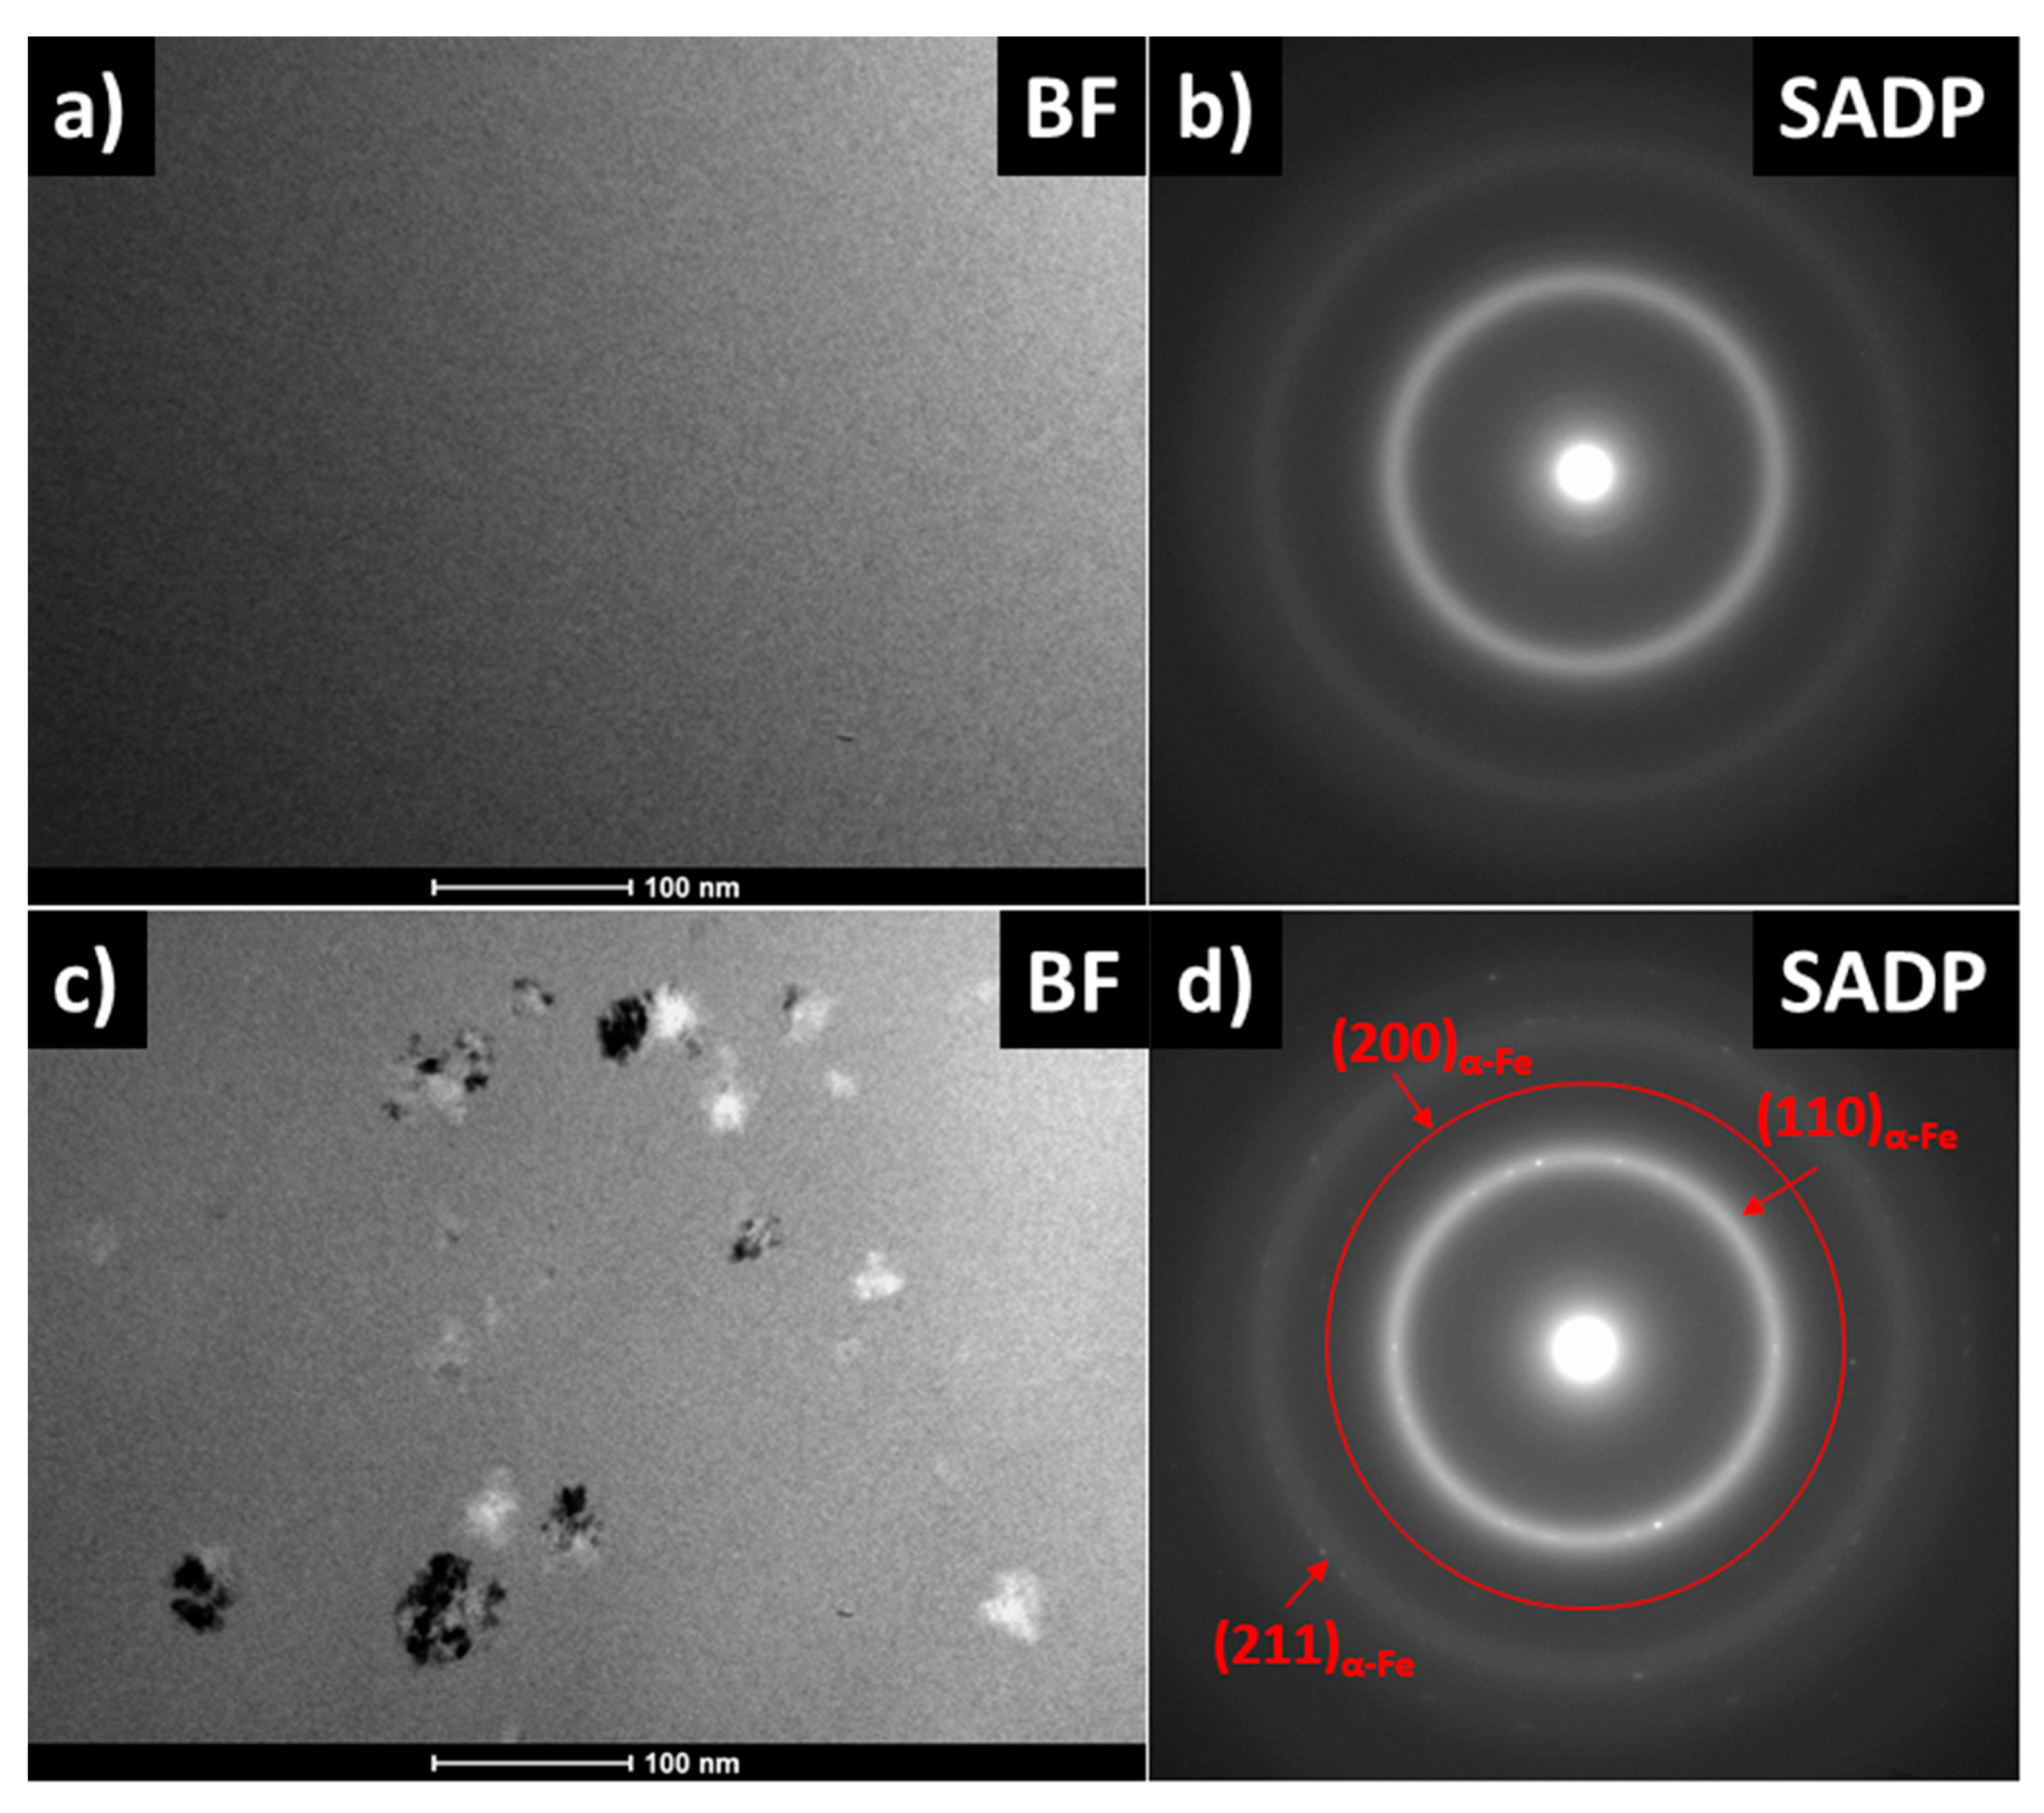
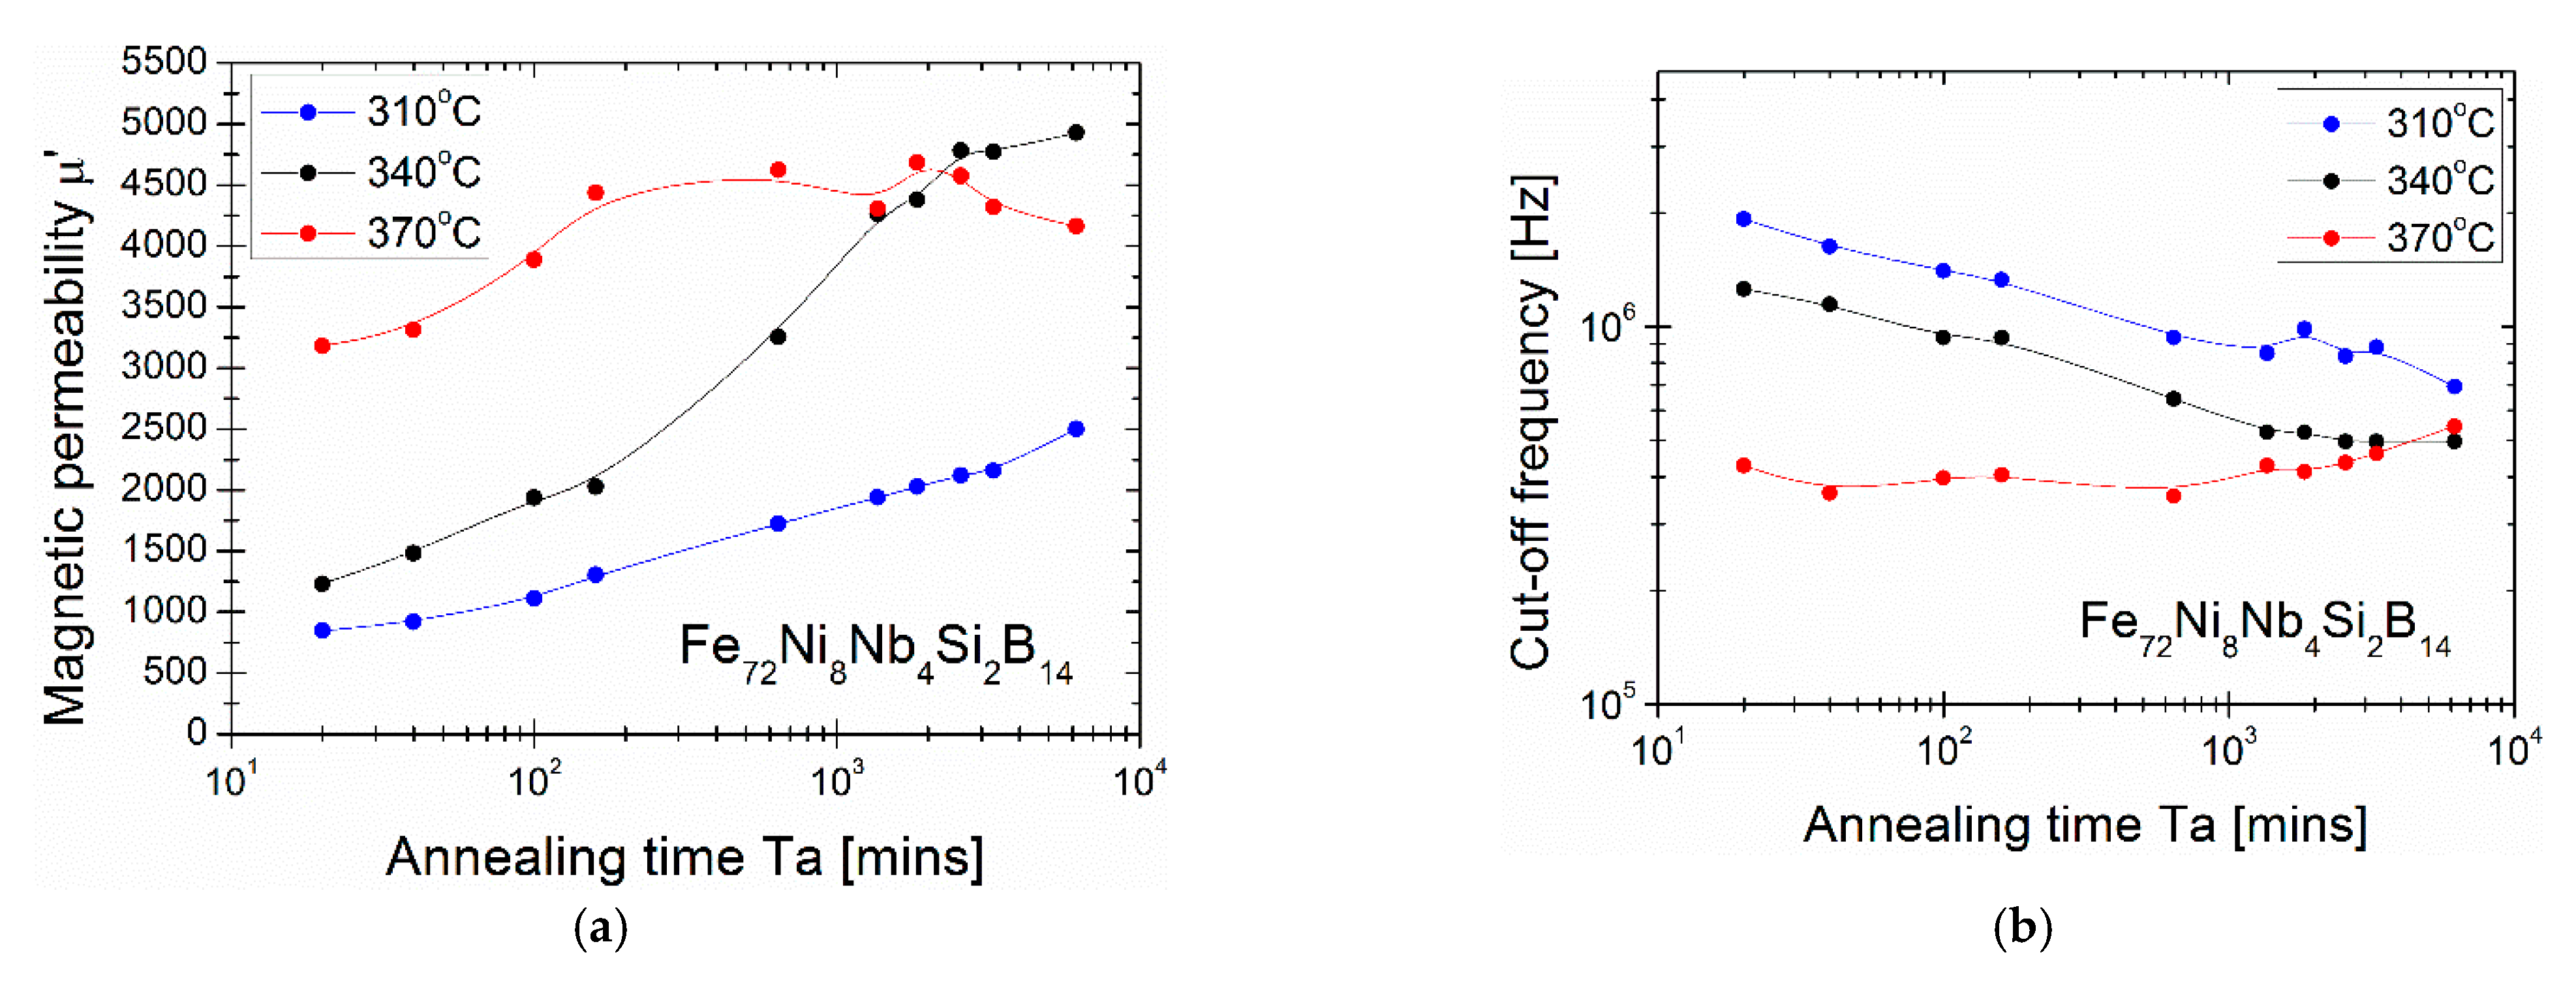
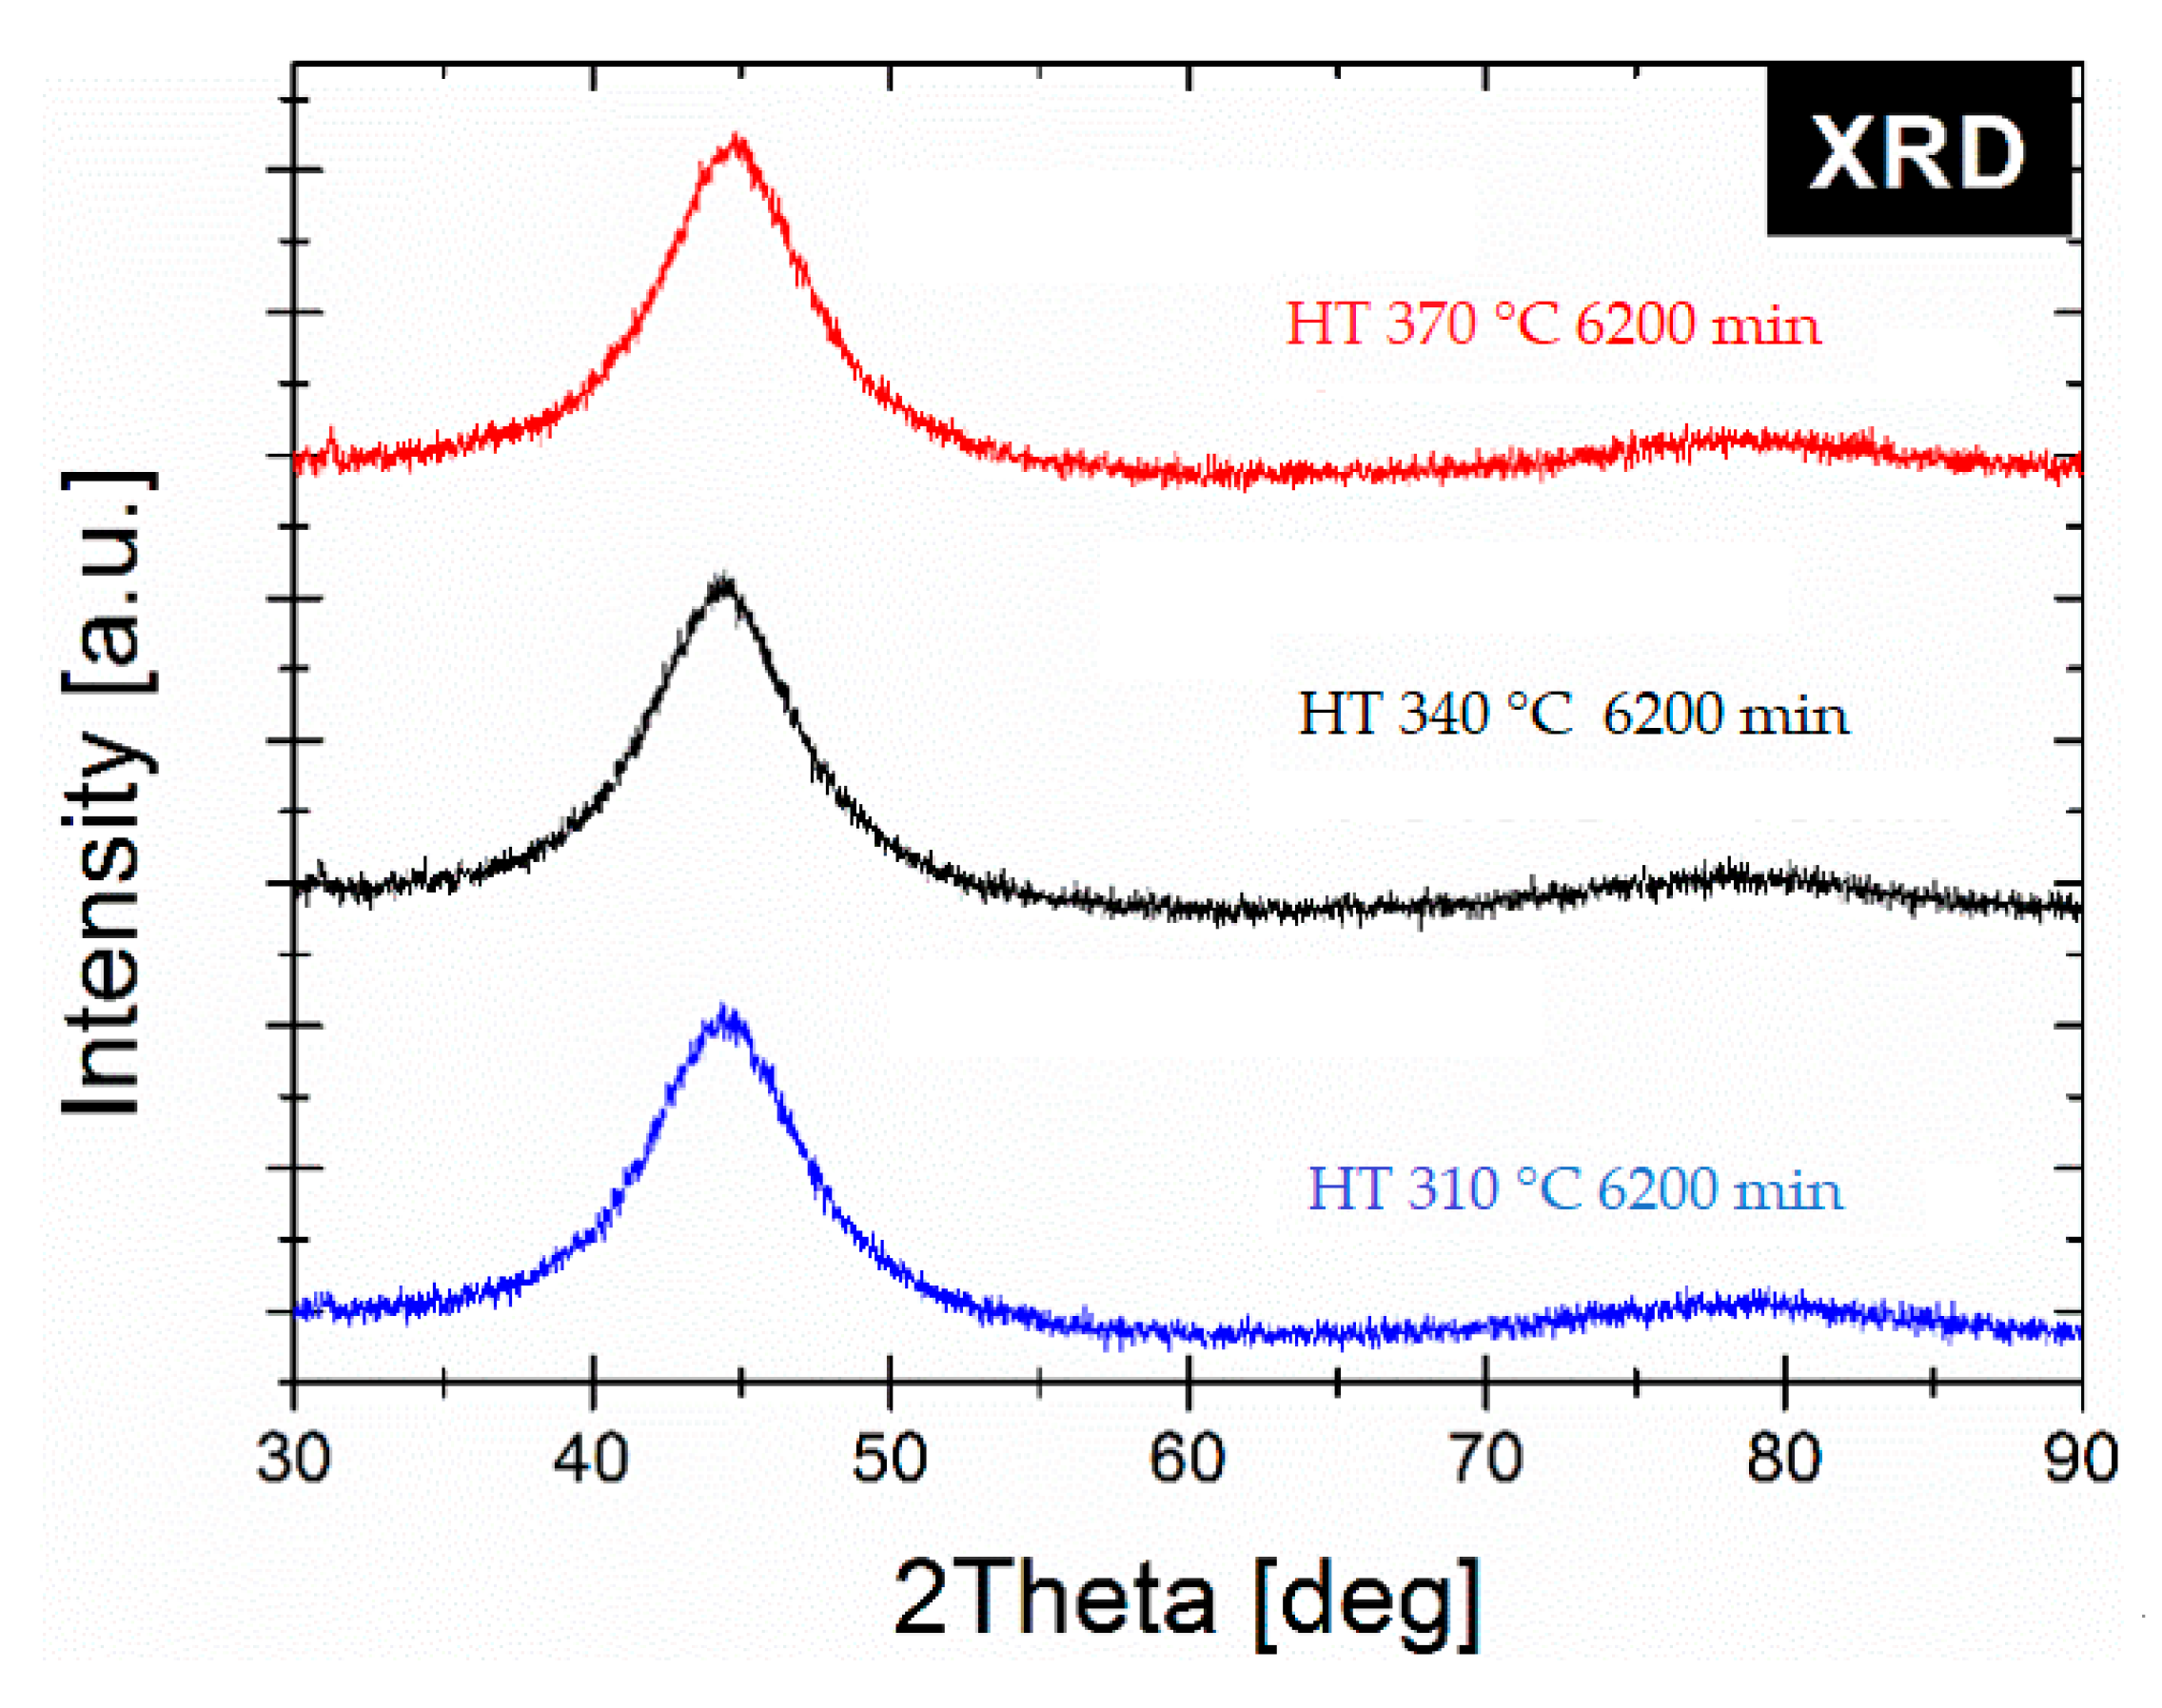
3. Result and Discussion

For melt-spun ribbon, the α-Fe type phase crystallization kinetics has been studied by use of the differential scanning calorimetry (DSC) by performing measurements with heating rates in the range from 5 to 30 °C/min. Obtained DSC curves have been plotted in Figure 1a. The onset temperature of crystallization peak varies from 479.7 °C for heating rate 5 °C/min up to 500.7 °C for heating rate 30 °C/min. For such non-isothermal crystallization processes, the Kissinger model [17] was used to determine the average activation energy. This method is based on the equation:
l n ( ϕ T p 2 ) = l n ( A 0 R E a ) E a ( R T p ) ,
where ϕ is a heating rate, T p —the temperature of the crystallization peak, E a —activation energy, R—gas constant and A 0 —pre-exponential factor. By linear fitting of ln ( ϕ T p 2 ) vs. 1 T p curve the average activation energy Ea of the process has been determined from the slope of this curve (Figure 1b). The obtained average activation energy Ea of crystallization of the α-Fe is equal to 430.2 ± 6.5 kJ/mol. Crystallization peaks were also fitted to the Avrami equation:
ln ( ln   [ 1   α ( t ) ] ) = ln ( k ) + n ln ( t )
where: α(t)—degree of crystallization, k—crystallization rate constant, n—Avrami constant, t—time. All the Avrami fits were conducted in the 30–70% range of the degree of crystallization and gathered in Figure 1b. From the Avrami fits, average n index describing the mechanism of crystallization was derived. It is equal to 2.5 ± 0.2. According to Malek [18], the kinetic exponent n = 2.5 describes the transformation as the diffusion controlled growth process with the constant nucleation rate.
In Figure 2, the dependences of the coercivity Hc on the annealing temperature Ta with the magnetic saturation Bs (Ta) Figure 2a and on the core losses Ps (Ta) Figure 2b are presented. Hc and Bs values were taken from the hysteresis loops measured up to magnetic saturation state. The Hc (Ta) curve shows the minimum value at Ta = 370 °C with Hc = 3.95 A/m and Bs = 1.09 T. Below this temperature Hc value is decreasing from 5 A/m at 340 °C, while above this temperature Hc value is increasing up to 125 A/m at 440 °C. The magnetic saturation is increasing with Ta from 1.05T at 340 °C up to 1.29 T at 440 °C. The Bs value at coercivity minimum equals 1.09 T. Obtained Bs is much lower than presented in [3] for Fe70Ni10Nb4Si2B14, but, as was mentioned in the introduction section, authors did not optimize the annealing temperature and didn’t measure Hc and Ps values. From an application point of view the knowledge of Hc and especially of Ps is of the greatest importance. It is clearly seen in Figure 2, that Ps (Ta) dependence shape strongly correlates with the Hc one. The minimum value Ps = 0.092 W/kg coexists with a minimum value of Hc at annealing temperature Ta = 370 °C. For sample annealed in Ps minimum (so-called optimal conditions) at 370 °C the complex magnetic permeability has been measured at room temperature (RT) in order to obtain the level of real µ’ and the frequency value of imaginary µ” maximum. Both components are gathered in Figure 3. The magnetic permeability µ’ reaches 3100 in low frequency limit (f = 104 Hz) and decreases for higher frequencies, while the maximum value of magnetic permeability loss µ” exists for f = 5·105 Hz. This value is crucial for application purposes and is defined as “cut-off” frequency, the usage frequency of this material [19,20]. The next application important value of soft magnetic materials are the AC core power losses Ps in the function of Bs for the low (50 Hz) to high (400 kHz) frequencies. This log–log dependence is shown in Figure 3. It can be seen that, for all the frequencies, the Ps value increases almost linearly with increasing magnetic field strength, mainly because more immense energy is required to increase induction near the saturation [4]. Obtained magnetic properties have been finally collected and compared with the other previously reported FeNi-based soft-magnetic alloys in Table 1. As shown, there are still some gaps in the data on the magnetic properties of classically annealed FeNi-based alloys. Moreover, when using a rapid annealing process, very attractive magnetic properties must be obtained.
As was shown by Yoshizawa [22], small additions of Cu and Nb facilitate the formation of an amorphous-crystalline nanocomposite microstructure upon annealing of initially amorphous precursor materials. For the Cu-free and Nb-containing alloy, as we study in this work—Fe72Ni8Nb4Si2B14—the Nb atoms play commonly a diffuse role towards the surrounding amorphous matrix and increase the thermal stability of the matrix. The XRD patterns of annealed samples gathered in Figure 4 prove that, for temperature annealing up to 400 °C for 20 min, the crystal structure remains amorphous and only first and second-order diffused amorphous halos exist on the patterns. For annealed sample at Ta = 420 °C, the three small diffraction peaks are visible and correspond to the α-Fe phase, while for Ta = 440 °C these peaks are of higher intensity. The TEM observations in BF mode (Figure 5a,c) and SADPs (Figure 5b,d) for samples annealed at 370 and 420 °C, respectively, proved the amorphous state of the annealed sample at 370 °C and presence of ~10–30 nm α-Fe nanocrystals in the second one. Based on the TEM observations, it can be seen that, for a sample with optimal magnetic properties (e.g., the lowest Ps), the crystal structure in the nano scale remains in the amorphous state.
Aging of metallic glasses is caused by the annealing process. Structural relaxation linked with quenched-in stress elimination is associated with the improvement of the magnetic properties of the soft magnetic amorphous ribbon. From the point of view of the crystal structure, aging in metastable quenched metallic glasses induces a lower enthalpy, a smaller volume, a more stable glassy state and changes the topological short-range order, which is characteristic for the glass structure [23,24,25,26,27,28] Some of the previous studies have shown that the relaxation process of FeNiSiB systems can be divided into two stages: the first—metalloid atoms movement, the second—diffusion of the constituent atoms [29]. From the magnetic point of view, the elimination of internal stresses can improve the mobility of the Bloch wall of the magnetic domain [30] and, as a consequence, the magnetic anisotropy fluctuates during the change of the topological short-range order caused by the aging/rejuvenation process [31]. As the relative permeability is inversely proportional to the anisotropy constant, the magnetic saturation increases with the local structure change and the decrease in anisotropy constant [32]. Thus, based on the above and on the fact that optimal annealing conditions (in the context of minimum Hc and Ps value) are treatment at 370 °C for 20 min and the material is still in the glassy state, further verification of the annealing process in the glassy state has been performed also at lower temperatures: 310, 340 and 370 °C, with different annealing times up to 6200 min. As has been shown in Figure 6 the µ’ value increases substantially from 3100 obtained for 20 min of annealing up to over 4500 for annealing time in the range 200–2000 min. Interestingly, for lower annealing temperature Ta = 340 °C µ’ consequently increases with annealing time and reaches 5000 for 6200 min. Process of glass relaxation is much weaker for Ta = 310 °C and for the annealing time up to 6200 min µ’ slightly increases. It has been noted that the relaxation process is still not complete. The cut-off frequency for Ta dependence indicates how the annealing process affects the µ” peak position that may be correlated with the reorganization of the magnetic domains during glass relaxation [30]. The downward trend in the cut-off frequency suggest that slow reorganization of the local structure occurs during aging process and some α-Fe clusters may form and grow. As was shown here, from the energy point of view, for lower temperature (340 °C) i.e., when less energy is delivered to the glass system, a slower relaxation process takes place and a higher permeability value in relaxed glass can be achieved. Considering the stability of cut-off frequency parameter, the most stable (invariant) annealing temperature is 370 °C and there are no significant changes in the annealing time up to 6200 min. This is crucial from the application point of view and needs to be investigated more closely soon. For all the samples after such aging process the XRD measurements proved the amorphous state of the samples (see Figure 7). As it was shown in some recent papers [33,34,35,36], the APT (Atom Probe Tomography) together with MOKE (Magneto-Optic Kerr Effect) and in situ AFM (Atomic Force Microscopy) observations should give us a more precise explanation of the glass relaxation process and early stage of the nucleation process in the studied system. The APT should give us the information on Fe, Ni as well as B, Si partitioning in the glassy state during long-term aging and moment of initial state of crystallization, while MOKE&AFM will allow to monitor the surface magnetic properties and morphology changes induced by relaxation process.

4. Conclusions

The structural and magnetic properties of the conventionally annealed Fe72Ni8Nb4Si2B14 alloy prepared by melt spinning have been investigated. The deep insight into the correlation between the magnetic properties Bs, Hc, Ps and Ta allowed to determine the optimal conditions. For the Ta = 370 °C, minimum value of Hc of 3.95 A/m, P10/50 of 0.092 W/kg, Bs = 1.09T, µ’ of 3100 and cut-off frequency of 5 × 10⁵ Hz have been obtained. That is over 100 °C below the crystallization onset temperature obtained from the DSC study. The Ps (B) dependence has been also shown and the optimal annealed material possess the linear Ps (B) dependence up to 400 kHz. The structural study has shown that, for such optimal conditions, material remains in the glassy state; the so-called relaxed glassy state. Deeper insight into the relaxation process occurring during the aging of this metallic glass shown that is possible to get higher µ’ values for longer annealing (over 100 h) time even at lower temperature Ta = 340 °C. However, the optimal Ta = 370 °C is the most stable from the point of view of the stability of cut-off frequency value.

Author Contributions

Conceptualization, L.H. and A.K.-B.; investigation, T.W., P.W., M.P., P.Z., W.M., A.W., M.S.-K. and L.H.; writing—original draft preparation, L.H. and P.W.; writing—review and editing, L.H. and P.W.; supervision, L.H. All authors have read and agreed to the published version of the manuscript.

Funding

This work was financed by the National Centre for Research and Development Grant TECHMATSTRATEG No. 1/347200/11/NCBR/2017.

Institutional Review Board Statement

Not applicable.

Informed Consent Statement

Not applicable.

Data Availability Statement

The data presented in this study are available on request from the corresponding authors.

Conflicts of Interest

The authors declare no conflict of interest. The funders had no role in the design of the study; in the collection, analyses, or interpretation of data; in the writing of the manuscript, or in the decision to publish the results.

References

  1. Simizu, S.; Ohodnicki, P.R.; McHenry, M.E. Metal amorphous nanocomposite soft magnetic material-enabled high power density, rare earth free rotational machines. IEEE Trans. Magn. 2018, 54, 1–5. [Google Scholar] [CrossRef]
  2. Leary, A.M.; Ohodnicki, P.R.; McHenry, M.E. Soft magnetic materials in high-frequency, high-power conversion applications. JOM 2012, 64, 772–781. [Google Scholar] [CrossRef]
  3. Mazaleyrat, F.; Varga, L.K. Ferromagnetic nanocomposites. J. Magn. Magn. Mater. 2000, 215, 253–259. [Google Scholar] [CrossRef]
  4. Willard, M.A. Nanocrystalline Soft Magnetic Alloys: Two Decades of Progress. Handb. Magn. Mater. 2013 21, 173–342.
  5. Kurlyandskaya, G.V.; Shcherbinin, S.V.; Volchkov, S.O.; Bhagat, S.M.; Calle, E.; Pérez, R.; Vazquez, M. Soft magnetic materials for sensor applications in the high frequency range. J. Magn. Magn. Mater. 2018, 459, 154–158. [Google Scholar] [CrossRef]
  6. Huang, D.; Li, Y.; Yang, Y.; Zhu, Z.; Zhang, W. Soft magnetic Co-based Co–Fe–B–Si–P bulk metallic glasses with high saturation magnetic flux density of over 1.2 T. J. Alloy. Compd. 2020, 843, 154862. [Google Scholar] [CrossRef]
  7. Warski, T.; Wlodarczyk, P.; Polak, M.; Zackiewicz, P.; Radon, A.; Wojcik, A.; Szlezynger, M.; Kolano-Burian, A.; Hawelek, L. Influence of Cu Content on Structure and Magnetic Properties in Fe86-xCuxB14 Alloys. Materials 2020, 13, 1451. [Google Scholar] [CrossRef] [Green Version]
  8. Zhukova, V.; Korchuganova, O.A.; Aleev, A.A.; Tcherdyntsev, V.V.; Churyukanova, M.; Medvedeva, E.V.; Seils, S.; Wagner, J.; Ipatov, M.; Blanco, J.M.; et al. Effect of annealing on magnetic properties and structure of Fe-Ni based magnetic microwires. J. Magn. Magn. Mater. 2017, 433, 278–284. [Google Scholar] [CrossRef]
  9. Sagasti, A.; Palomares, V.; Porro, J.M.; Orue, I.; Sanchez-Ilarduya, M.B.; Lopes, A.C.; Gutierrez, J. Magnetic, Magnetoelastic and Corrosion Resistant Properties of (Fe–Ni)-Based Metallic Glasses for Structural Health Monitoring Applications. Materials 2020, 13, 57. [Google Scholar] [CrossRef] [Green Version]
  10. Jin, Y.; Kim, J.; Guillaume, B. Review of critical material studies. Resour. Conserv. Recycl. 2016, 113, 77–87. [Google Scholar] [CrossRef]
  11. Shen, B.; Inoue, A.; Chang, C. Superhigh strength and good soft-magnetic properties of (Fe, Co)–B–Si–Nb bulk glassy alloys with high glass-forming ability. Appl. Phys. Lett. 2004, 85, 4911–4913. [Google Scholar] [CrossRef]
  12. Amiya, K.; Urata, A.; Nishiyama, N.; Inoue, A. Thermal stability and magnetic properties of (Fe, Co)–Ga–(P, C, B, Si) bulk glassy alloys. Mater. Sci. Eng. A 2007, 449, 356–359. [Google Scholar] [CrossRef]
  13. Aronhime, N.; Zoghlin, E.; Keylin, V.; Jin, X.; Ohodnicki, P.; McHenry, M.E. Magnetic properties and crystallization kinetics of (Fe100− xNix) 80Nb4Si2B14 metal amorphous nanocomposites. Scr. Mater. 2018, 142, 133–137. [Google Scholar] [CrossRef]
  14. Aronhime, N.; DeGeorge, V.; Keylin, V.; Ohodnicki, P.; McHenry, M.E. The effects of strain-annealing on tuning permeability and lowering losses in Fe-Ni-based metal amorphous nanocomposites. JOM 2017, 69, 2164–2170. [Google Scholar] [CrossRef]
  15. Suzuki, K.; Cadogan, J.M.; Aoki, K.; Tsai, A.P.; Inoue, A.; Masumoto, T. Nanocrystallization and glass transition in Cu-Free Fe-Nb-B soft magnetic alloys. Scr. Mater. 2001, 44, 1417–1420. [Google Scholar] [CrossRef]
  16. Liu, T.; Wang, A.; Zhao, C.; Yue, S.; Wang, X.; Liu, C.T. Compositional design and crystallization mechanism of High Bs nanocrystalline alloys. Mater. Res. Bull. 2019, 112, 323–330. [Google Scholar] [CrossRef]
  17. Kissinger, H.E. Reaction kinetics in differential thermal analysis. Anal. Chem. 1957, 29, 1702–1706. [Google Scholar] [CrossRef]
  18. Málek, J. The applicability of Johnson-Mehl-Avrami model in the thermal analysis of the crystallization kinetics of glasses. Thermochim. Acta 1995, 267, 61–73. [Google Scholar] [CrossRef]
  19. Snoek, J.L. Gyromagnetic resonance in ferrites. Nature 1947, 160, 90. [Google Scholar] [CrossRef] [PubMed]
  20. Rozanov, K.N.; Koledintseva, M.Y. Application of generalized Snoek’s law over a finite frequency range: A case study. J. Appl. Phys. 2016, 119, 073901. [Google Scholar] [CrossRef]
  21. Li, Z.; Parsons, R.; Zang, B.; Kishimoto, H.; Shoji, T.; Kato, A.; Suzuki, K. Dramatic grain refinement and magnetic softening induced by Ni addition in FeB based nanocrystalline soft magnetic alloys. Scr. Mater. 2020, 181, 82–85. [Google Scholar] [CrossRef]
  22. Yoshizawa, Y.A.; Oguma, S.; Yamauchi, K. New Fe-based soft magnetic alloys composed of ultrafine grain structure. J. Appl. Phys. 1988, 64, 6044–6046. [Google Scholar] [CrossRef]
  23. Komatsu, T.; Matusita, K.; Yokota, R. Volume changes during the structural relaxation and crystallization in FeNi based metallic glasses. J. Non-Cryst. Sol. 1985, 69, 347–359. [Google Scholar] [CrossRef]
  24. Miyazaki, N.; Wakeda, M.; Wang, Y.J.; Ogata, S. Prediction of pressure-promoted thermal rejuvenation in metallic glasses. NPJ Comput. Mater. 2016, 2, 1–9. [Google Scholar] [CrossRef]
  25. Nagel, C.; Rätzke, K.; Schmidtke, E.; Faupel, F.; Ulfert, W. Positron-annihilation studies of free-volume changes in the bulk metallic glass Zr65Al7.5Ni10Cu17.5 during structural relaxation and at the glass transition. Phys. Rev. B 1999, 60, 9212. [Google Scholar] [CrossRef]
  26. Imran, M.M.; Bhandari, D.; Saxena, N.S. Enthalpy recovery during structural relaxation of Se96In4 chalcogenide glass. Phys B Condens. Matter 2001, 293, 394–401. [Google Scholar] [CrossRef]
  27. Slipenyuk, A.; Eckert, J. Correlation between enthalpy change and free volume reduction during structural relaxation of Zr55Cu30Al10Ni5 metallic glass. Scr. Mater. 2004, 50, 39–44. [Google Scholar] [CrossRef]
  28. Waseda, Y.; Masumoto, T. Structure of amorphous Fe80-P13-C7 alloy by X-ray diffraction. Z. Für. Phys. B Condens. Matter 1975, 22, 121–126. [Google Scholar] [CrossRef]
  29. Miyazaki, T.; Hisatake, K.; Takahashi, M. Magnetic Relaxation in Amorphous (Fe1-xNix)77Si10B13 Alloys. Jpn. J. Appl. Phys. 1983, 22, 1277–1282. [Google Scholar] [CrossRef]
  30. Escobar, M.A.; Yavari, A.R.; Barrue, R.; Perron, J.C. On the optimization of soft-magnetic properties of metallic glasses by dynamic current annealing. IEEE Trans. Magn. 1992, 28, 1911–1916. [Google Scholar] [CrossRef]
  31. Ri, M.C.; Sohrabi, S.; Ding, D.W.; Dong, B.S.; Zhou, S.X.; Wang, W.H. Serrated magnetic properties in metallic glass by thermal cycle. Chin. Phys. B 2017, 26, 066101. [Google Scholar] [CrossRef]
  32. McHenry, M.E.; Laughlin, D.E. Physical Metallurgy; Elsevier: Amsterdam, The Netherlands, 2014; pp. 1881–2008. [Google Scholar]
  33. Hono, K.; Ping, D.H.; Ohnuma, M.; Onodera, H. Cu clustering and Si partitioning in the early crystallization stage of an Fe73.5Si13.5B9Nb3Cu1 amorphous alloy. Acta Mater. 1999, 47, 997–1006. [Google Scholar] [CrossRef]
  34. Pradeep, K.G.; Herzer, G.; Choi, P.; Raabe, D. Atom probe tomography study of ultrahigh nanocrystallization rates in FeSiNbBCu soft magnetic amorphous alloys on rapid annealing. Acta Mater. 2014, 68, 295–309. [Google Scholar] [CrossRef]
  35. Shah, M.; Satalkar, M.; Kane, S.N.; Ghodke, N.L.; Sinha, A.K.; Varga, L.K.; Araujo, J.P. Thermal treatment induced modification of structural, surface and bulk magnetic properties of Fe61. 5Co5Ni8Si13. 5B9Nb3 metallic glass. AIP Conf. Proc. 2018, 1953, 120043. [Google Scholar]
  36. McCord, J. Progress in magnetic domain observation by advanced magneto-optical microscopy. J. Phys. D Appl. Phys. 2015, 48, 333001. [Google Scholar] [CrossRef]
Figure 1. DSC signals (a), activation energy Ea of α-Fe phase crystallization and the Avrami exponent n (b) estimated for as-spun metallic glass (colors defines heating rates as shown in Figure 1a).
Materials 14 00005 g001
Figure 2. Hc and Bs from Ta(20mins) (a) and Ps from Ta (b) dependences. The lines are only guide for eyes and not a fit.
Materials 14 00005 g002
Figure 3. Magnetic permeability µ’ (a) and magnetic permeability loss µ” (b) dependence in the function of frequency 104–108 Hz for sample annealed at 370 °C.
Materials 14 00005 g003
Figure 4. XRD patterns for annealed samples.
Materials 14 00005 g004
Figure 5. TEM images for annealed samples: (a) BF at 370 °C (b) SADP at 370 °C (c) BF at 420 °C (d) Scheme 420 °C.
Materials 14 00005 g005
Figure 6. Magnetic permeability (a) and cut-off frequency (b) dependencies on annealing time performed at 310 °C, 340 °C and 370 °C. The lines are only guide for eyes and not a fit.
Materials 14 00005 g006
Figure 7. XRD patterns for relaxed glasses after 6200 min.
Materials 14 00005 g007
Table 1. Comparison the magnetic properties of various FeNi-based alloys with obtained results.
AlloyTa [°C]/timePs [W/kg]Bs
[T]
Hc [A/m]µ’fcut-off [kHz]Ref
Fe72Ni8Nb4Si2B14370/20 minP10/50 = 0.0921.093.953100507This work
Fe72Ni8Nb4Si2B14440/20 minP10/50 = 2.61.29125--This work
Fe70Ni10Nb4Si2B14as-cast-~1.62---[13]
Fe60Ni20Nb4Si2B14as-cast-~1.44---[13]
Fe56Ni24Nb4Si2B14440/60 minP1060 = 0.12~1.174000-[14]
Fe56Ni24Nb4Si2B14440/60 min
200 MPa
-1.3-16,000-[14]
Fe77.4Ni8.6B14RA* 490/0.5s-1.72.6--[21]
Fe68.8Ni17.2B14RA* 510/0.5s-1.544.4--[21]
Fe60.2Ni25.8B14RA* 510/0.5s-1.373.2--[21]
* RA—Rapid Annealing with heating rate of 104 K/s.
Publisher’s Note: MDPI stays neutral with regard to jurisdictional claims in published maps and institutional affiliations.

