
Hardness–Deformation Energy Relationship in Metals and Alloys: A Comparative Evaluation Based on Nanoindentation Testing and Thermodynamic Consideration


Abstract
:1. Introduction
2. Experimental Methods
2.1. Test Materials
2.2. Nanoindentation Tests
3. Results
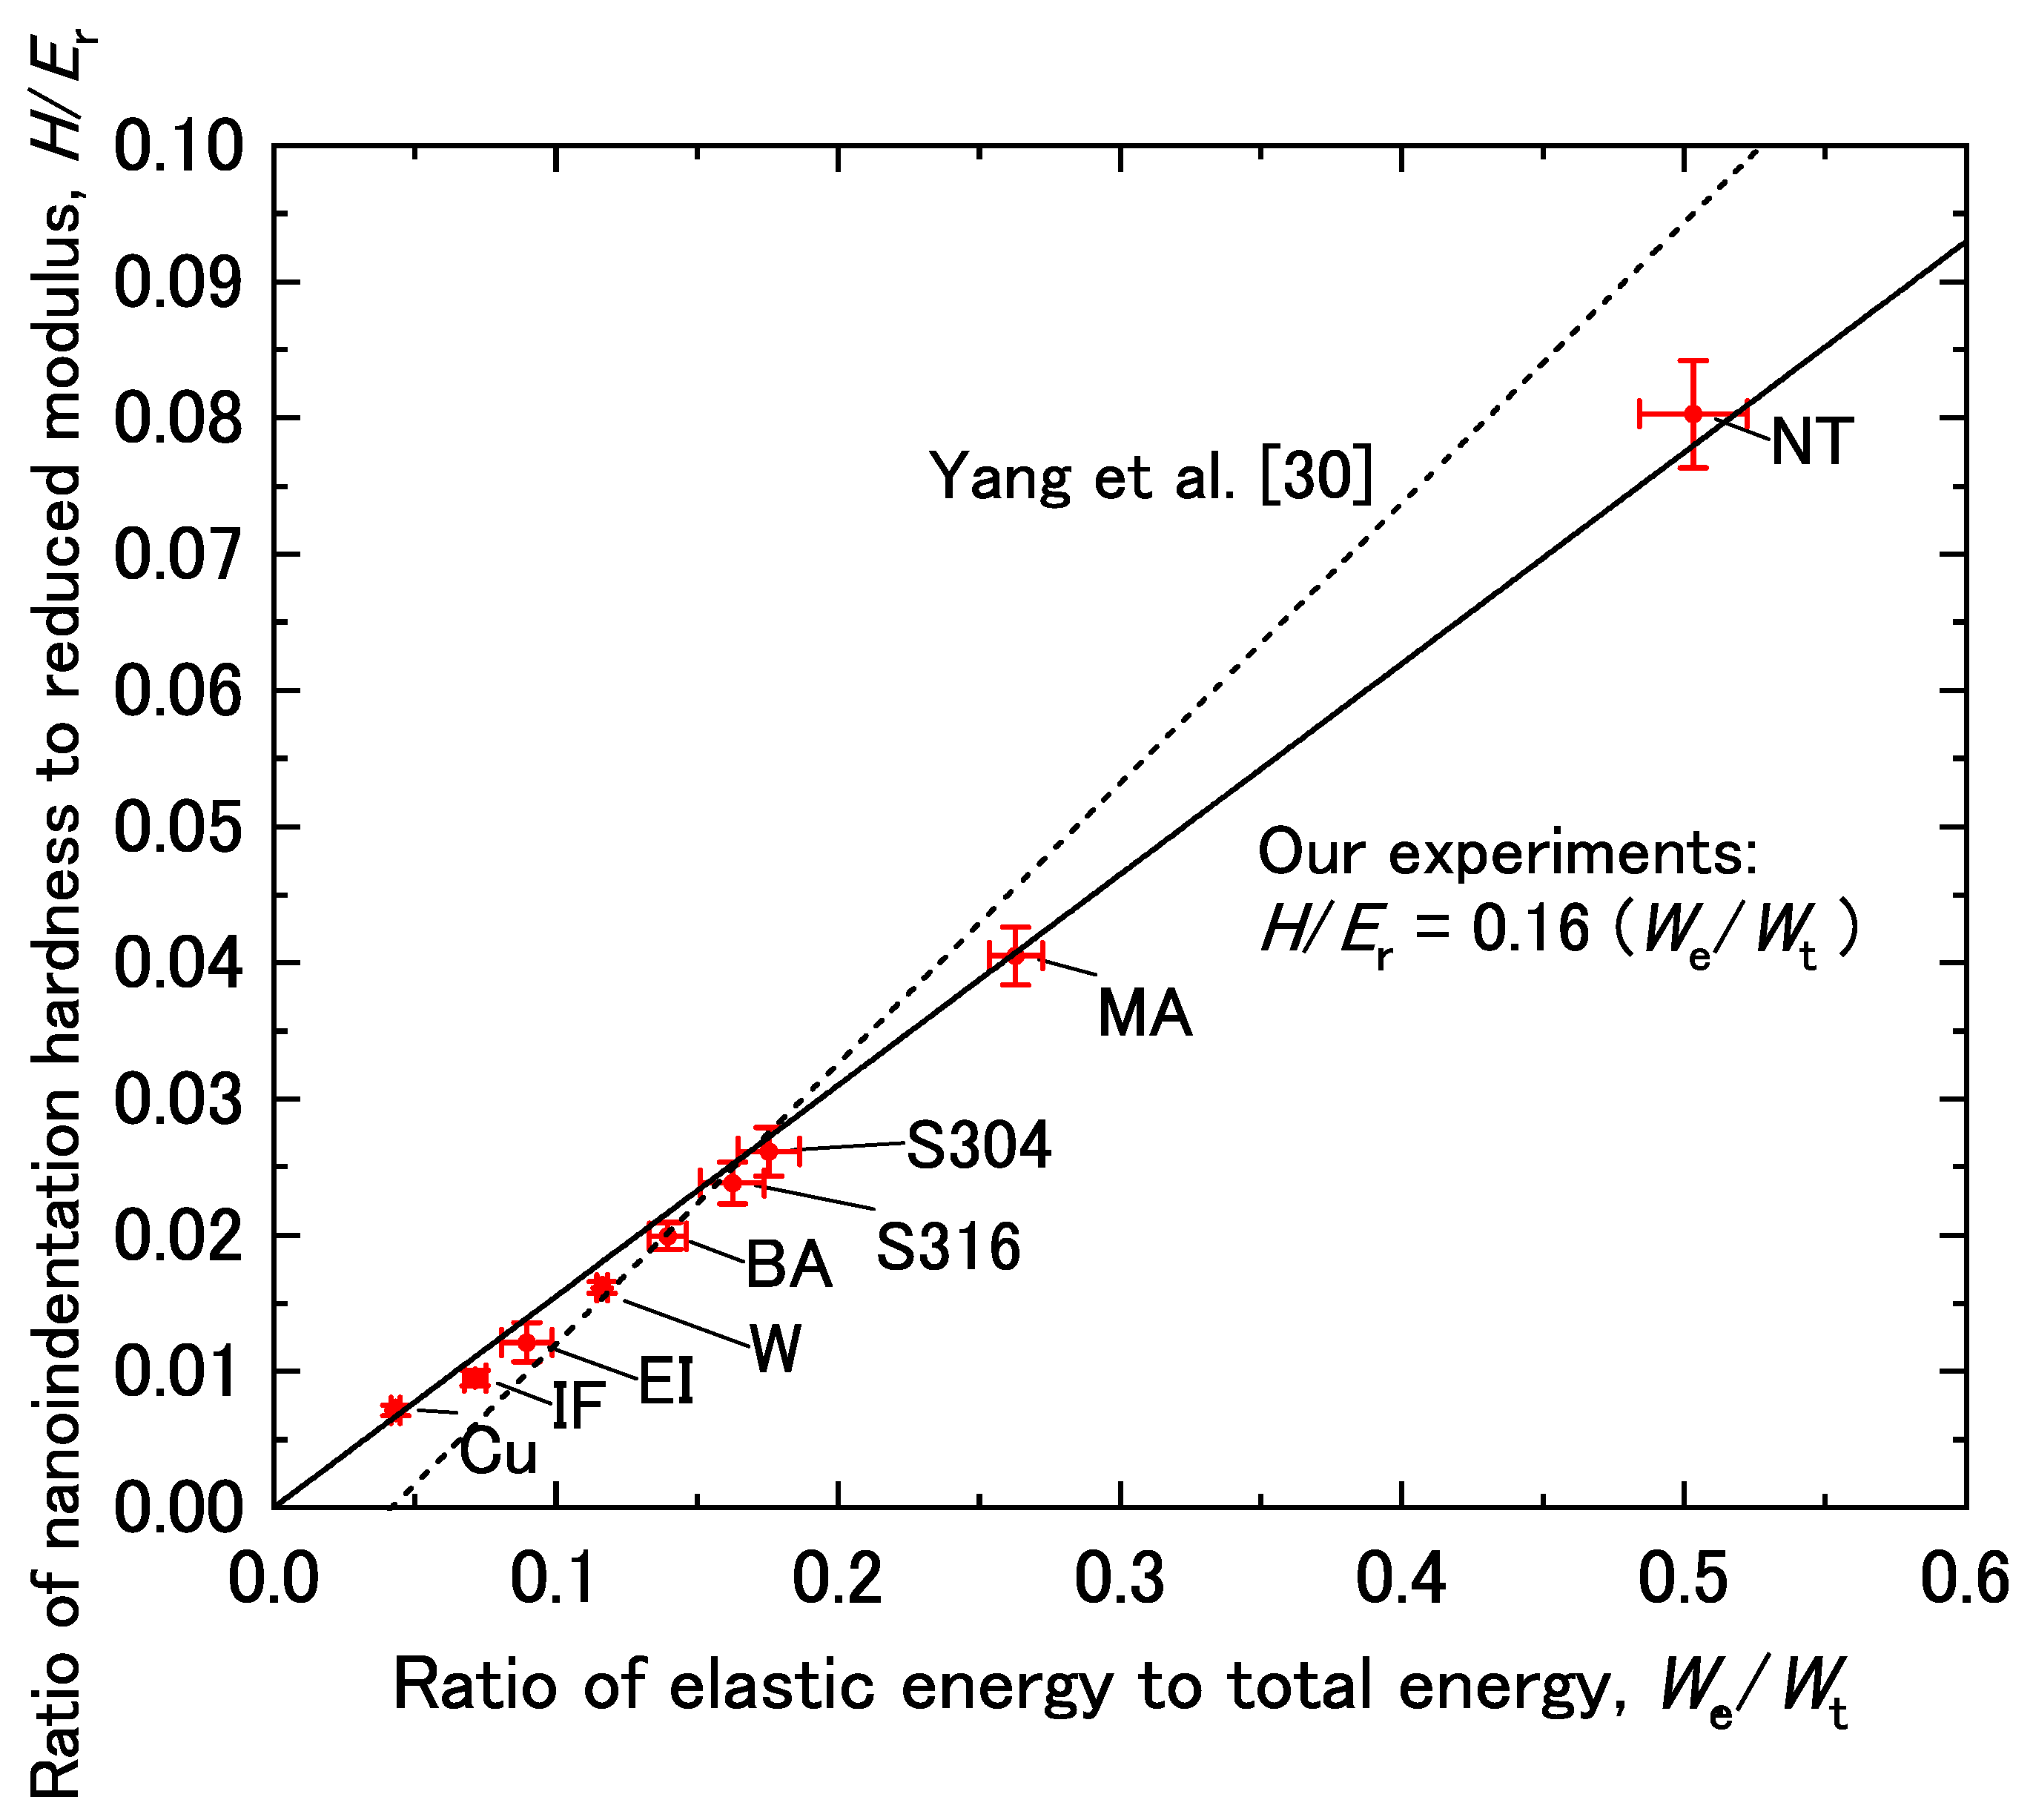
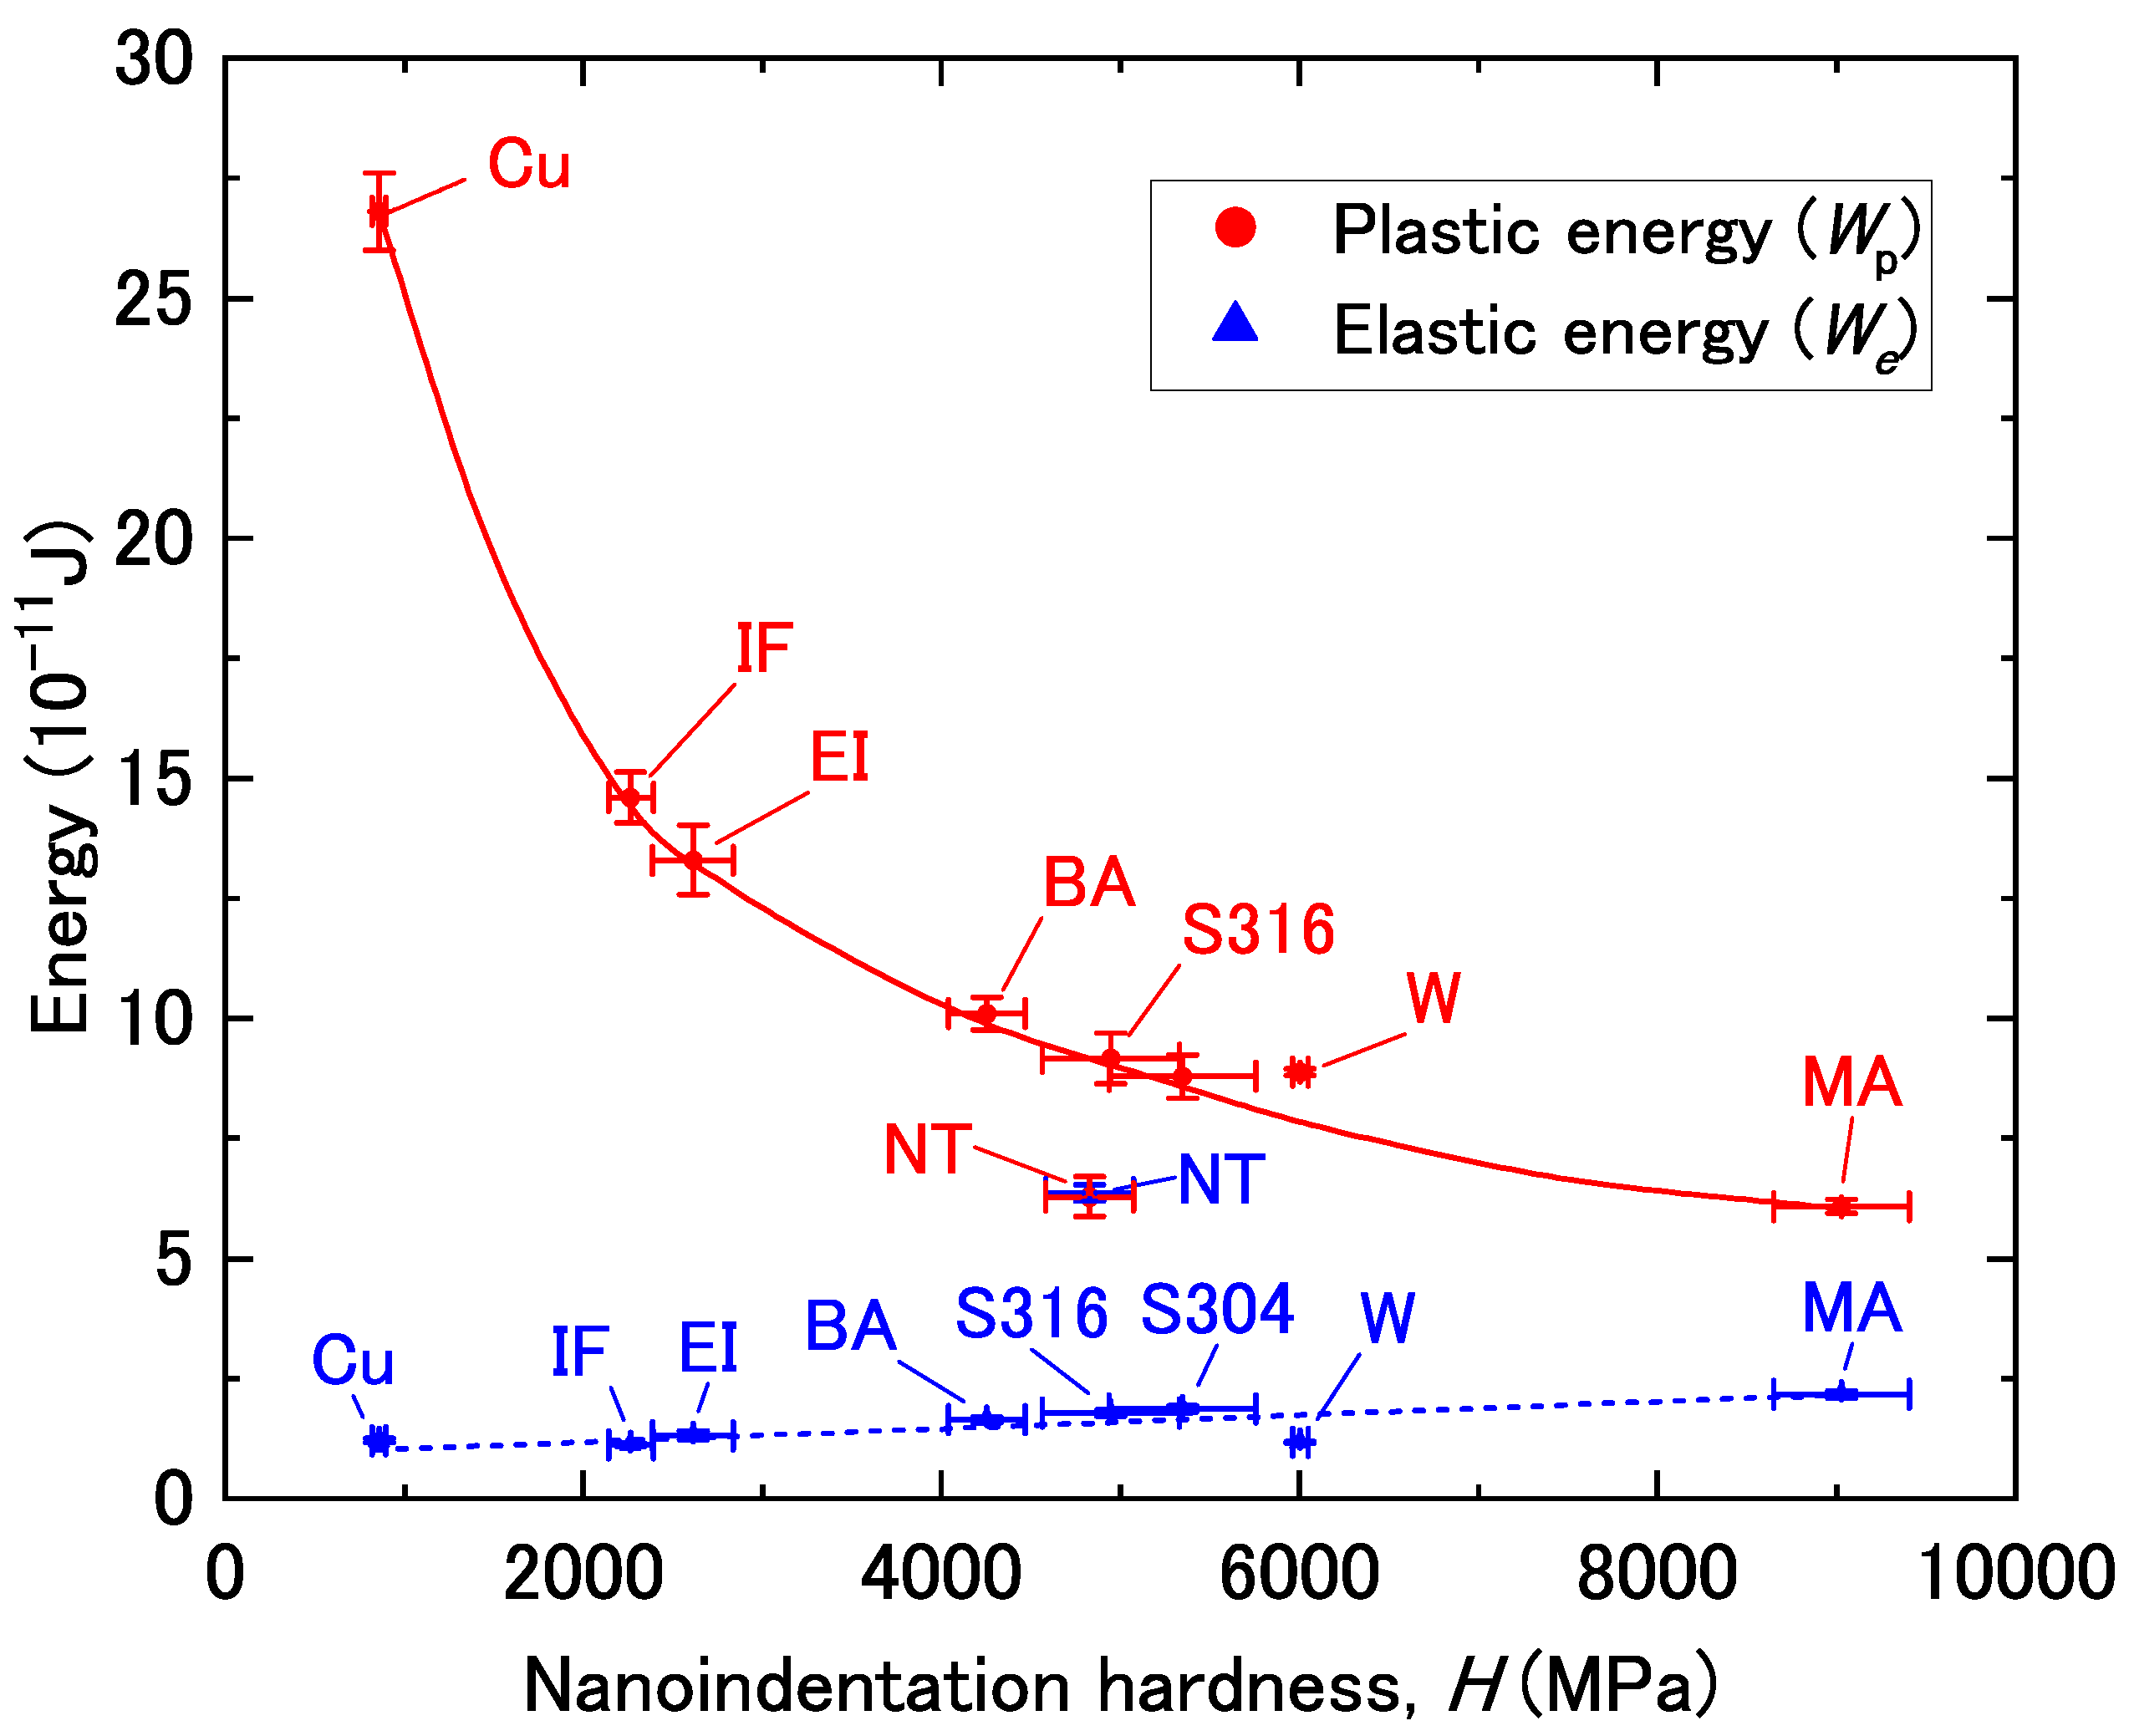
4. Discussion
5. Conclusions
- (1)
- We/Wt and Wp/Wt are linearly correlated with H/Er with positive and negative relationships, respectively.
- (2)
- For all the materials used in this study except NiTi alloy, We (Wp) increased (decreased) with increasing H.
- (3)
- A good correlation between Wp/We and H/Er was found for all materials used in this study, where Wp/We and H/Er are nondimensional values. This emphasizes the physical meaning of hardness obtained by nanoindentation. That is, when Er is identical, harder materials show smaller values of Wp/We than those of softer ones during nanoindentation testing under the same applied load.
- (4)
- Thermodynamic analyses showed that the indentation mark will be visible after nanoindentation testing when Wp/We ≥ 1, which suggests that the condition H/Er ≤ 0.08 should be true for any material.
Author Contributions
Funding
Acknowledgments
Conflicts of Interest
References
- Hu, X.; Sun, X.; Raghavan, K.; Comstock, R.J.; Ren, Y. Linking constituent phase properties to ductility and edge stretchability of two DP 980 steels. Mater. Sci. Eng. A 2020, 780, 139176. [Google Scholar] [CrossRef]
- Taylor, M.D.; Choi, K.S.; Sun, X.; Matlock, D.K.; Packard, C.E.; Xu, L.; Barlat, F. Correlations between nanoindentation hardness and macroscopic mechanical properties in DP980 steels. Mater. Sci. Eng. A 2014, 597, 431–439. [Google Scholar] [CrossRef]
- Mugita, Y.; Aramaki, M.; Yamamoto, M.; Takeuchi, A.; Takeuchi, M.; Yokota, T.; Funakawa, Y.; Furukimi, O. Void nucleation, and growth during tensile deformation of nanoscale precipitated steel and bainitic steel. ISIJ Int. 2019, 59, 1362–1368. [Google Scholar] [CrossRef] [Green Version]
- Kato, M. Introduction to the Theory of Dislocations [in Japanese], 5th ed.; Shokabo: Tokyo, Japan, 2005. [Google Scholar]
- Kato, M. Selected topics in strength of materials II. Mater. Jpn. 2008, 47, 317–322. [Google Scholar] [CrossRef]
- Furukimi, O.; Niigaki, S.; Yamada, N.; Aramaki, M.; Oue, S.; Funakawa, Y. Local deformation energy and void formation behavior in 16%Cr ferritic steel. Tetsu-to-Hagané 2013, 99, 60–69. [Google Scholar] [CrossRef] [Green Version]
- Yamamoto, M.; Ochi, R.; Yasuda, K.; Aramaki, M.; Munetoh, S.; Furukimi, O. Effect of γ-phase stability on local deformation energy of α-γ duplex stainless steel. Mater. Trans. 2017, 58, 1379–1385. [Google Scholar] [CrossRef]
- Paul, V.; Wakeda, M.; Ameyama, K.; Ota-Kawabata, M.; Ohmura, T. Local deformation behavior of the copper harmonic structure near grain boundaries investigated through nanoindentation. Materials 2021, 14, 5663. [Google Scholar] [CrossRef]
- Ohmura, T.; Wakeda, M. Pop-In phenomenon as a fundamental plasticity probed by nanoindentation technique. Materials 2021, 14, 1879. [Google Scholar] [CrossRef]
- Liu, Z.; Zhang, J.; He, B.; Zou, Y. High-speed nanoindentation mapping of a near-alpha titanium alloy made by additive manufacturing. J. Mater. Res. 2021, 36, 2223–2234. [Google Scholar] [CrossRef]
- Endoh, K.; Ii, S.; Kimura, Y.; Sasaki, T.; Goto, S.; Yokota, T.; Ohmura, T. Effects of grain boundary geometry and boron addition on the local mechanical behavior of interstitial-free (IF) steels. Mater. Trans. 2021, 62, 1479–1488. [Google Scholar] [CrossRef]
- Meng, F.H.; Miyamoto, G.; Furuhara, T. Effects of alloying blements on microstructure, hardness and growth rate of compound layer in gaseous-nitrided ferritic alloys. Mater. Trans. 2021, 62, 596–602. [Google Scholar] [CrossRef]
- Xiang, S.H.; Yang, X.F.; Liang, Y.X.; Wang, L. Texture evolution and nanohardness in Cu-Nb composite wires. Materials 2021, 14, 5294. [Google Scholar] [CrossRef]
- Man, T.H.; Ohmura, T.; Tomota, Y. The effect of boundary or interface on stress-induced martensitic transformation in a Fe-Ni alloy. Mater. Today Commun. 2020, 23, 100896. [Google Scholar] [CrossRef]
- Zhu, Z.B.; Huang, H.F.; Liu, J.Z.; Ye, L.F.; Zhu, Z.Y. Nanoindentation Study on the Creep Characteristics and Hardness of Ion-Irradiated Alloys. Materials 2020, 13, 3132. [Google Scholar] [CrossRef]
- Pöhl, F.; Hardes, C.; Scholz, F.; Frenzel, J. Orientation-dependent deformation behavior of 316L steel manufactured by laser metal deposition and casting under local scratch and indentation load. Materials 2020, 13, 1765. [Google Scholar] [CrossRef]
- Wang, S.B.; Zhao, H.W. Low temperature nanoindentation: Development and applications. Micromachines 2020, 11, 407. [Google Scholar] [CrossRef]
- Tanaka, M.; Morikawa, T.; Yoshioka, S.; Takashima, K.; Kaneko, S. Inhomogeneity of Plastic Deformation after Yielding in Low-carbon Martensitic Steels. ISIJ Int. 2022, 62. in press. [Google Scholar] [CrossRef]
- Zhang, L.; Liang, M.; Feng, Z.; Zhang, L.; Cao, W.; Wu, G. Nanoindentation characterization of strengthening mechanism in a high strength ferrite/martensite steel. Mater. Sci. Eng. A 2019, 745, 144–148. [Google Scholar] [CrossRef]
- Xio, X.; Terentyev, D.; Ruiz, A.; Zinovev, A.; Bakav, A.; Zhurkin, E.E. High temperature nano-indentation of tungsten: Modelling and experimental validation. Mater. Sci. Eng. A 2019, 743, 106–113. [Google Scholar] [CrossRef]
- Sun, W.; Jiang, Y.; Sun, G.; Hu, J.; Zhou, T.; Jiang, Z.; Lian, J. Nanoindentation creep behavior and its relation to activation volume and strain rate sensitivity of nanocrystalline Cu. Mater. Sci. Eng. A 2019, 751, 35–41. [Google Scholar] [CrossRef]
- Laursen, C.M.; Peter, N.J.; Gerstein, G.; Maier, H.J.; Dehm, G.; Frick, C.P. Influence of Ti3Ni4 precipitates on the indentation-induced two-way shape-memory effect in Nickel-Titanium. Mater. Sci. Eng. A 2020, 792, 139373. [Google Scholar] [CrossRef]
- Oliver, W.C.; Pharr, G.M. An improved technique for determining hardness and elastic modulus during load and displacement sensing indentation experiments. J. Mater. Res. 1992, 7, 1564–1583. [Google Scholar] [CrossRef]
- Oliver, W.C.; Pharr, G.M. Measurement of hardness and elastic modulus by instrumented indentation: Advances in understanding and refinements to methodology. J. Mater. Res. 2004, 19, 3–20. [Google Scholar] [CrossRef]
- Sekido, K.; Ohmura, T.; Zhang, L.; Hara, T.; Tsuzaki, K. The effect of interstitial carbon on the initiation of plastic deformation of steels. Mater. Sci. Eng. A 2011, 530, 396–401. [Google Scholar] [CrossRef]
- Gouldstone, A.; Koh, H.-J.; Zeng, K.-Y.; Giannakopoulos, A.; Suresh, S. Discrete and continuous deformation during nanoindentation of thin films. Acta Mater. 2020, 48, 2277–2295. [Google Scholar] [CrossRef]
- ISO14577-1. Plastic and Elastic Parts of the Indentation Work; A.8; ISO: London, UK, 2015; pp. 22–23. [Google Scholar]
- Okoro, A.M.; Machaka, R.; Lephuthing, S.S.; Oke, S.R.; Awotunde, M.A.; Olubambi, P.A. Nanoindentation studies of the mechanical behaviours of spark plasma sintered multiwall carbon nanotubes reinforced Ti6Al4V nanocomposites. Mater. Sci. Eng. A 2019, 765, 138320. [Google Scholar] [CrossRef]
- Cheng, Y.-T.; Cheng, C.-M. Relationships between hardness, elastic modulus, and the work of indentation. Appl. Phys. Lett. 1998, 73, 614–616. [Google Scholar] [CrossRef]
- Yang, R.; Zhang, T.; Jiang, P.; Bai, Y. Experimental verification and theoretical analysis of the relationships between hardness, elastic modulus, and the work of indentation. Appl. Phys. Lett. 2008, 92, 231906. [Google Scholar] [CrossRef]
- ISO14577-1. Indentation Hardness; A.4; ISO: London, UK, 2015; p. 15. [Google Scholar]
- Mita, T.; Kawashima, K.; Misumi, M.; Ohkubo, M. Poisson’s ratio and Young’s modulus of TiNi shape memory alloy measured by electromagnetic acoustic transducer. Trans. Jpn. Soc. Mech. Eng. A 2010, 76, 290–295. [Google Scholar] [CrossRef] [Green Version]
- The Materials Science Society of Japan. Strength Test Handbook for Metallic Materials; Yokendo: Tokyo, Japan, 1977. [Google Scholar]
- Leyland, A.; Matthews, A. On the significance of the H/E ratio in wear control: A nanocomposite coating approach to optimized tribological behaviour. Wear 2000, 246, 1–11. [Google Scholar] [CrossRef]


| Specimen | C | Si | Mn | Ni | Cr | Mo | Ti | Fe |
|---|---|---|---|---|---|---|---|---|
| Martensitic steel | 0.86 | 0.16 | 0.25 | 0.01 | 0.04 | - | - | bal. |
| Bainitic steel | 0.09 | 0.7 | 1.5 | - | - | - | 0.12 | bal. |
| Interstitial-free steel | 0.002 | 0.002 | 0.14 | - | - | - | 0.046 | bal. |
| Stainless steel (SUS304) | 0.06 | 0.64 | 1.08 | 9.52 | 18.50 | - | - | bal. |
| Stainless steel (SUS316) | 0.06 | 0.56 | 1.36 | 12.34 | 17.57 | 2.4 | - | bal. |
| NiTi alloy | - | - | - | 55 | - | - | 45 | - |
| Specimen | Short Name | Preparation |
|---|---|---|
| Bainitic steel | BA | 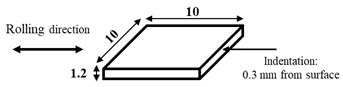 |
| Interstitial-free steel | IF | |
| Stainless steel (SUS304) | S304 |  |
| Stainless steel (SUS316) | S316 | |
| Electrodeposited iron | EI | 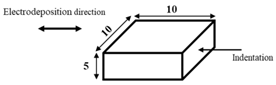 |
| NiTi alloy | NT | 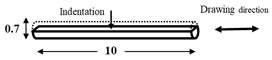 |
| Single crystal tungsten | W |  |
| Martensitic steel | MA | 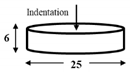 |
| Copper | Cu |
| Short Name | H (MPa) | Er (GPa) | We × 10−10(J) | Wp × 10−10(J) | Wp/We | YS (MPa) | TS (MPa) |
|---|---|---|---|---|---|---|---|
| MA a | 9030 ± 379 | 223 ± 5.47 | 2.17 ± 0.08 | 6.08 ± 0.15 | 2.80 ± 0.14 | - | - |
| BA | 4255 ± 214 | 213 ± 8.18 | 1.64 ± 0.06 | 10.1 ± 0.33 | 6.16 ± 0.32 | 696 | 765 |
| IF | 2266 ± 124 | 238 ± 9.93 | 1.12 ± 0.04 | 14.6 ± 0.52 | 13.04 ± 0.73 | 188 | 275 |
| EI | 2613 ± 227 | 215 ± 13.4 | 1.31 ± 0.09 | 13.3 ± 0.72 | 10.15 ± 1.05 | - | - |
| S304 | 5348 ± 411 | 205 ± 7.55 | 1.87 ± 0.07 | 8.79 ± 0.45 | 4.70 ± 0.34 | 368 | 658 |
| S316 | 4948 ± 384 | 206 ± 7.65 | 1.78 ± 0.07 | 9.17 ± 0.53 | 5.15 ± 0.42 | 329 | 635 |
| W | 6006 ± 43.0 | 372 ± 8.82 | 1.17 ± 0.02 | 8.88 ± 0.07 | 7.59 ± 0.14 | - | - |
| Cu b | 860 ± 38.3 | 121 ± 8.09 | 1.21 ± 0.04 | 26.8 ± 0.81 | 22.15 ± 0.92 | 65 | 213 |
| NT | 4829 ± 247 | 60 ± 1.68 | 6.37 ± 0.16 | 6.30 ± 0.42 | 0.99 ± 0.08 | - | 1500 |
Publisher’s Note: MDPI stays neutral with regard to jurisdictional claims in published maps and institutional affiliations. |
© 2021 by the authors. Licensee MDPI, Basel, Switzerland. This article is an open access article distributed under the terms and conditions of the Creative Commons Attribution (CC BY) license (https://creativecommons.org/licenses/by/4.0/).
Share and Cite
Yamamoto, M.; Tanaka, M.; Furukimi, O. Hardness–Deformation Energy Relationship in Metals and Alloys: A Comparative Evaluation Based on Nanoindentation Testing and Thermodynamic Consideration. Materials 2021, 14, 7217. https://doi.org/10.3390/ma14237217
Yamamoto M, Tanaka M, Furukimi O. Hardness–Deformation Energy Relationship in Metals and Alloys: A Comparative Evaluation Based on Nanoindentation Testing and Thermodynamic Consideration. Materials. 2021; 14(23):7217. https://doi.org/10.3390/ma14237217
Chicago/Turabian StyleYamamoto, Masayuki, Masaki Tanaka, and Osamu Furukimi. 2021. "Hardness–Deformation Energy Relationship in Metals and Alloys: A Comparative Evaluation Based on Nanoindentation Testing and Thermodynamic Consideration" Materials 14, no. 23: 7217. https://doi.org/10.3390/ma14237217