Strive to Reduce Slurry Erosion and Cavitation in Pumps through Flow Modifications, Design Optimization and Some Other Techniques: Long Term Impact on Process Industry


 ,
,  ,
,  , ,
, ,  and
and 
Abstract
:1. Introduction
2. Significance of Slurry Erosion and Cavitation
2.1. Slurry Erosion
2.2. Cavitation
3. Investigation and Identification for Slurry Erosion and Cavitation in Pumps
3.1. Experimental Investigation
3.2. Numerical Investigation
4. Erosion and Cavitation Reduction Techniques
4.1. Flow Modifications
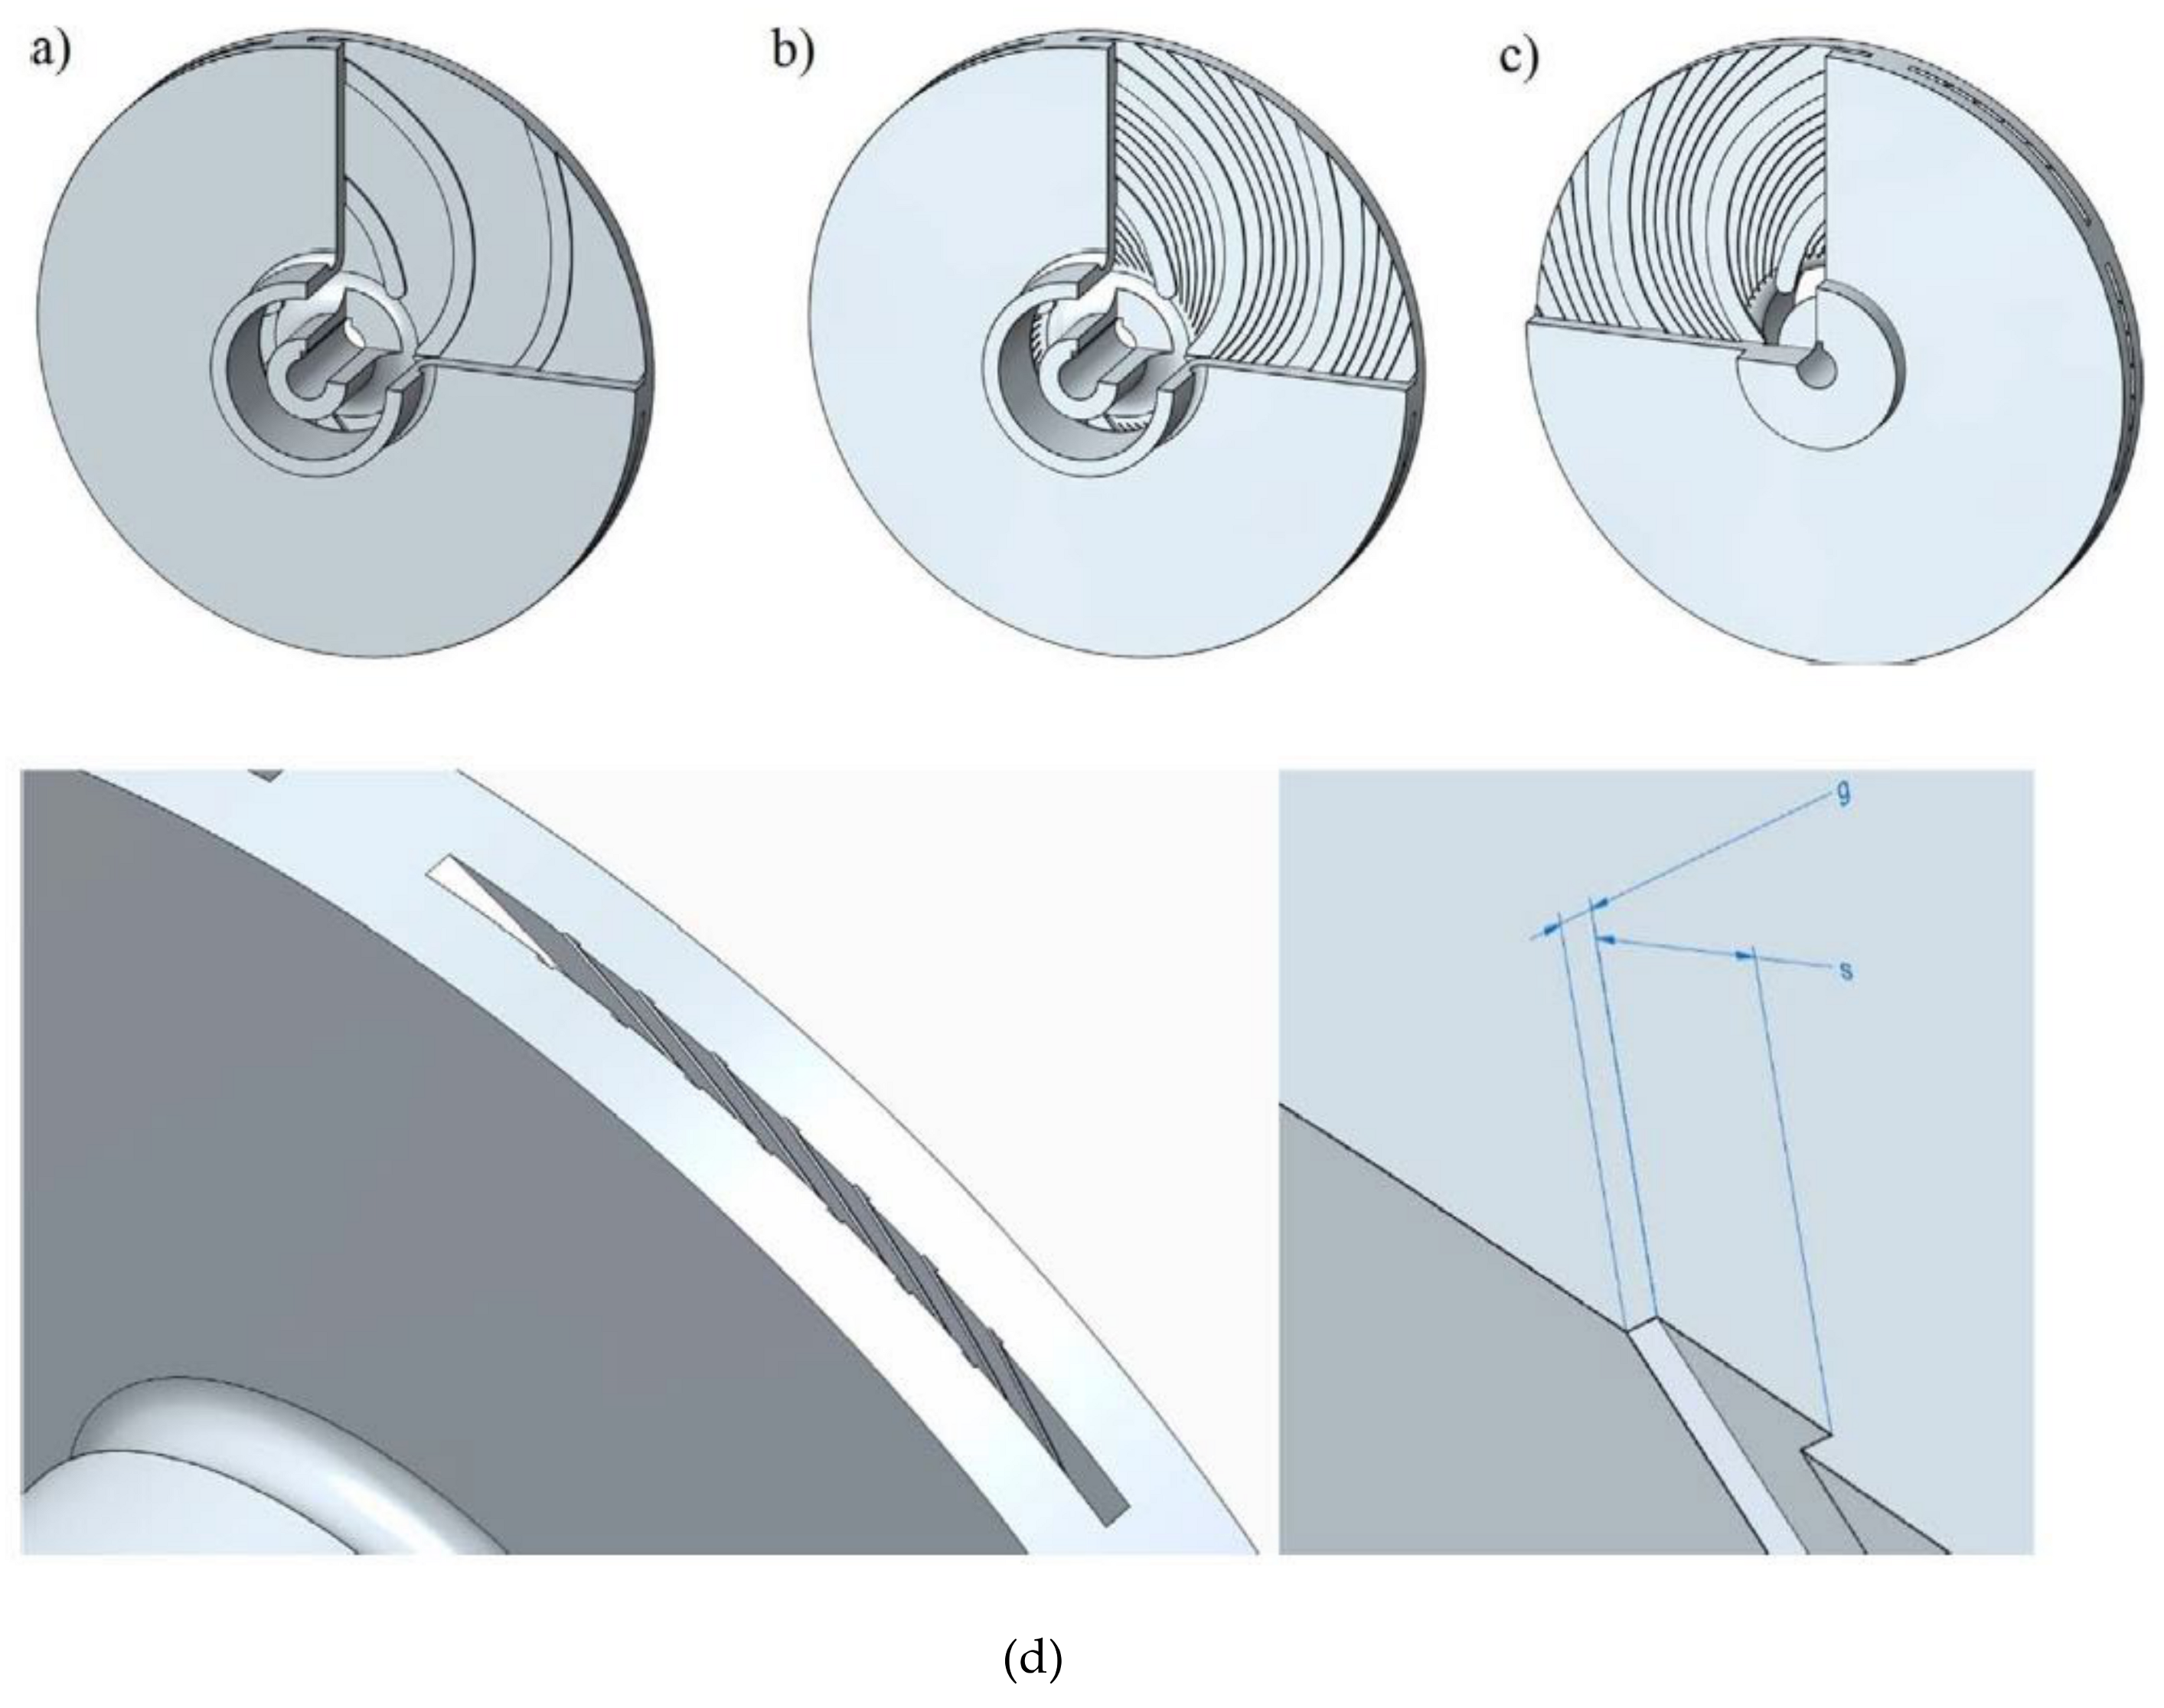
4.2. Design Optimization Studies
4.3. Target Surface Material
4.4. Other Interesting Techniques
5. Impact on Process Industries
5.1. Energy Efficiency Enhancement
5.2. Economic Analysis
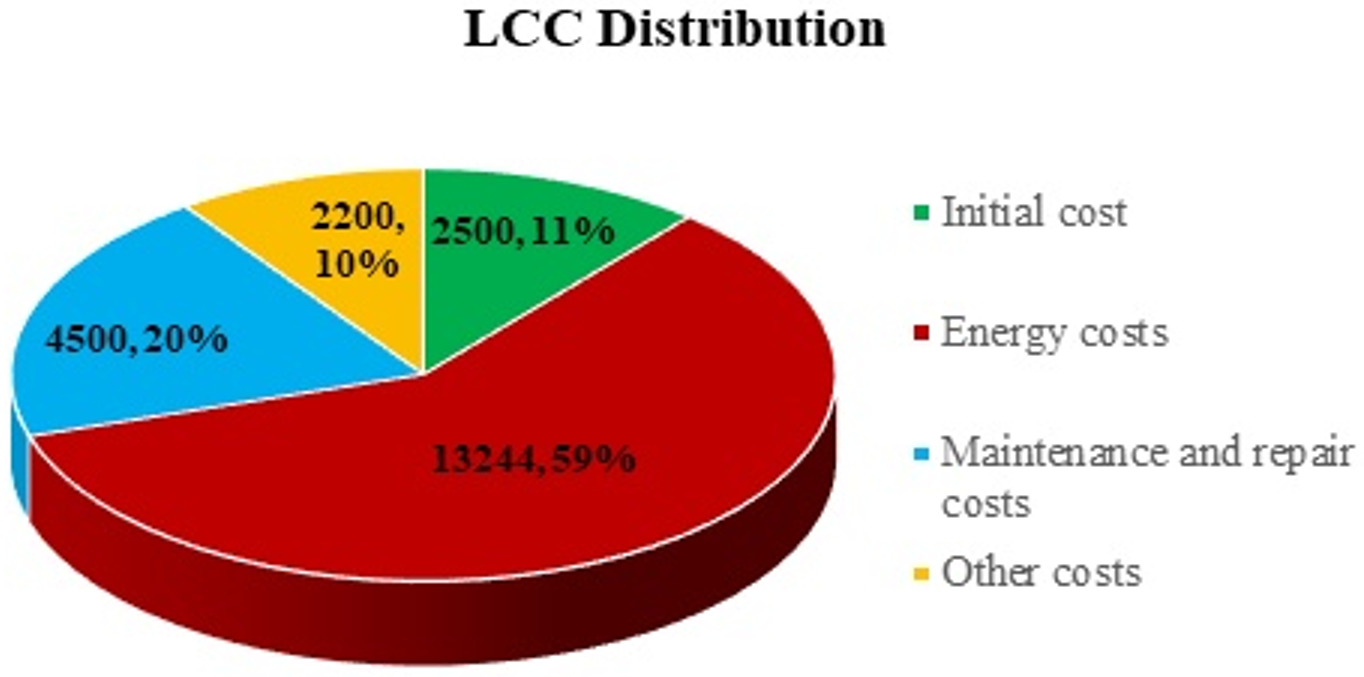
5.2.1. Calculating the Total Life-Cycle-Cost
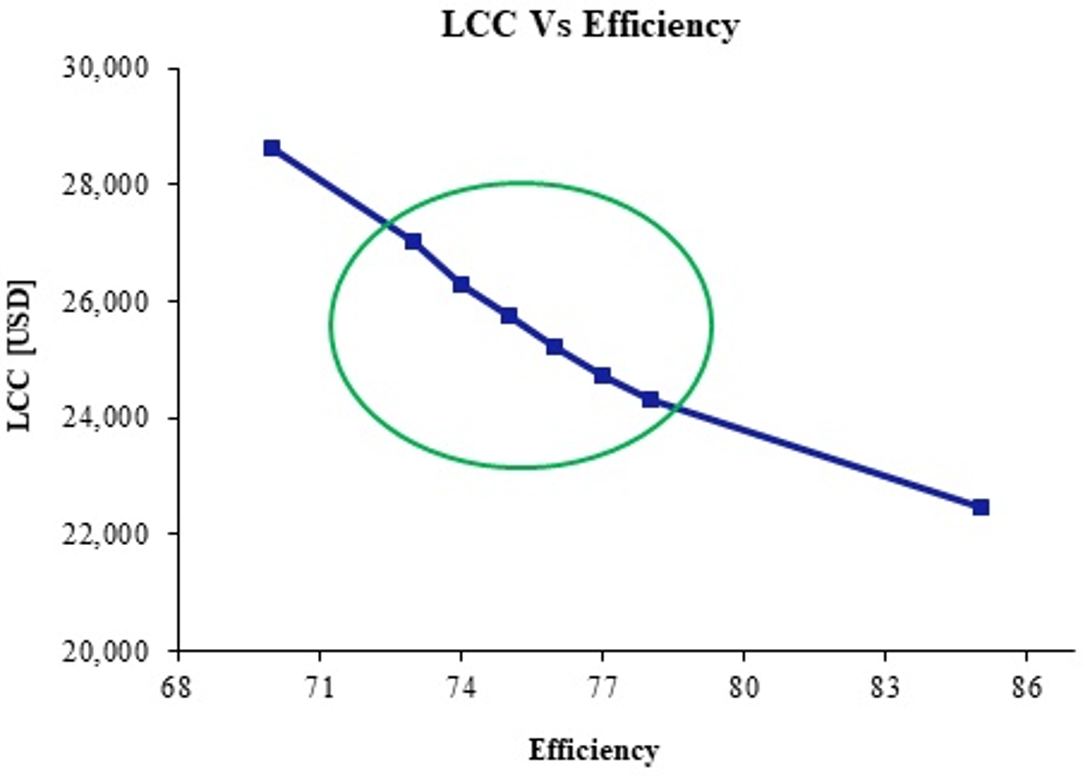
5.2.2. Analyzing the Results
6. Conclusions
- Experimental work completed so far for slurry erosion and cavitation is encouraging but lacks in similarity with the field studies. Thus, there is a need for design and development of experiments to reasonably predict the wear in both cases.
- It seems necessary that appropriate CFD methodology is required in emphasizing the significance of slurry erosion and cavitation, as applying certain analytical methods and testing of equipment both have limitations.
- Slurry erosion and cavitation reduction techniques are analyzed as a function of flow modifications, design optimization, change in target surface materials and through some other novel techniques.
- Economic analysis conducted for a case study relevant to CP usage in Pakistan shows that an 8% enhancement in pump efficiency can reduce the life cycle cost to about 17.6% which could save up to USD 4281 for a single pump.
Funding
Institutional Review Board Statement
Informed Consent Statement
Data Availability Statement
Conflicts of Interest
Nomenclature
| Abbreviations | |
| A | constant |
| B | constant |
| C | sand concentration |
| M | mass loss |
| m | function of particle concentration and size |
| R | elbow curvature radius |
| t | time |
| W | weight loss rate |
| BOCLE | ball-on-cylinder |
| BVF | boundary vorticity flux |
| CE | cavitation erosion |
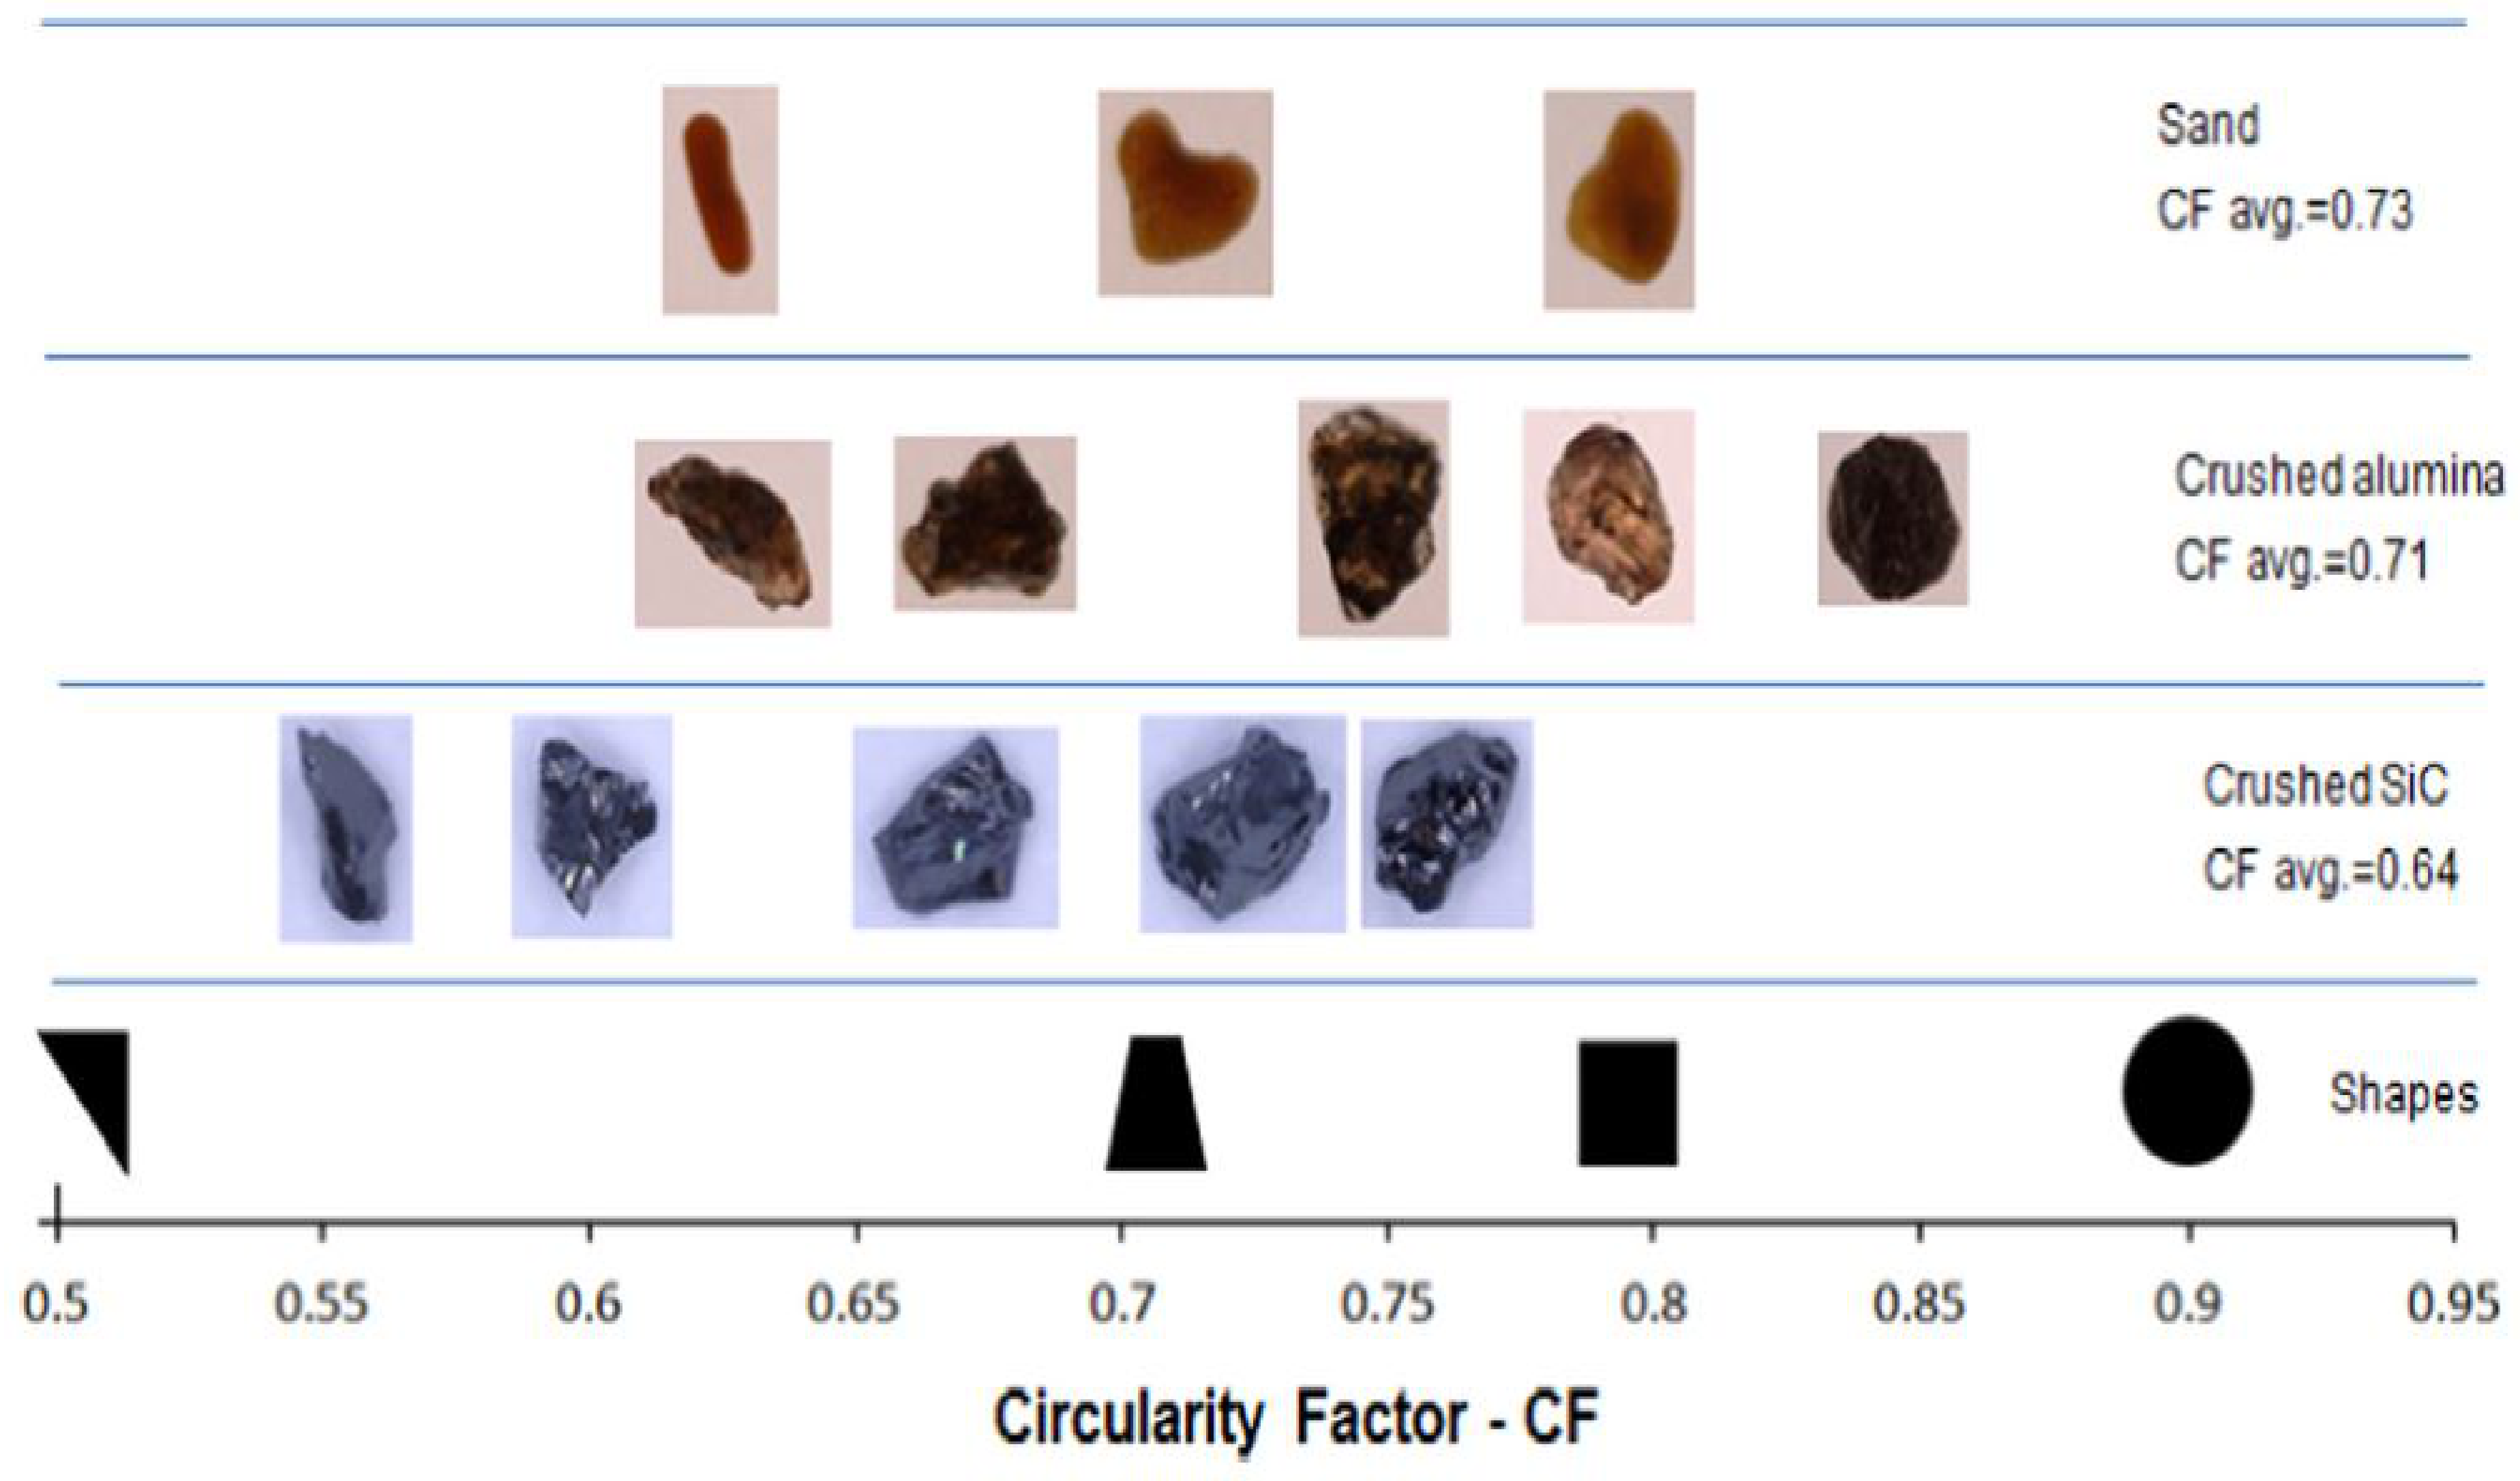
| CF | circularity factor |
| CP | Centrifugal pump |
| CSE | cavitation silt erosion |
| CrMo | chromium molybdenum |
| DSRW | dry sand rubber wheel |
| FSI | fluid structure interaction |
| GRNN | generalized regression neural network |
| HPP | high pressure pipelines |
| JPCR | Jet pump cavitation reactor |
| LCC | life cycle cost |
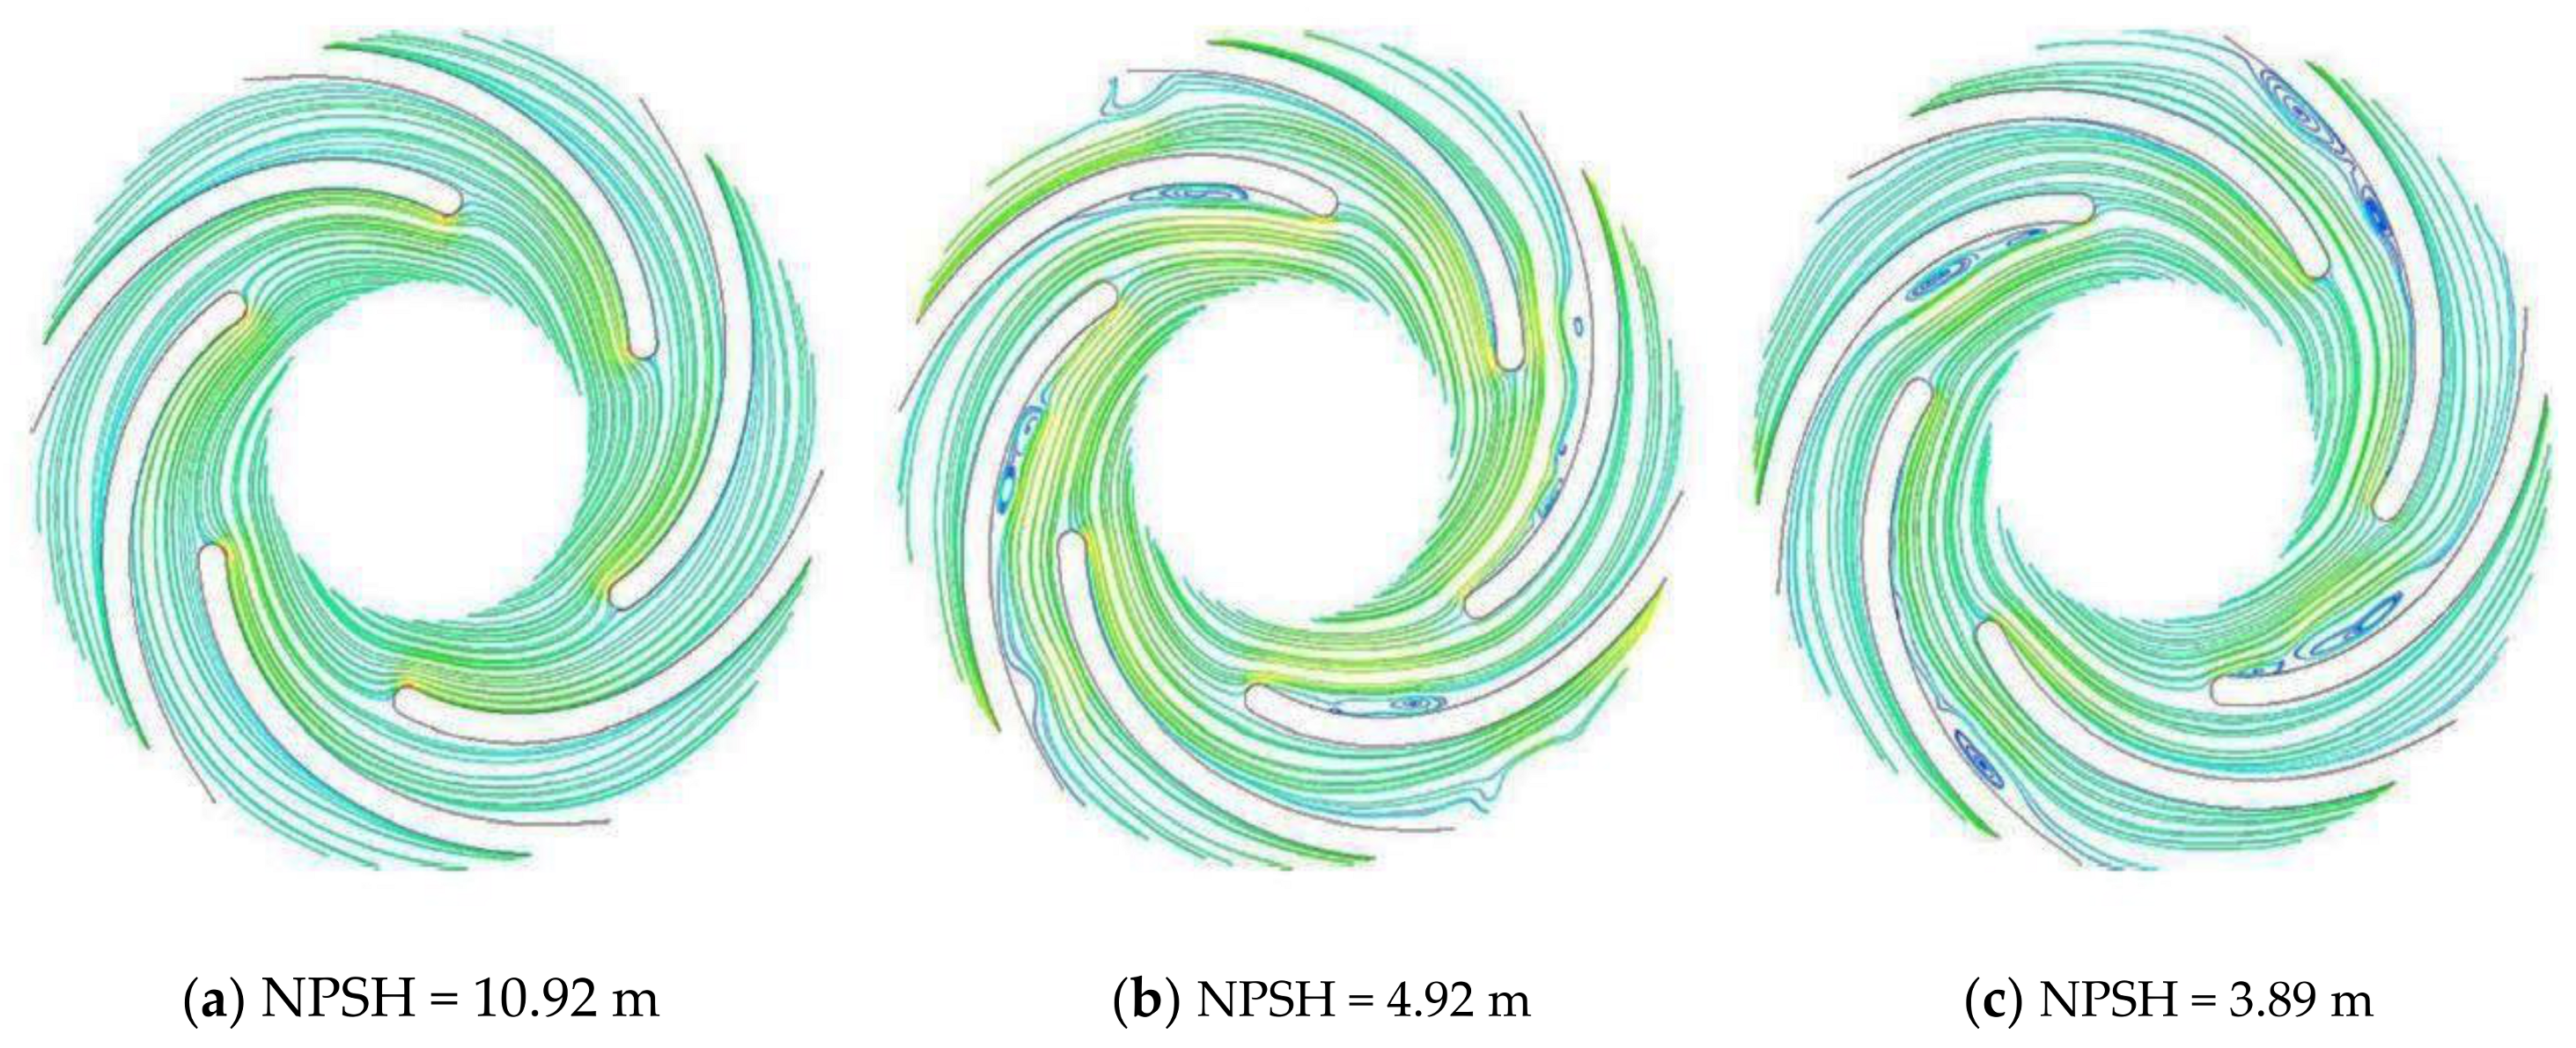
| NPSH | net positive suction head |
| PAT | pump as turbine |
| PIV | particle image velocimetry |
| RANS | Reynolds average navier-stokes |
| SEM | scanning electron microscope |
| SJE | slurry jet erosion |
| SKE | simulation-Kriging model-experiment |
| SPQ | spike parameter |
| USD | united states dollars |
| Subscripts | |
| Aa | affected area of polished surface |
| Ao | cross-sectional area of the jet’s outlet |
| Cv | volumetric concentration |
| Di | impeller diameter |
| dp | particle diameter |
| d50 | mean particle diameter |
| Er | Erosion rate |
| NE | Dimensionless erosion rate |
| NPSHr | required net positive suction head |
| SGs | specific gravity |
| AlMg2 | Aluminum di-magnesium |
| SiO2 | silicon dioxide |
| Wtotal | weight of material before test |
| Werosion | weight of material after test |
| Vj | average jet velocity |
| Vm | mixture fluid velocity |
| Vsg | superficial gas velocity |
| Vsl | superficial liquid velocity |
| Greek letters | |
| ρH2O | water density |
| θ | impact angle |
References
- Xiao, Y.; Guo, B.; Ahn, S.H.; Luo, Y.; Wang, Z.; Shi, G.; Li, Y. Slurry Flow and Erosion Prediction in a Centrifugal Pump after Long-Term Operation. Energies 2019, 12, 1523. [Google Scholar] [CrossRef] [Green Version]
- Shah, S.R.; Jain, S.V.; Patel, R.N.; Lakhera, V.J. CFD for centrifugal pumps: A review of the state-of-the-art. Procedia Eng. 2013, 51, 715–720. [Google Scholar] [CrossRef] [Green Version]
- Wilson, G. The Effects of Slurries on Centrifugal Pump Performance. Fourth Int. Pump User Symp. 1987, 19–26. [Google Scholar] [CrossRef]
- Pagalthivarthi, K.V.; Ravi, M.R.; Gupta, P.K.; Tyagi, V. CFD Prediction of Erosion Wear in Centrifugal Slurry Pumps for Dilute Slurry Flows. J. Comput. Multiph. Flows 2011, 3, 225–245. [Google Scholar] [CrossRef] [Green Version]
- Huang, S.; Su, X.; Qiu, G. Transient numerical simulation for solid-liquid flow in a centrifugal pump by DEM-CFD coupling. Eng. Appl. Comput. Fluid Mech. 2015, 9, 411–418. [Google Scholar] [CrossRef] [Green Version]
- Walker, C.I.; Robbie, P. Comparison of some laboratory wear tests and field wear in slurry pumps. Wear 2013, 302, 1026–1034. [Google Scholar] [CrossRef]
- Azimian, M.; Bart, H. Erosion investigations by means of a centrifugal accelerator erosion tester. Wear 2015, 328–329, 249–256. [Google Scholar] [CrossRef]
- Solnordal, C.B.; Wong, C.Y.; Boulanger, J. An experimental and numerical analysis of erosion caused by sand pneumatically conveyed through a standard pipe elbow. Wear 2015, 336–337, 43–57. [Google Scholar] [CrossRef]
- Lin, Y.-P.; Wang, W.-H.; Pan, S.-Y.; Ho, C.-C.; Hou, C.-J.; Chiang, P.-C. Environmental impacts and benefits of organic Rankine cycle power generation technology and wood pellet fuel exemplified by electric arc furnace steel industry. Appl. Energy 2016, 183, 369–379. [Google Scholar] [CrossRef]
- Susanne Kruger, P.D.; Martin, N. Assesment of wear erosion in pump impellers. Turbomach. Pump Symp. 1990, 36, 817–828. [Google Scholar]
- Gnanavelu, A.; Kapur, N.; Neville, A.; Flores, J. An integrated methodology for predicting material wear rates due to erosion. Wear 2009, 267, 1935–1944. [Google Scholar] [CrossRef]
- Rao, P.V.; Buckley, D.H. Predictive capability of long-term cavitation and liquid impingement erosion models. Wear 1984, 17, 259–274. [Google Scholar] [CrossRef]
- Hu, H.X.; Zheng, Y.G. The effect of sand particle concentrations on the vibratory cavitation erosion. Wear 2017, 384–385, 95–105. [Google Scholar] [CrossRef]
- Naguib, N.W.M.; Ulrike, D.; Johannes, S.; Karl-Heinz, Z.G. The effect of surface finish and cavitating liquid on the cavitation erosion of Alumina and Silicon Carbide ceramics. Ceramics 2007, 51, 30–39. [Google Scholar]
- Wang, Y.; Liu, H.; Liu, D.; Yuan, S.; Wang, J.; Jiang, L. Application of the two-phase three-component computational model to predict cavitating flow in a centrifugal pump and its validation. Comput. Fluids 2016, 131, 142–150. [Google Scholar] [CrossRef]
- Noon, A.A.; Kim, M. Erosion wear on centrifugal pump casing due to slurry flow. Wear 2016, 364–365, 103–111. [Google Scholar] [CrossRef]
- Zhong, Y.; Minemura, K. Measurement of erosion due to particle impingement and numerical prediction of wear in pump casing. Wear 1996, 199, 36–44. [Google Scholar] [CrossRef]
- Pagalthivarthi, K.V.; Gupta, P.K.; Tyagi, V.; Ravi, M.R. CFD Predictions of Dense Slurry Flow in Centrifugal Pump Casings. Int. J. Aerosp. Mech. Eng. 2011, 5, 254–266. [Google Scholar]
- Tian, H.H.; Addie, G.R.; Visintainer, R.J. Erosion–corrosion performance of high-Cr cast iron alloys in flowing liquid–solid slurries. Wear 2009, 267, 2039–2047. [Google Scholar] [CrossRef]
- Walker, C.I.; Bodkin, G.C. Empirical wear relationships for centrifugal slurry pumps Part 1: Side-liners. Wear 2000, 242, 140–146. [Google Scholar] [CrossRef]
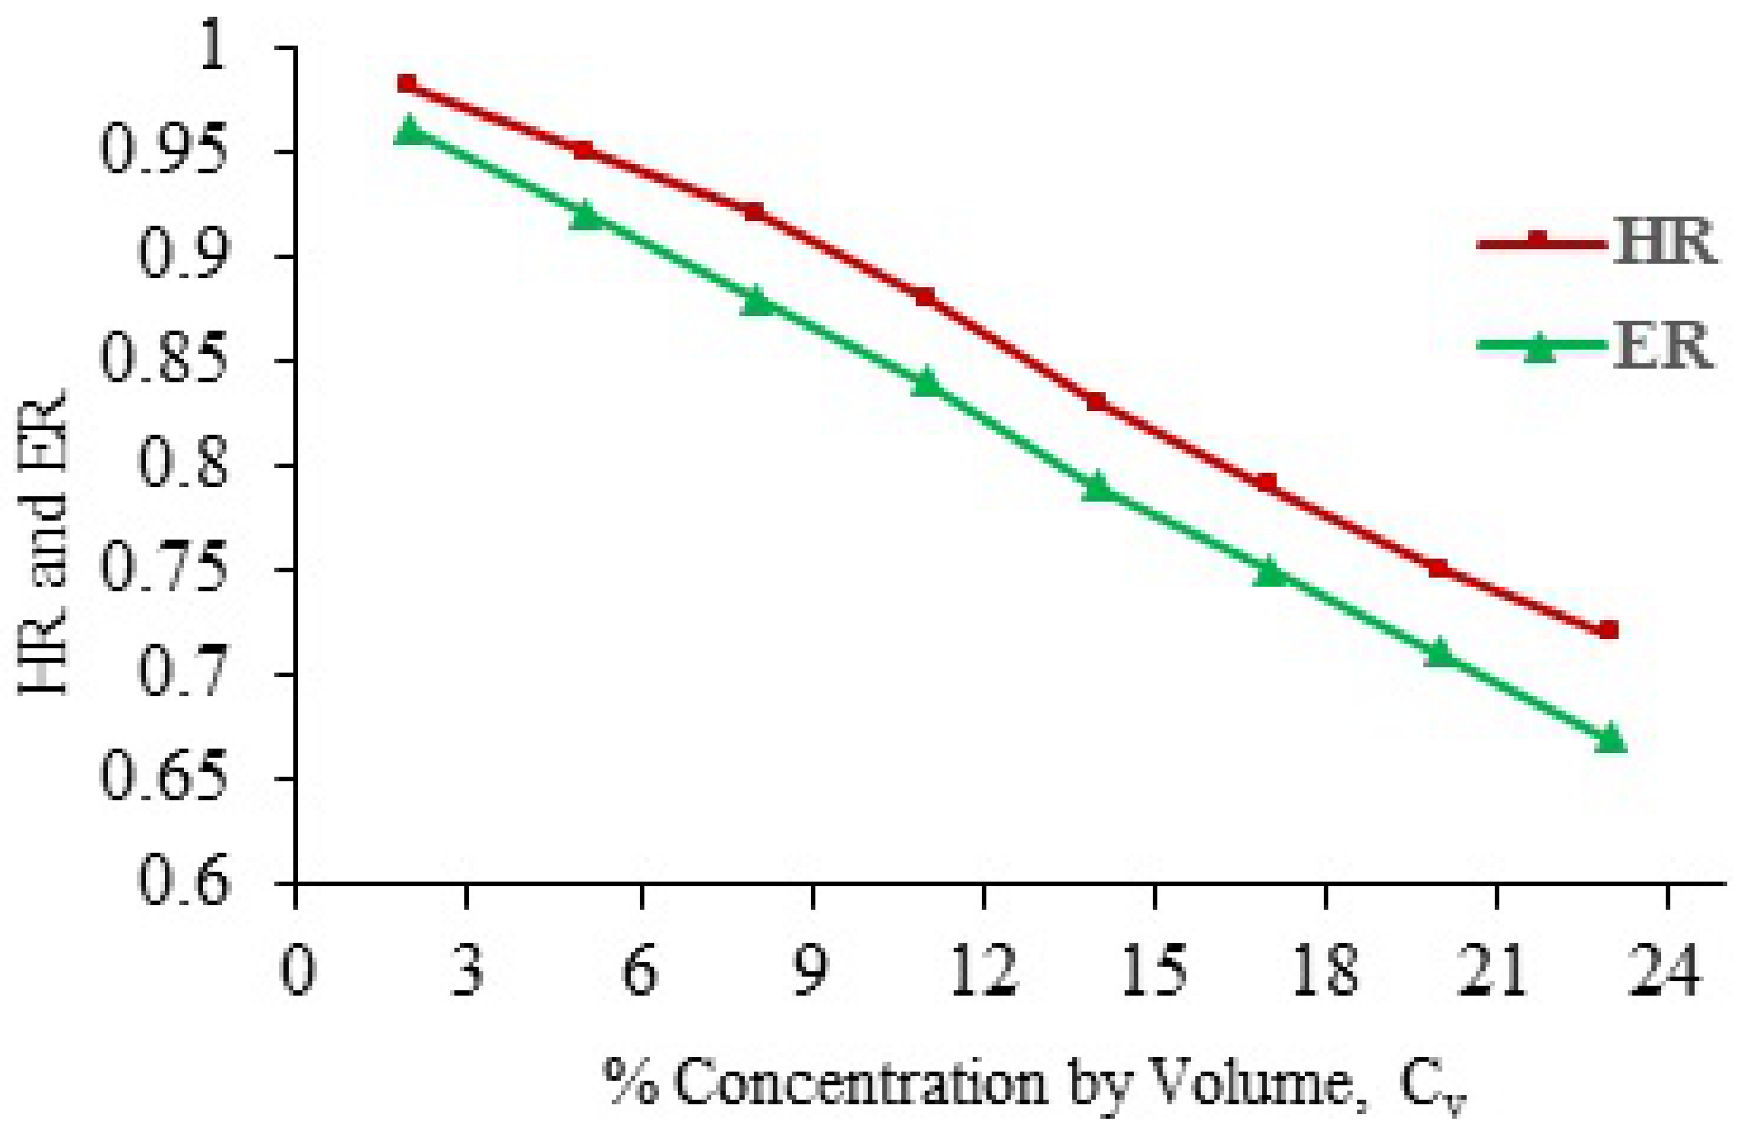
- Wang, Z.; Qian, Z. Effects of concentration and size of silt particles on the performance of a double-suction centrifugal pump. Energy 2017, 123, 36–46. [Google Scholar] [CrossRef]
- Xie, Y.; Jiang, J.; Tufa, K.Y.; Yick, S. Wear resistance of materials used for slurry transport. Wear 2015, 333, 1104–1110. [Google Scholar] [CrossRef]
- Tang, L.; Xiong, J.; Wan, W.; Guo, Z.; Zhou, W.; Huang, S.; Zhong, H. The effect of fluid viscosity on the erosion wear behavior of Ti(C,N)-based cermets. Ceram. Int. 2015, 41, 3420–3426. [Google Scholar] [CrossRef]
- Teran, L.; Aponte, R.; Muñoz-Cubillos, J.; Roa, C.; Coronado, J.; Ladino, J.; Larrahondo, F.; Rodríguez, S. Analysis of economic impact from erosive wear by hard particles in a run-of-the-river hydroelectric plant. Energy 2016, 113, 1188–1201. [Google Scholar] [CrossRef]
- Liu, H.; Yang, W.; Kang, R. A correlation for sand erosion prediction in annular flow considering the effect of liquid dynamic viscosity. Wear 2018, 405, 1–11. [Google Scholar] [CrossRef]
- Adamkowski, A.; Henke, A.; Lewandowski, M. Resonance of torsional vibrations of centrifugal pump shafts due to cavitation erosion of pump impellers. EFA 2016, 70, 56–72. [Google Scholar] [CrossRef]
- Blau, P.J. Lessons learned from the test-to-test variability of different types of wear data. Wear 2017, 376–377, 1830–1840. [Google Scholar] [CrossRef]
- Long, X.; Zhang, J.; Wang, Q.; Xiao, L.; Xu, M.; Lyu, Q.; Ji, B. Experimental investigation on the performance of jet pump cavitation reactor at different area ratios. Exp. Therm. Fluid Sci. 2016, 78, 309–321. [Google Scholar] [CrossRef]
- Hutli, E.; Nedeljkovic, M.S.; Radovic, N.A.; Bonyár, A. The relation between the high speed submerged cavitating jet behaviour and the cavitation erosion process. Int. J. Multiph. Flow 2016, 83, 27–38. [Google Scholar] [CrossRef] [Green Version]
- Gu, Y.; Li, B.; Chen, M. An experimental study on the cavitation of water with effects of SiO2 nanoparticles. Exp. Therm. Fluid Sci. 2016, 79, 195–201. [Google Scholar] [CrossRef]
- Chan, W.K. Detection of cavitation erosion in centrifugal pumps. Int. J. Heat Fluid Flow 1988, 9, 74–77. [Google Scholar] [CrossRef]
- Verhaagen, B.; Rivas, D.F. Measuring cavitation and its cleaning effect. Ultrason. Sonochemistry 2016, 29, 619–628. [Google Scholar] [CrossRef] [PubMed] [Green Version]
- Roco, M.C.; Addie, G.R. Erosion wear in slurry pumps and pipes. Powder Technol. 1987, 50, 35–46. [Google Scholar] [CrossRef]
- Graham, L.J.W.; Lester, D.; Wu, J. Slurry erosion in complex flows: Experiment and CFD. In Proceedings of the 7th International Conference on CFD in the Minerals and Process Industries, Melbourne, Australia, 9–11 December 2009; pp. 1–6. [Google Scholar]
- Upadhayay, L. Modelling and Evaluation of Erosion Wear Suspension System. Modeling and Evaluation of Erosion Wear Suspension System. Ph.D. Thesis, Thapar University, Patiala, India, 2010. [Google Scholar]
- Azizi, R.; Attaran, B.; Hajnayeb, A.; Ghanbarzadeh, A.; Changizian, M. Improving accuracy of cavitation severity detection in centrifugal pumps using a hybrid feature selection technique. Measurement 2017, 108, 9–17. [Google Scholar] [CrossRef]
- Li, Y.; Xu, Z.; Chen, H.; Wang, J.; Chen, D. Effect of Transverse Surface Topography on Cavitation Erosion. Proc. Cist. 2008, 356–357. [Google Scholar]
- Hattori, S.; Kishimoto, M. Prediction of cavitation erosion on stainless steel components in centrifugal pumps. Wear 2008, 265, 1870–1874. [Google Scholar] [CrossRef]
- Liu, H.; Liu, D.; Wang, Y.; Wu, X.; Wang, J. Application of modified k-epsilon model for predicting cavitating flow in centrifugal pump. Water Sci. Eng. 2013, 6, 331–339. [Google Scholar] [CrossRef]
- Fu, Q.; Zhang, F.; Zhu, R.; He, B. A systematic investigation on flow characteristics of impeller passage in a nuclear centrifugal pump under cavitation state. Ann. Nucl. Energy 2016, 97, 190–197. [Google Scholar] [CrossRef]
- Nayebzadeh, A.; Wang, Y.; Tabkhi, H.; Shin, J.-H.; Peles, Y. Cavitation behind a circular micro pillar. Int. J. Multiph. Flow 2018, 98, 67–78. [Google Scholar] [CrossRef]
- Rui, Z. Numerical analysis of cavitation within slanted axial-flow pump. J. Hydrodyn. 2013, 25, 663–672. [Google Scholar] [CrossRef]
- Shao, C.; Zhou, J.; Cheng, W. Experimental and numerical study of external performance and internal flow of a molten salt pump that transports fluids with different viscosities. Int. J. Heat Mass Transf. 2015, 89, 627–640. [Google Scholar] [CrossRef]
- Zughbi, H.D.; Schwarz, M.P.; Turner, W.J.; Hutton, W. Numerical and experimental investigations of wear in heavy medium cyclones. Miner. Eng. 1991, 4, 245–262. [Google Scholar] [CrossRef]
- Zhang, J.; Kang, J.; Fan, J.; Gao, J. Research on erosion wear of high-pressure pipes during hydraulic fracturing slurry flow. J. Loss Prev. Process. Ind. 2016, 43, 438–448. [Google Scholar] [CrossRef]
- Rossetti, A.; Pavesi, G.; Ardizzon, G. A new two stage miniature pump: Design, experimental characterization and numerical analyses. Sens. Actuators 2010, 164, 74–87. [Google Scholar] [CrossRef]
- Ye, Y.; Zhu, X.; Lai, F.; Li, G. Application of the semi-analytical cavitation model to flows in a centrifugal pump. Int. Commun. Heat Mass Transf. 2017, 86, 92–100. [Google Scholar] [CrossRef]
- Brunhart, M.; Soteriou, C.; Daveau, C.; Gavaises, M.; Koukouvinis, P.; Winterbourn, M. Cavitation erosion risk indicators for a thin gap within a diesel fuel pump. Wear 2020, 442, 203024. [Google Scholar] [CrossRef]
- Ramirez, R.; Avila, E.; Lopez, L.; Bula, A.; Forero, J.D. CFD characterization and optimization of the cavitation phenomenon in dredging centrifugal pumps. Alex. Eng. J. 2020, 59, 291–309. [Google Scholar] [CrossRef]
- Wood, R.J.K.; Jones, T.F.; Miles, N.J.; Ganeshalingam, J. Upstream swirl-induction for reduction of erosion damage from slurries in pipeline bends. Wear 2001, 250, 770–778. [Google Scholar] [CrossRef]
- Yianneskis, M. Laser-Doppler measurements of laminar and turbulent flow in a pipe bend. Int. J. Heat Fluid Flow 1982, 11, 213–219. [Google Scholar]
- Tarodiya, R.; Gandhi, B.K. Hydraulic performance and erosive wear of centrifugal slurry pumps—A review. Powder Technol. 2017, 305, 27–38. [Google Scholar] [CrossRef]
- Messaadi, M.; Kermouche, G.; Kapsa, P. Numerical and experimental analysis of dynamic oblique impact: Effect of impact angle. Wear 2015, 332, 1028–1034. [Google Scholar] [CrossRef]
- Graham, L.J.W.; Wu, J.; Short, G.; Solnordal, C.; Wong, C.; Brown, G.; Celliers, O.; Whyte, D. Laboratory modelling of erosion damage by vortices in slurry flow. Hydrometallurgy 2017, 170, 43–50. [Google Scholar] [CrossRef]
- Valentini, D.; Pace, G.; Pasini, A.; Torre, L.; Hadavandi, R.; D’Agostino, L. Fluid-induced rotordynamic forces on a whirling centrifugal pump. Eur. J. Mech. B/Fluids 2017, 61, 336–345. [Google Scholar] [CrossRef] [Green Version]
- Pei, J.; Lui, A.; Zhang, Q.; Xiong, T.; Jiang, P.; Wei, W. Numerical investigation of the maximum erosion zone in elbows for liquid-particle flow. Powder Technol. 2018, 333, 47–59. [Google Scholar] [CrossRef]
- Shi, B.; Wei, J.; Zhang, Y. A novel experimental facility for measuring internal flow of Solid-liquid two-phase flow in a centrifugal pump by PIV. Int. J. Multiph. Flow 2017, 89, 266–276. [Google Scholar] [CrossRef]
- Olszewski, P. Genetic optimization and experimental verification of complex parallel pumping station with centrifugal pumps. Appl. Energy 2016, 178, 527–539. [Google Scholar] [CrossRef]
- Spence, R.; Amaral-Teixeira, J. A CFD parametric study of geometrical variations on the pressure pulsations and performance characteristics of a centrifugal pump. Comput. Fluids 2009, 38, 1243–1257. [Google Scholar] [CrossRef] [Green Version]
- Ayad, A.F.; Abdalla, H.M.; Aly, A.A.E.A. Effect of semi-open impeller side clearance on the centrifugal pump performance using CFD. Aerosp. Sci. Technol. 2015, 47, 247–255. [Google Scholar] [CrossRef]
- Ramasamy, N.; Ganesan, K. An Investigation on Design and Performance Optimization of Pump Impeller. IJEDR 2016, 4, 74–77. [Google Scholar]
- Heo, M.-W.; Kim, J.-H.; Kim, K.-Y. Design Optimization of a Centrifugal Fan with Splitter Blades. Int. J. Turbo Jet Engines 2015, 32, 143–154. [Google Scholar] [CrossRef]
- Heo, M.W.; Ma, S.-B.; Shim, H.S.; Kim, K.Y. High-efficiency design optimization of a centrifugal pump. J. Mech. Sci. Technol. 2016, 30, 3917–3927. [Google Scholar] [CrossRef]
- Zhang, Y.; Hu, S.; Wu, J.; Zhang, Y.; Chen, L. Multi-objective optimization of double suction centrifugal pump using Kriging metamodels. Adv. Eng. Softw. 2014, 74, 16–26. [Google Scholar] [CrossRef]
- Yang, F.; Cho, H.; Zhang, H.; Zhang, J.; Wu, Y. Artificial neural network (ANN) based prediction and optimization of an organic Rankine cycle (ORC) for diesel engine waste heat recovery. Energy Convers. Manag. 2018, 164, 15–26. [Google Scholar] [CrossRef]
- Haosheng, C.; Jiadao, W.; Darong, C. Cavitation damages on solid surfaces in suspensions containing spherical and irregular microparticles. Wear 2009, 266, 345–348. [Google Scholar] [CrossRef]
- Wang, C.; Shi, W.; Wang, X.; Jiang, X.; Yang, Y.; Li, W.; Zhou, L. Optimal design of multistage centrifugal pump based on the combined energy loss model and computational fluid dynamics. Appl. Energy 2017, 187, 10–26. [Google Scholar] [CrossRef]
- Noon, A.A.; Kim, M.-H. Erosion wear on Francis turbine components due to sediment flow. Wear 2017, 378–379, 126–135. [Google Scholar] [CrossRef]
- Javaheri, V.; Porter, D.A.; Kuokkala, V.T. Slurry erosion of steel—Review of tests, mechanisms and materials. Wear 2018, 409, 248–273. [Google Scholar] [CrossRef]
- Walker, C.; Hambe, M. Influence of particle shape on slurry wear of white iron. Wear 2015, 333, 1021–1027. [Google Scholar] [CrossRef]
- Krella, A.K. Degradation of AlMg2 aluminium alloy caused by cavitation—An effect of cavitation intensity. Mater. Charact. 2017, 130, 219–229. [Google Scholar] [CrossRef]
- Sun, B.; Fan, J.; Wen, D.; Chen, Y. An experimental study of slurry erosion involving tensile stress for pressure pipe manifold. Tribol. Int. 2015, 82, 280–286. [Google Scholar] [CrossRef]
- Gautam, V.; Kumar, A.; Prasad, L.; Patel, V.K. An Experimental Investigation on Slurry Erosion Wear Characteristics of Brass Alloy. Mater. Today Proc. 2017, 4, 9879–9882. [Google Scholar] [CrossRef]
- Alam, T.; Farhat, Z.N. Slurry erosion surface damage under normal impact for pipeline steels. Eng. Fail. Anal. 2018, 90, 116–128. [Google Scholar] [CrossRef]
- Mesa, D.H.; Toro, A.; Sinatora, A.; Tschiptschin, A.P. The effect of testing temperature on corrosion–erosion resistance of martensitic stainless steels. Wear 2003, 255, 139–145. [Google Scholar] [CrossRef]
- Jain, S.V.; Patel, R.N. Investigations on pump running in turbine mode: A review of the state-of-the-art. Renew. Sustain. Energy Rev. 2014, 30, 841–868. [Google Scholar] [CrossRef]
- Kannojiya, V.; Deshwal, M.; Deshwal, D. Numerical Analysis of Solid Particle Erosion in Pipe Elbow. Mater. Today Proc. 2018, 5, 5021–5030. [Google Scholar] [CrossRef]
- Laín, S.; Sommerfeld, M. Numerical prediction of particle erosion of pipe bends. Adv. Powder Technol. 2019, 30, 366–383. [Google Scholar] [CrossRef]
- Abid, M. Simulation of turbulent flow through tarbela dam tunnel 3. IIUM Eng. J. 2010, 11, 201–224. [Google Scholar] [CrossRef]
- Aldi, N.; Buratto, C.; Pinelli, M.; Spina, P.R.; Suman, A.; Casari, N. CFD Analysis of a Non-newtonian Fluids Processing Pump. Energy Procedia 2016, 101, 742–749. [Google Scholar] [CrossRef]
- Girelli, L.; Tocci, M.; Montesano, L. Investigation of cavitation erosion resistance of AlSi10Mg alloy for additive manufacturing. Wear 2018, 402, 124–136. [Google Scholar] [CrossRef]
- Al-Obaidi, A.R. Investigation of effect of pump rotational speed on performance and detection of cavitation within a centrifugal pump using vibration analysis. Heliyon 2019, 5, e01910. [Google Scholar] [CrossRef] [Green Version]
- Skrzypacz, J.; Bieganowski, M. The influence of micro grooves on the parameters of the centrifugal pump impeller. Int. J. Mech. Sci. 2018, 144, 827–835. [Google Scholar] [CrossRef]
- Binama, M.; Muhirwa, A.; Bisengimana, E. Cavitation effects in centrifugal pumps—A Review. Int. J. Eng. Res. Appl. 2016, 6, 52–63. [Google Scholar]
- European Comission. Accompanying the document. System 2011, 147, 578–579. [Google Scholar]
- Bhat, V.; Suthan, T. Bad actor elimination in pumps. Turbomachinery Laboratories, Texas A&M Engineering Experiment Station. In Proceedings of the Asia Turbomachinery and Pump Symposim, Singapore, 22–25 February 2016. [Google Scholar] [CrossRef]
- Collins, B.; Erickson, B.; Angelo, D.D. Case Study: Metropolitan Water Board MWB Eastern Pump Station; Siewert Equipment: New York, NY, USA, 2017. [Google Scholar]
- Viking Pump Inc. Efficiency and Life-Cycle-Cost Calculation; PumpSchool: Cedar Falls, IA, USA, 2007; Available online: https://www.pumpschool.com/applications/Energy.pdf (accessed on 24 October 2020).
- Application Programming Interface (API). UN Comtrade Analytics; UN Comtrade Database; United Nations Statistics Division: New York, NY, USA, 2019. [Google Scholar]
- Met-Pro Global Pump Solutions, Pump Life Cycle Cost Calculator; CECO Environmental: Telford, PA, USA, 2019.


| Model | Equation | Parameters |
|---|---|---|
| Walker et al. [6] | m = −10 K will be a function of particle concentration, density, size, etc. CF = Circularity factor | |
| Xie et al. [22] | M = Mass loss and t is time Values of A and B are calculated using the least square fitting method from the test data. | |
| Tang et al. [23] | W is the weight loss rate, Wtotal is the mass of material before the test, Werosion is the mass of material after erosion test and A is the affected area of polished surface. | |
| Aponte et al. [24] | NE is the dimensionless normalized erosion, Er is the erosion rate in kg/s, Vj is the average jet velocity in m/s, Ao is the cross-sectional area of the jet’s outlet, C is the sand concentration and ρH2O is the water density in kg/m3. | |
| H. Liu et al. [25] | Vm is the mixture fluid velocity, which equals to the summation of superficial gas velocity (Vsg) and superficial liquid velocity (Vsl); R is the elbow curvature radius. |
| Ref. | Author | Objective | Optimization Methods | Algorithm Based on | Input for the Algorithm |
|---|---|---|---|---|---|
| [58] | Olszewski | minimization of power consumption | genetic algorithm(GENOCOP) | (C++) | pressure and flow rate |
| [61] | Ramasamy and Ganesan | reduction in power consumption | geometric and flow modifications | ------ | blade thickness, blade angle |
| [62] | Heo et al. | to increase total efficiency | Design optimization | Surrogate models | blade hub inlet angle, hub contours, blade outlet angle, and blade angle profile |
| [64] | Zhang et al. | increase efficiency and reduce required net positive suction head | Multi-objective optimization | Non-dominated Sorting Genetic Algorithm II (NSGA II) and Multi-Objective Evolutionary Algorithm based on Decomposition (MOEA/D) | blade angles and hub radii |
| [67] | Wang et al. | minimize energy losses | ELM-CFD optimization | ------- | disk friction, volumetric leakage, interstage leakage, hydraulic losses |
| [68] | Kim et al. | efficiency and pressure rise | hybrid multi-objective evolutionary optimization | surrogate models using Latin hyperbolic curve | location of splitter, and the height ratio |
| Study Title | Reduction Methodology | Remarks |
|---|---|---|
| Upstream swirl-induction for reduction of erosion damage from slurries in pipeline bends | Swirl flow resulted in lower particle impingement and particle scatter by utilizing most recent erosion models in order to reduce erosion rate | This technique is used by many investigators and mature enough now |
| Fluid-induced rotor dynamic forces on a whirling centrifugal pump | Positive whirl ratio has always a destabilizing effect on cavitation and leads to reduction in wear | The technique is effective and found in several studies |
| The influence of micro grooves on the parameters of the centrifugal pump impeller | CP impeller with micro blades/micro grooves reduced the slurry erosion and enhanced the CP efficiency | The work is novel and recent but at the preliminary stage |
| A novel experimental facility for measuring internal flow of Solid-liquid two-phase flow in a centrifugal pump by PIV | Geometrical changes like 6% cutwater gap and 0.64% diametral snubber of the impeller diameter, 30⁰ stagger in vane arrangement, and 100% sidewall clearance all are done | A porous inverted cone was designed to produce shear velocity difference in different swirl flow layer produce mixing effect which is a novel technique |
| Multi-objective optimization of double suction centrifugal pump using Kriging metamodels | Combination of simulations and experiments is used to reduce required net positive suction head (NPSHr) (which leads to cavitation reduction) and to enhance the efficiency | Latest algorithms are utilized; optimal values of design variables are identified |
| The effect of fluid viscosity on the erosion wear behavior of Ti (C,N)-based cermet’s | Fluid viscosity increases the solid erodent’s motion and decreases the impact energy, which results in the reduction of erosion rate | The technique is new and effective but the real time fluids used in industry are not always and much viscous |
| Simulation of turbulent flow through tarbela dam tunnel 3 | Increased the particle mass loading to increase penetration ratio which reduces the inter-particle collisions and consequently reduces erosion reduction | It needs particle concentration optimization which is difficult to handle |
| Symbol | Description |
|---|---|
| Cic | initial costs, purchase price (pump, system, pipe, auxiliary services) |
| Cin | installation and commissioning cost (including training) |
| Co | operation costs (labor cost of normal system supervision) |
| Ce | energy costs (predicted cost for system operation, including pump driver, controls, and any auxiliary services) |
| Cm | maintenance and repair costs (routine and predicted repairs) |
| Cdo | downtime costs (loss of production) |
| Cen | environmental costs (contamination from pumped liquid and auxiliary equipment) |
| Cd | decommissioning/disposal costs (including restoration of the local environment and disposal of auxiliary services) |
| Energy Cost (USD) | ||
| Pump Operating without Slurry | Pump Operating with Slurry | |
| Pump life (Years) | 10 | 10 |
| Annual usage (Hours) | 3640 | 3640 |
| Pump efficiency (%) | 85 | 70 |
| Motor efficiency (%) | 75 | 67.5 |
| Cost (USD)/kWh | 0.0473 | 0.0473 |
| Cost over lifetime (USD) | 13,244 | 17,868 |
| Installation Cost (USD) | ||
| Foundation construction | 150 | 150 |
| Alignment | 60 | 60 |
| Piping connections | 115 | 125 |
| Electrical connections | 80 | 90 |
| Start-up | 50 | 65 |
| Testing | 45 | 75 |
| Total installation cost | 500 | 565 |
| Maintenance and Repair Cost (USD) | ||
| Preventive maintenance | 500 | 500 |
| Emergency maintenance | 600 | 700 |
| Total maintenance cost | 1100 | 1200 |
| Cost Parameter | Amount Incurred for Normal Use/USD | Amount Incurred for Slurry Usage/USD |
|---|---|---|
| Initial cost | 2000 | 2000 |
| Installation | 500 | 565 |
| Operation costs | 1200 | 2400 |
| Energy costs | 13,244 | 17,868 |
| Maintenance costs | 1100 | 1200 |
| Downtime costs | 1000 | 1200 |
| Environmental costs | 100 | 100 |
| Decommissioning/disposal costs | 200 | 200 |
| LCC/USD | 19,344 | 25,533 |
Publisher’s Note: MDPI stays neutral with regard to jurisdictional claims in published maps and institutional affiliations. |
© 2021 by the authors. Licensee MDPI, Basel, Switzerland. This article is an open access article distributed under the terms and conditions of the Creative Commons Attribution (CC BY) license (http://creativecommons.org/licenses/by/4.0/).
Share and Cite
Noon, A.A.; Jabbar, A.U.; Koten, H.; Kim, M.-H.; Ahmed, H.W.; Mueed, U.; Shoukat, A.A.; Anwar, B. Strive to Reduce Slurry Erosion and Cavitation in Pumps through Flow Modifications, Design Optimization and Some Other Techniques: Long Term Impact on Process Industry. Materials 2021, 14, 521. https://doi.org/10.3390/ma14030521
Noon AA, Jabbar AU, Koten H, Kim M-H, Ahmed HW, Mueed U, Shoukat AA, Anwar B. Strive to Reduce Slurry Erosion and Cavitation in Pumps through Flow Modifications, Design Optimization and Some Other Techniques: Long Term Impact on Process Industry. Materials. 2021; 14(3):521. https://doi.org/10.3390/ma14030521
Chicago/Turabian StyleNoon, Adnan Aslam, Absaar Ul Jabbar, Hasan Koten, Man-Hoe Kim, Hafiz Waqar Ahmed, Umair Mueed, Ahmad Adnan Shoukat, and Bilal Anwar. 2021. "Strive to Reduce Slurry Erosion and Cavitation in Pumps through Flow Modifications, Design Optimization and Some Other Techniques: Long Term Impact on Process Industry" Materials 14, no. 3: 521. https://doi.org/10.3390/ma14030521