
Preparation and Experimental Investigations of Low-Shrinkage Commercial Concrete for Tunnel Annular Secondary Lining Engineering
 ,
,
Abstract
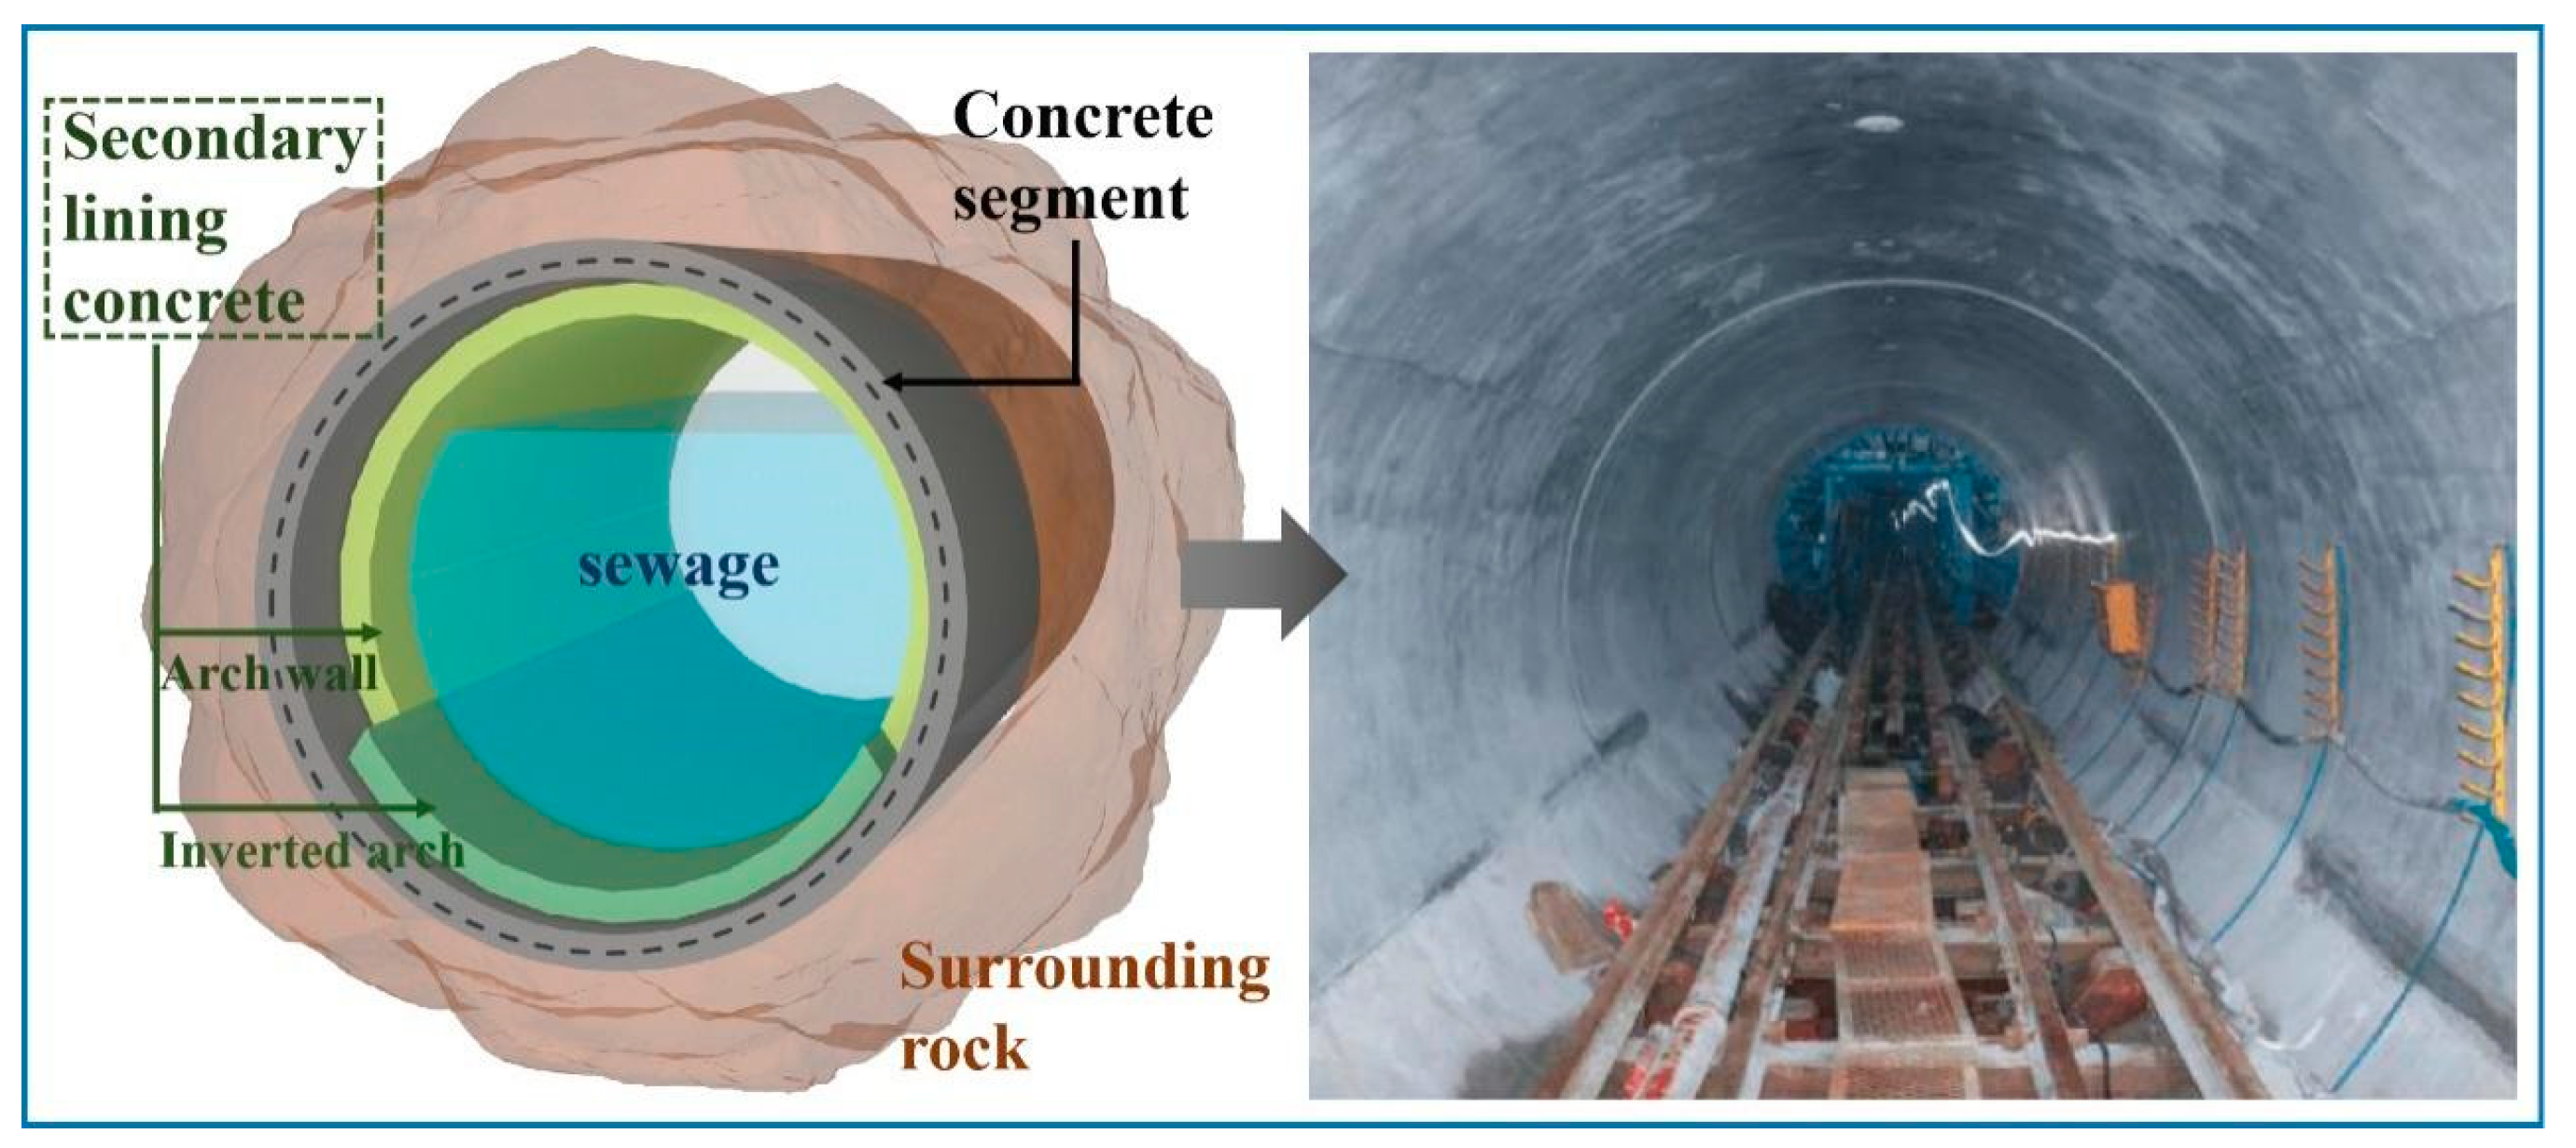
:1. Introduction
2. Experimental Programs
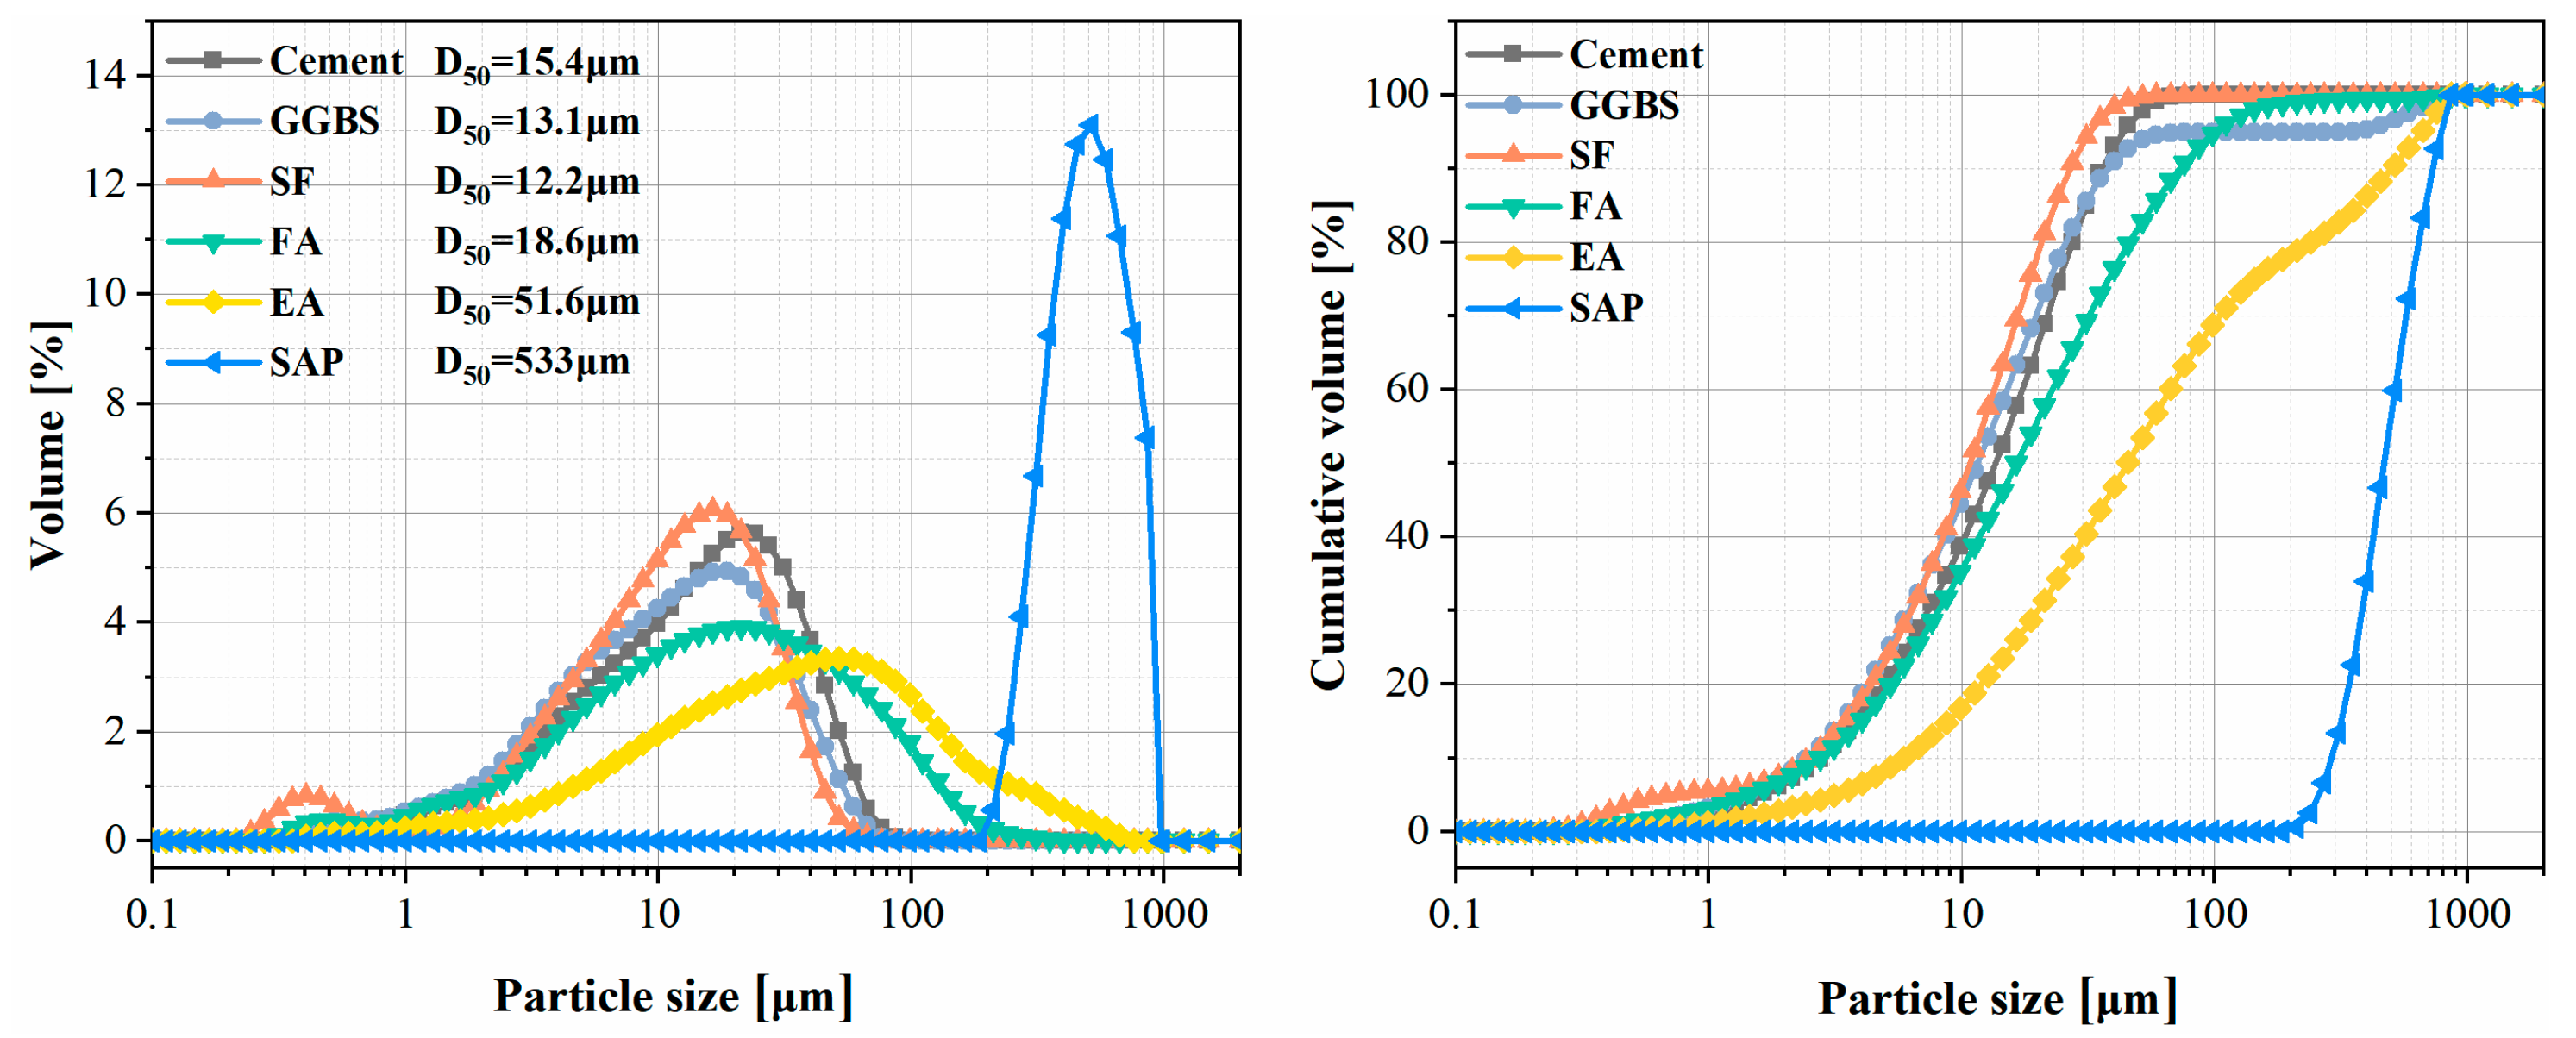
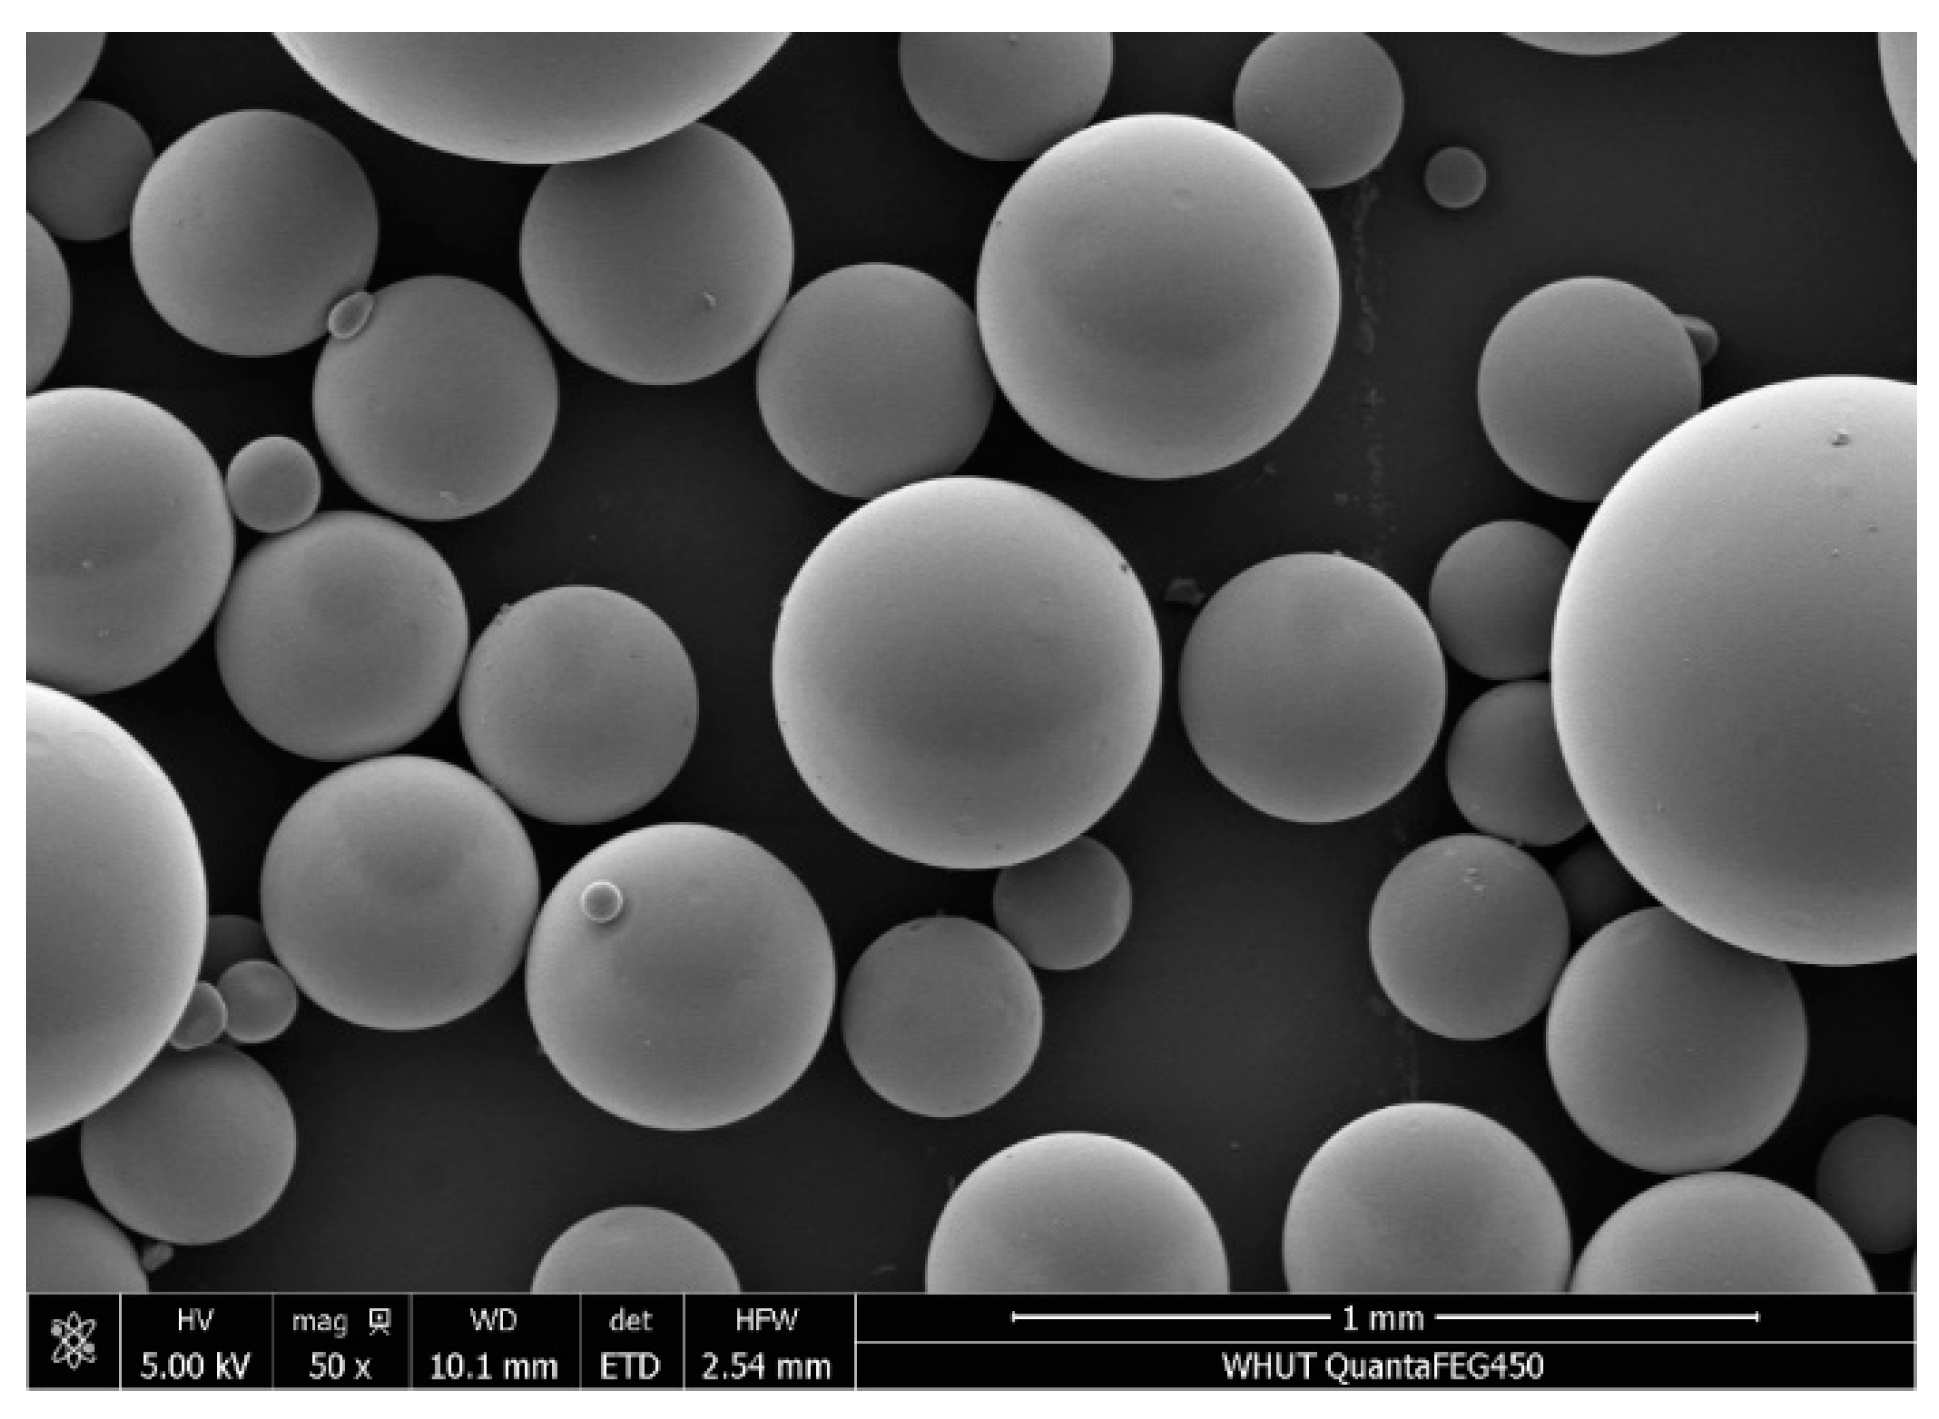
2.1. Materials
2.2. Proportions of Concrete Mix
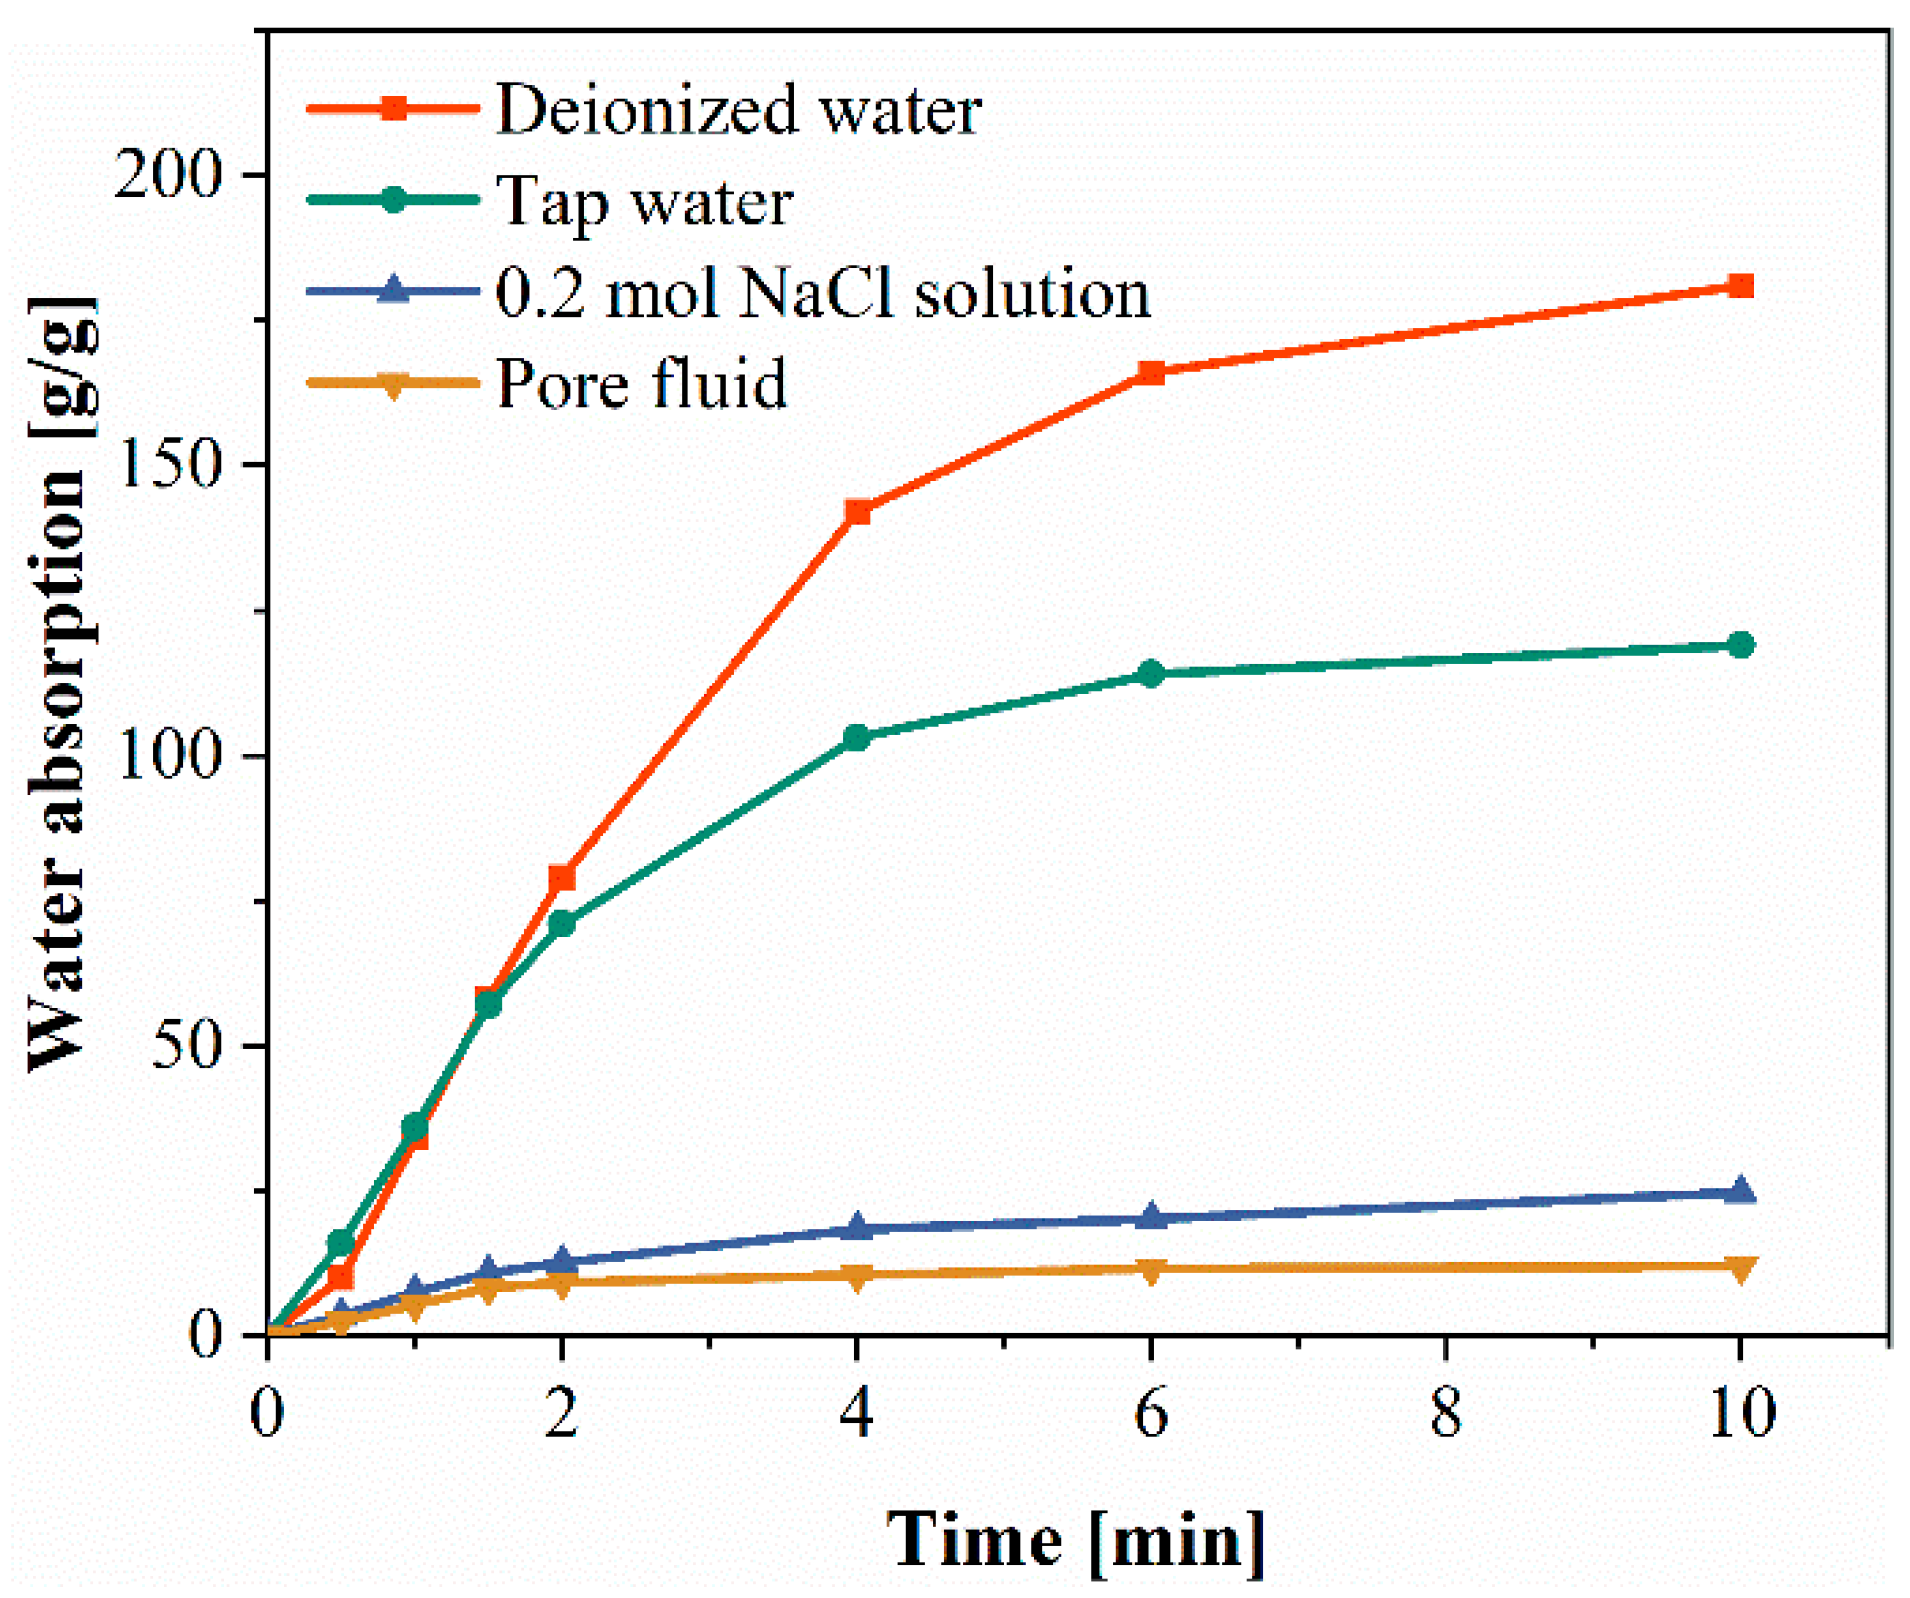
2.3. Water Absorption of SAP
2.4. Experimental Methods
2.4.1. Rheological Properties
2.4.2. Hydration Heat Evaluation
2.4.3. Compressive Strength
2.4.4. Autogenous Shrinkage Test
2.4.5. Capillary Water Absorption
2.4.6. Chloride Permeability Test
2.4.7. Mercury Intrusion Porosimetry (MIP)
3. Results and Discussion
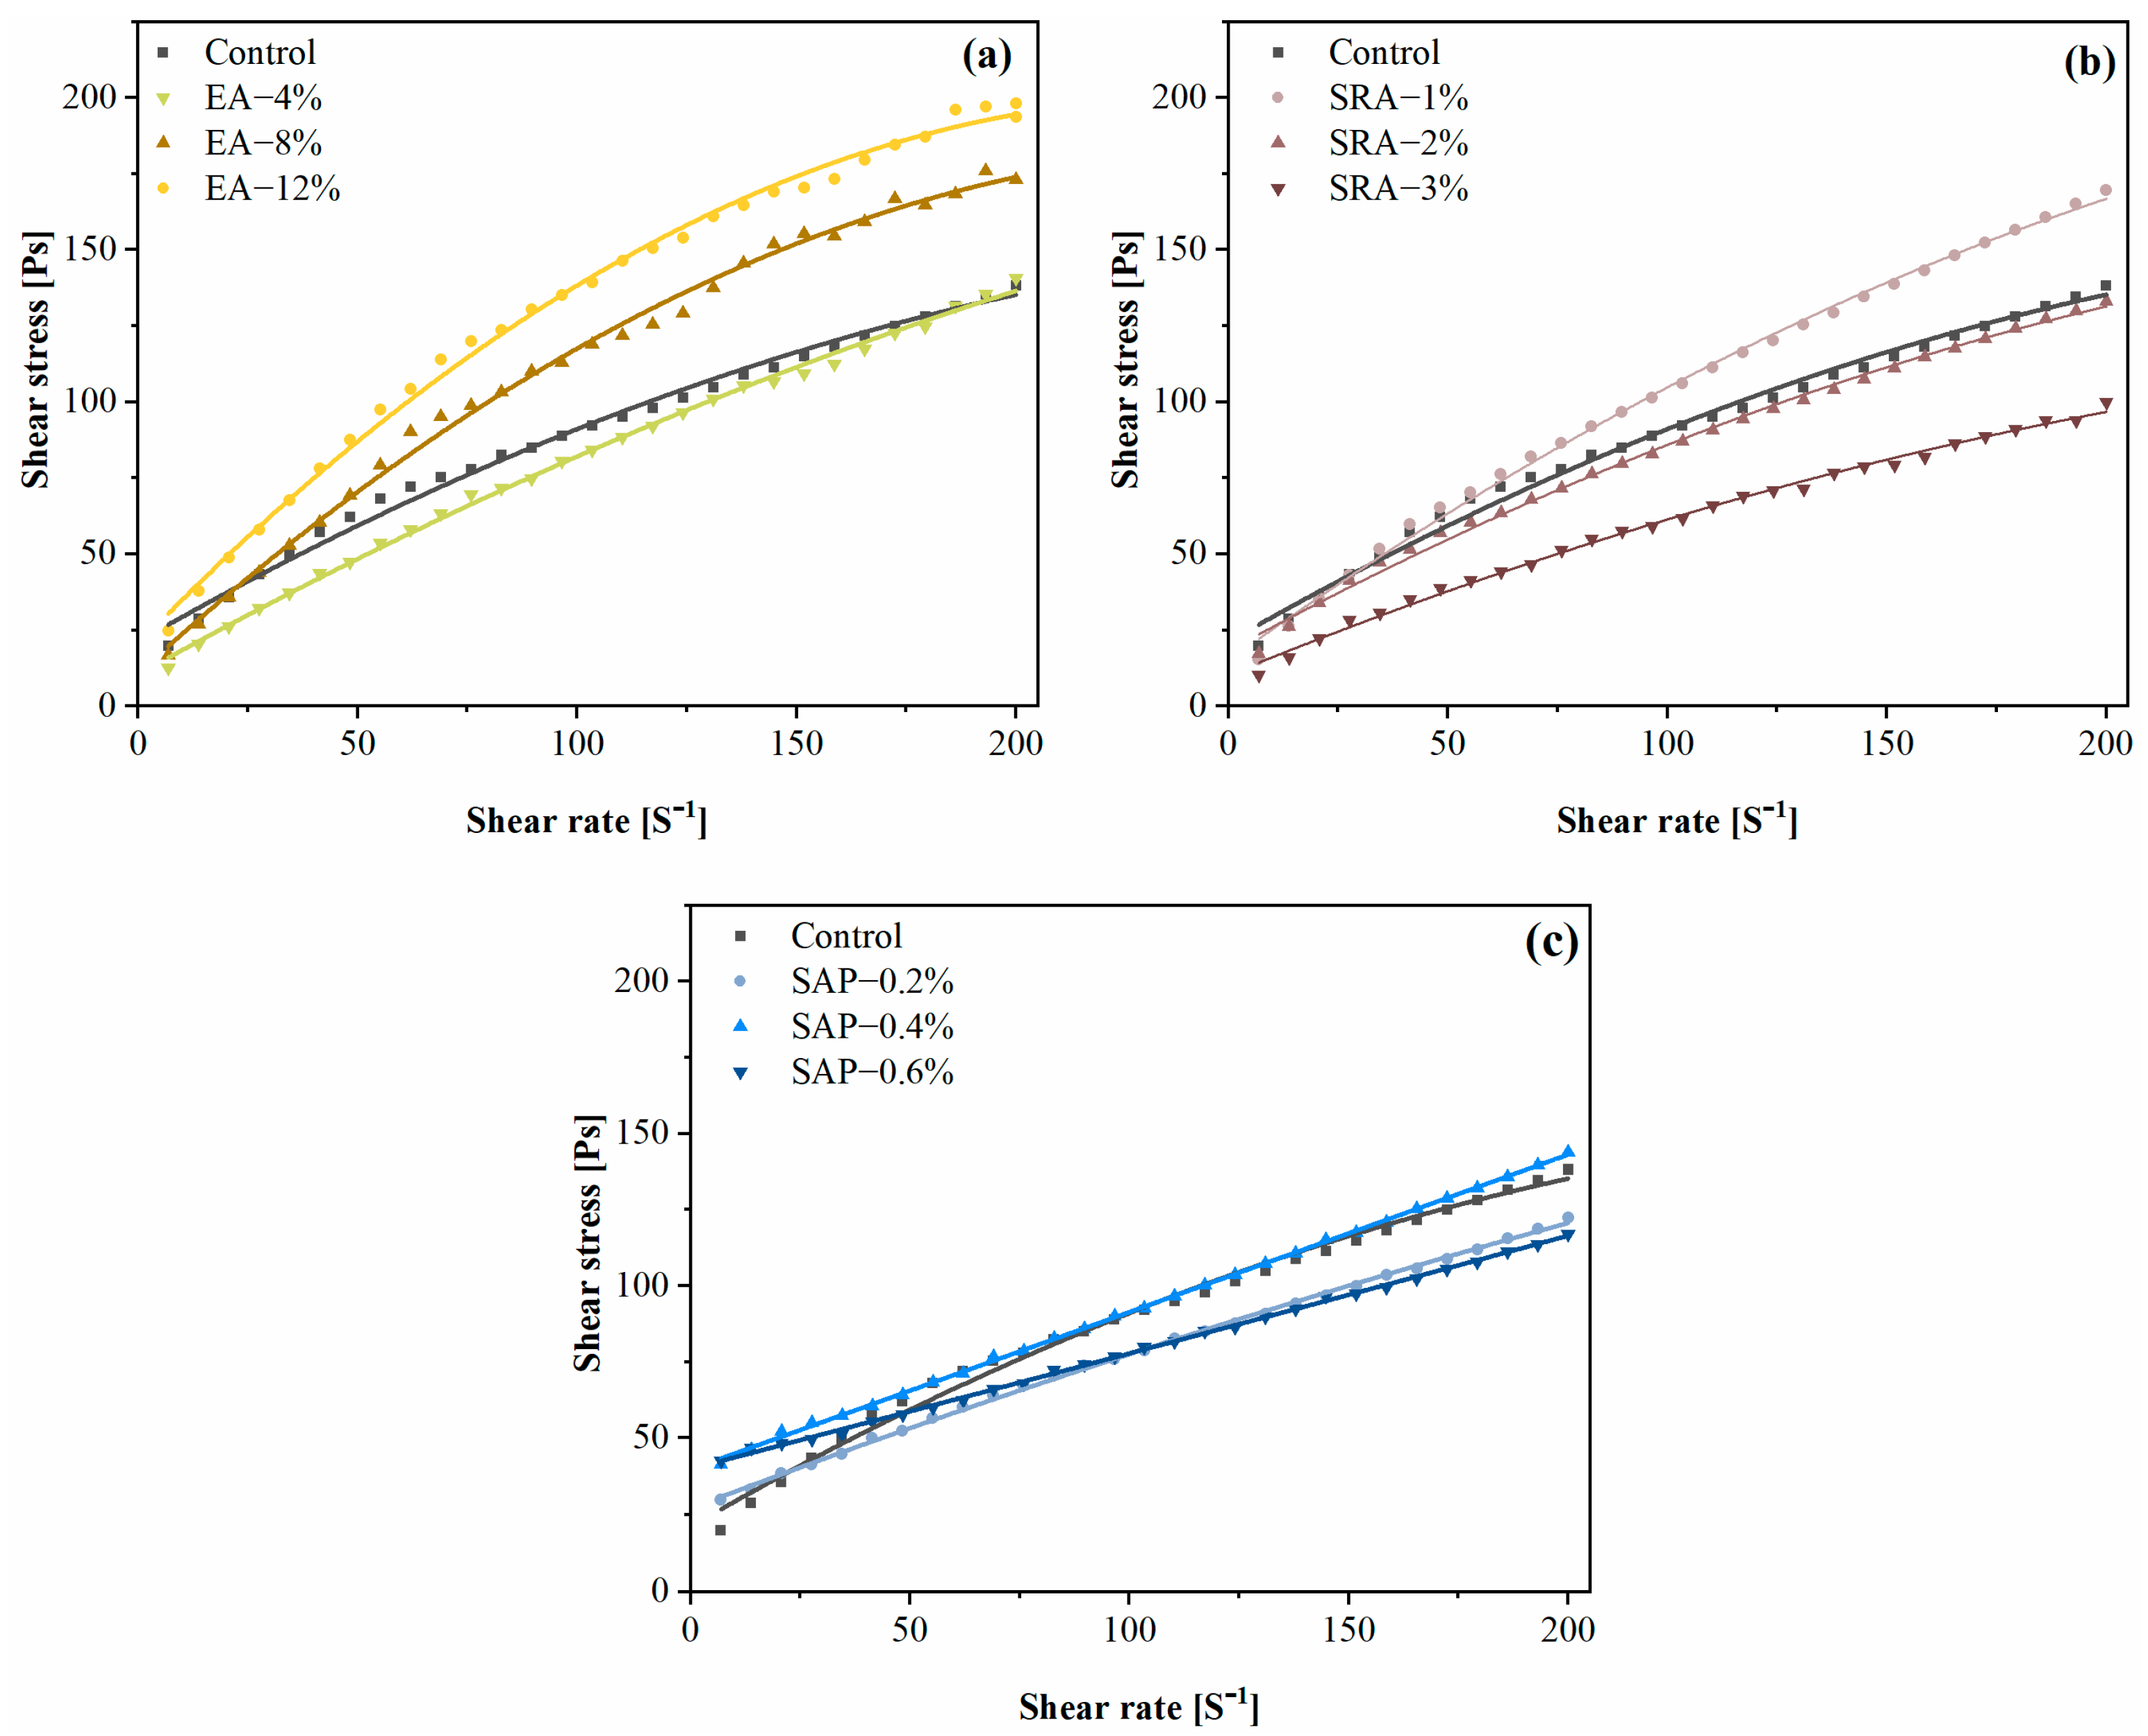
3.1. Rheological Property
3.2. Hydration Heat
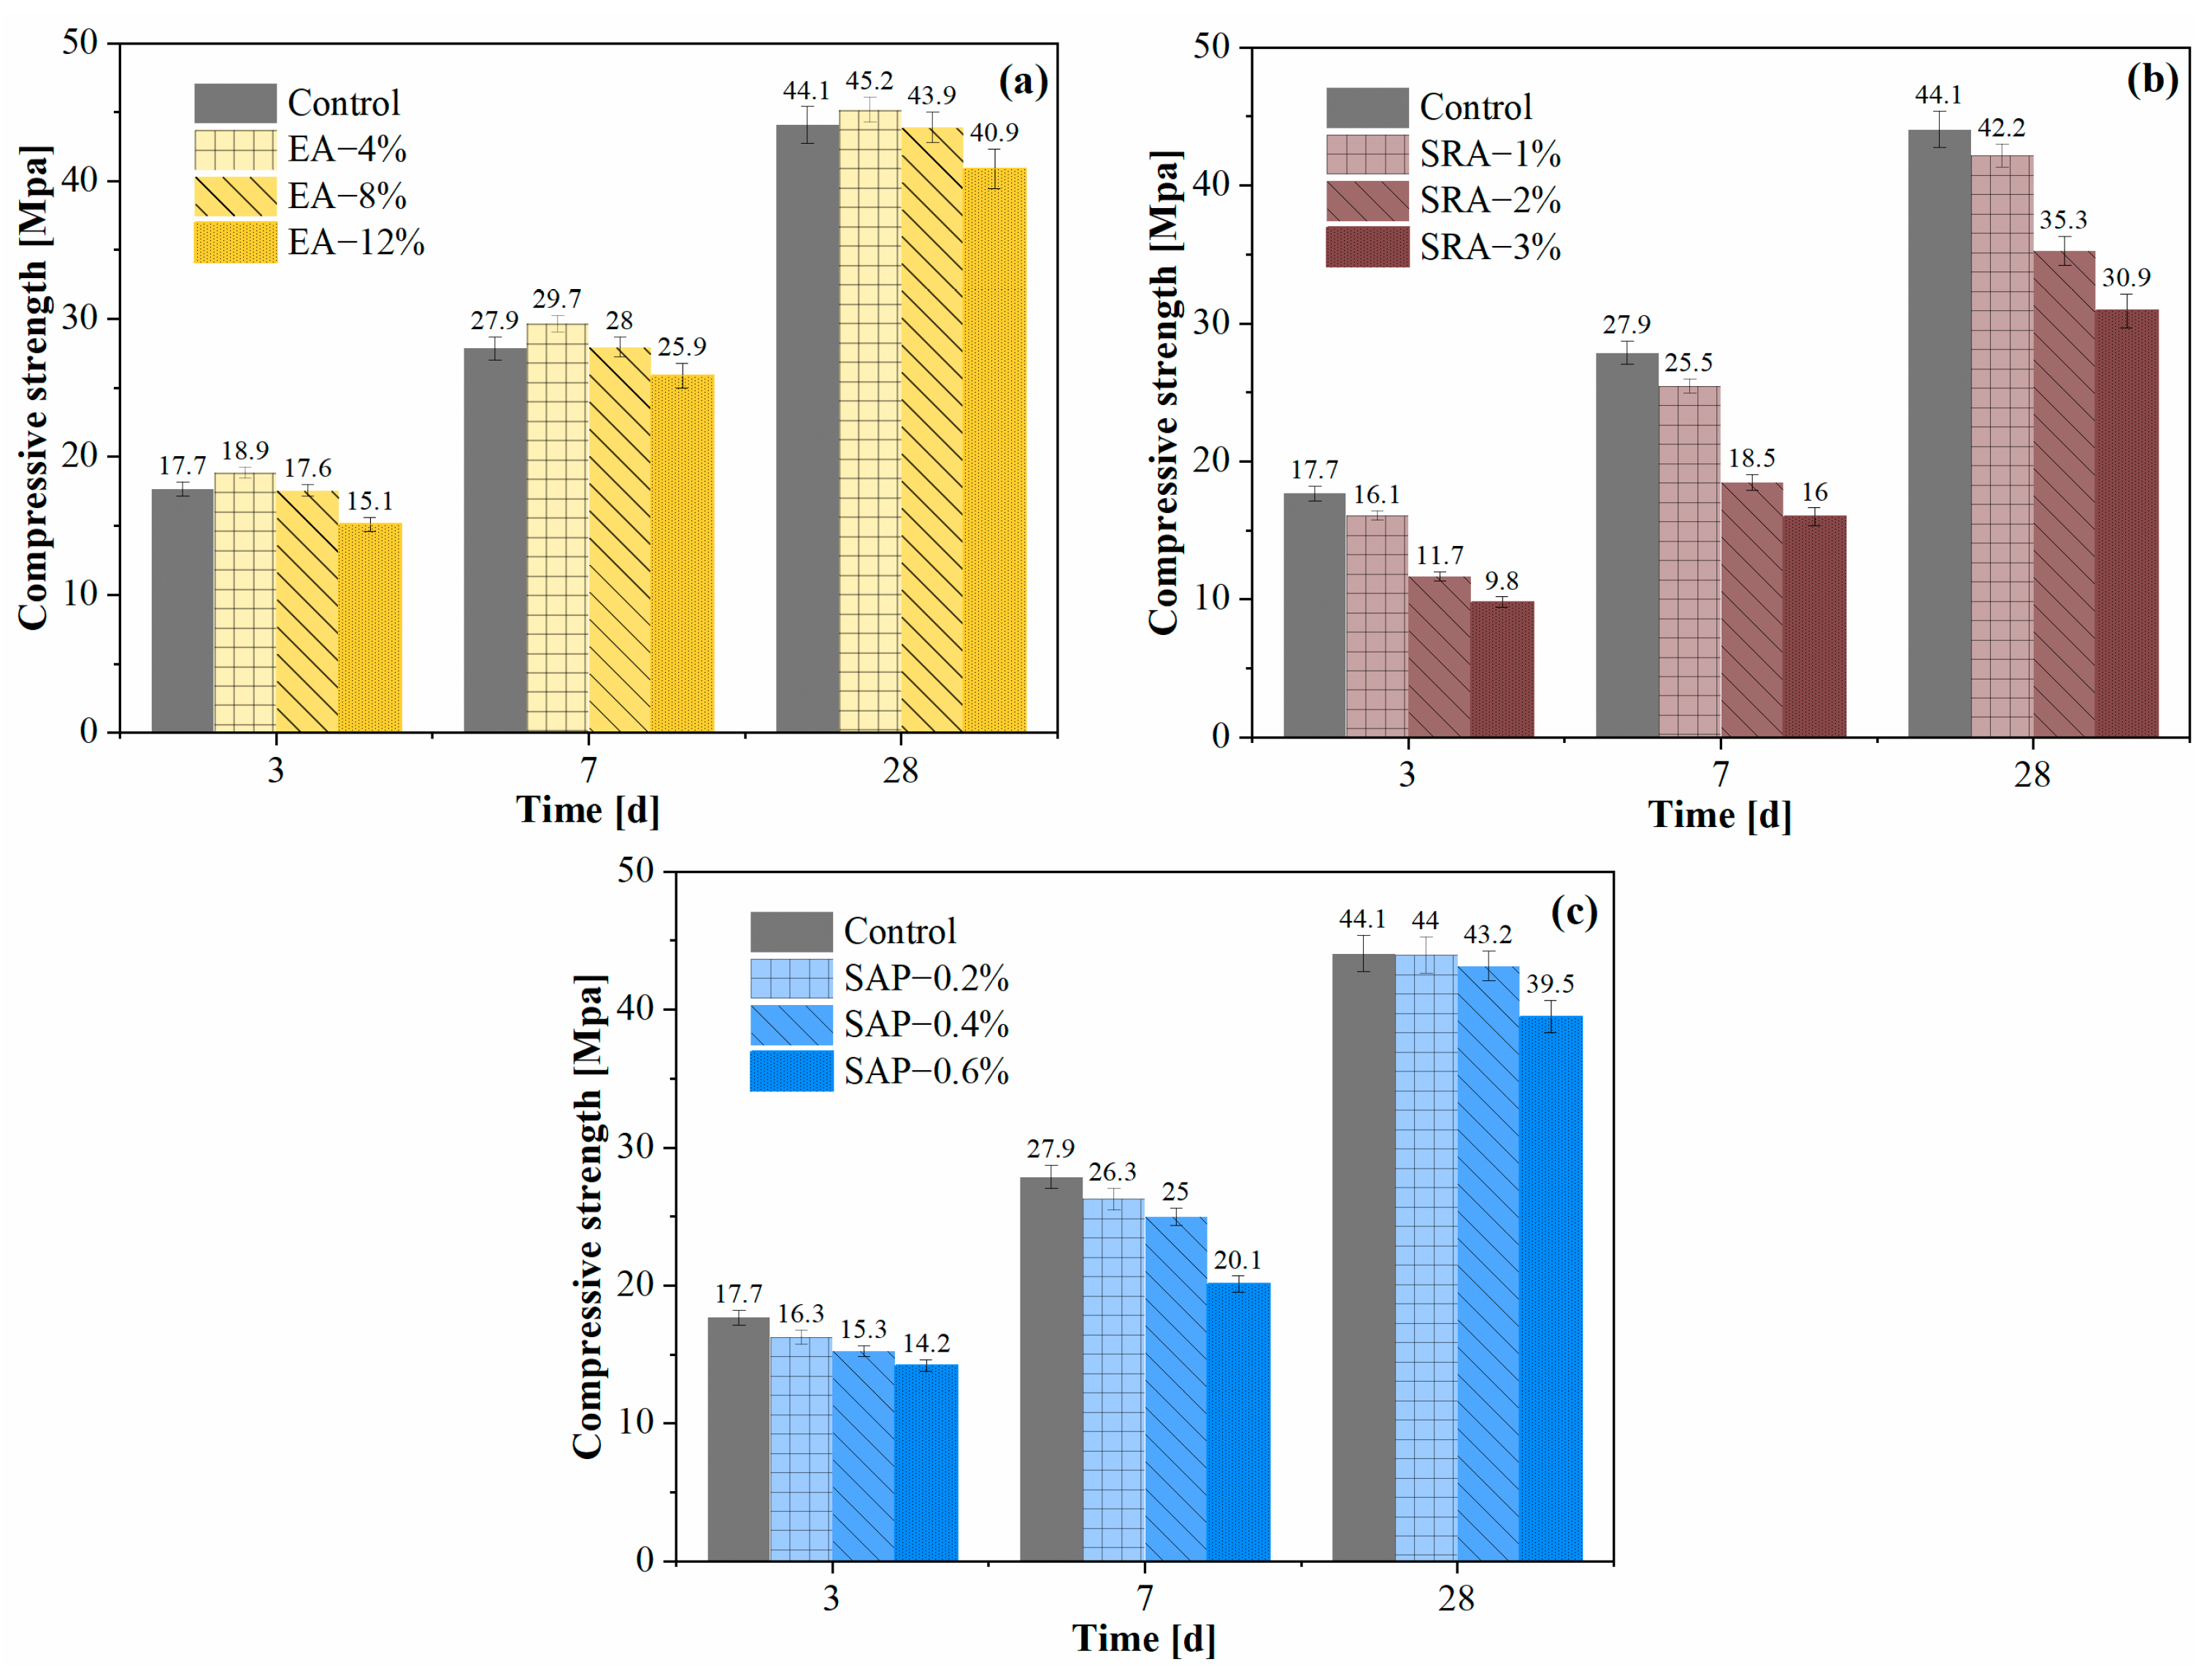
3.3. Compressive Strength
3.4. Autogenous Shrinkage
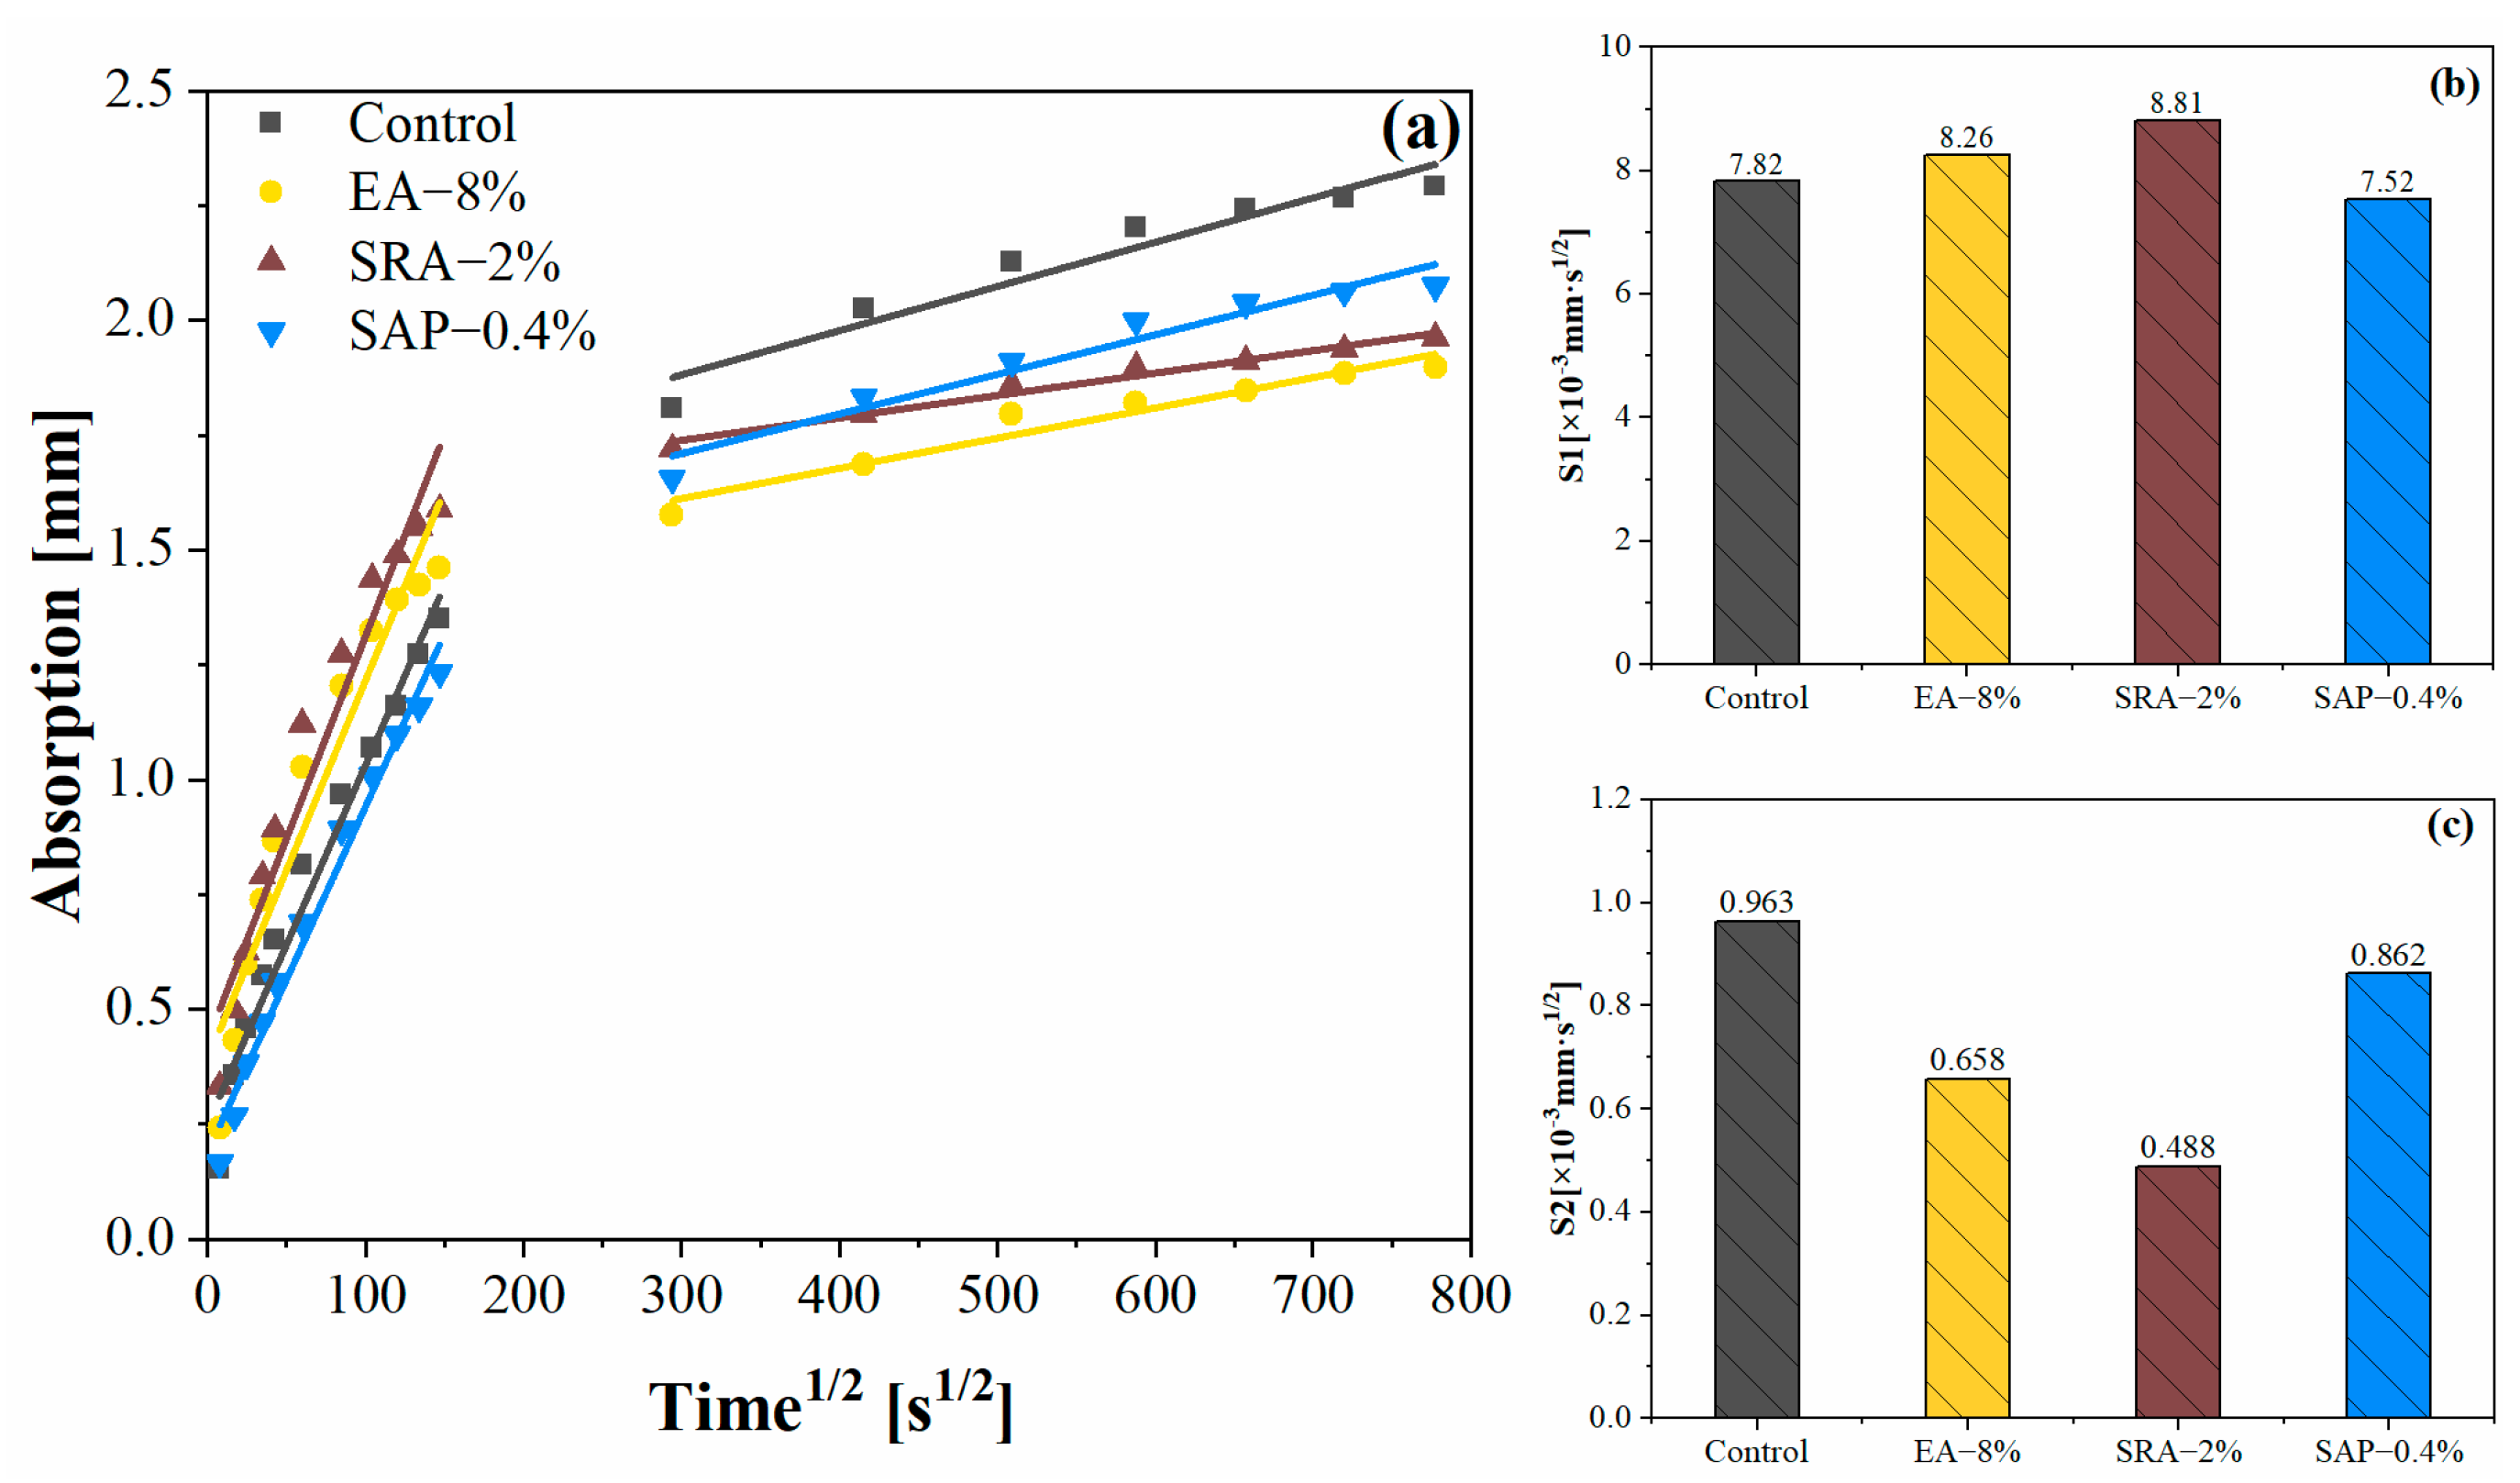
3.5. Capillary Water Absorption
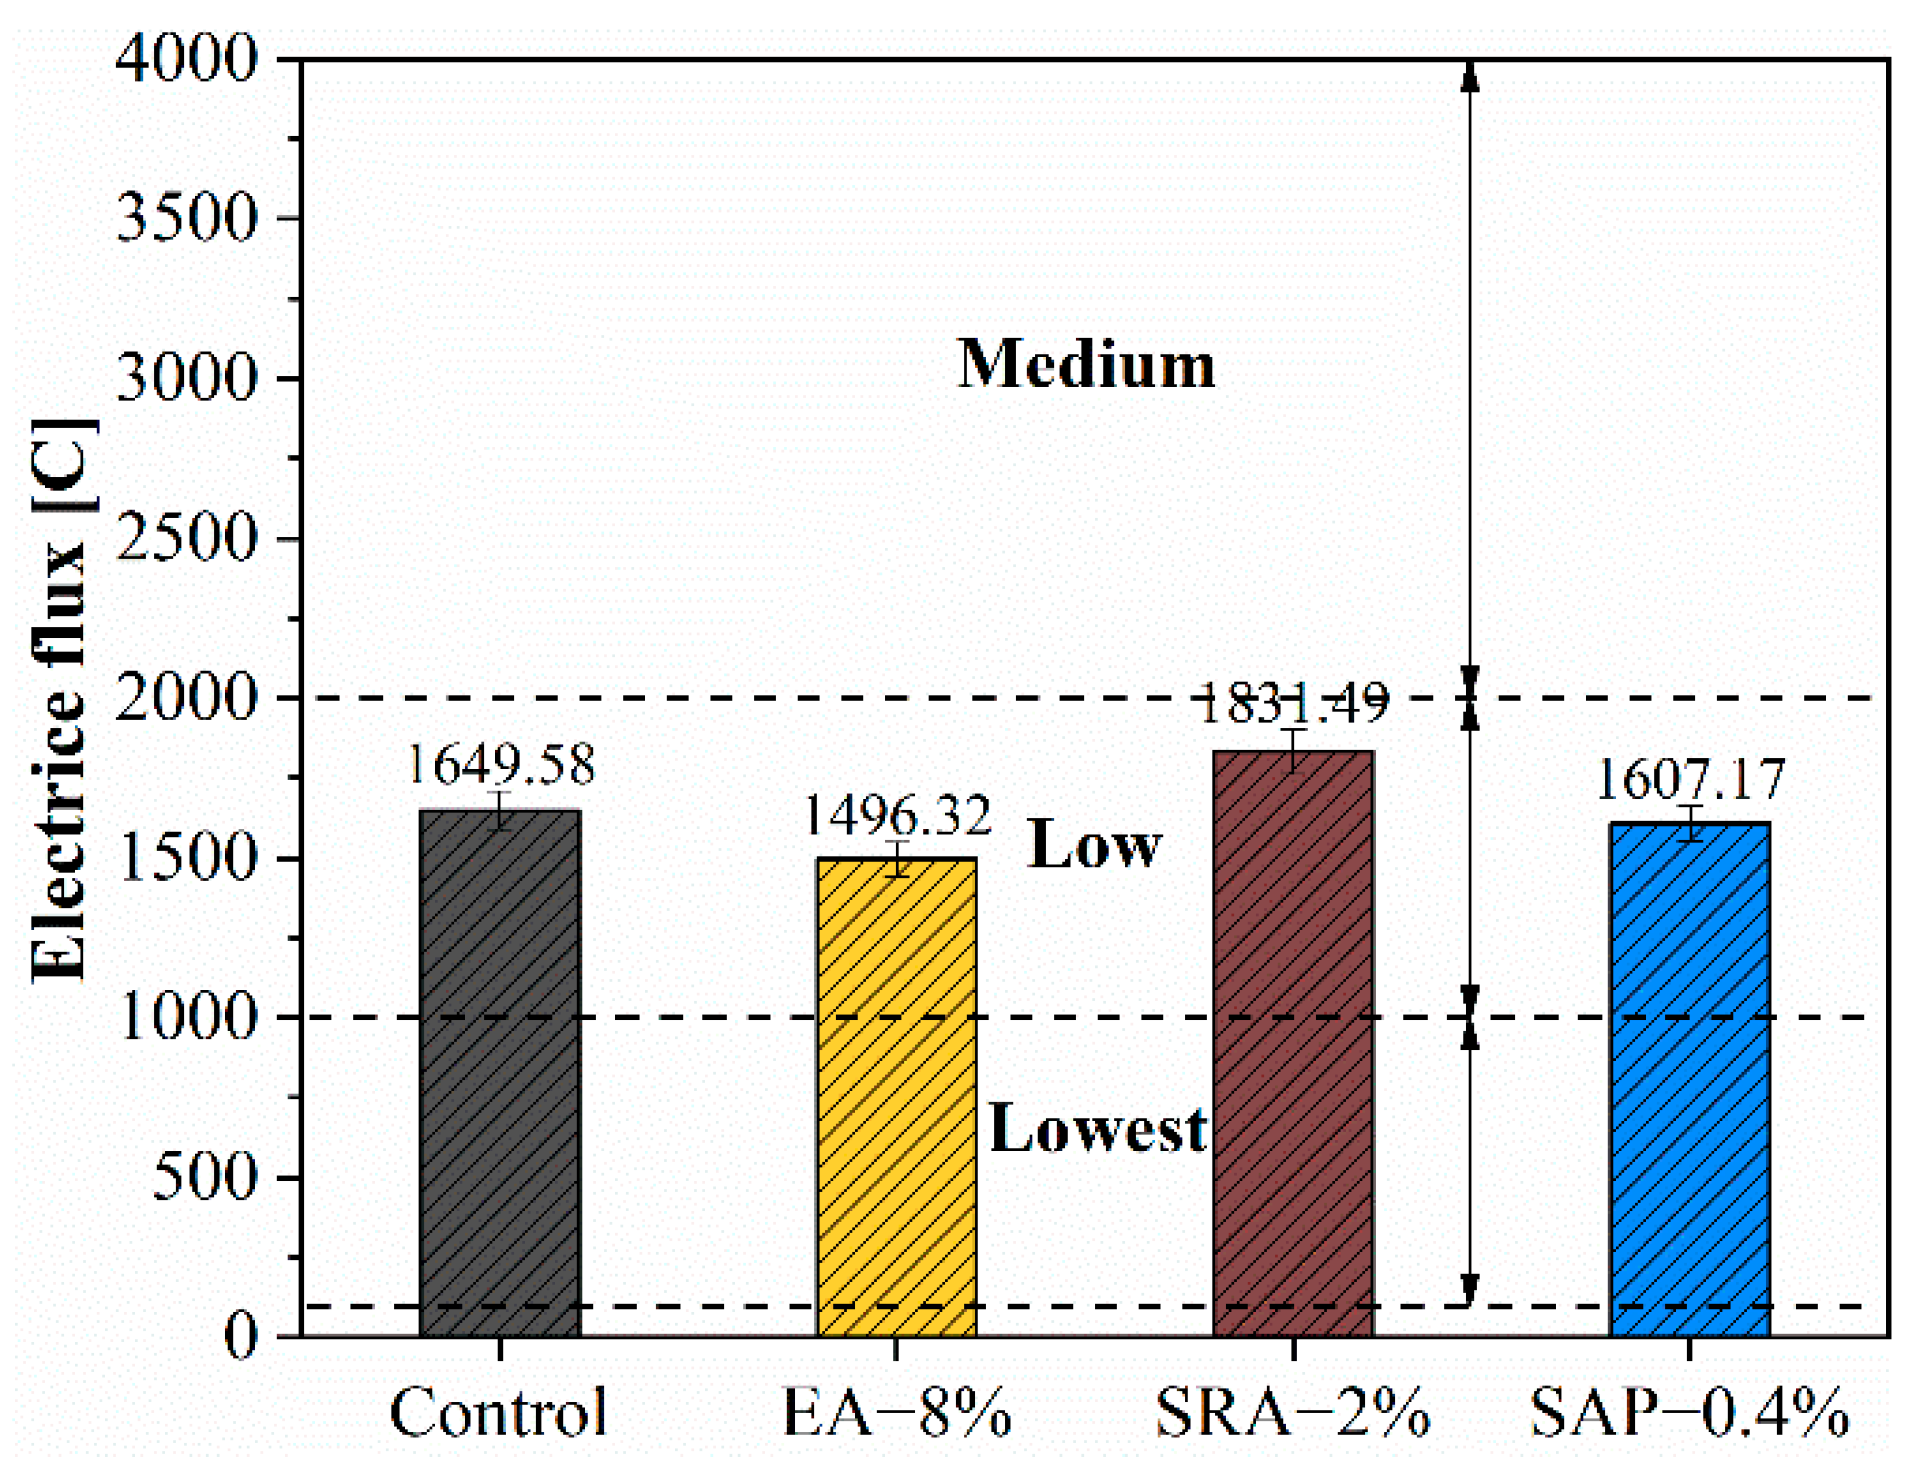
3.6. Chloride Permeability Test
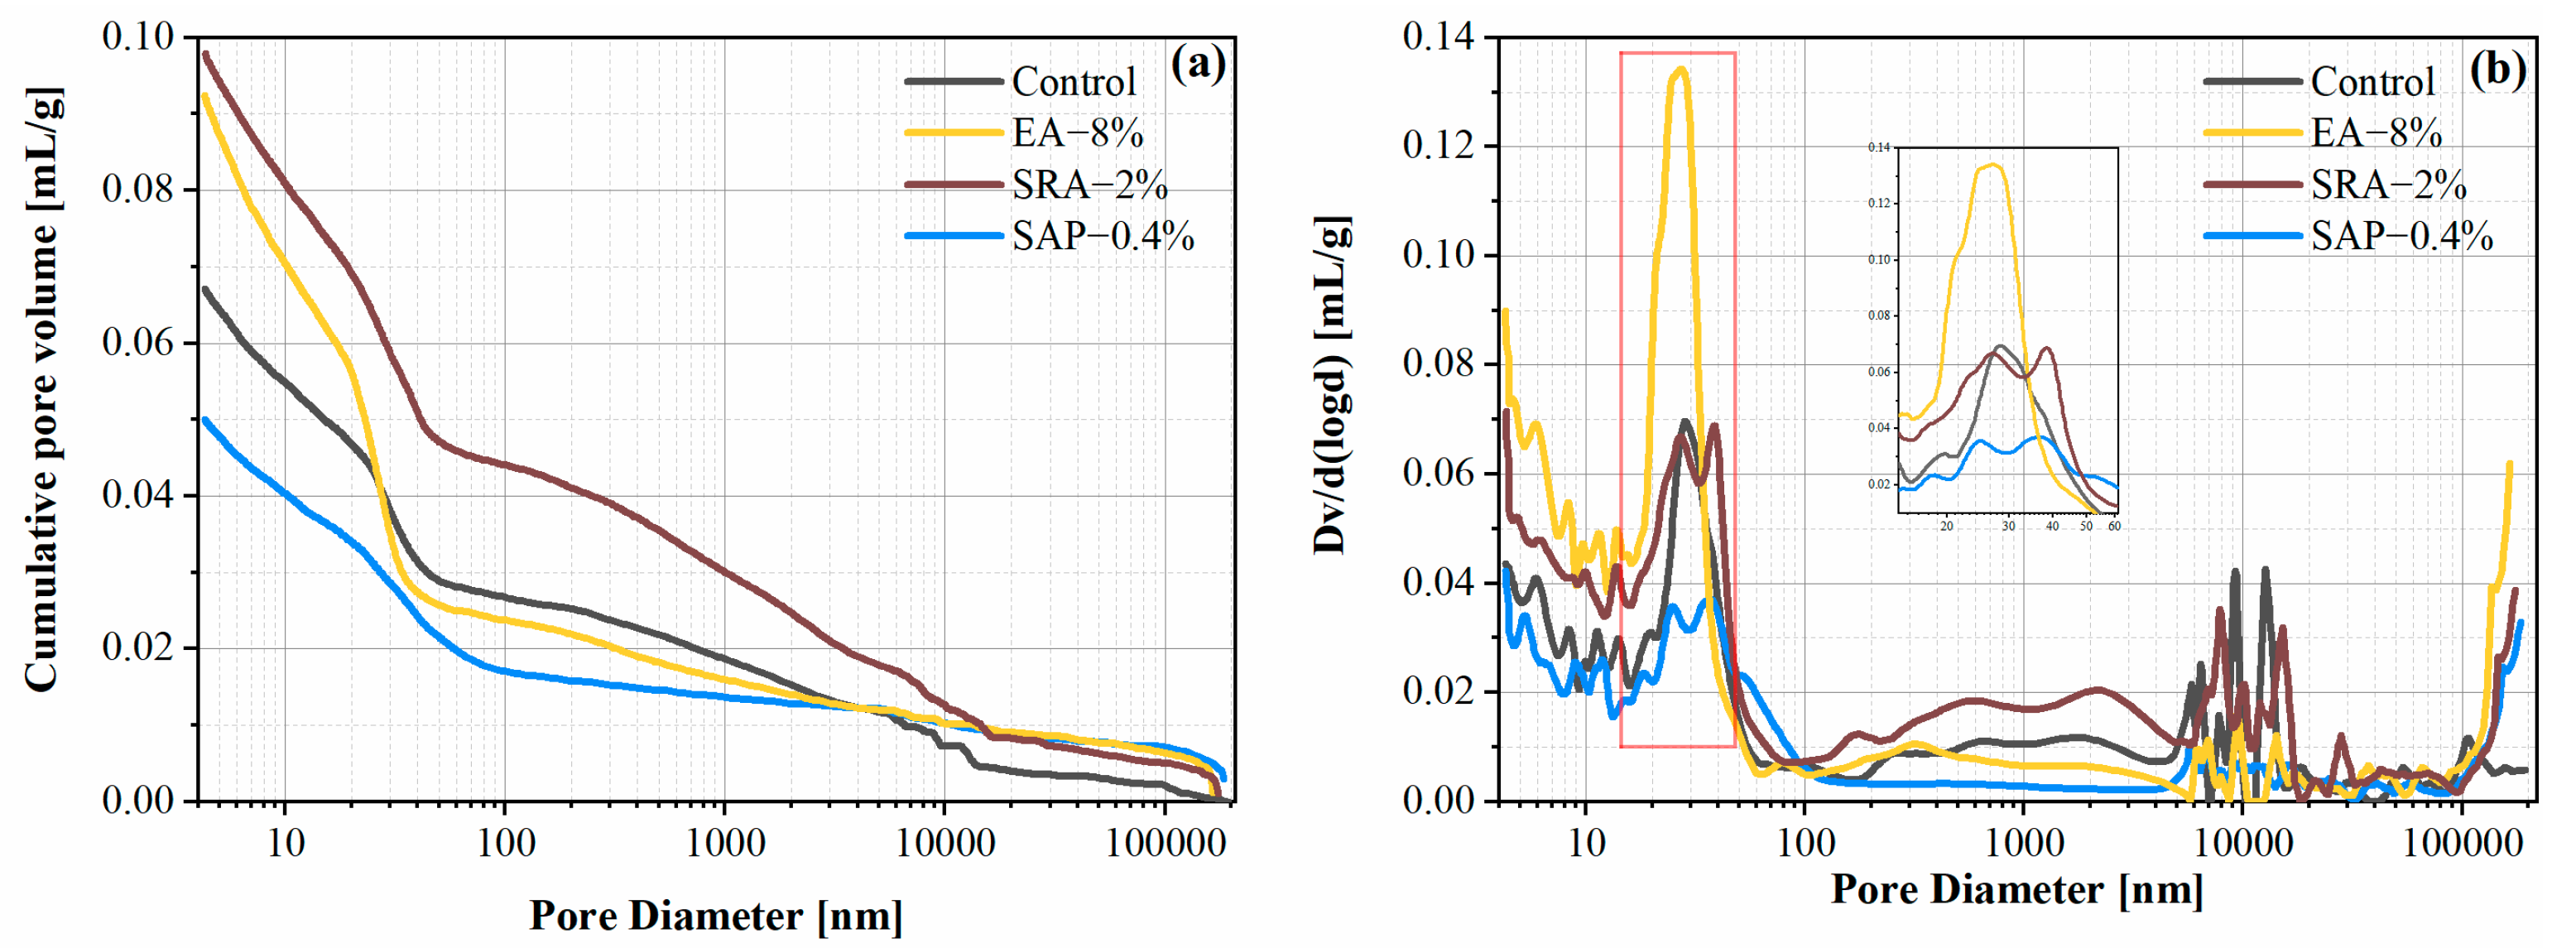
3.7. Pore Structure
4. Conclusions
- EA, SRA, and SAP lead to different hydration heat release behaviors in commercial concrete. EA increases the degree of hydration and increases the total amount of exothermic heat of cementitious binder, while SAP and SRA have lower peaks and total hydration heat. EA, SAP, and SRA have a good compensation effect on autogenous shrinkage of commercial concrete. Among them, SRA-3% has the most obvious shrinkage reduction rate of 79.6%.
- The negative effect of SRA and SAP on the early compressive strength of concrete is increased with the dosage. The compressive strength of SRA group is decreased by up to 44.6% at 3 d. However, the appropriate amount of SAP can equalize with the control group at 28 d. On the contrary, a moderate amount of EA has an increased effect on compressive strength. EA and SAP reduce the content of 100 nm–10 μm pores in commercial concrete by 49.5% and 54.2%.
- The incorporation of EA can reduce the total capillary water absorption and improve the resistance to chloride ion penetration, while SRA has the opposite effect to EA. SAP group is close to the control group in terms of total capillary water uptake and resistance to chloride ion permeation.
- The incorporation of EA can bring about better strength in the early stage and has the effect of improving the pore structure and enhancing durability performance. However, the addition of a large amount will produce an expansion effect and affect the volume stability of the concrete. SRA has an excellent ability to delay shrinkage, as well as the effect of reducing the rate of the heat of hydration, while it has a great influence on the mechanical properties. SAP compensates for the shrinkage with better late compressive strength and delays the hydration rate.
- Compared with SRA and SAP, EA is more suitable for projects that require early strength and has better application value for secondary lining projects. SRA can effectively reduce the negative effects of concrete shrinkage, but the resulting decrease in strength will affect the subsequent duration of the secondary lining project. SAP as a new material applied to fill the shrinkage and anti-cracking still has more need for improvement. Under the premise of strict requirements for the compressive strength of concrete, SAP is a better choice for secondary lining projects with higher requirements for early hydration exotherm when choosing shrinkage reduction components.
Author Contributions
Funding
Institutional Review Board Statement
Informed Consent Statement
Data Availability Statement
Acknowledgments
Conflicts of Interest
References
- Broere, W. Urban underground space: Solving the problems of today’s cities. Tunn. Undergr. Space Technol. 2016, 55, 245–248. [Google Scholar] [CrossRef] [Green Version]
- Volchko, Y.; Norrman, J.; Ericsson, L.O.; Nilsson, K.L.; Markstedt, A.; Öberg, M.; Mossmark, F.; Bobylev, N.; Tengborg, P. Subsurface planning: Towards a common understanding of the subsurface as a multifunctional resource. Land Use Policy 2020, 90, 104316. [Google Scholar] [CrossRef]
- Aygar, E.B.; Gokceoglu, C. A special support design for a large-span tunnel crossing an active fault (T9 Tunnel, Ankara–Sivas High-Speed Railway Project, Turkey). Environ. Earth Sci. 2021, 80, 37. [Google Scholar] [CrossRef]
- Kolymbas, D. The New Austrian Tunnelling Method. In Tunnelling and Tunnel Mechanics: A Rational Approach to Tunnelling; Springer: Heidelberg, Germany, 2005; pp. 171–175. [Google Scholar]
- Vogel, F.; Sovjak, R.; Peskova, S. Static response of double shell concrete lining with a spray-applied waterproofing membrane. Tunn. Undergr. Space Technol. 2017, 68, 106–112. [Google Scholar] [CrossRef]
- Sun, Z.; Zhang, D.; Fang, Q.; Dui, G.; Tai, Q.; Sun, F. Analysis of the interaction between tunnel support and surrounding rock considering pre-reinforcement. Tunn. Undergr. Space Technol. 2021, 115, 104074. [Google Scholar] [CrossRef]
- Chiaia, B..; Fantilli, A.P.; Vallini, P. Evaluation of crack width in FRC structures and application to tunnel linings. Mater. Struct. 2008, 42, 339. [Google Scholar] [CrossRef]
- Cugat, V.; Cavalaro, S.; Bairán, J.; de la Fuente, A. Safety format for the flexural design of tunnel fibre reinforced concrete precast segmental linings. Tunn. Undergr. Space Technol. 2020, 103, 103500. [Google Scholar] [CrossRef]
- Yang, F.; Zhang, C.; Zhou, H.; Liu, N.; Zhang, Y.; Azhar, M.U.; Dai, F. The long-term safety of a deeply buried soft rock tunnel lining under inside-to-outside seepage conditions. Tunn. Undergr. Space Technol. 2017, 67, 132–146. [Google Scholar] [CrossRef]
- Xu, G.; He, C.; Yang, Q.; Wang, B. Progressive failure process of secondary lining of a tunnel under creep effect of surrounding rock. Tunn. Undergr. Space Technol. 2019, 90, 76–98. [Google Scholar] [CrossRef]
- Lawler, J.S.; Zampini, D.; Shah, S.P. Permeability of cracked hybrid fiber-reinforced mortar under load. ACI Mater. J. 2002, 99, 379–385. [Google Scholar]
- Kaufmann, W.; Amin, A.; Beck, A.; Lee, M. Shear transfer across cracks in steel fibre reinforced concrete. Eng. Struct. 2019, 186, 508–524. [Google Scholar] [CrossRef]
- Meda, A.; Rinaldi, Z.; Spagnuolo, S.; Rivaz, B.D.; Giamundo, N. Hybrid precast tunnel segments in fiber reinforced concrete with glass fiber reinforced bars. Tunn. Undergr. Space Technol. 2019, 86, 100–112. [Google Scholar] [CrossRef]
- Zhao, H.; Xiang, Y.; Xie, D.; Xu, W.; Wang, Y.; Li, H.; Tian, Q.; Liu, J. Effects of CaO-based and MgO-based expansion agent, curing temperature and restraint degree on pore structure of early-age mortar. Constr. Build. Mater. 2020, 257, 119572. [Google Scholar] [CrossRef]
- Meddah, M.S.; Suzuki, M.; Sato, R. Influence of a combination of expansive and shrinkage-reducing admixture on autogenous deformation and self-stress of silica fume high-performance concrete. Constr. Build. Mater. 2011, 25, 239–250. [Google Scholar] [CrossRef]
- Zuo, W.; Feng, P.; Zhong, P.; Tian, Q.; Gao, N.; Wang, Y.; Yu, C.; Miao, C. Effects of novel polymer-type shrinkage-reducing admixture on early age autogenous deformation of cement pastes. Cem. Concr. Res. 2017, 100, 413–422. [Google Scholar] [CrossRef]
- Bentz, D.P.; Geiker, M.R.; Hansen, K.K. Shrinkage-reducing admixtures and early-age desiccation in cement pastes and mortars. Cem. Concr. Res. 2001, 31, 1075–1085. [Google Scholar] [CrossRef]
- Almeida, F.C.; Klemm, A.J. Efficiency of internal curing by superabsorbent polymers (SAP) in PC-GGBS mortars. Cem. Concr. Compos. 2018, 88, 41–51. [Google Scholar] [CrossRef]
- Mechtcherine, V.; Secrieru, E.; Schröfl, C. Effect of superabsorbent polymers (SAPs) on rheological properties of fresh cement-based mortars—Development of yield stress and plastic viscosity over time. Cem. Concr. Res. 2015, 67, 52–65. [Google Scholar] [CrossRef]
- Yang, J.; Tang, Y.; He, X.; Su, Y.; Zeng, J.; Ma, M.; Zeng, L.; Zhang, S.; Tan, H.; Strnadel, B. An efficient approach for sustainable fly ash geopolymer by coupled activation of wet-milling mechanical force and calcium hydroxide. J. Clean. Prod. 2022, 372, 133771. [Google Scholar] [CrossRef]
- Liu, Z.; Hansen, W. A geometrical model for void saturation in air-entrained concrete under continuous water exposure. Constr. Build. Mater. 2016, 124, 475–484. [Google Scholar] [CrossRef]
- He, X.; Zheng, Z.; Yang, J.; Su, Y.; Wang, T.; Strnadel, B. Feasibility of incorporating autoclaved aerated concrete waste for cement replacement in sustainable building materials. J. Clean. Prod. 2020, 250, 119455.1–119455.12. [Google Scholar] [CrossRef]
- Fourmentin, M.; Faure, P.; Gauffinet, S.; Peter, U.; Lesueur, D.; Daviller, D.; Ovarlez, G.; Coussot, P. Porous structure and mechanical strength of cement-lime pastes during setting. Cem. Concr. Res. 2015, 77, 1–8. [Google Scholar] [CrossRef]
- Corinaldesi, V. Combined effect of expansive, shrinkage reducing and hydrophobic admixtures for durable self compacting concrete. Constr. Build. Mater. 2012, 36, 758–764. [Google Scholar] [CrossRef]
- Zhang, W.; Lin, H.; Xue, M.; Wang, S.; Ran, J.; Su, F.; Zhu, J. Influence of shrinkage reducing admixtures on the performance of cementitious composites: A review. Constr. Build. Mater. 2022, 325, 126579. [Google Scholar] [CrossRef]
- Liu, J.; Khayat, K.H.; Shi, C. Effect of superabsorbent polymer characteristics on rheology of ultra-high performance concrete. Cem. Concr. Compos. 2020, 112, 103636. [Google Scholar] [CrossRef]
- Scrivener, K.L.; Nonat, A. Hydration of cementitious materials, present and future. Cem. Concr. Res. 2011, 41, 651–665. [Google Scholar] [CrossRef]
- Lothenbach, B.; Zajac, M. Application of thermodynamic modelling to hydrated cements. Cem. Concr. Res. 2019, 123, 105779. [Google Scholar] [CrossRef]
- Chen, B.; Guan, B.; Lu, X.; Tian, B.; Li, Y. Thermal conductivity evolution of early-age concrete under variable curing temperature: Effect mechanism and prediction model. Constr. Build. Mater. 2022, 319, 126078. [Google Scholar] [CrossRef]
- Wang, J.; Cheng, Y.; Yuan, L.; Xu, D.; Wang, Y. Effect of nano-silica on chemical and volume shrinkage of cement-based composites. Constr. Build. Mater. 2020, 247, 118529. [Google Scholar] [CrossRef]
- Wang, J.; Liu, M.; Wang, Y.; Zhou, Z.; Xu, D.; Du, P.; Cheng, X. Synergistic effects of nano-silica and fly ash on properties of cement-based composites. Constr. Build. Mater. 2020, 262, 120737. [Google Scholar] [CrossRef]
- Zhang, B.; Tan, H.; Shen, W.; Xu, G.; Ma, B.; Ji, X. Nano-silica and silica fume modified cement mortar used as Surface Protection Material to enhance the impermeability. Cem. Concr. Compos. 2018, 92, 7–17. [Google Scholar] [CrossRef]
- Yang, J.; Zeng, J.; He, X.; Zhang, Y.; Su, Y.; Tan, H. Sustainable clinker-free solid waste binder produced from wet-ground granulated blast-furnace slag, phosphogypsum and carbide slag. Constr. Build. Mater. 2022, 330, 127218. [Google Scholar] [CrossRef]
- Scrivener, K.L.; Juilland, P.; Monteiro, P.J. Advances in understanding hydration of Portland cement. Cem. Concr. Res. 2015, 78, 38–56. [Google Scholar] [CrossRef]
- Zhang, T.; Ma, B.; Jiang, D.; Jiang, Q.; Jin, Z. Comparative research on the effect of various mineral admixtures on the early hydration process of cement. Constr. Build. Mater. 2021, 301, 124372. [Google Scholar] [CrossRef]
- Korpa, A.; Kowald, T.; Trettin, R. Phase development in normal and ultra high performance cementitious systems by quantitative X-ray analysis and thermoanalytical methods. Cem. Concr. Res. 2009, 39, 69–76. [Google Scholar] [CrossRef]
- Zhang, M.-H.; Islam, J. Use of nano-silica to reduce setting time and increase early strength of concretes with high volumes of fly ash or slag. Constr. Build. Mater. 2012, 29, 573–580. [Google Scholar] [CrossRef]
- Yang, J.; Zeng, J.; He, X.; Hu, H.; Su, Y.; Bai, H.; Tan, H. Eco-friendly UHPC prepared from high volume wet-grinded ultrafine GGBS slurry. Constr. Build. Mater. 2021, 308, 125057. [Google Scholar] [CrossRef]
- Zhang, G.; Li, G. Effects of mineral admixtures and additional gypsum on the expansion performance of sulphoaluminate expansive agent at simulation of mass concrete environment. Constr. Build. Mater. 2016, 113, 970–978. [Google Scholar] [CrossRef]
- Hua, T.; Tang, J.; Zhu, J.; Tang, H.; Liu, J. Evolution of the early compressive strength of cement-slag pastes with CaO-based expansive agent. Mater. Struct 2022, 55, 63. [Google Scholar] [CrossRef]
- Corinaldesi, V.; Nardinocchi, A. Influence of type of fibers on the properties of high performance cement-based composites. Constr. Build. Mater. 2016, 107, 321–331. [Google Scholar] [CrossRef]
- Quennoz, A.; Scrivener, K.L. Interactions between alite and C3A-gypsum hydrations in model cements. Cem. Concr. Res. 2013, 44, 46–54. [Google Scholar] [CrossRef]
- Gallucci, E.; Mathur, P.; Scrivener, K. Microstructural development of early age hydration shells around cement grains. Cem. Concr. Res. 2010, 40, 4–13. [Google Scholar] [CrossRef]
- Zhan, P.-M.; He, Z.-H. Application of shrinkage reducing admixture in concrete: A review. Constr. Build. Mater. 2019, 201, 676–690. [Google Scholar] [CrossRef]
- Zhao, H.; Xiang, Y.; Zhang, B.; Qin, X.; Xu, W.; Wang, W.; Tian, Q.; Liu, J. Effects of temperature rising inhibitor and shrinkage reducing admixture on pore structure of early-age cement paste. Constr. Build. Mater. 2021, 306, 124896. [Google Scholar] [CrossRef]
- Sant, G.; Lothenbach, B.; Juilland, P.; Le Saout, G.; Weiss, J.; Scrivener, K. The origin of early age expansions induced in cementitious materials containing shrinkage reducing admixtures. Cem. Concr. Compos. 2011, 41, 218–229. [Google Scholar] [CrossRef]
- Siriwatwechakul, W.; Siramanont, J.; Vichit-Vadakan, W. Behavior of superabsorbent polymers in calcium-and sodium-rich solutions. J. Mater. Civ. Eng. 2012, 24, 976–980. [Google Scholar] [CrossRef]
- Justs, J.; Wyrzykowski, M.; Bajare, D.; Lura, P. Internal curing by superabsorbent polymers in ultra-high performance concrete. Cem. Concr. Res. 2015, 76, 82–90. [Google Scholar] [CrossRef]
- Li, H.; Liu, J.; Wang, Y.; Tian, Q. Simplified chemo-mechanical model of hydration/expansion of calcium-oxide-type expansive agent in cement-based materials. Mag. Concr. Res. 2020, 72, 1006–1015. [Google Scholar] [CrossRef]
- Mo, L.; Meng, L.; Al-Tabbaa, A.; Min, D.; Lau, W.Y. Deformation and mechanical properties of quaternary blended cements containing ground granulated blast furnace slag, fly ash and magnesia. Cem. Concr. Res. 2015, 71, 7–13. [Google Scholar] [CrossRef]
- Gao, S.; Wang, Z.; Wang, W.; Qiu, H. Effect of shrinkage-reducing admixture and expansive agent on mechanical properties and drying shrinkage of Engineered Cementitious Composite (ECC). Constr. Build. Mater. 2018, 179, 172–185. [Google Scholar] [CrossRef]
- Yang, J.; Wang, F.; He, X.; Su, Y. Pore structure of affected zone around saturated and large superabsorbent polymers in cement paste. Cem. Concr. Compos. 2019, 97, 54–67. [Google Scholar] [CrossRef]
- Yoo, D.Y.; Park, J.J.; Kim, S.W.; Yoon, Y.S. Combined effect of expansive and shrinkage-reducing admixtures on the properties of ultra high performance fiber-reinforced concrete. J. Compos. Mater. 2014, 48, 1981–1991. [Google Scholar] [CrossRef]
- He, Z.; Shen, A.; Guo, Y.; Lyu, Z.; Li, D.; Qin, X.; Zhao, M.; Wang, Z. Cement-based materials modified with superabsorbent polymers: A review. Constr. Build. Mater. 2019, 225, 569–590. [Google Scholar] [CrossRef]
- Yang, J.; Huang, J.; He, X.; Su, Y.; Oh, S.-K. Shrinkage properties and microstructure of high volume ultrafine phosphorous slag blended cement mortars with superabsorbent polymer. J. Build. Eng. 2020, 29, 101121. [Google Scholar] [CrossRef]
- Yang, J.; Wang, F. Influence of assumed absorption capacity of superabsorbent polymers on the microstructure and performance of cement mortars. Constr. Build. Mater. 2019, 204, 468–478. [Google Scholar] [CrossRef]
- Kioumarsi, M.; Azarhomayun, F.; Haji, M.; Shekarchi, M. Effect of Shrinkage Reducing Admixture on Drying Shrinkage of Concrete with Different w/c Ratios. Materials 2020, 13, 5721. [Google Scholar] [CrossRef]
- Lee, H.; Wong, H.S.; Buenfeld, N.R. Self-sealing of cracks in concrete using superabsorbent polymers. Cem. Concr. Res. 2016, 79, 194–208. [Google Scholar] [CrossRef] [Green Version]
- Hasholt, M.T.; Jensen, O.M. Chloride migration in concrete with superabsorbent polymers. Cem. Concr. Compos. 2015, 55, 290–297. [Google Scholar] [CrossRef] [Green Version]
- Mehta, P.; Monteiro, P. Concrete: Microstructure, Properties, and Materials; McGraw-Hill Education: New York, NY, USA, 2014. [Google Scholar]
- Yang, J.; Su, Y.; He, X.; Tan, H.; Jiang, Y.; Zeng, L.; Strnadel, B. Pore structure evaluation of cementing composites blended with coal by-products: Calcined coal gangue and coal fly ash. Fuel Process. Technol. 2018, 181, 75–90. [Google Scholar] [CrossRef]


| MgO | Al2O3 | SiO2 | SO3 | CaO | Fe2O3 | P2O5 | K2O | LOI | |
|---|---|---|---|---|---|---|---|---|---|
| Cement | 2.27 | 6.221 | 20.835 | 3.322 | 58.176 | 3.315 | 0.109 | 0.947 | 4.802 |
| GGBS | 7.45 | 15.707 | 31.58 | 3.813 | 39.313 | 0.289 | 0.029 | 0.398 | 4.079 |
| SF | 0.98 | 0.219 | 90.81 | 1.122 | 0.4 | 0.056 | 0.124 | 0.917 | 1.416 |
| FA | 0.63 | 41.343 | 42.479 | 1.215 | 5.34 | 3.719 | 0.362 | 0.827 | 5.37 |
| EA | 1.96 | 2.567 | 4.61 | 17.663 | 58.484 | 1.214 | 0.027 | 0.233 | 13.262 |
| Code | Cement | FA | GGBS | SF | Sand | Gravel | Water | EA | SRA | SAP |
|---|---|---|---|---|---|---|---|---|---|---|
| Control | 270 | 150 | 75 | 20 | 860 | 880 | 175 | |||
| EA-4% | 270 | 150 | 75 | 20 | 860 | 880 | 175 | 20.6 | ||
| EA-8% | 270 | 150 | 75 | 20 | 860 | 880 | 175 | 41.2 | ||
| EA-12% | 270 | 150 | 75 | 20 | 860 | 880 | 175 | 61.8 | ||
| SRA-1% | 270 | 150 | 75 | 20 | 860 | 880 | 175 | 5.15 | ||
| SRA-2% | 270 | 150 | 75 | 20 | 860 | 880 | 175 | 10.3 | ||
| SRA-3% | 270 | 150 | 75 | 20 | 860 | 880 | 175 | 15.45 | ||
| SAP-0.2% | 270 | 150 | 75 | 20 | 860 | 880 | 186.3 | 1.03 | ||
| SAP-0.4% | 270 | 150 | 75 | 20 | 860 | 880 | 197.6 | 2.06 | ||
| SAP-0.6% | 270 | 150 | 75 | 20 | 860 | 880 | 208.9 | 3.09 |
| Sample ID | τ0/Pa | μ/Pa·s | Fitting Equation | R2 |
|---|---|---|---|---|
| Cement | 21.11257 | 0.82807 | τ = 21.11257 + 0.82807γ − 1.29 × 10⁻³γ2 | 0.99318 |
| EA-4% | 10.42214 | 0.80191 | τ = 10.42214 + 0.80191γ − 8.58388 × 10⁻⁴γ2 | 0.99759 |
| EA-8% | 10.69963 | 1.31995 | τ = 10.69963 + 1.31995γ − 2.52 × 10⁻³γ2 | 0.99572 |
| EA-12% | 20.31382 | 1.48647 | τ = 20.31382 + 1.48647γ − 3.08 × 10⁻³γ2 | 0.99617 |
| SRA-1% | 14.94641 | 1.03673 | τ = 14.94641 + 1.03673γ − 1.39 × 10⁻³γ2 | 0.99748 |
| SRA-2% | 18.19536 | 0.787 | τ = 18.19536 + 0.787γ − 1.11 × 10⁻³γ2 | 0.99657 |
| SRA-3% | 10.249 | 0.58992 | τ = 10.249 + 0.58992γ − 7.8803 × 10⁻⁴γ2 | 0.99617 |
| SAP-0.2% | 27.09619 | 0.54142 | τ = 27.09619 + 0.54142γ − 3.68807 × 10⁻⁴γ2 | 0.99902 |
| SAP-0.4% | 39.72358 | 0.51597 | τ = 39.72358 + 0.51597γ + 5.06153 × 10⁻⁶γ2 | 0.99948 |
| SAP-0.6% | 39.88603 | 0.37507 | τ = 39.88603 + 0.0.37507γ + 3.8843 × 10⁻⁵γ2 | 0.99893 |
| Samples | Porosity (mL/g) | Pore Volume Fraction (%) | ||||
|---|---|---|---|---|---|---|
| <10 nm | 10–50 nm | 50–100 nm | 100 nm–10 μm | >10 μm | ||
| Control | 0.0671 | 18.25 | 38.6 | 3.36 | 29.05 | 10.74 |
| EA-8% | 0.0925 | 23.86 | 48.39 | 2.11 | 14.65 | 10.99 |
| SRA-2% | 0.0979 | 17.32 | 34.51 | 3.16 | 32.17 | 12.84 |
| SAP-0.4% | 0.05 | 19.45 | 37.41 | 9.2 | 13.43 | 20.51 |
Publisher’s Note: MDPI stays neutral with regard to jurisdictional claims in published maps and institutional affiliations. |
© 2022 by the authors. Licensee MDPI, Basel, Switzerland. This article is an open access article distributed under the terms and conditions of the Creative Commons Attribution (CC BY) license (https://creativecommons.org/licenses/by/4.0/).
Share and Cite
Yang, J.; Wang, T.; He, X.; Su, Y.; Dai, F.; Xiong, L.; Zhao, R.; Duan, X. Preparation and Experimental Investigations of Low-Shrinkage Commercial Concrete for Tunnel Annular Secondary Lining Engineering. Materials 2022, 15, 6848. https://doi.org/10.3390/ma15196848
Yang J, Wang T, He X, Su Y, Dai F, Xiong L, Zhao R, Duan X. Preparation and Experimental Investigations of Low-Shrinkage Commercial Concrete for Tunnel Annular Secondary Lining Engineering. Materials. 2022; 15(19):6848. https://doi.org/10.3390/ma15196848
Chicago/Turabian StyleYang, Jin, Tie Wang, Xingyang He, Ying Su, Fei Dai, Long Xiong, Rixu Zhao, and Xuyang Duan. 2022. "Preparation and Experimental Investigations of Low-Shrinkage Commercial Concrete for Tunnel Annular Secondary Lining Engineering" Materials 15, no. 19: 6848. https://doi.org/10.3390/ma15196848