
Quantification of Residual Stress Relief by Heat Treatments in Austenitic Cladded Layers

 ,
,  , , ,
, , ,
Abstract
:
1. Introduction
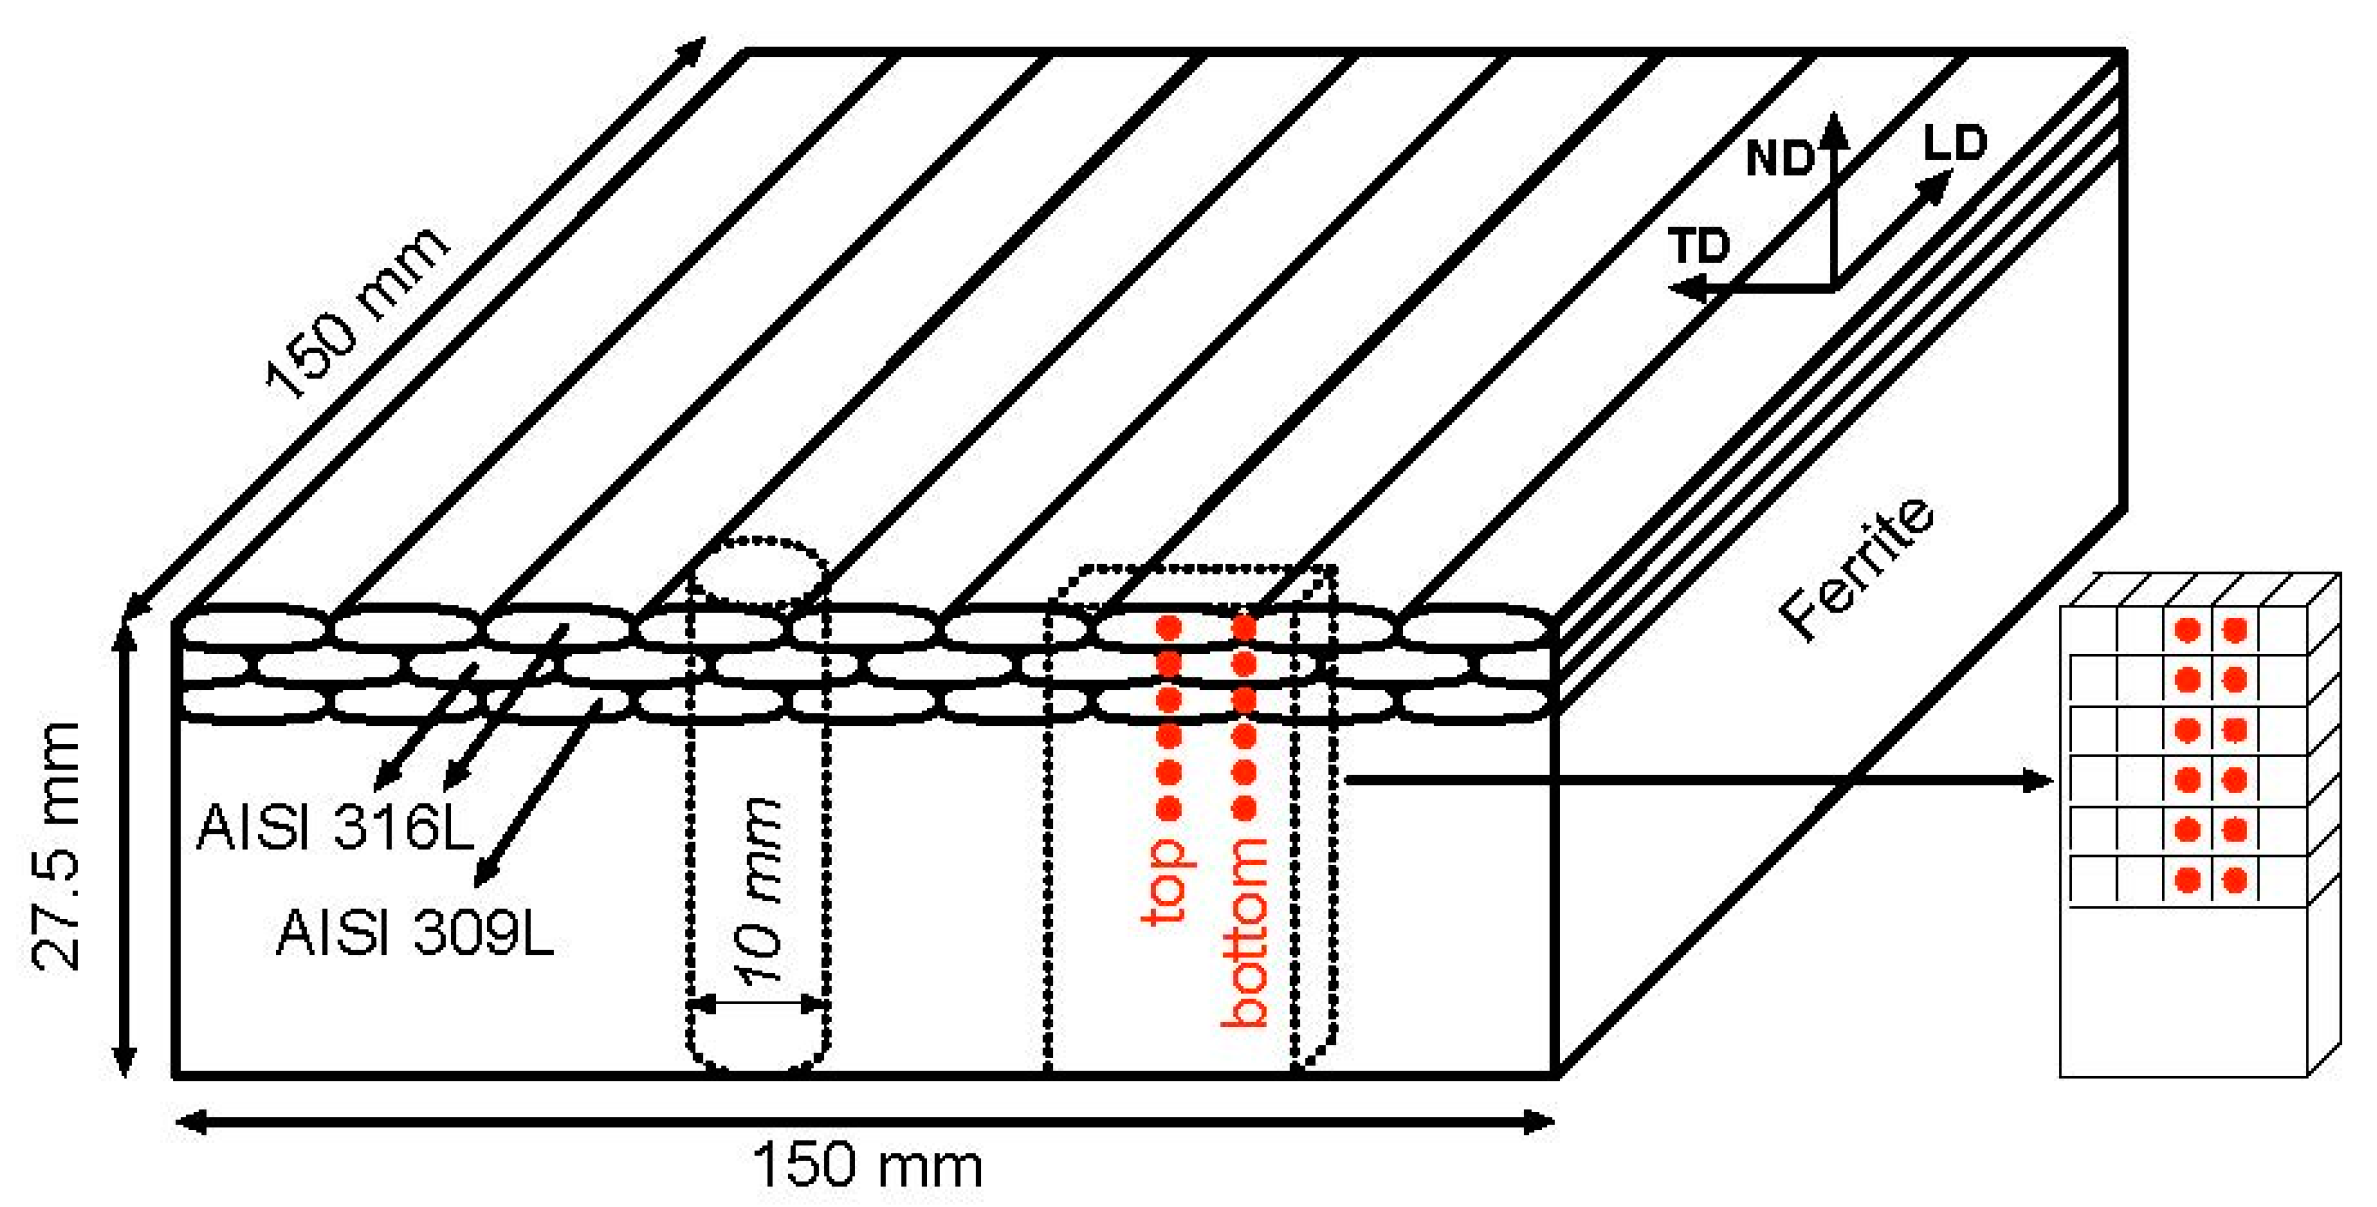
2. Materials
3. Methods for Measuring Residual Stress
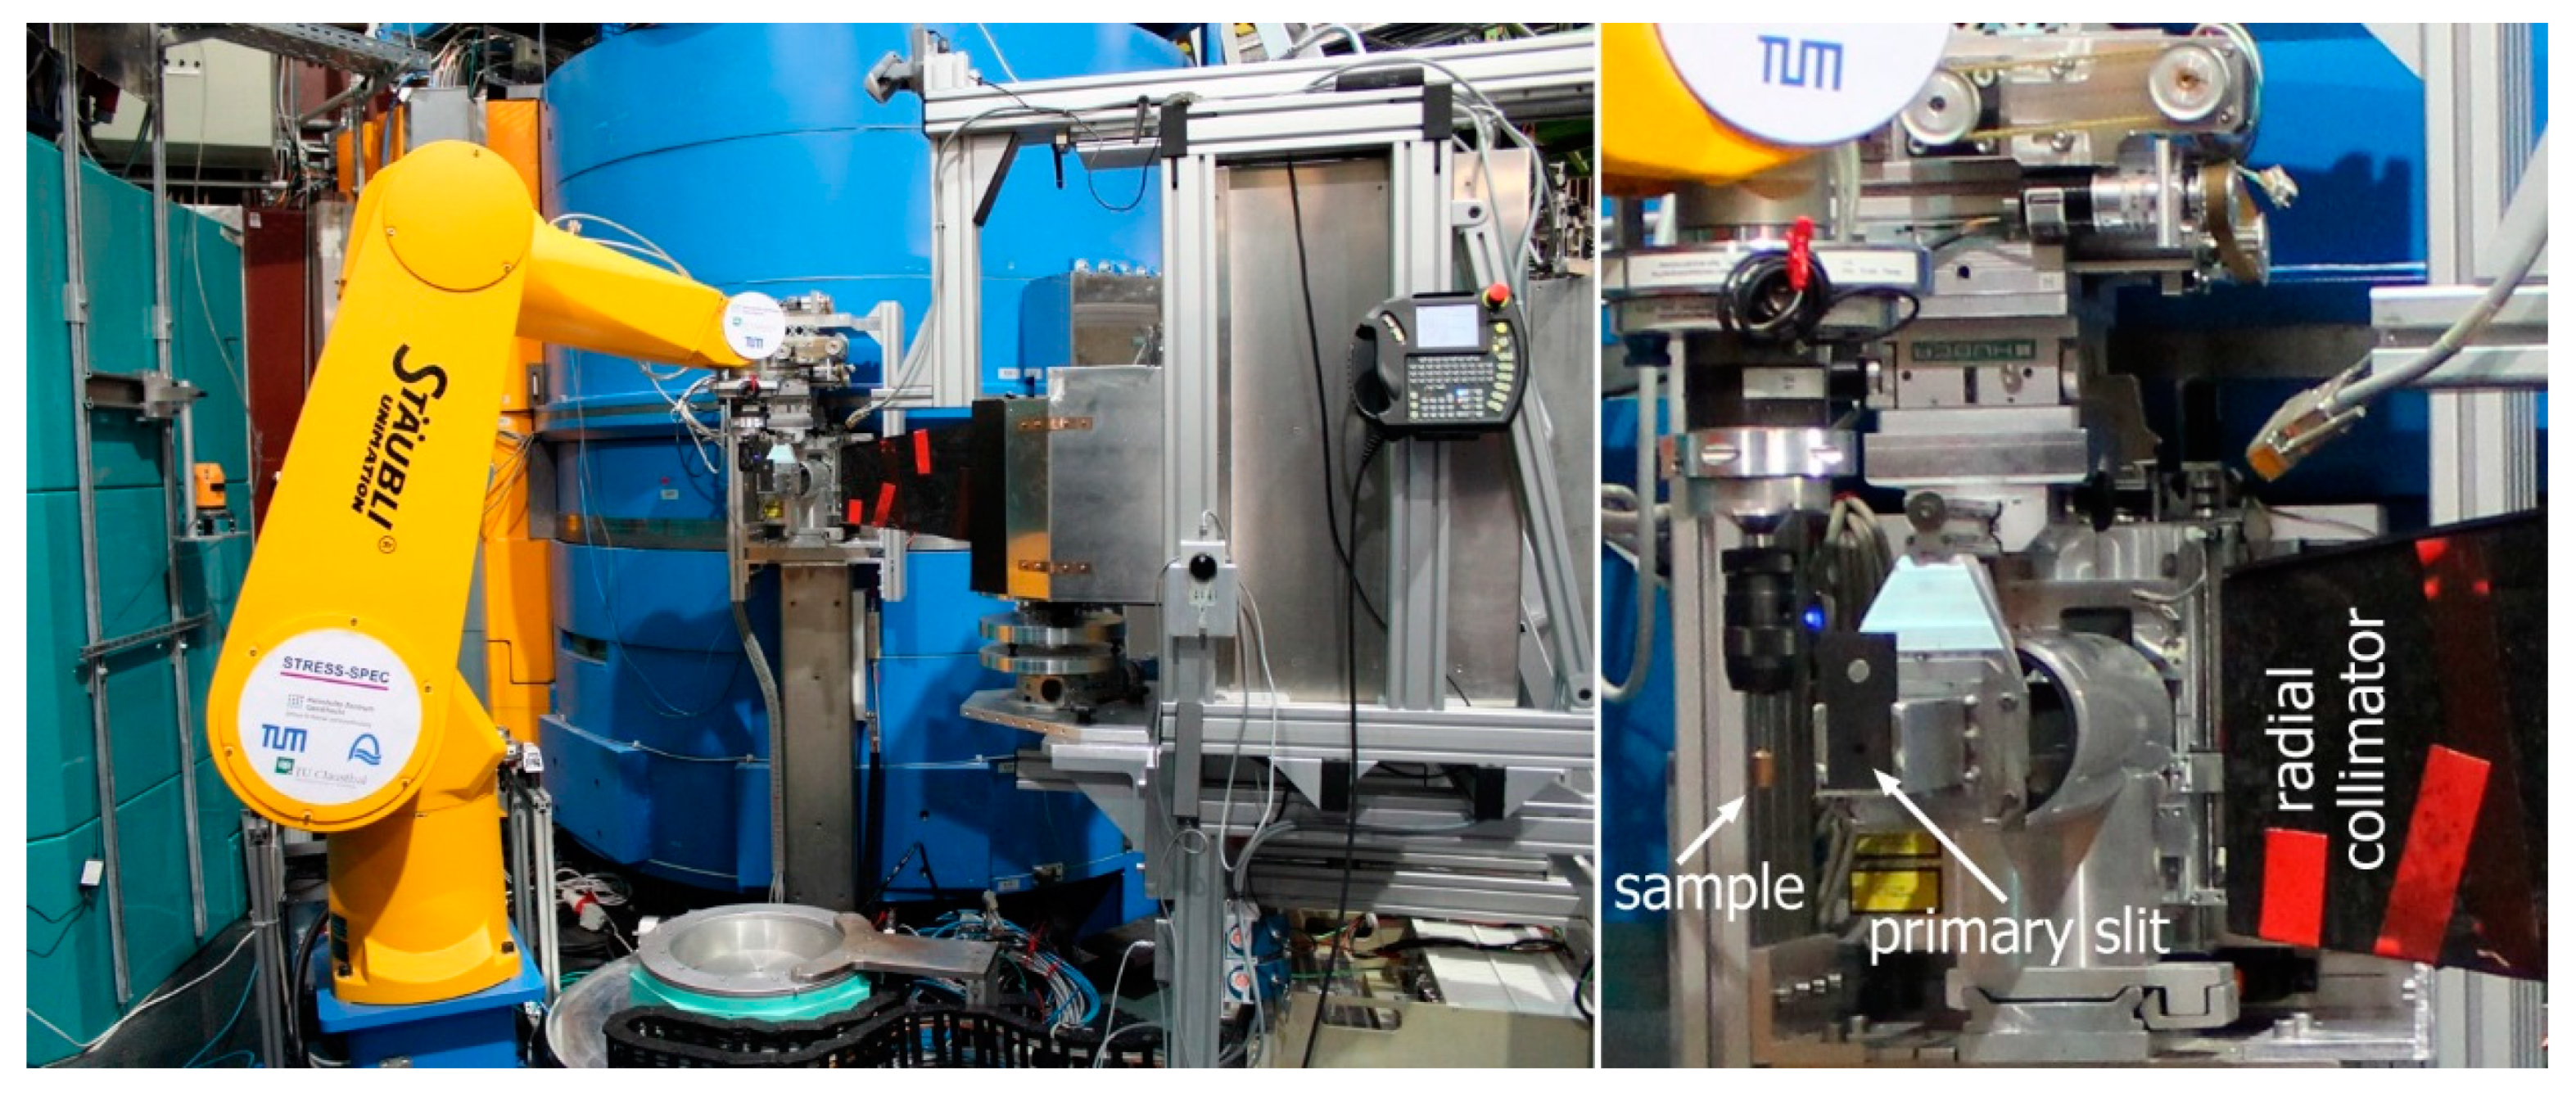
3.1. Neutron Diffraction
3.2. Contour Method
4. Results and Discussion
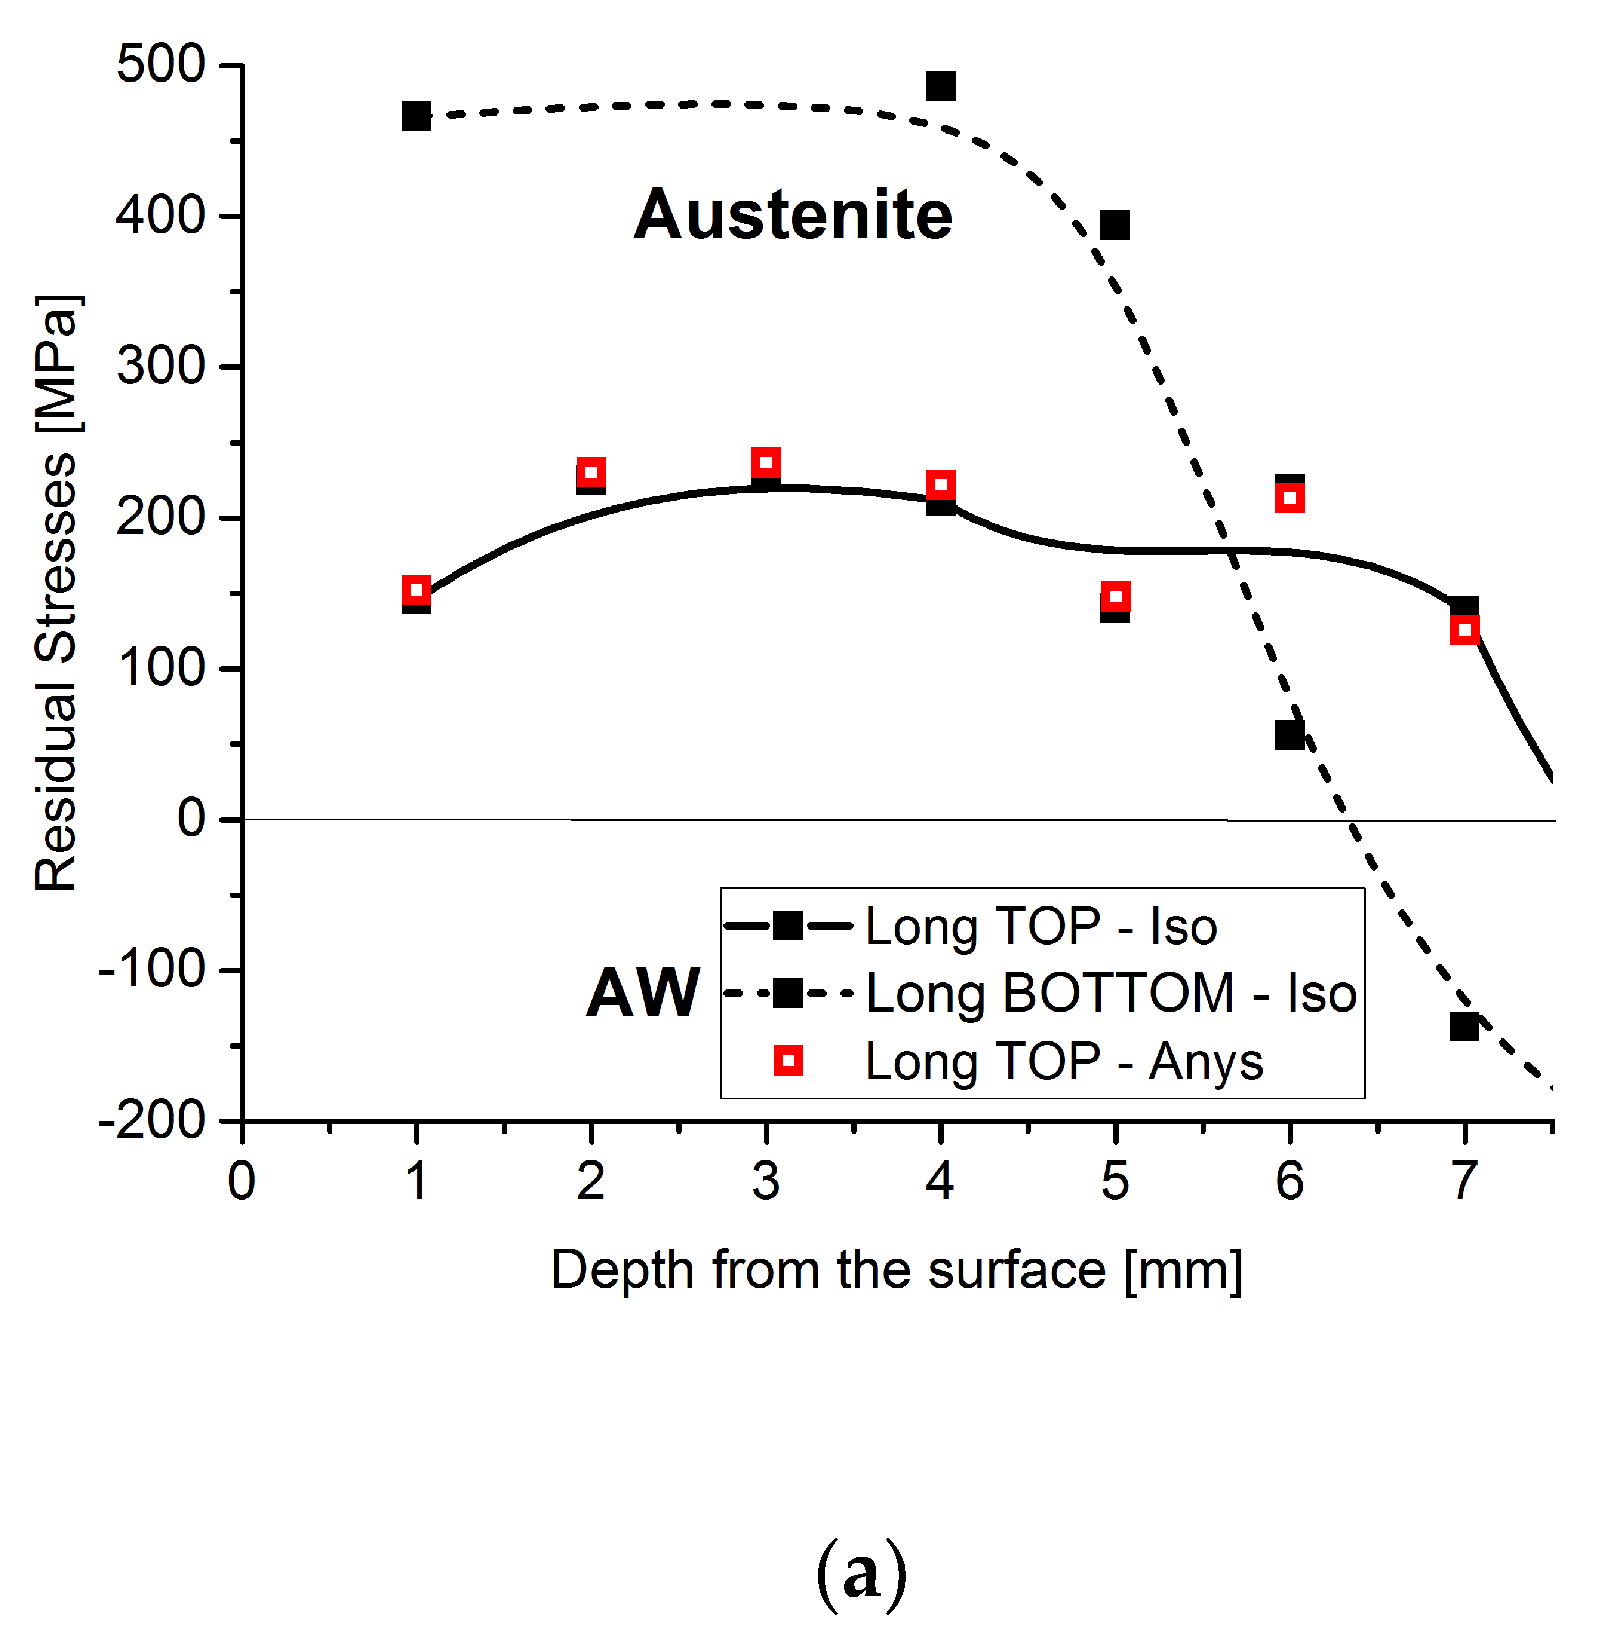
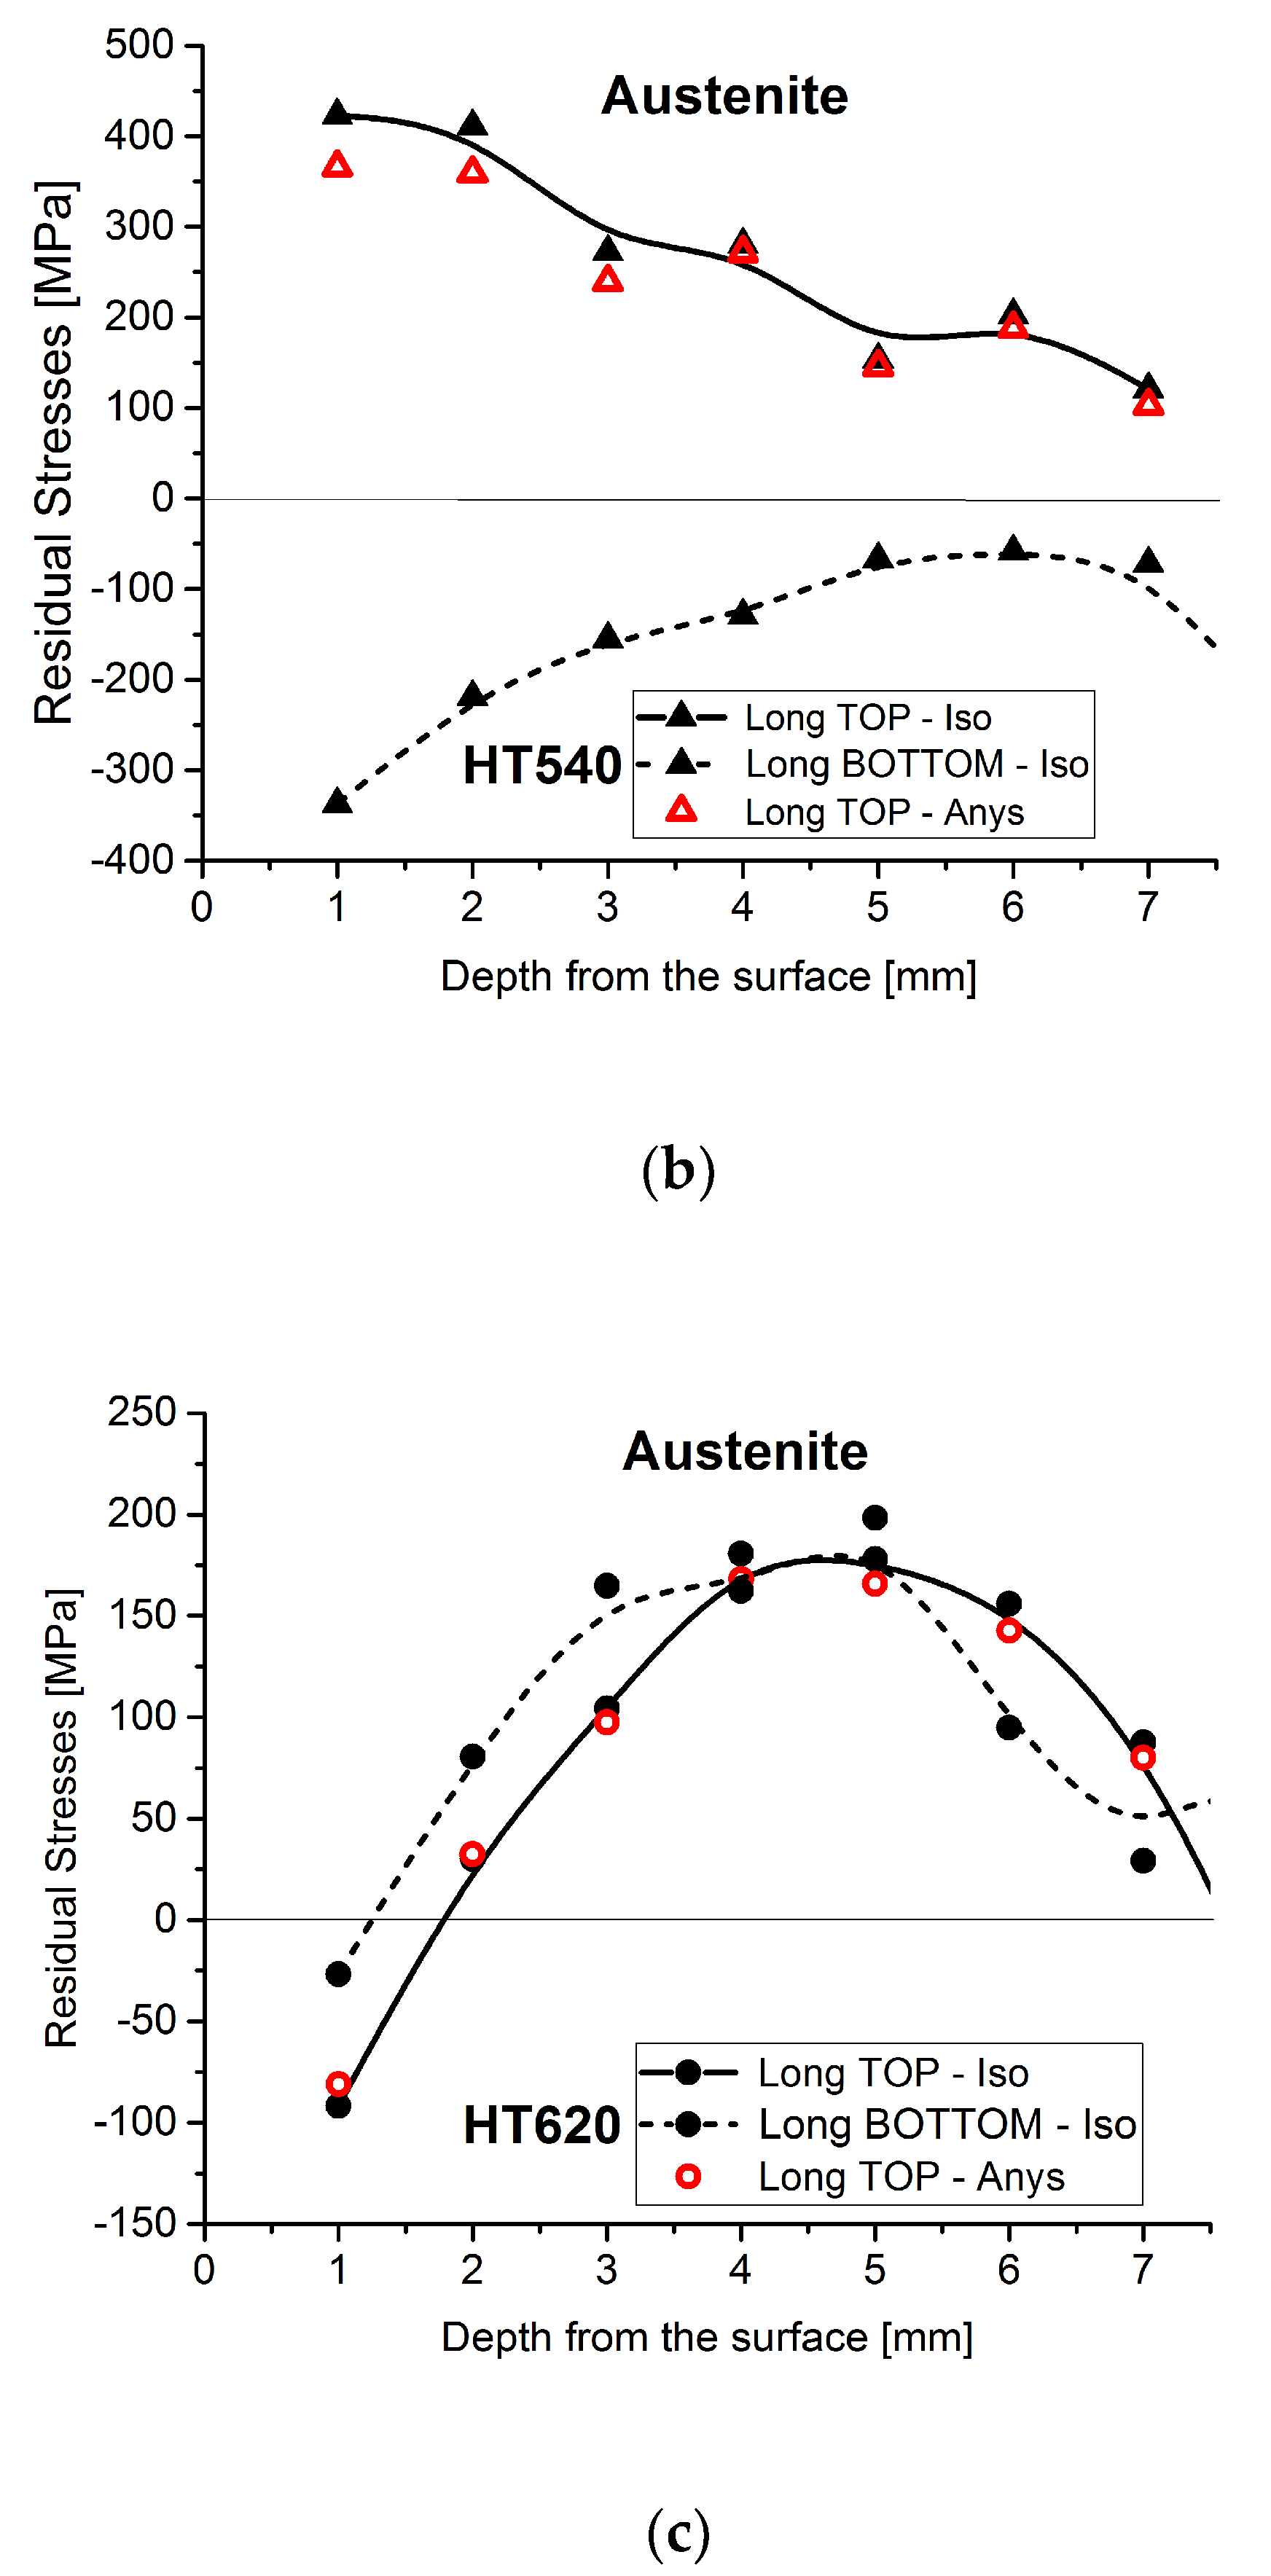
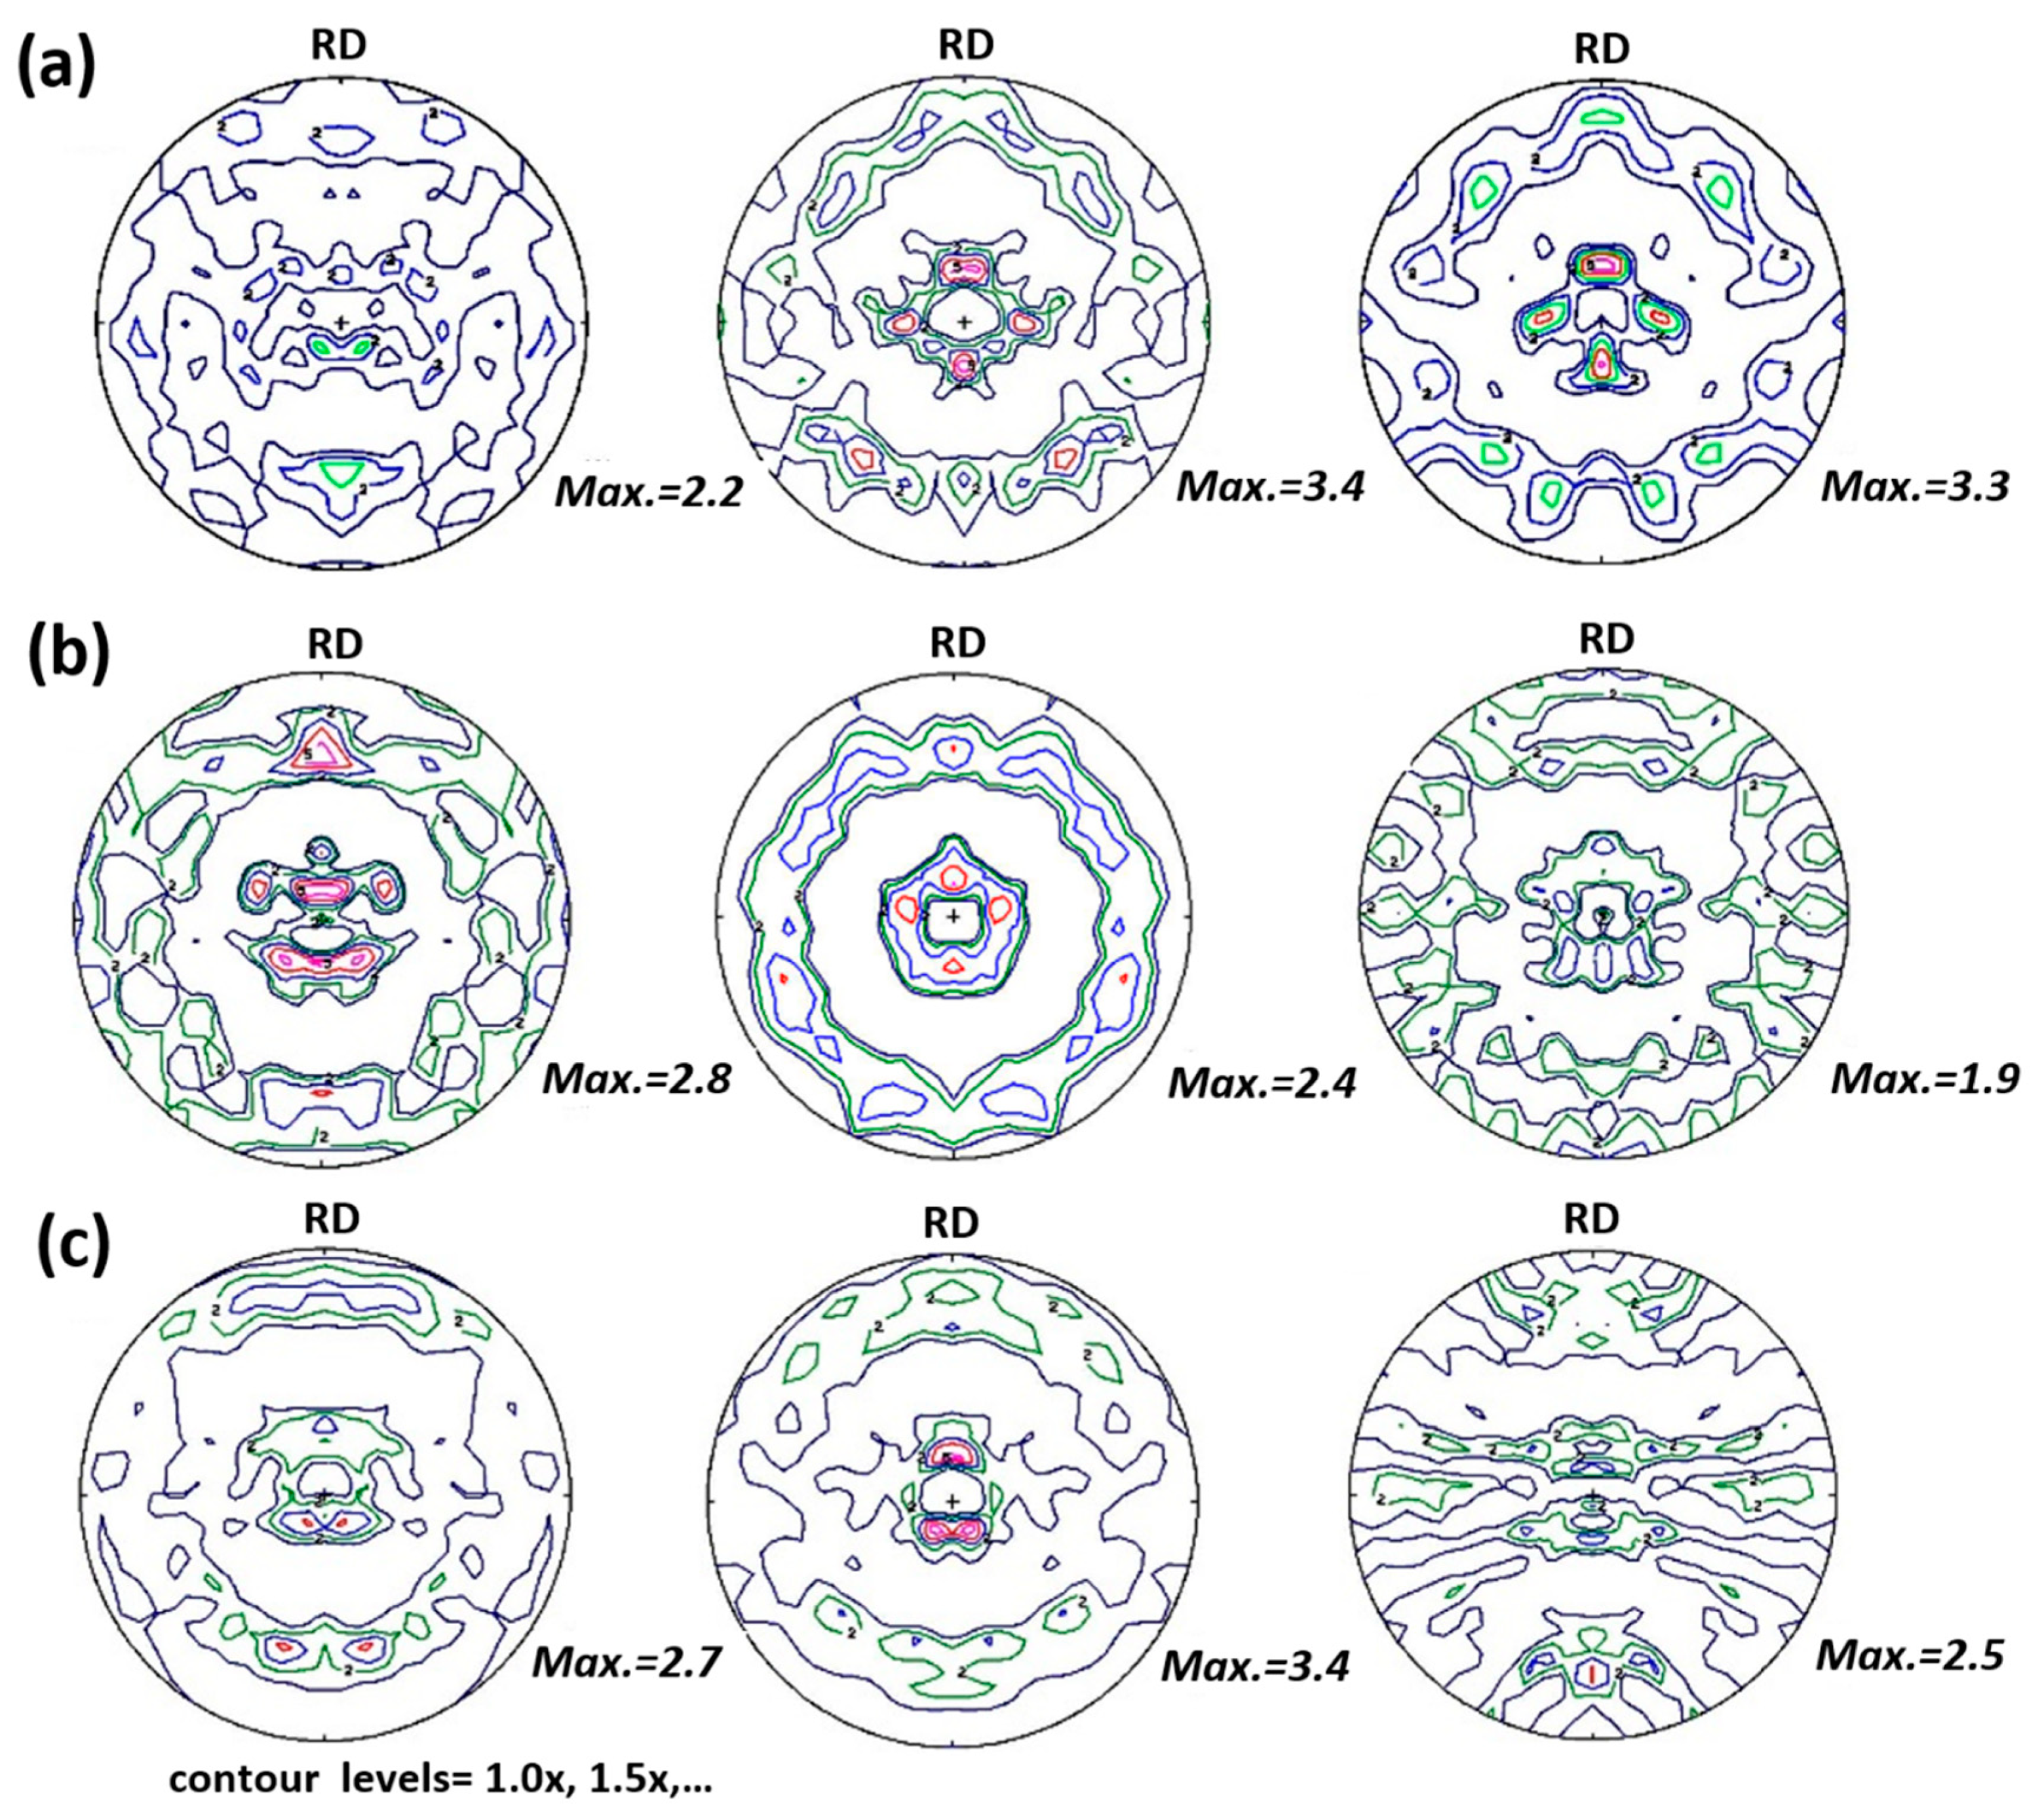
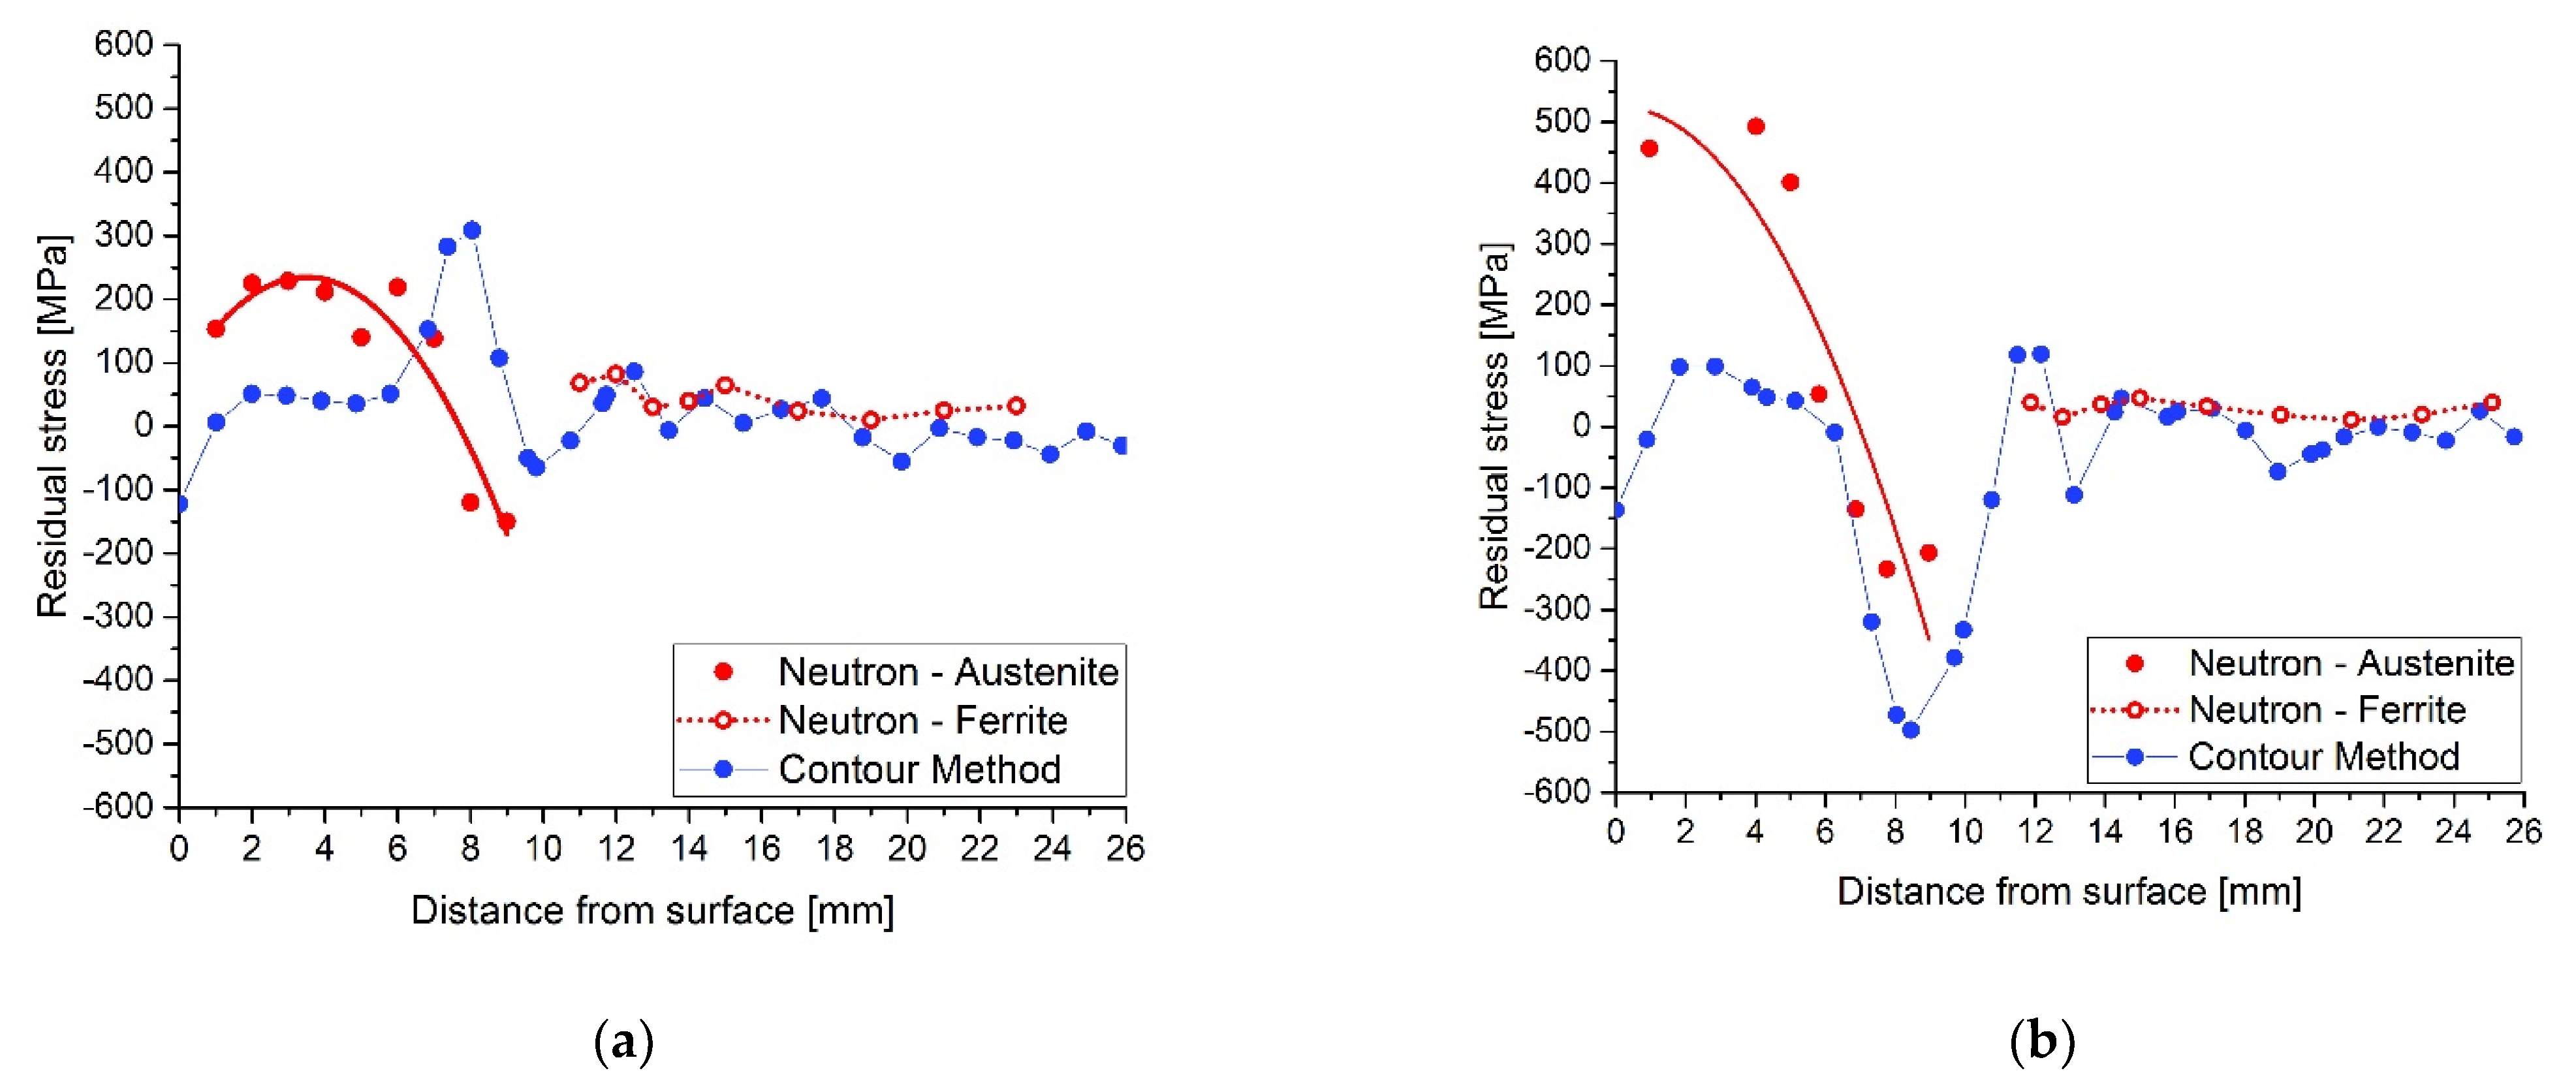
4.1. Neutron Diffraction
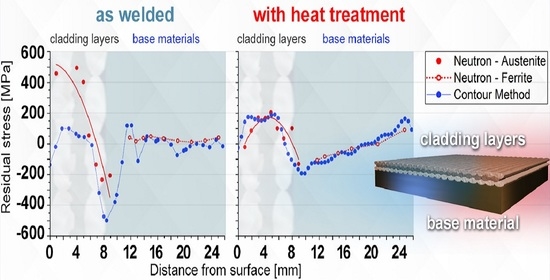
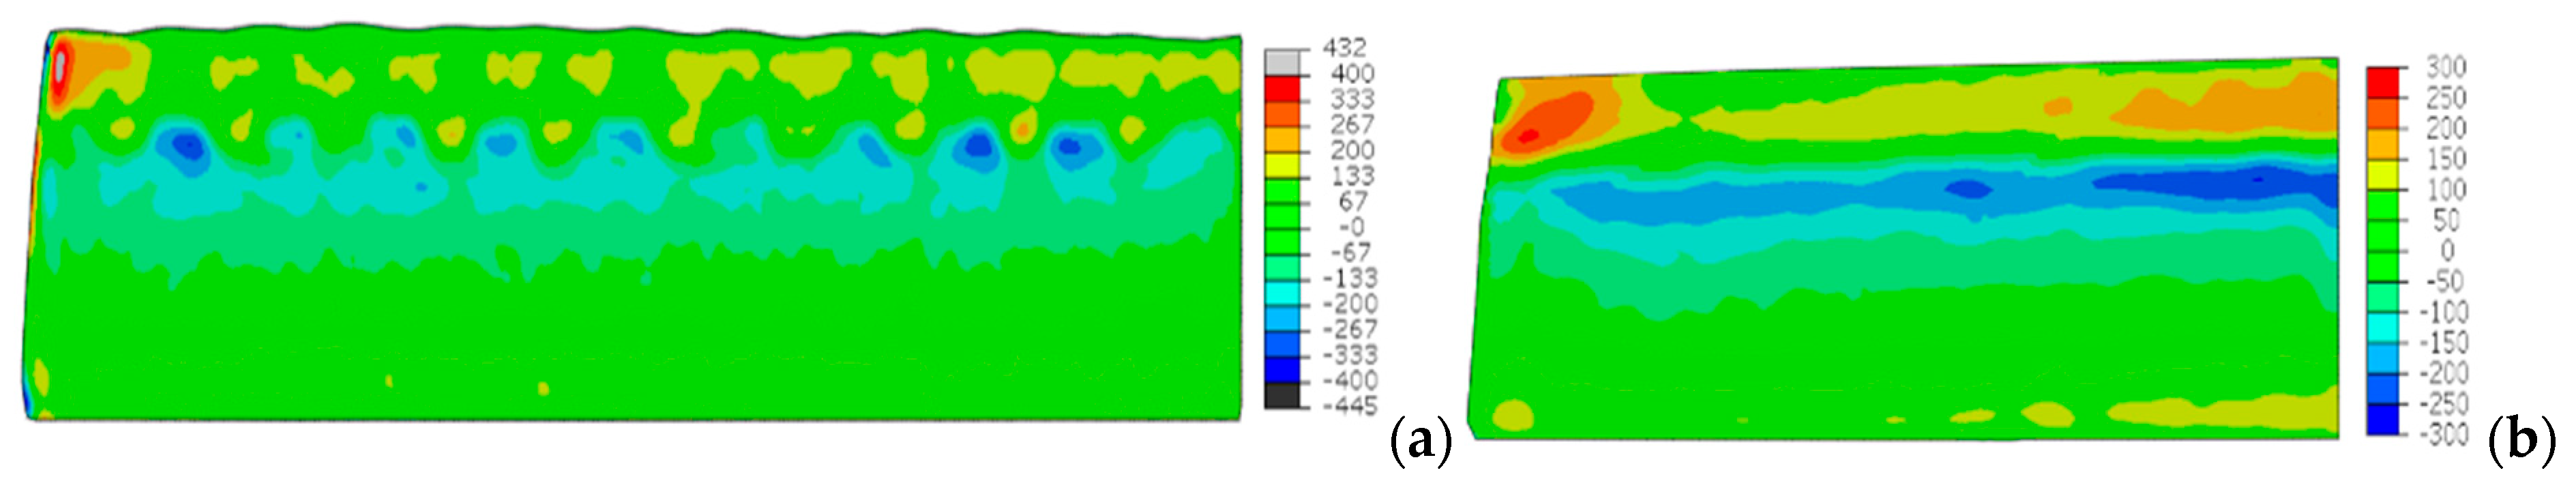
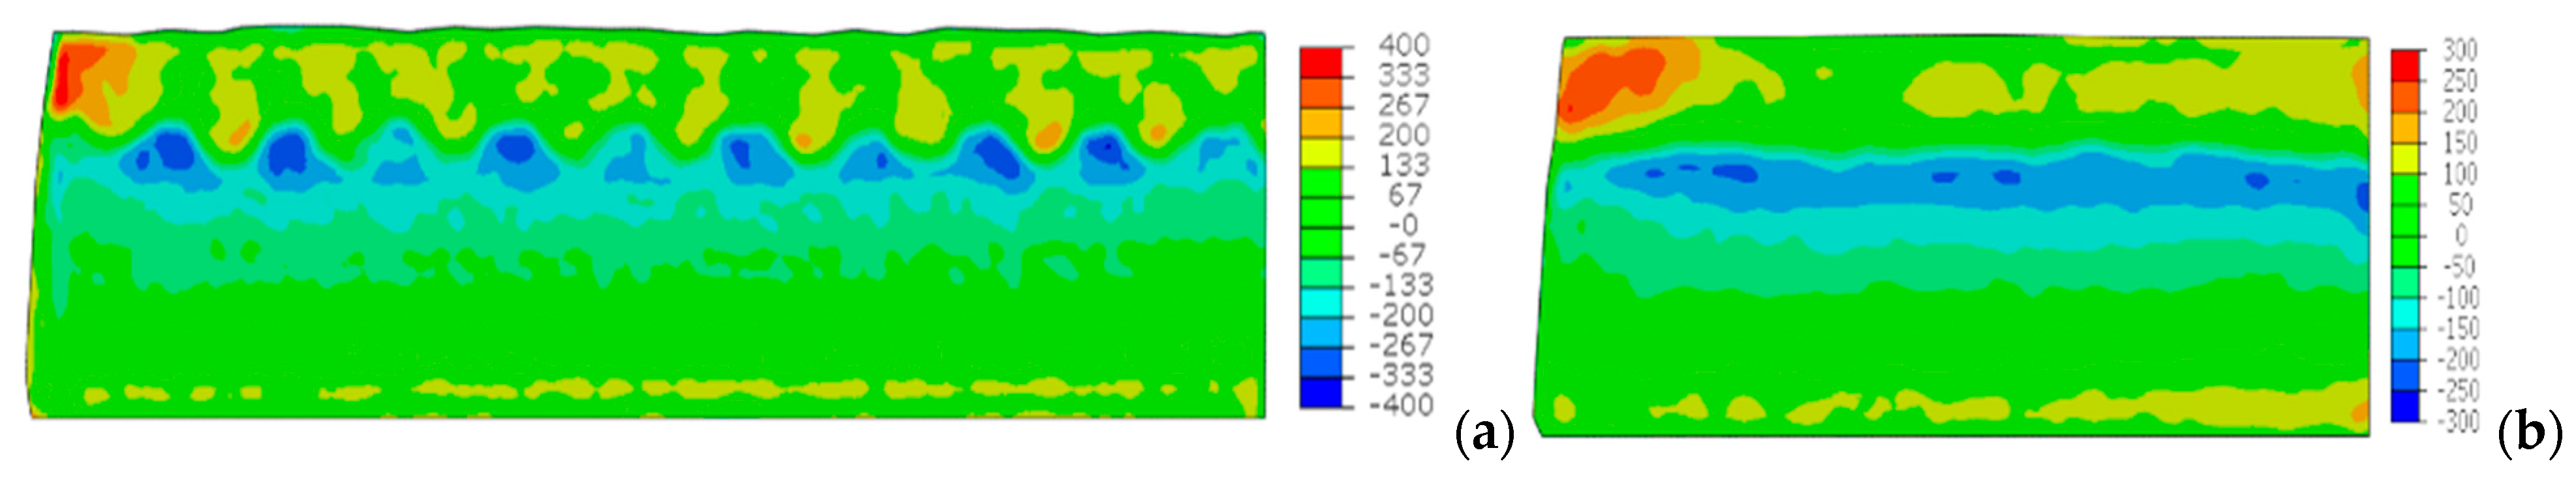
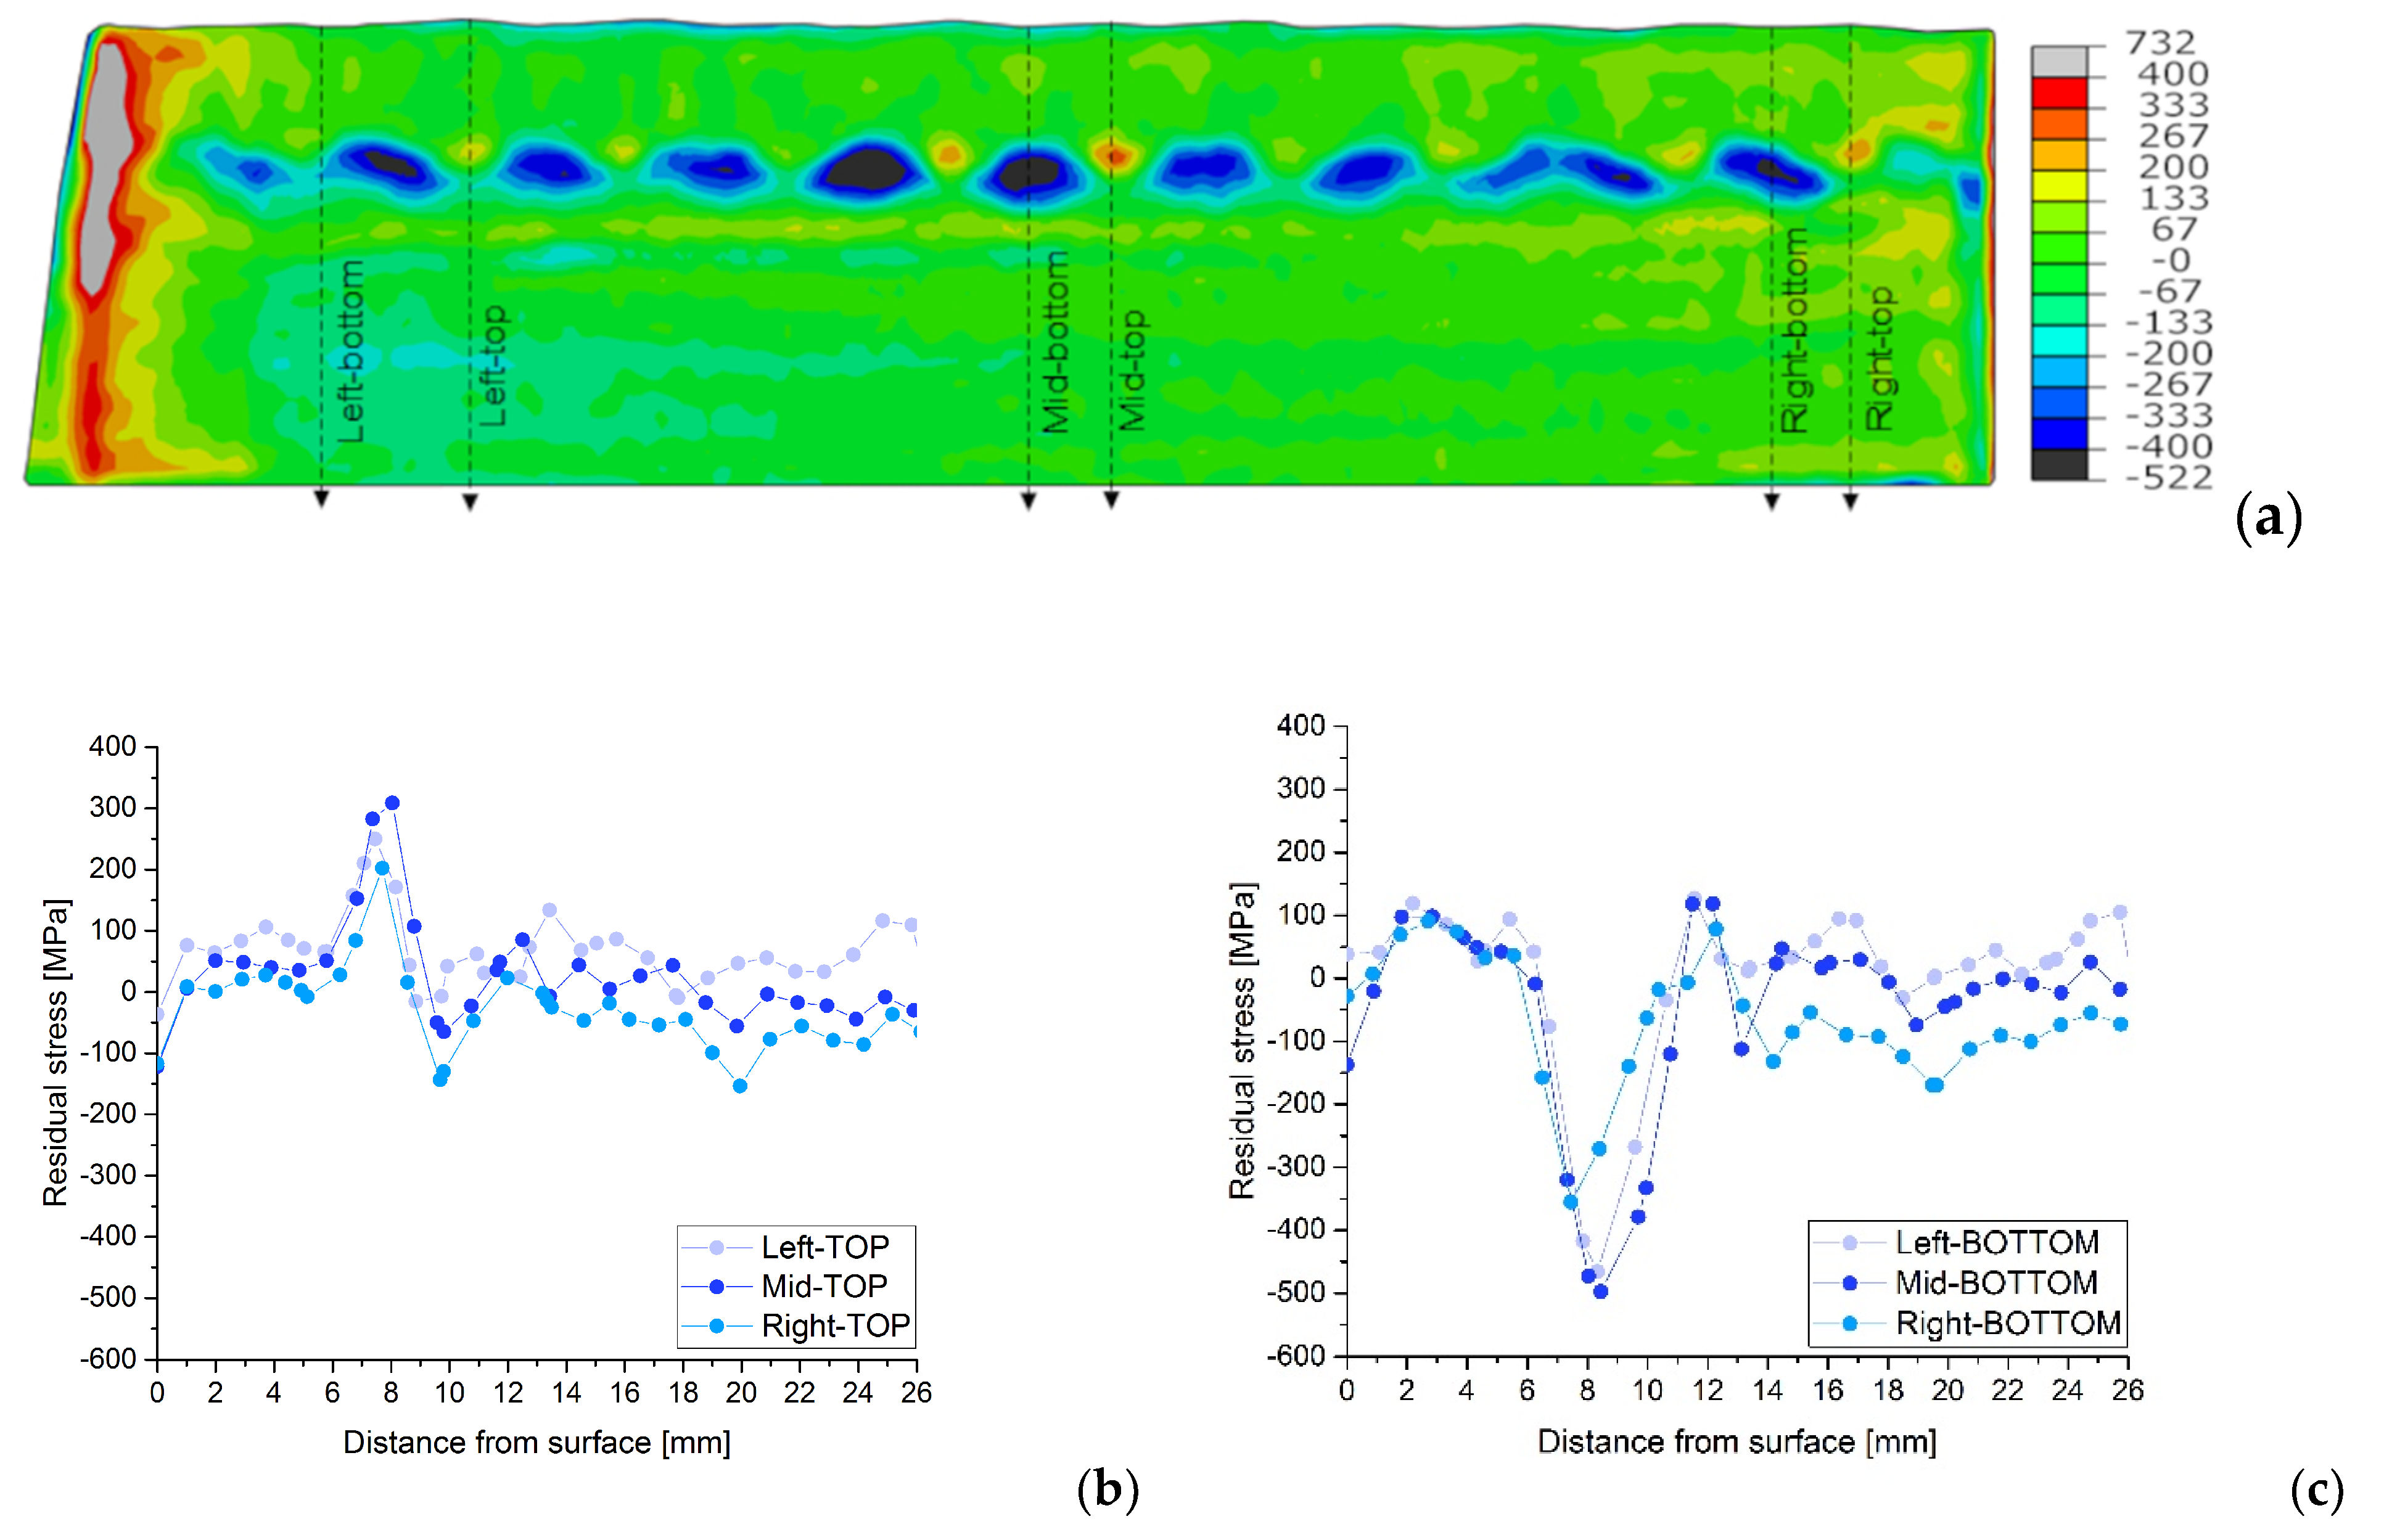
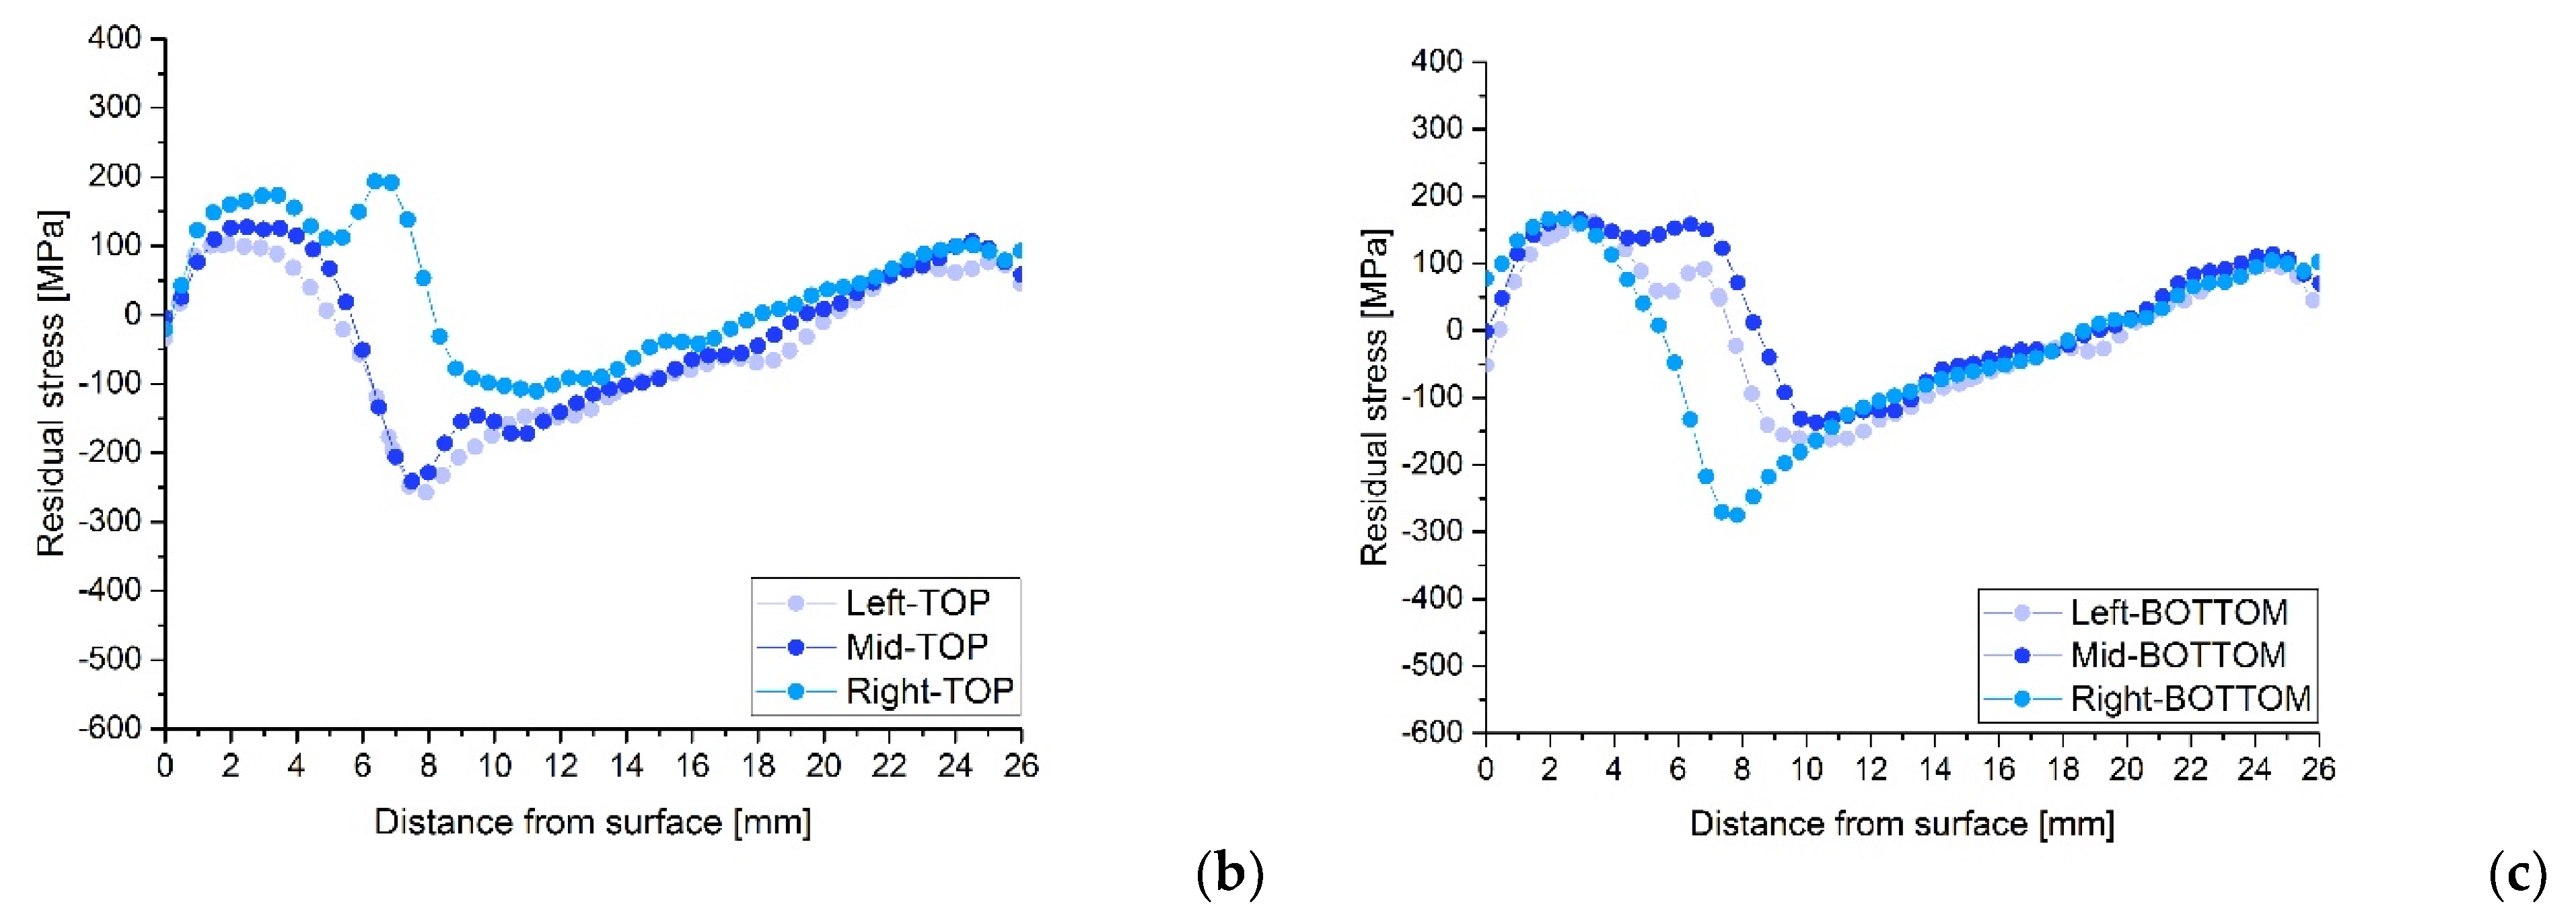
4.2. Residual Stress Maps after Contour Method
4.3. Discussion
5. Conclusions
Author Contributions
Funding
Data Availability Statement
Conflicts of Interest
References
- Kumar, R.; Sen, R.N.; Yadav, R.S.; Mehra, V.K. Qualification of stainless steel cladding for nuclear application. Trans. Indian Inst. Metals 2003, 61–67. [Google Scholar]
- Di Schino, A.; Testani, C. Corrosion behavior and mechanical properties of AISI 316 stainless steel clad Q235 plate. Metals 2020, 10, 552. [Google Scholar] [CrossRef]
- Switzner, N.; Yu, Z. Austenitic stainless steel cladding interface microstructures evaluated for petrochemical applications. Weld. J. 2019, 98, 50–61. [Google Scholar] [CrossRef]
- Suárez, A.; Amado, J.; Tobar, M.; Yáñez, A.; Fraga, E.; Peel, M. Study of residual stresses generated inside laser cladded plates using FEM and diffraction of synchrotron radiation. Surf. Coatings Technol. 2010, 204, 1983–1988. [Google Scholar] [CrossRef]
- Li, C.; Qin, G.; Tang, Y.; Zhang, B.; Lin, S.; Geng, P. Microstructures and mechanical properties of stainless steel clad plate joint with diverse filler metals. J. Mater. Res. Technol. 2020, 9, 2522–2534. [Google Scholar] [CrossRef]
- Jemblie, L.; Bjaaland, H.; Nyhus, B.; Olden, V.; Akselsen, O. Fracture toughness and hydrogen embrittlement susceptibility on the interface of clad steel pipes with and without a Ni-interlayer. Mater. Sci. Eng. A 2017, 685, 87–94. [Google Scholar] [CrossRef] [Green Version]
- Nitschke-Pagel, T.N. Limitations and recommendations for the measurement of residual stresses in welded joints. Mater. Res. Proc. 2018, 6, 221–226. [Google Scholar] [CrossRef] [Green Version]
- Vandermeulen, W.; Mertens, M.; Scibetta, M. Young’s modulus anisotropy in reactor pressure vessel cladding. J. Nucl. Mater. 2012, 421, 172–175. [Google Scholar] [CrossRef]
- Rebelo-Kornmeier, J.; Gan, W.M.; Marques, M.; Batista, A.; Hofmann, M.; Loureiro, A. Texture characterization of stainless steel cladded layers of process vessels. Mater. Sci. Forum 2016, 879, 1588–1593. [Google Scholar] [CrossRef]
- Daymond, M.R.; Johnson, M.W. The determination of a stress-free lattice parameter within a stressed material using elastic anisotropy. J. Appl. Crystallogr. 2001, 34, 263–270. [Google Scholar] [CrossRef]
- Ganguly, S.; Edwards, L.; Fitzpatrick, M. Problems in using a comb sample as a stress-free reference for the determination of welding residual stress by diffraction. Mater. Sci. Eng. A 2011, 528, 1226–1232. [Google Scholar] [CrossRef] [Green Version]
- Withers, P.J.; Preuss, M.; Steuwer, A.; Pang, J.W.L. Methods for obtaining the strain-free lattice parameter when using diffraction to determine residual stress. J. Appl. Crystallogr. 2007, 40, 891–904. [Google Scholar] [CrossRef]
- Brown, D.; Holden, T.; Clausen, B.; Prime, M.; Sisneros, T.; Swenson, H.; Vaja, J. Critical comparison of two independent measurements of residual stress in an electron-beam welded uranium cylinder: Neutron diffraction and the contour method. Acta Materialia 2011, 59, 864–873. [Google Scholar] [CrossRef]
- Marques, M.J.; Batista, A.C.; Rebelo-Kornmeier, J.; Hofmann, M.; Nobre, J.P.; Loureiro, A. Residual stress fields after heat treatment in cladded steel of process vessels. Mater. Sci. Forum 2011, 681, 364–369. [Google Scholar] [CrossRef]
- Mathew, J.; Moat, R.; Paddea, S.; Francis, J.A.; Fitzpatrick, M.; Bouchard, P.J. Through-thickness residual stress profiles in austenitic stainless steel welds: A combined experimental and prediction study. Met. Mater. Trans. A 2017, 48, 6178–6191. [Google Scholar] [CrossRef] [Green Version]
- Prime, M.B. Cross-sectional mapping of residual stresses by measuring the surface contour after a cut. J. Eng. Mater. Technol. 2001, 123, 162–168. [Google Scholar] [CrossRef] [Green Version]
- Zhang, Q.; Zhou, H.; Wang, J. Residual stress evaluation with contour method for thick butt welded joint. In New Challenges in Residual Stress Measurements and Evaluation; Books on Demand: Norderstedt, Germany, 2020. [Google Scholar] [CrossRef]
- Hofmann, M.; Seidl, G.A.; Rebelo-Kornmeier, J.; Garbe, U.; Schneider, R.; Wimpory, R.C.; Wasmuth, U.; Noster, U. The new materials science diffractometer STRESS-SPEC at FRM-II. Mater. Sci. Forum 2006, 524–525, 211–216. [Google Scholar] [CrossRef]
- Brokmeier, H.-G.; Gan, W.; Randau, C.; Völler, M.; Rebelo-Kornmeier, J.; Hofmann, M. Texture analysis at neutron diffractometer STRESS-SPEC. Nucl. Instrum. Methods Phys. Res. Sect. A Accel. Spectrom. Detect. Assoc. Equip. 2011, 642, 87–92. [Google Scholar] [CrossRef] [Green Version]
- Hauk, V.; Behnken, H. Structural and Residual Stress Analysis by Nondestructive Methods: Evaluation—Application—Assessment; Elsevier: Amsterdam, The Netherlands, 2006. [Google Scholar]
- Georg Fischer, A.G. Agie Charmilles. Available online: https://www.gfms.com/country_CH/de.html (accessed on 28 September 2020).
- Dassault Systemes, Abaqus: Abaqus Manual. Available online: http://130.149.89.49:2080/v2016/index.html (accessed on 28 September 2021).
- Pagliaro, P.; Prime, M.B.; Swenson, H.; Zuccarello, B. Measuring multiple residual-stress components using the contour method and multiple cuts. Exp. Mech. 2010, 50, 187–194. [Google Scholar] [CrossRef]
- Eigenmann, B.; Macherauch, E. Röntgenographische untersuchung von spannungszuständen in werkstoffen. teil III. Fortsetzung von matwiss. und werkstofftechn. Heft 3/1995, S. 148–160 und heft 4/1995, s. 199–216. Mater. Sci. Eng. Technol. 1996, 27, 426–437. [Google Scholar] [CrossRef]
- Kiewel, H.; Bunge, H.J.; Fritsche, L. Calculation of linear and non-linear elastic properties of polycrystalline materials by use of a cluster model. Textures Microstruct. 1997, 28, 261–271. [Google Scholar] [CrossRef] [Green Version]
- Park, N.J.; Bunge, H.J. Determination of texture in CuZnAl shape memory alloys in the high temperature austenitic phase. Mater. Sci. Forum 1994, 157–162, 167–174. [Google Scholar] [CrossRef]
- Vandermeulen, W.; Scibetta, M.; Leenaers, A.; Schuurmans, J.; Gerard, R. Measurement of the young modulus anisotropy of a reactor pressure vessel cladding. J. Nucl. Mater. 2008, 372, 249–255. [Google Scholar] [CrossRef]
- Gill, T.P.S.; Vijayalkshmi, M.; Rodríguez, P.; Padmanabhan, K.A. On microstructure-property correlation of thermally aged type 316L stainless steel weld metal. Met. Mater. Trans. A 1989, 20, 1115–1124. [Google Scholar] [CrossRef]
- Marques, M.; Ramasamy, A.; Batista, A.; Nobre, J.; Loureiro, A. Effect of heat treatment on microstructure and residual stress fields of a weld multilayer austenitic steel clad. J. Mater. Process. Technol. 2015, 222, 52–60. [Google Scholar] [CrossRef]
- Hutchings, M.T.; Withers, P.J.; Holden, T.M.; Lorentzen, T. Introduction to the Characterization of Residual Stress by Neutron; CRC PRESS: Boca Raton, FL, USA, 2005. [Google Scholar]
- Withers, P.J. Residual Stresses: Measurement by Diffraction, Encyclopedia of Materials: Science and Technology; Elsevier: Amsterdam, The Netherlands, 2001; pp. 8158–8169. [Google Scholar]
- Withers, P.J. Residual Stresses: Definition, Encyclopedia of Materials: Science and Technology; Elsevier: Amsterdam, The Netherlands, 2001; pp. 8110–8112. [Google Scholar]
- Zaera, R.; Rodriguez-Martinez, J.; Casado, A.; Fernandez-Saez, J.; Rusinek, A.; Pesci, R. A constitutive model for analyzing martensite formation in austenitic steels deforming at high strain rates. Int. J. Plast. 2012, 29, 77–101. [Google Scholar] [CrossRef] [Green Version]
- Zhang, Y.; Ganguly, S.; Edwards, L.; Fitzpatrick, M. Cross-sectional mapping of residual stresses in a VPPA weld using the contour method. Acta Materialia 2004, 52, 5225–5232. [Google Scholar] [CrossRef]
- Rangaswamy, P.; Griffith, M.; Prime, M.; Holden, T.; Rogge, R.; Edwards, J.; Sebring, R. Residual stresses in LENS® components using neutron diffraction and contour method. Mater. Sci. Eng. A 2005, 399, 72–83. [Google Scholar] [CrossRef]
- Prime, M.B.; Gnaupel-Herold, T.; Baumann, J.A.; Lederich, R.J.; Bowden, D.M.; Sebring, R.J. Residual stress measurements in a thick, dissimilar aluminum alloy friction stir weld. Acta Materialia 2006, 54, 4013–4021. [Google Scholar] [CrossRef]
- Pagliaro, P.; Prime, M.B.; Clausen, B.; Lovato, M.L.; Zuccarello, B. Known residual stress specimens using opposed indentation. J. Eng. Mater. Technol. 2009, 131, 31002. [Google Scholar] [CrossRef]
- Withers, P.; Turski, M.; Edwards, L.; Bouchard, P.; Buttle, D. Recent advances in residual stress measurement. Int. J. Press. Vessel. Pip. 2008, 85, 118–127. [Google Scholar] [CrossRef]
- Woo, W.; Choo, H.; Prime, M.; Feng, Z.; Clausen, B. Microstructure, texture and residual stress in a friction-stir-processed AZ31B magnesium alloy. Acta Materialia 2008, 56, 1701–1711. [Google Scholar] [CrossRef]
- Dennis, R.J.; Bray, D.P.; Leggatt, N.A.; Turski, M. Assessment of the influence of plasticity and constraint on measured residual stresses using the contour method. In Materials and Fabrication, Parts A and B; ASMEDC: Chicago, IL, USA, 2008; Volume 6, pp. 477–485. [Google Scholar]
- Shin, S.H. FEM analysis of plasticity-induced error on measurement of welding residual stress by the contour method. J. Mech. Sci. Technol. 2005, 19, 1885–1890. [Google Scholar] [CrossRef]
- Woo, W.; An, G.; Kingston, E.; DeWald, A.; Smith, D.; Hill, M.R. Through-thickness distributions of residual stresses in two extreme heat-input thick welds: A neutron diffraction, contour method and deep hole drilling study. Acta Materialia 2013, 61, 3564–3574. [Google Scholar] [CrossRef]
- Thibault, D.; Bocher, P.; Thomas, M.; Gharghouri, M.; Côté, M. Residual stress characterization in low transformation temperature 13%Cr–4%Ni stainless steel weld by neutron diffraction and the contour method. Mater. Sci. Eng. A 2010, 527, 6205–6210. [Google Scholar] [CrossRef]
- Woo, W.; An, G.B.; Em, V.T.; De Wald, A.T.; Hill, M.R. Through-thickness distributions of residual stresses in an 80 mm thick weld using neutron diffraction and contour method. J. Mater. Sci. 2014, 50, 784–793. [Google Scholar] [CrossRef]
- Wimpory, R.C.; May, P.S.; O’Dowd, N.P.; A Webster, G.; Smith, D.J.; Kingston, E. Measurement of residual stresses in T-plate weldments. J. Strain Anal. Eng. Des. 2003, 38, 349–365. [Google Scholar] [CrossRef]


| Material Name | C | Si | Mn | S | Cr | Ni | N | P | Cu | Mo |
|---|---|---|---|---|---|---|---|---|---|---|
| Parent material (P355 NH) | 0.18 | 0.33 | 1.12 | 0.002 | 0.04 | 0.16 | 0.004 | 0.015 | 0.21 | - |
| 1st cladding layer (AISI 309L) | 0.008 | 0.29 | 1.4 | 0.003 | 21.3 | 14.8 | 0.057 | 0.016 | 0.11 | 2.57 |
| 2nd and 3rd cladding layers (AISI 316L) | 0.018 | 0.38 | 1.8 | 0.009 | 18 | 11.7 | 0.055 | 0.016 | 0.07 | 2.54 |
| Flux Composition (wt.%) | ||||
|---|---|---|---|---|
| SiO2 | MgO | CaF2 | Al2O3 | Cr |
| 31 | 25 | 6 | 13 | 4.8 |
| Arc voltage | 29–30 V DC (+) | |||
| Arc current | 300 A | |||
| Preheating | 150 °C | |||
| AW | HT540 | HT620 | |
|---|---|---|---|
| Third cladded layer | 201 | 153 | 158 |
| Second cladded layer | 171 | 146 | 162 |
| First cladded layer | 205 | 178 | 181 |
| global | 183 | 151 | 165 |
Publisher’s Note: MDPI stays neutral with regard to jurisdictional claims in published maps and institutional affiliations. |
© 2022 by the authors. Licensee MDPI, Basel, Switzerland. This article is an open access article distributed under the terms and conditions of the Creative Commons Attribution (CC BY) license (https://creativecommons.org/licenses/by/4.0/).
Share and Cite
Rebelo Kornmeier, J.; Marques, M.J.; Gan, W.; Batista, A.C.; Paddea, S.; Loureiro, A. Quantification of Residual Stress Relief by Heat Treatments in Austenitic Cladded Layers. Materials 2022, 15, 1364. https://doi.org/10.3390/ma15041364
Rebelo Kornmeier J, Marques MJ, Gan W, Batista AC, Paddea S, Loureiro A. Quantification of Residual Stress Relief by Heat Treatments in Austenitic Cladded Layers. Materials. 2022; 15(4):1364. https://doi.org/10.3390/ma15041364
Chicago/Turabian StyleRebelo Kornmeier, Joana, Maria José Marques, Weimin Gan, António Castanhola Batista, Sanjooram Paddea, and Altino Loureiro. 2022. "Quantification of Residual Stress Relief by Heat Treatments in Austenitic Cladded Layers" Materials 15, no. 4: 1364. https://doi.org/10.3390/ma15041364