Long-Term Aging Behavior of Plastic/Styrene Butadiene Rubber (SBR) Composite Modified Bitumen
Abstract
:1. Introduction
2. Materials and Methods
2.1. Materials
2.2. Methods
2.2.1. Preparation Process of Composite Modified Bitumen
2.2.2. Aging Methods
2.2.3. Temperature Sweep (TS) Test
2.2.4. Multiple Stress Creep Recovery (MSCR) Test
2.2.5. GPC Test
3. Results and Discussion
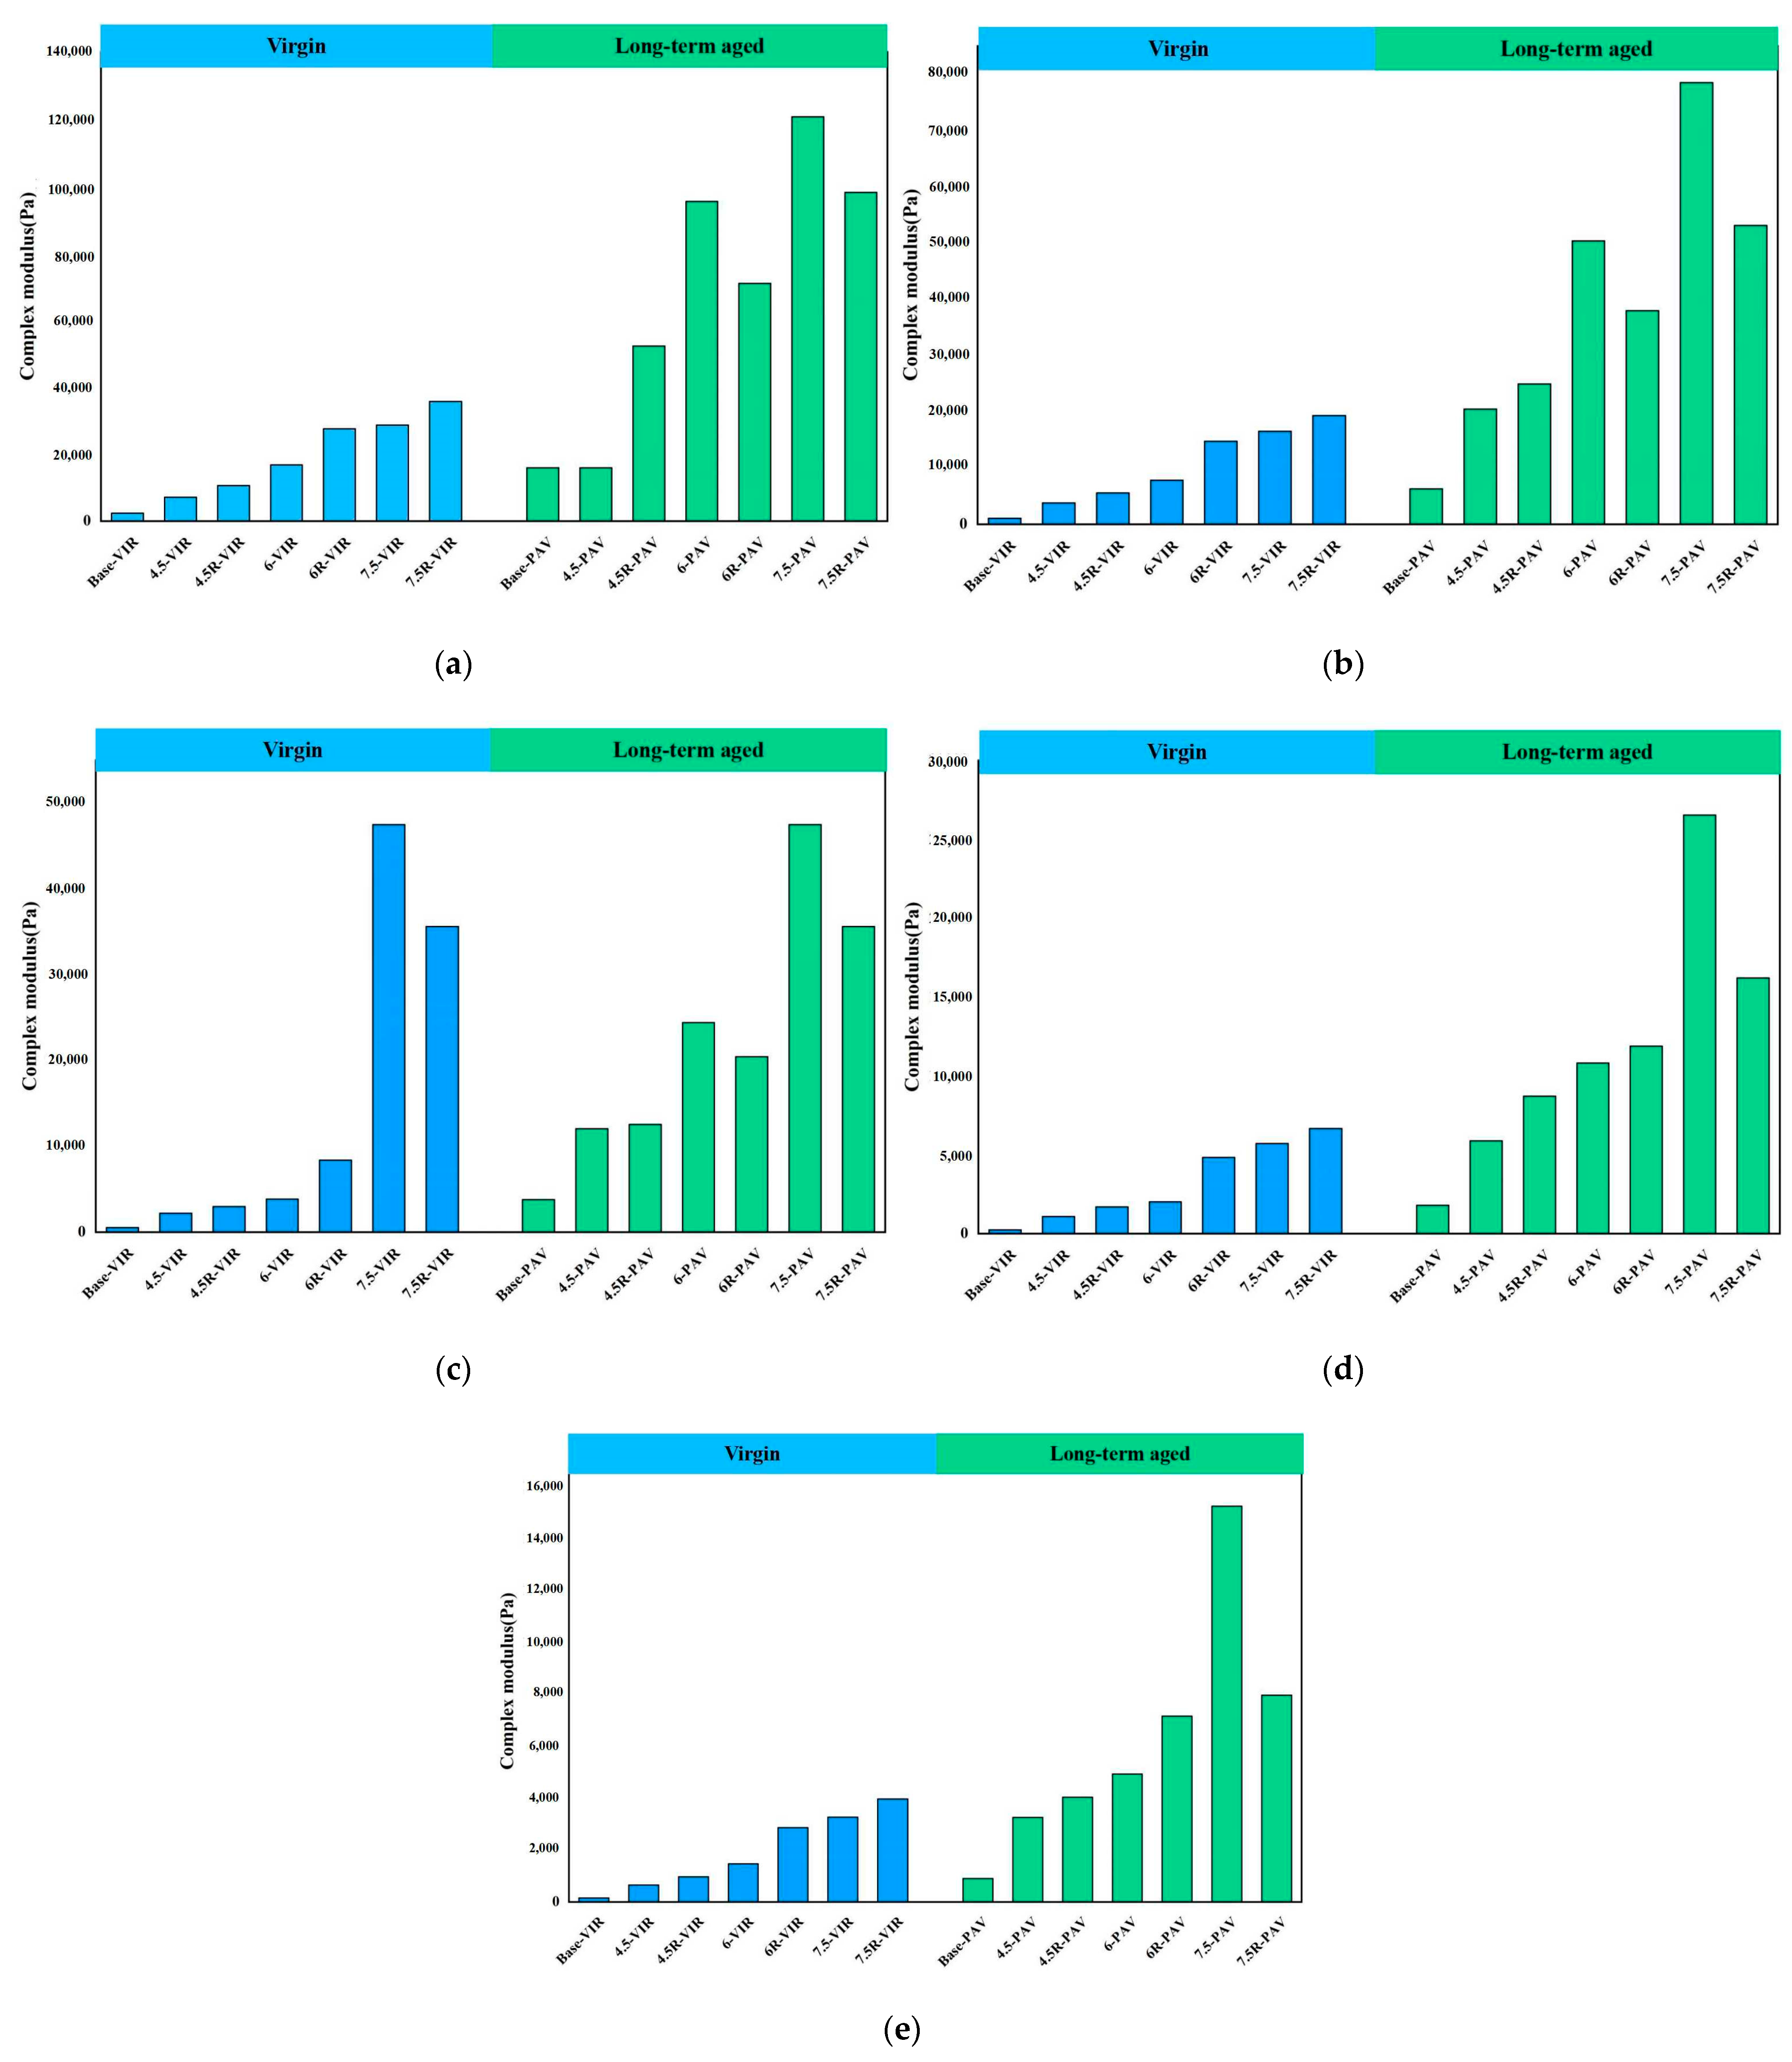
3.1. Evaluation of Complex Modulus G*
3.2. Evaluation of Phase Angle δ
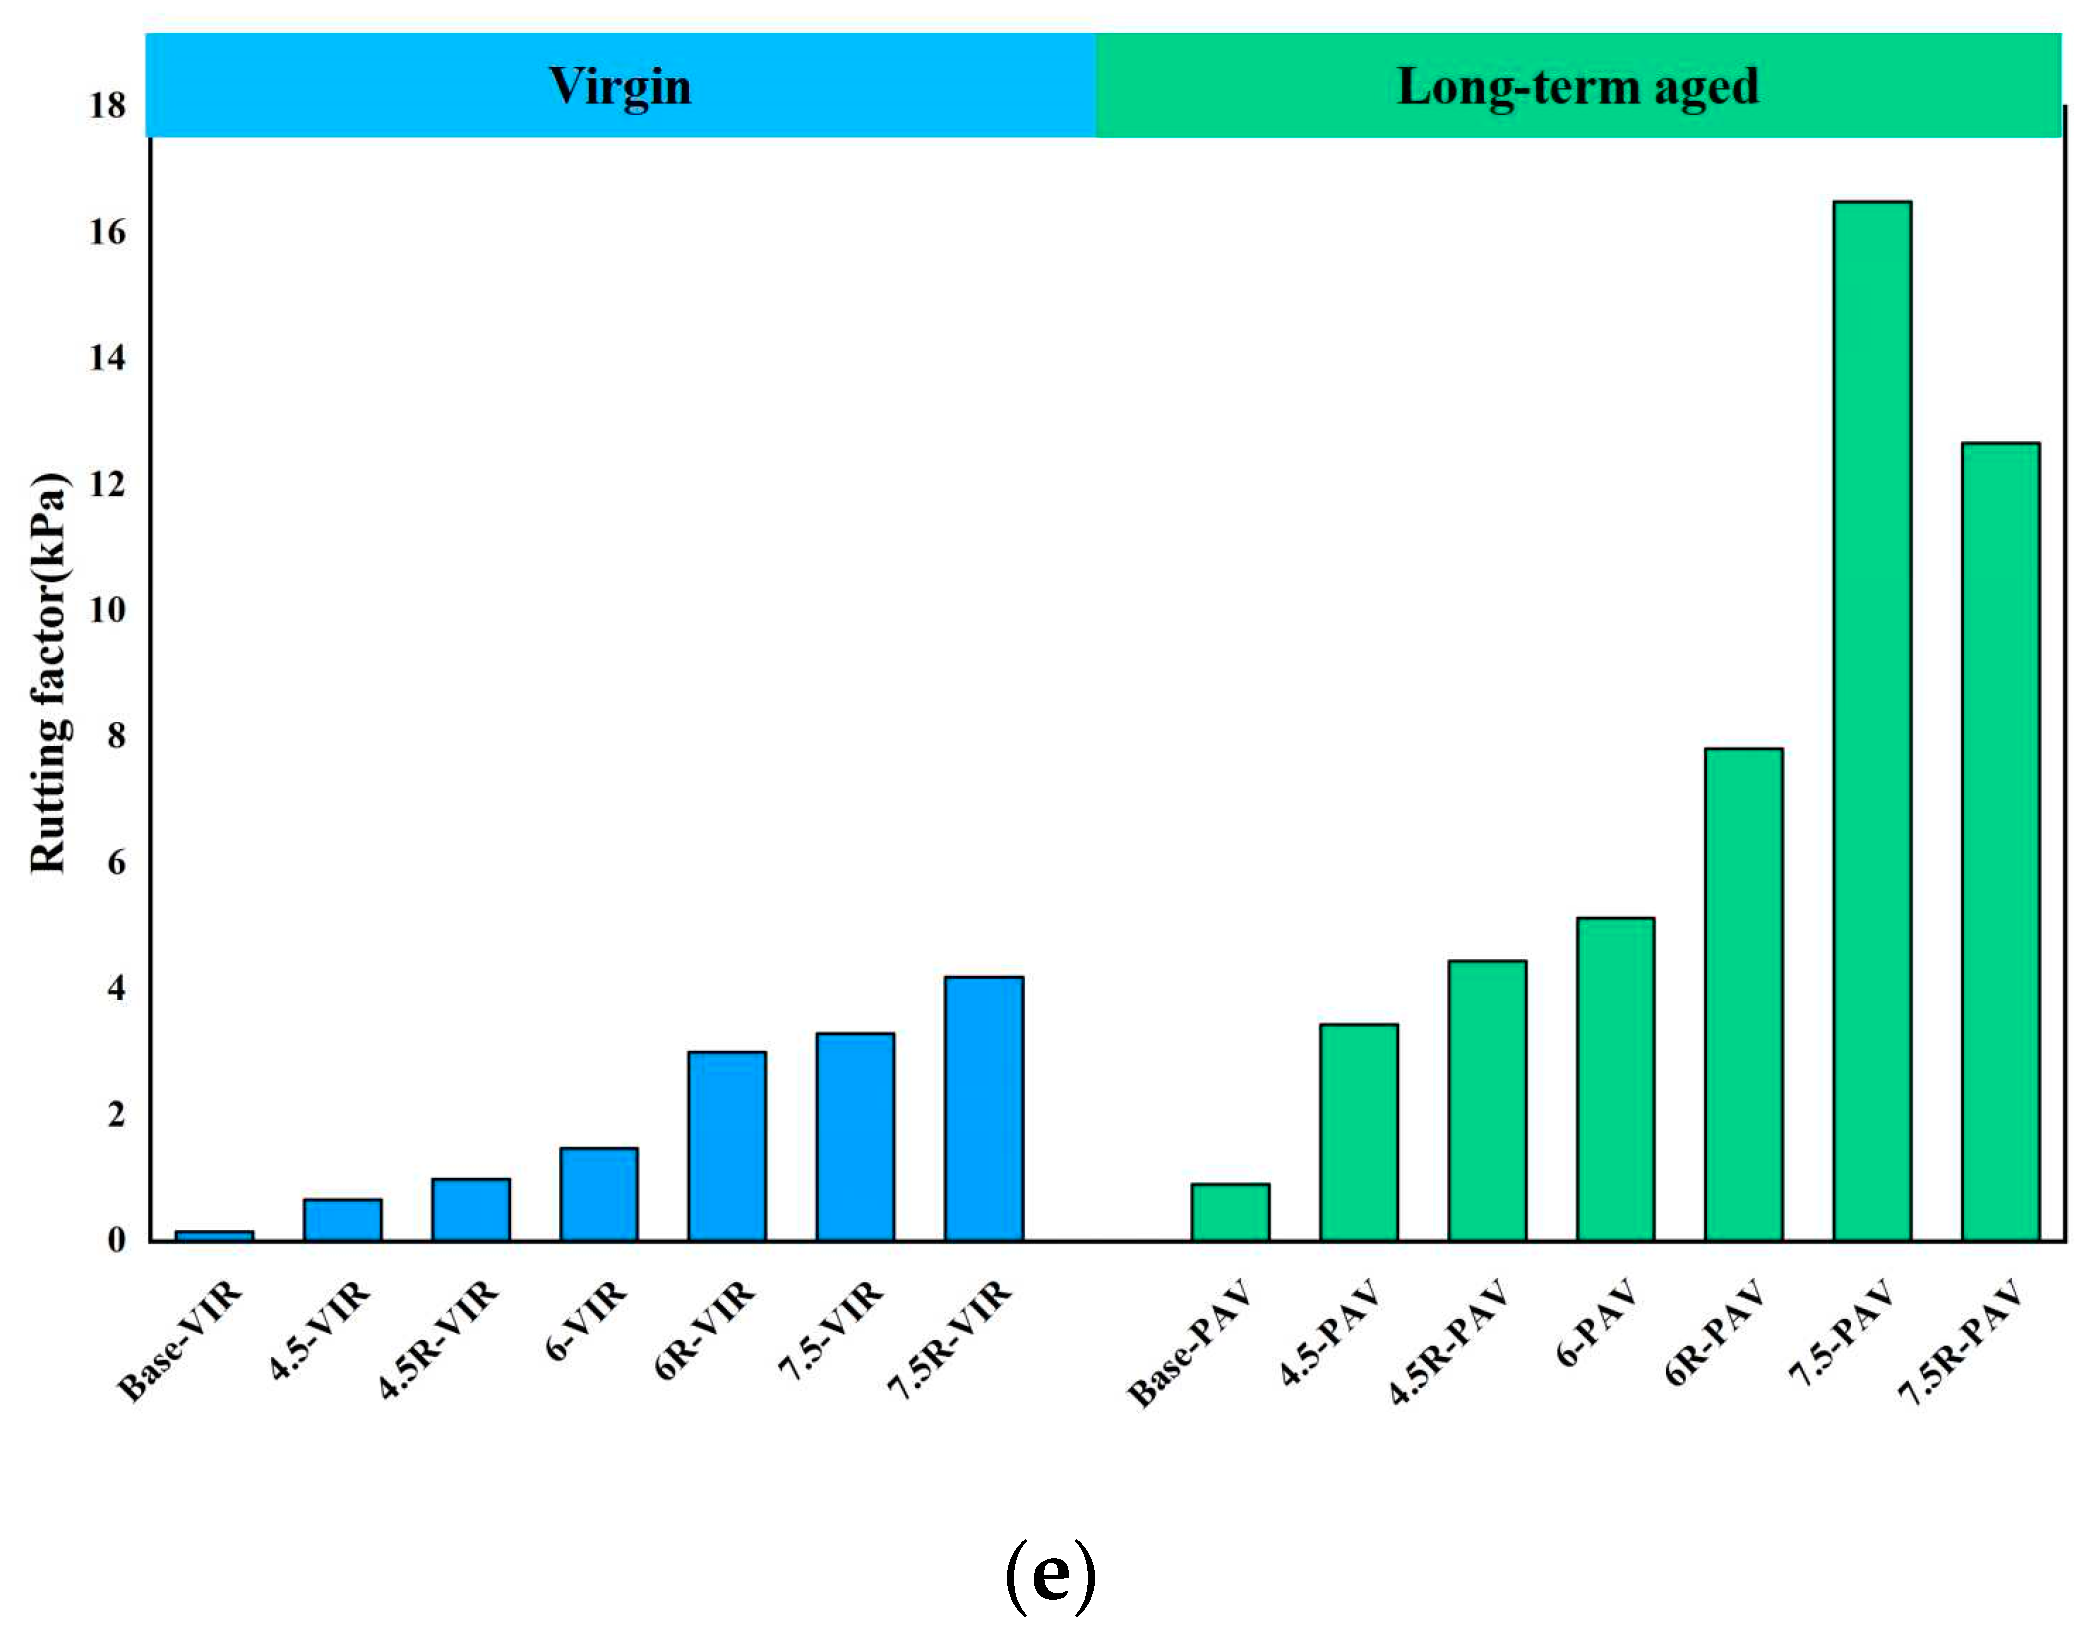
3.3. Evaluation of Rutting Factor G*/sinδ
3.4. Evaluation of Percent Recovery and Non-Recoverable Creep Compliance
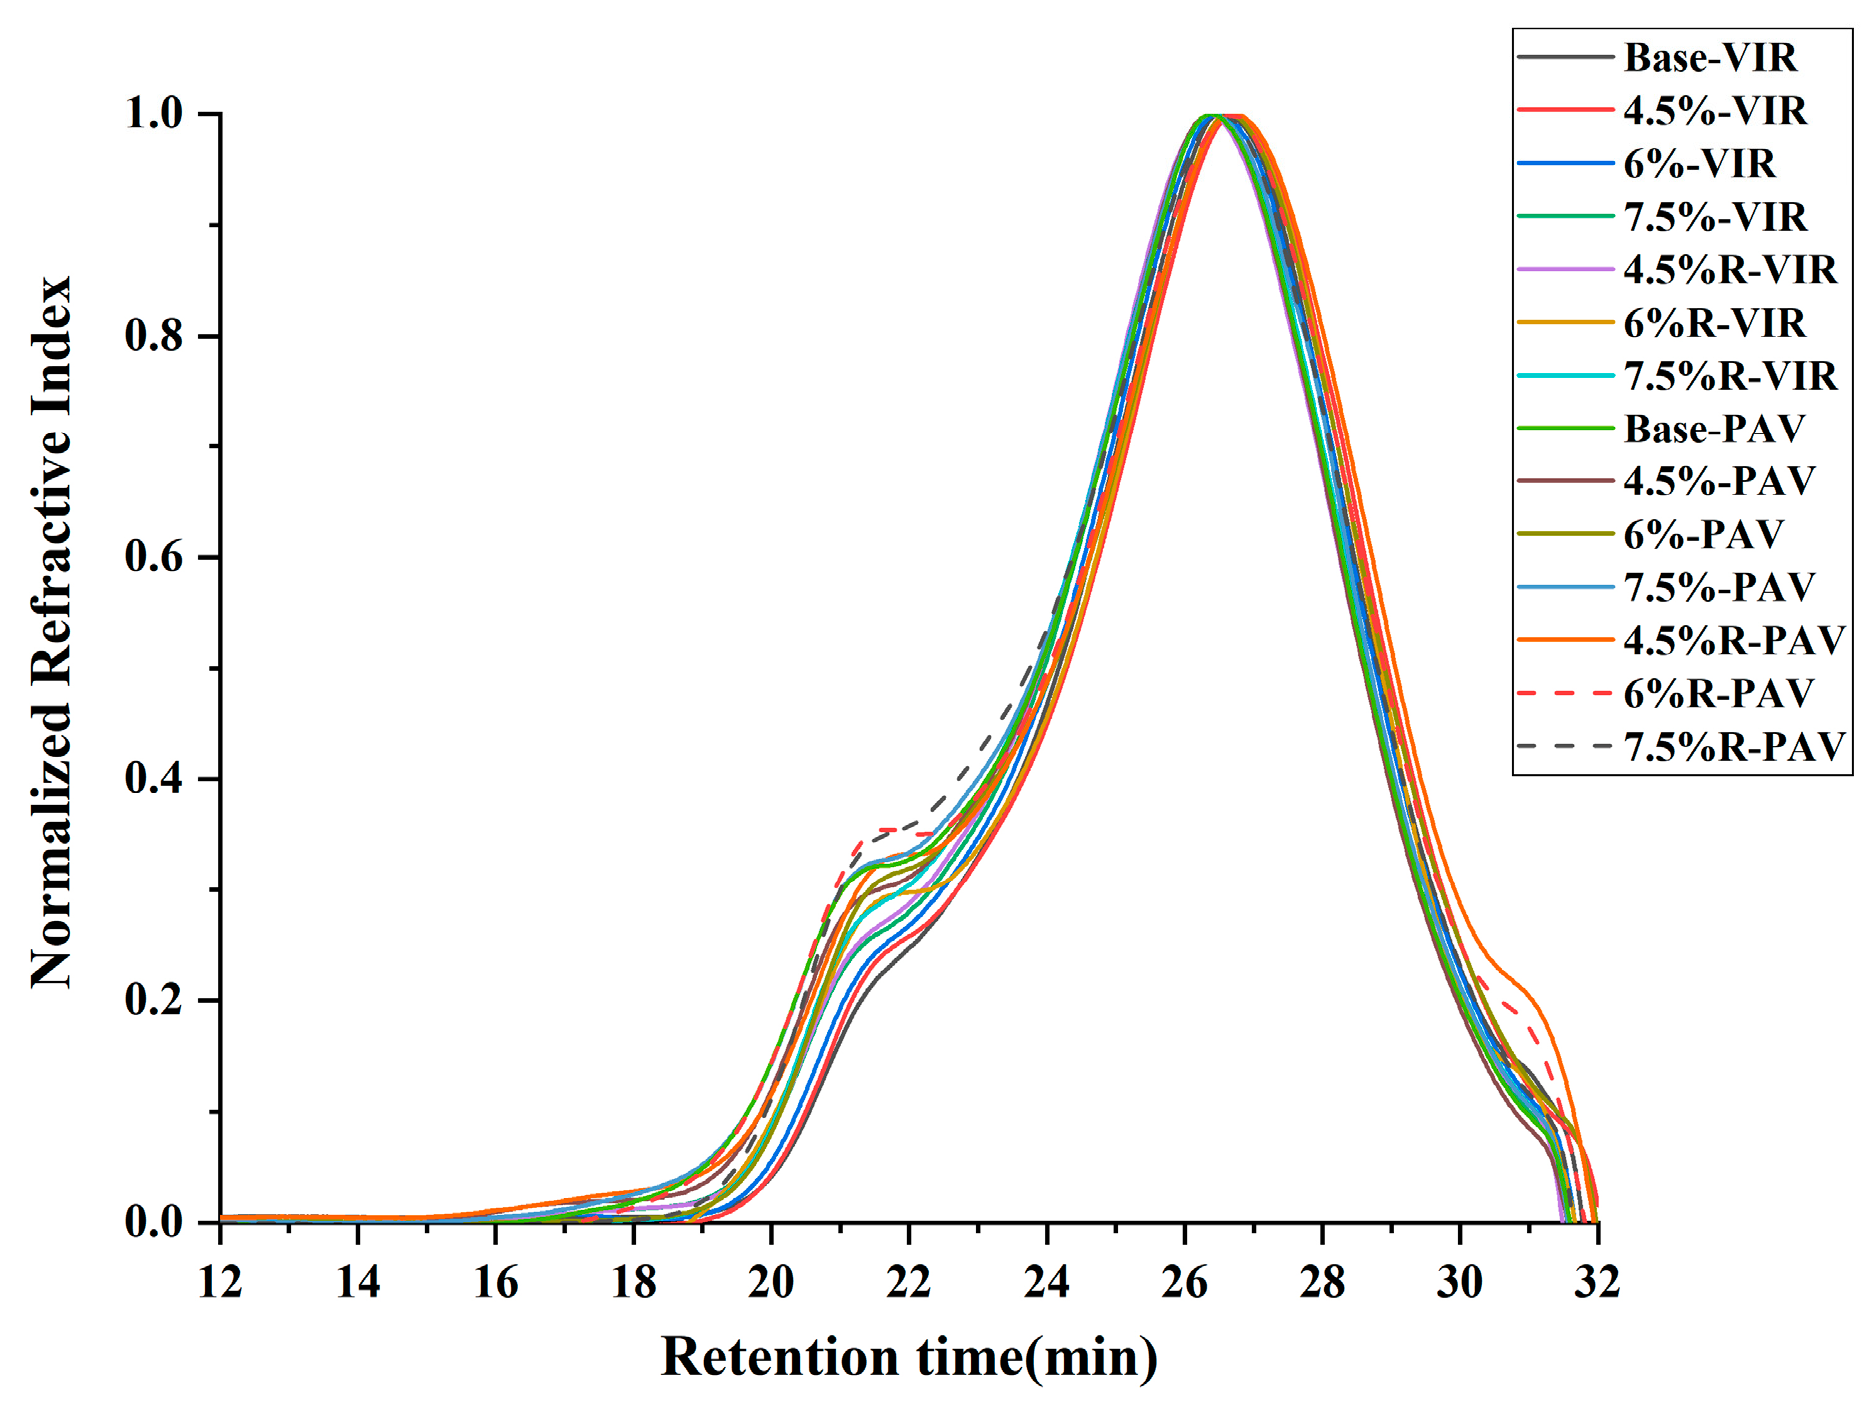
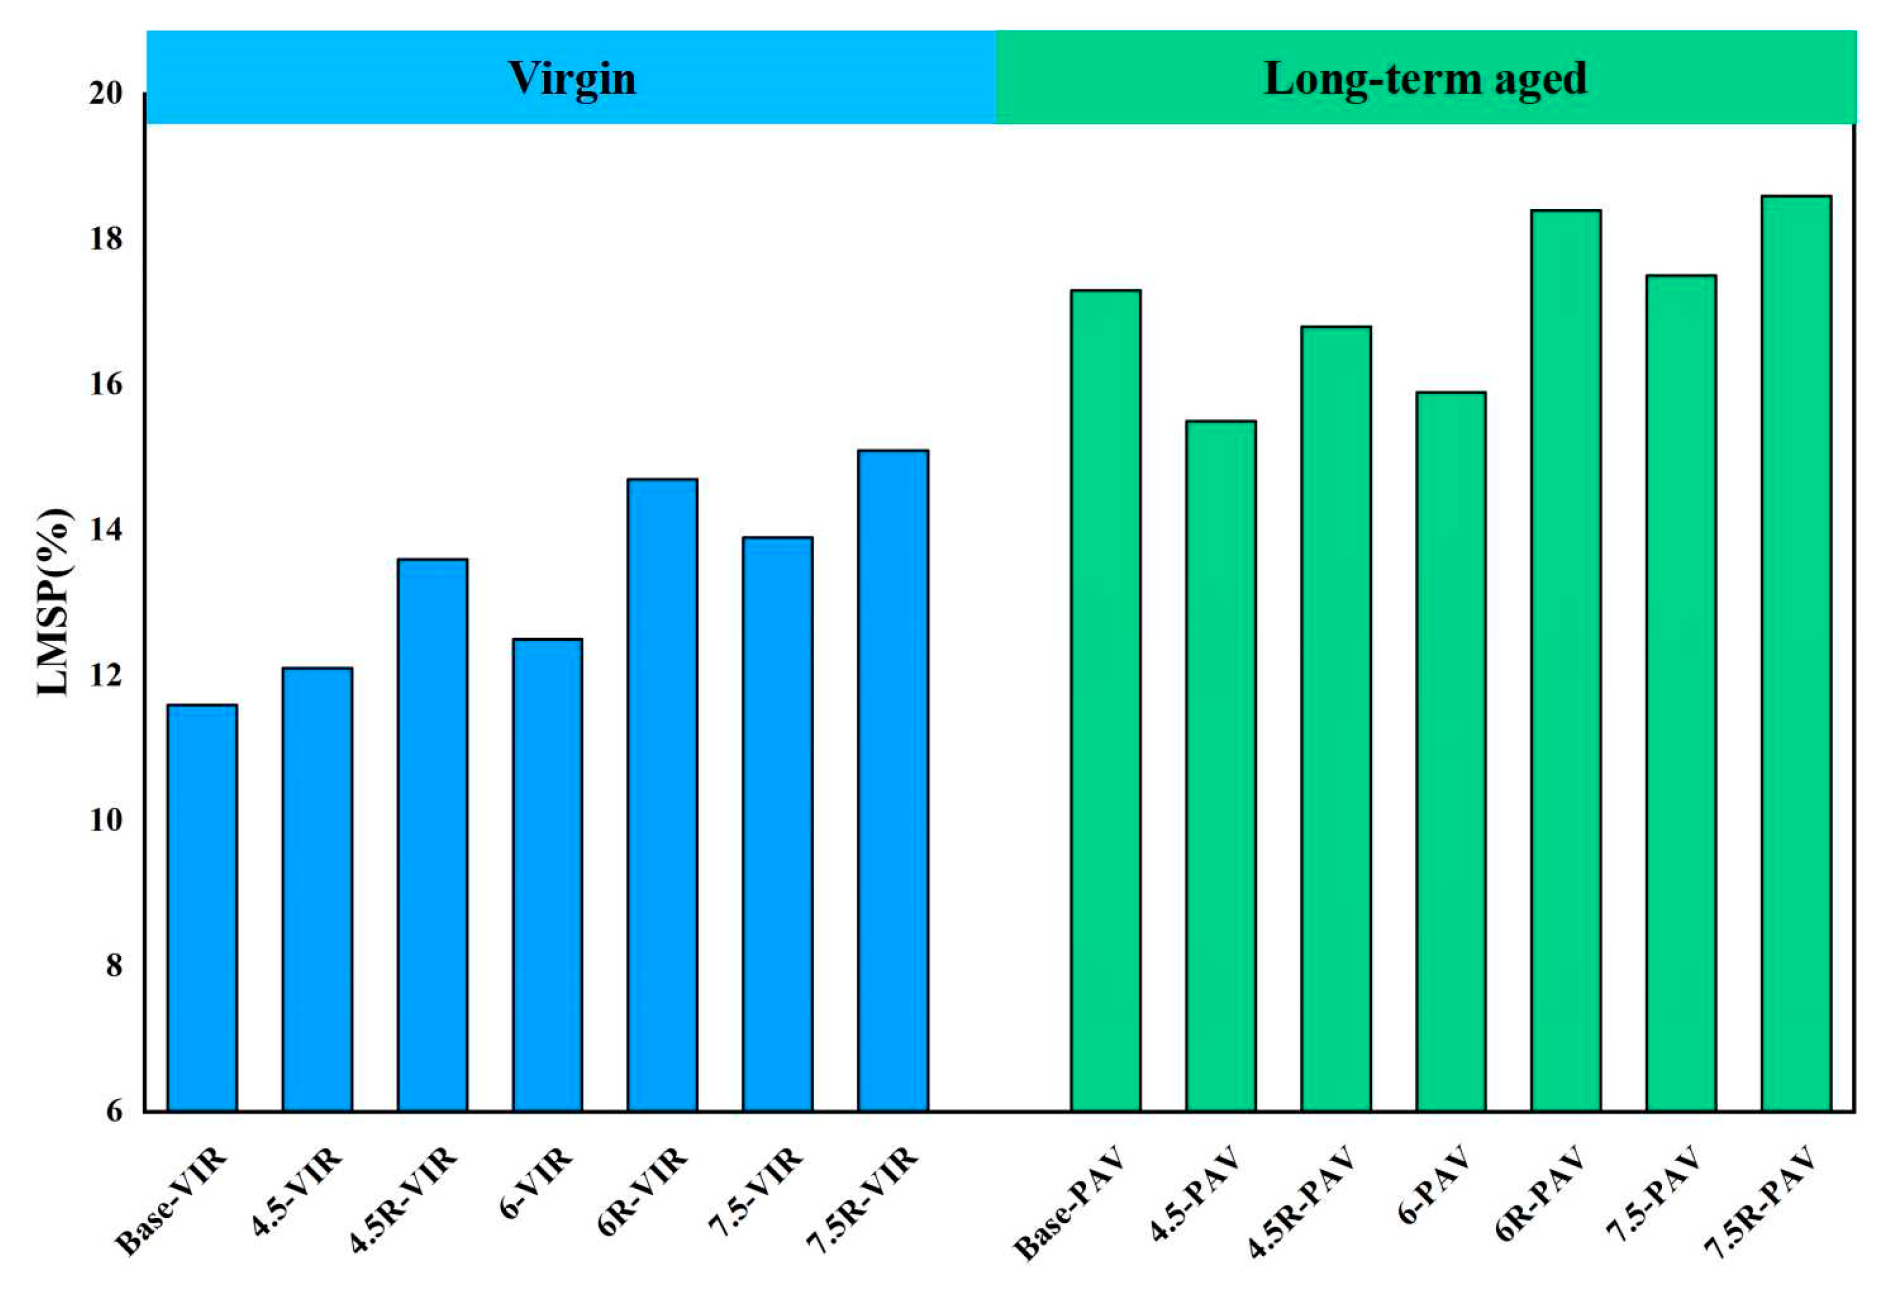
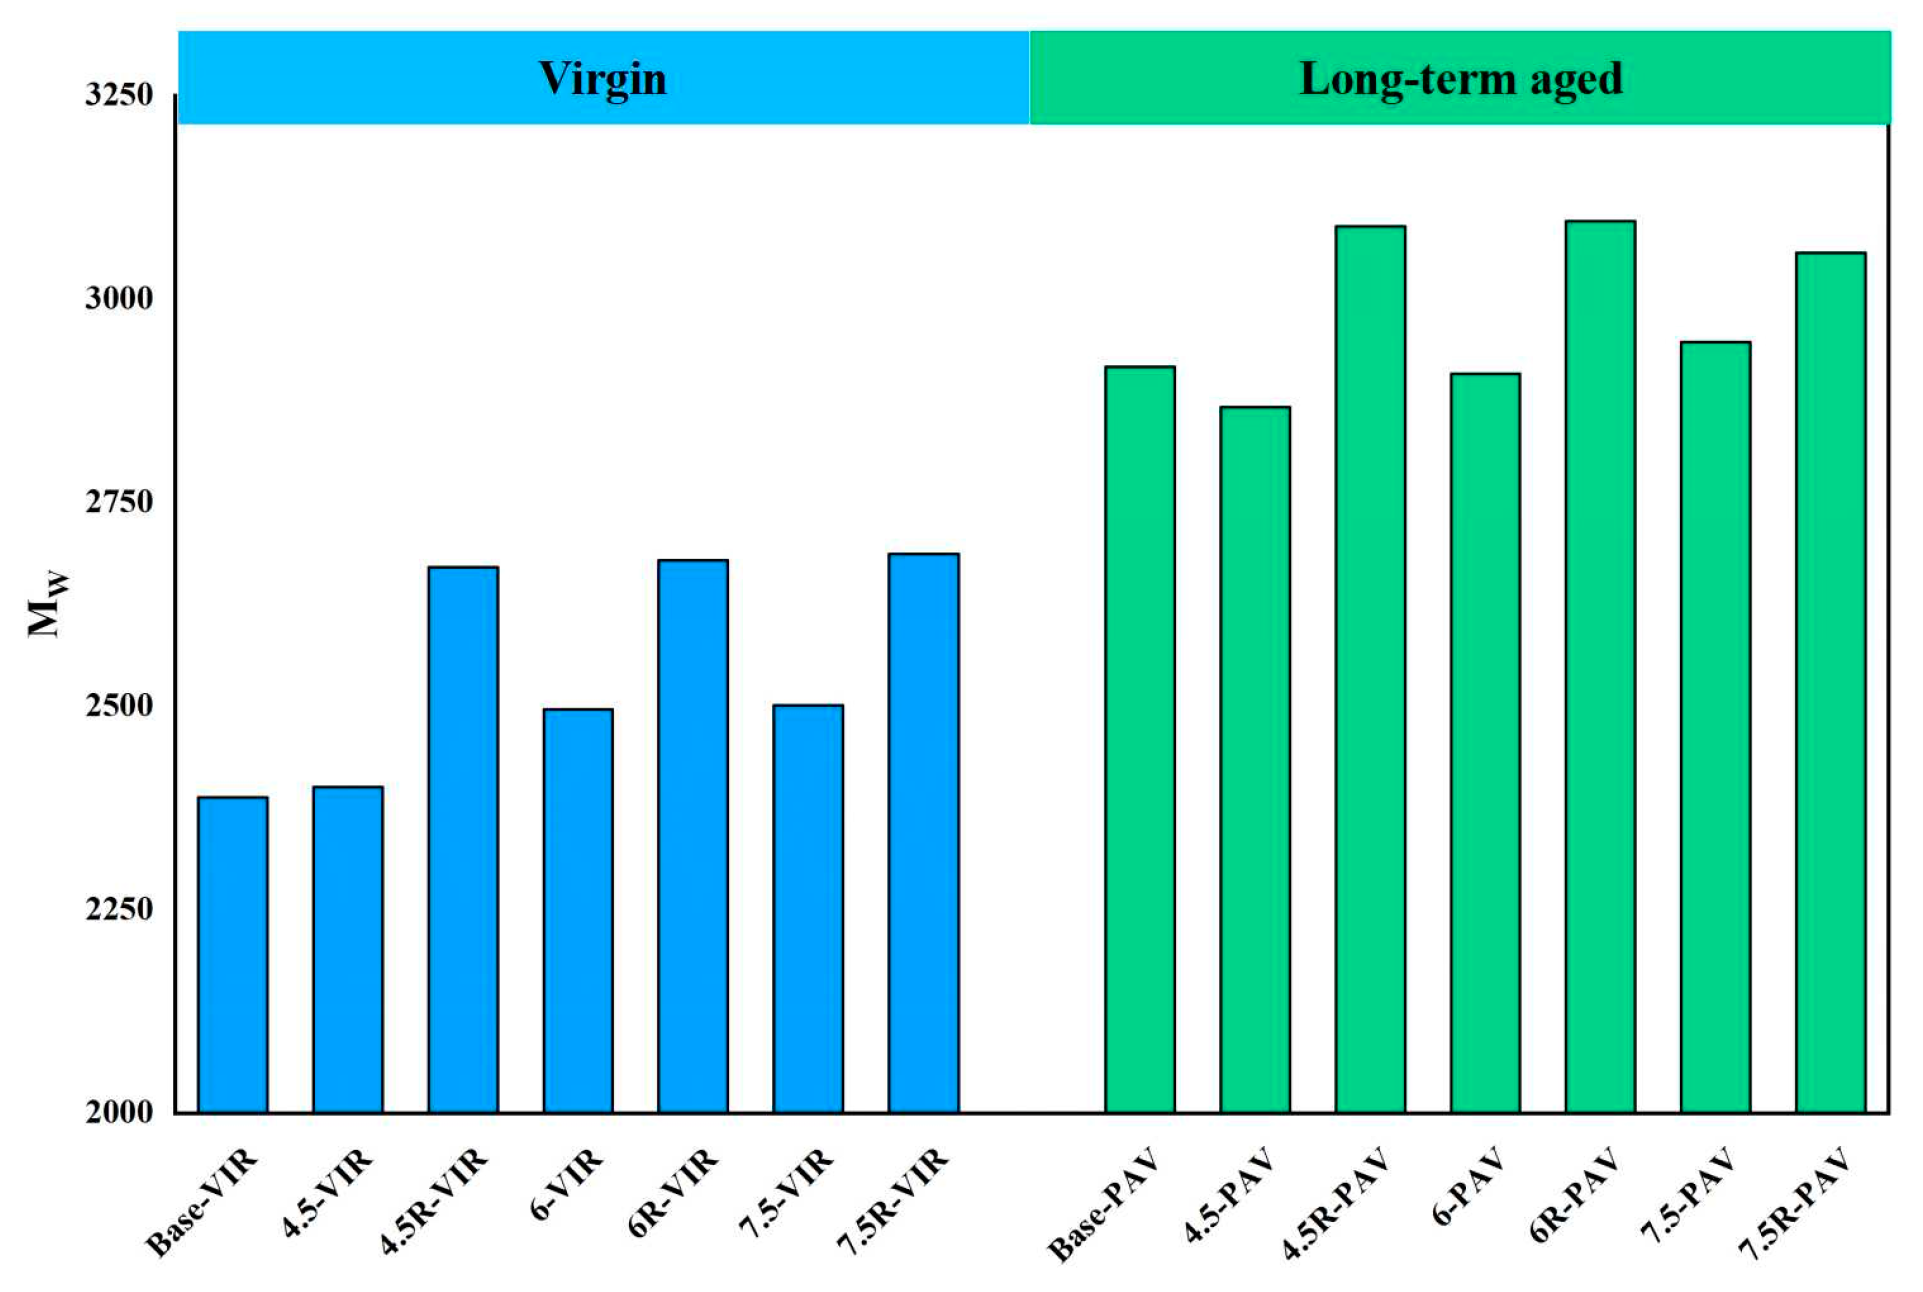
3.5. Evaluation of Molecular Weight Distribution
3.6. Correlation between Molecular Weight and Rheological Properties
4. Conclusions
- Modification by plastic improves the high-temperature performance of bitumen. It increases complex modulus, rutting factor and percent recovery of bitumen while it decreases the phase angle and non-recoverable creep compliance of bitumen. The integrate modification of plastic and SBR generates an elastic supporting network of bitumen, further enhancing the high-temperature performance of modified bitumen. The enhancement effect is more pronounced with increasing plastic inclusion.
- The aggregation of small molecules occurs during the modification by plastic and SBR, as the large size molecule percentage in bitumen increases. During the long-term aging process, the small molecules in the bitumen also undergo aggregation reactions, and the LMSP and of bitumen increases.
- For all three plastic-modified bitumen, the CAI, LAI and MAI are smaller than those of base bitumen. The aging resistance of bitumen is improved by an average of about 10% after the addition of plastic modifiers, and it improves more significantly with increasing plastic content. After the addition of SBR modifier, the aging resistance of modified bitumen is further improves.
Author Contributions
Funding
Institutional Review Board Statement
Informed Consent Statement
Data Availability Statement
Conflicts of Interest
References
- Wang, T.; Dra, Y.A.S.S.; Cai, X.; Cheng, Z.; Zhang, D.; Lin, Y.; Yu, H. Advanced cold patching materials (CPMs) for asphalt pavement pothole rehabilitation: State of the art. J. Clean. Prod. 2022, 366, 133001. [Google Scholar] [CrossRef]
- Wang, T.; Weng, Y.; Cai, X.; Li, J.; Xiao, F.; Sun, G.; Zhang, F. Statistical modeling of low-temperature properties and FTIR spectra of crumb rubber modified asphalts considering SARA fractions. J. Clean. Prod. 2022, 374, 134016. [Google Scholar] [CrossRef]
- Valdés, G.; Pérez-Jiménez, F.; Miró, R.; Martínez, A.; Botella, R. Experimental study of recycled asphalt mixtures with high percentages of reclaimed asphalt pavement (RAP). Constr. Build. Mater. 2011, 25, 1289–1297. [Google Scholar] [CrossRef] [Green Version]
- Xing, C.; Jiang, W.; Wang, M.; Zhao, K.; Li, Z. Minireview on the Rejuvenation of Aged Styrene–Butadiene–Styrene (SBS) Modified Bitumen: State-of-the-Art and Outlook. Energy Fuels 2023, 37, 7634–7647. [Google Scholar] [CrossRef]
- Dalhat, M.A.; Al-Abdul Wahhab, H.I. Performance of recycled plastic waste modified asphalt binder in Saudi Arabia. Int. J. Pavement Eng. 2017, 18, 349–357. [Google Scholar] [CrossRef]
- Li, H.; Zhou, L.; Sun, J.; Wang, S.; Zhang, M.; Hu, Y.; Temitope, A.A. Analysis of the Influence of Production Method, Plastic Content on the Basic Performance of Waste Plastic Modified Asphalt. Polymers 2022, 14, 4350. [Google Scholar] [CrossRef] [PubMed]
- Kakar, M.R.; Mikhailenko, P.; Piao, Z.; Poulikakos, L.D. High and low temperature performance of polyethylene waste plastic modified low noise asphalt mixtures. Constr. Build. Mater. 2022, 348, 128633. [Google Scholar] [CrossRef]
- Xing, C.; Li, M.; Liu, L.; Lu, R.; Liu, N.; Wu, W.; Yuan, D. A comprehensive review on the blending condition between virgin and RAP asphalt binders in hot recycled asphalt mixtures: Mechanisms, evaluation methods, and influencing factors. J. Clean. Prod. 2023, 398, 136515. [Google Scholar] [CrossRef]
- Modarres, A.; Hamedi, H. Effect of waste plastic bottles on the stiffness and fatigue properties of modified asphalt mixes. Mater. Des. 2014, 61, 8–15. [Google Scholar] [CrossRef]
- Wu, S.; Montalvo, L. Repurposing waste plastics into cleaner asphalt pavement materials: A critical literature review. J. Clean. Prod. 2021, 280, 124355. [Google Scholar] [CrossRef]
- Al-Abdul Wahhab, H.I.; Dalhat, M.A.; Habib, M.A. Storage stability and high-temperature performance of asphalt binder modified with recycled plastic. Road Mater. Pavement Des. 2017, 18, 1117–1134. [Google Scholar] [CrossRef]
- Andriescu, A.; Hesp, S.A.; Youtcheff, J.S. Essential and plastic works of ductile fracture in asphalt binders. Transp. Res. Rec. 2004, 1875, 1–7. [Google Scholar] [CrossRef]
- Xu, F.; Zhao, Y.; Li, K. Using waste plastics as asphalt modifier: A review. Materials 2022, 15, 110. [Google Scholar] [CrossRef] [PubMed]
- Joohari, I.B.; Maniam, S.; Giustozzi, F. Enhancing the storage stability of SBS-plastic waste modified bitumen using reactive elastomeric terpolymer. Int. J. Pavement Res. Technol. 2023, 16, 304–318. [Google Scholar] [CrossRef]
- Zhang, F.; Hu, C. The research for crumb rubber/waste plastic compound modified asphalt. J. Therm. Anal. Calorim. 2016, 124, 729–741. [Google Scholar] [CrossRef]
- Leng, Z.; Padhan, R.K.; Sreeram, A. Production of a sustainable paving material through chemical recycling of waste PET into crumb rubber modified asphalt. J. Clean. Prod. 2018, 180, 682–688. [Google Scholar] [CrossRef]
- Yildirim, Y. Polymer modified asphalt binders. Constr. Build. Mater. 2007, 21, 66–72. [Google Scholar] [CrossRef]
- Peidayesh, H.; Špitalský, Z.; Chodák, I. Electrical Conductivity of Rubber Composites with Varying Crosslink Density under Cyclic Deformation. Polymers 2022, 14, 3640. [Google Scholar] [CrossRef]
- Ren, S.; Liang, M.; Fan, W.; Zhang, Y.; Qian, C.; He, Y.; Shi, J. Investigating the effects of SBR on the properties of gilsonite modified asphalt. Constr. Build. Mater. 2018, 190, 1103–1116. [Google Scholar] [CrossRef]
- Liu, C.; Lv, S.; Jin, D.; Qu, F. Laboratory investigation for the road performance of asphalt mixtures modified by rock asphalt–styrene butadiene rubber. J. Mater. Civ. Eng. 2021, 33, 04020504. [Google Scholar] [CrossRef]
- Xing, C.; Jiang, W.; Li, M.; Wang, M.; Xiao, J.; Xu, Z. Application of atomic force microscopy in bitumen materials at the nanoscale: A review. Constr. Build. Mater. 2022, 342, 128059. [Google Scholar] [CrossRef]
- Yan, C.; Huang, W.; Lin, P.; Zhang, Y.; Lv, Q. Chemical and rheological evaluation of aging properties of high content SBS polymer modified asphalt. Fuel 2019, 252, 417–426. [Google Scholar] [CrossRef]
- Wang, S.; Huang, W.; Liu, X.; Lin, P. Influence of high content crumb rubber and different preparation methods on properties of asphalt under different aging conditions: Chemical properties, rheological properties, and fatigue performance. Constr. Build. Mater. 2022, 327, 126937. [Google Scholar] [CrossRef]
- Tang, N.; Lv, Q.; Huang, W.; Lin, P.; Yan, C. Chemical and rheological evaluation of aging characteristics of terminal blend rubberized asphalt binder. Constr. Build. Mater. 2019, 205, 87–96. [Google Scholar] [CrossRef]
- Pipintakos, G.; Ching, H.V.; Mühlich, U.; Soenen, H.; Van Doorslaer, S.; Sjövall, P.; Varveri, A.; Vande Velde, C.; Lu, X. Experimental validation of the dual-oxidation routes in bituminous binders. In RILEM International Symposium on Bituminous Materials, Proceedings of the RILEM International Symposium on Bituminous Materials: ISBM Lyon 2020; Springer International Publishing: Berlin/Heidelberg, Germany, 2020; pp. 903–909. [Google Scholar]
- Malinowski, S.; Bandura, L.; Woszuk, A. Influence of atmospheric oxygen on the structure and electronic properties of bitumen components—A DFT study. Fuel 2022, 325, 124551. [Google Scholar] [CrossRef]
- Pipintakos, G.; Lommaert, C.; Varveri, A.; Van den Bergh, W. Do chemistry and rheology follow the same laboratory ageing trends in bitumen? Mater. Struct. 2022, 55, 146. [Google Scholar] [CrossRef]
- Lin, P.; Yan, C.; Huang, W.; Li, Y.; Zhou, L.; Tang, N.; Xiao, F.; Zhang, Y.; Lv, Q. Rheological, chemical and aging characteristics of high content polymer modified asphalt. Constr. Build. Mater. 2019, 207, 616–629. [Google Scholar] [CrossRef]
- Wang, S.; Huang, W. Investigation of aging behavior of terminal blend rubberized asphalt with SBS polymer. Constr. Build. Mater. 2021, 267, 120870. [Google Scholar] [CrossRef]
- Yao, Z.; Zhang, J.; Gao, F.; Liu, S.; Yu, T. Integrated utilization of recycled crumb rubber and polyethylene for enhancing the performance of modified bitumen. Constr. Build. Mater. 2018, 170, 217–224. [Google Scholar] [CrossRef]
- Li, M.; Xing, C.; Liu, L.; Huang, W.; Meng, Y. Gel permeation chromatography-based method for assessing the properties of binders in reclaimed asphalt pavement mixtures. Constr. Build. Mater. 2022, 316, 126005. [Google Scholar] [CrossRef]
- Li, M.; Liu, L.; Xing, C.; Liu, L.; Wang, H. Influence of rejuvenator preheating temperature and recycled mixture’s curing time on performance of hot recycled mixtures. Constr. Build. Mater. 2021, 295, 123616. [Google Scholar] [CrossRef]





| Abbreviations | Full Description |
|---|---|
| SBR | Styrene butadiene rubber |
| SBS | Styrene-butadiene-styrene |
| GPC | Gel permeation chromatography |
| PAV | Pressure aging vessel |
| MSCR | Multiple stress creep recovery |
| TS | Temperature sweep |
| LMSP | Large molecule size percentage |
| CAI | Complex modulus aging index |
| LAI | Large molecular size distribution aging index |
| MAI | Molecular weight aging index |
| Properties | Results | Test Method |
|---|---|---|
| Penetration (25 °C, 100 g, 5 s, 0.1 mm) | 67.8 | ASTM D5 |
| Softening point (°C) | 48.3 | ASTM D36 |
| Ductility (15 °C, 5 cm/min, cm) | >100 | ASTM D113 |
| Rotary viscosity (135 °C, Pa·s) | 0.41 | ASTM D4402 |
| Bitumen | Waste Plastic Modifier | SBR | Long-Term Aging | Identifications |
|---|---|---|---|---|
| Base bitumen | - | - | - | Base-VIR |
| - | - | 20 h PAV | Base-PAV | |
| 4.5% | - | - | 4.5-VIR | |
| 4.5% | - | 20 h PAV | 4.5-PAV | |
| 4.5% | 3% | - | 4.5R-VIR | |
| 4.5% | 3% | 20 h PAV | 4.5R-PAV | |
| 6% | - | - | 6-VIR | |
| 6% | - | 20 h PAV | 6-PAV | |
| 6% | 3% | - | 6R-VIR | |
| 6% | 3% | 20 h PAV | 6R-PAV | |
| 7.5% | - | - | 7.5-VIR | |
| 7.5% | - | 20 h PAV | 7.5-PAV | |
| 7.5% | 3% | - | 7.5R-VIR | |
| 7.5% | 3% | 20 h PAV | 7.5R-PAV |
| Temperature | 58 °C CAI | 64 °C CAI | 70 °C CAI | 76 °C CAI | 82 °C CAI |
|---|---|---|---|---|---|
| Base bitumen | 6.82 | 6.16 | 7.39 | 7.51 | 5.87 |
| Base bitumen + 4.5% plastic | 5.96 | 5.43 | 5.48 | 5.42 | 4.98 |
| Base bitumen + 4.5% plastic + 3% SBR | 4.92 | 4.47 | 4.19 | 5.16 | 4.15 |
| Base bitumen + 6% plastic | 5.68 | 6.42 | 6.36 | 5.38 | 3.37 |
| Base bitumen + 6% plastic + 3% SBR | 2.58 | 2.57 | 2.44 | 2.46 | 2.51 |
| Base bitumen + 7.5% plastic | 4.21 | 4.75 | 4.98 | 4.64 | 4.67 |
| Base bitumen + 7.5% plastic + 3% SBR | 2.75 | 2.75 | 3.19 | 2.43 | 2.01 |
| Bitumen | LAI | MAI |
|---|---|---|
| Base bitumen | 1.49 | 1.22 |
| Base bitumen + 4.5% plastic | 1.28 | 1.19 |
| Base bitumen + 4.5% plastic + 3% SBR | 1.24 | 1.16 |
| Base bitumen + 6% plastic | 1.27 | 1.17 |
| Base bitumen + 6% plastic + 3% SBR | 1.25 | 1.16 |
| Base bitumen + 7.5% plastic | 1.27 | 1.18 |
| Base bitumen + 7.5% plastic + 3% SBR | 1.23 | 1.14 |
| Bitumen Type | Regression Equation | R2 |
|---|---|---|
| Plastic-modified bitumen | 0.71 | |
| 0.74 | ||
| 0.48 | ||
| 0.62 | ||
| Plastic/SBR-modified bitumen | 0.84 | |
| 0.75 | ||
| 0.53 | ||
| 0.37 |
Disclaimer/Publisher’s Note: The statements, opinions and data contained in all publications are solely those of the individual author(s) and contributor(s) and not of MDPI and/or the editor(s). MDPI and/or the editor(s) disclaim responsibility for any injury to people or property resulting from any ideas, methods, instructions or products referred to in the content. |
© 2023 by the authors. Licensee MDPI, Basel, Switzerland. This article is an open access article distributed under the terms and conditions of the Creative Commons Attribution (CC BY) license (https://creativecommons.org/licenses/by/4.0/).
Share and Cite
Xing, C.; Li, M.; Liu, L.; Yang, R. Long-Term Aging Behavior of Plastic/Styrene Butadiene Rubber (SBR) Composite Modified Bitumen. Materials 2023, 16, 4567. https://doi.org/10.3390/ma16134567
Xing C, Li M, Liu L, Yang R. Long-Term Aging Behavior of Plastic/Styrene Butadiene Rubber (SBR) Composite Modified Bitumen. Materials. 2023; 16(13):4567. https://doi.org/10.3390/ma16134567
Chicago/Turabian StyleXing, Chengwei, Mingchen Li, Lingxiao Liu, and Ruikang Yang. 2023. "Long-Term Aging Behavior of Plastic/Styrene Butadiene Rubber (SBR) Composite Modified Bitumen" Materials 16, no. 13: 4567. https://doi.org/10.3390/ma16134567
APA StyleXing, C., Li, M., Liu, L., & Yang, R. (2023). Long-Term Aging Behavior of Plastic/Styrene Butadiene Rubber (SBR) Composite Modified Bitumen. Materials, 16(13), 4567. https://doi.org/10.3390/ma16134567


