
Ab Initio Molecular Dynamics Study of Electron Excitation Effects on UO2 and U3Si
Yangtze Delta Region Institute (Huzhou), University of Electronic Science and Technology of China, Huzhou 313001, China
*
Author to whom correspondence should be addressed.
†
These authors contributed equally to this work.
Materials 2023, 16(21), 6911; https://doi.org/10.3390/ma16216911
Submission received: 1 September 2023
/
Revised: 16 October 2023
/
Accepted: 25 October 2023
/
Published: 27 October 2023
(This article belongs to the Special Issue Nuclear Materials and Their Derivatives: Synthesis, Structure, and Properties)
Abstract
:In this study, an ab initio molecular dynamics method is employed to investigate how the microstructures of UO2 and U3Si evolve under electron excitation. It is found that the U3Si is more resistant to electron excitation than UO2 at room temperature. UO2 undergoes a crystalline-to-amorphous structural transition with an electronic excitation concentration of 3.6%, whereas U3Si maintains a crystalline structure until an electronic excitation concentration reaches up to 6%. Such discrepancy is mainly due to their different electronic structures. For insulator UO2, once valence U 5f electrons receive enough energy, they are excited to the conduction bands, which induces charge redistribution. Anion disordering is then driven by cation disordering, eventually resulting in structural amorphization. As for metallic U3Si, the U 5f electrons are relatively more difficult to excite, and the electron excitation leads to cation disordering, which eventually drives the crystalline-to-amorphous phase transition. This study reveals that U3Si is more resistant to electron excitation than UO2 under an irradiation environment, which may advance the understanding of related experimental and theoretical investigations to design radiation-resistant nuclear fuel uranium materials.
1. Introduction
As one of the significant sources of carbon-free energy, nuclear energy has been used on a massive scale. The selection of nuclear fuel is key to deciding the safety of nuclear energy technology, as well as its stability and economic efficiency [1]. In the past decades, uranium has been used as nuclear fuel in fission reactors, and some uranium complexes have been investigated for long-term nuclear waste disposal and the storage of highly radioactive waste materials [2,3]. Throughout the world, UO2 has been employed in a large number of commercial light water reactors because of its superior properties, such as high melting point (3147 ± 20 K) [4,5,6], good oxidation resistance, and chemical compatibility [1,7]. However, the poor thermal conductivity of UO2 (26 Wm−1K−1) in the temperature range of 2731673 K [8] can cause a large temperature gradient during operation [1,7]. Therefore, extensive studies have been conducted to search for alternative fuels with better thermal performance in reactors [7,9,10]. In addition to UO2, other types of nuclear fuels, including mixed oxides ((U,Pu)O2, (U,Th)O2, (Pu,Th)O2) [11,12], alloys (U-Al, U-Mo, U-ZrH) [13], UC [14], UN [15], and uranium silicides such as U3Si [16] and U3Si2 [17,18], have been used or proposed for different reactors. Among these nuclear fuels, the U3Si2 and U3Si, due to their high uranium density [19] and large thermal conductivity [20], are considered potential accident-tolerant fuels. The U3Si has a thermal conductivity of approximately 1525 Wm−1K1 under 3001100 K [21] and a maximum uranium loading of 14.6 g-U/cm3, which is much higher than that of UO2 (9.7 g-U/cm3) [16,22]. To date, the U3Si is a potential nuclear fuel in low-temperature and low-power reactors such as the Miniature Neutron Source reactors [19,23,24].
During the past decades, researchers have striven to investigate the response of microstructural change in nuclear materials under ion, electron, and pulsed laser irradiation [25,26]. Barthe et al. irradiated sintered UO2 disks with electrons and α particles at different fluences [27]. The results showed the formation of U-related vacancy defects after a 2.5 MeV electron irradiation, whereas no defects were detected for irradiation at 1 MeV. Experimentally, Onofri et al. characterized the microstructural evolution of poly-crystalline UO2 under 4 MeV Au and 390 keV Xe ions irradiation with fluences of 0.5 × 10151.0 × 1015 ions/cm2 and found several dislocation loops and dislocation lines [24]. Miao et al. studied the high-burnup structure in UO2 under 84 MeV Xe ion irradiation and found that radiation-induced dislocations result in grain polygonization [28]. In addition, Miao et al. investigated the response of U3Si2 to 84 MeV Xe ion irradiation at 600 °C and found that the U3Si2 is strongly resistant to radiation-induced amorphization [29]. Theoretically, Owen studied amorphous UO2 systems using classical molecular dynamics methods and reported that the amorphous structure of UO2, i.e., oxygen ions, are coordinated with 3.65 uranium ions and uranium ions are coordinated with 7.31 oxygen ions [6]. Moreover, ab initio molecular dynamics (AIMD) computer simulations of low-energy recoil events in UO2 and ThO2 were carried out by Xiao et al., who determined the threshold displacement energies and revealed a number of novel point defects [30,31].
Ion or laser irradiation can substantially deposit energy in solids via elastic and inelastic collisions, as described in [32,33,34], which induces strong electron excitation and ionization [33,35]. In the literature, researchers have demonstrated that electron excitation can induce crystalline-to-amorphous structural transitions and influence material properties significantly. For example, Li et al. studied the response of Ge-Sb-Te alloys to laser irradiation by employing an AIMD method and found that electron excitation results in the structural amorphization of the alloy [36]. The amorphization of crystalline SiO2 induced by an electron beam in transmission electron microscopes has been reported by a number of researchers [37,38,39]. Furthermore, Xiao et al. carried out AIMD simulations on a series of titanate pyrochlores under electron irradiation and found that a crystalline-to-amorphous structural transition is induced by electron excitation in these pyrochlores [40]. Zhao et al. performed finite-temperature density functional theory and AIMD simulations on SrTiO3 and reported that there is a charge redistribution in Ti-O bonds and that the SrTiO3 undergoes a phase transition from crystalline to an amorphous state under electron excitation [33]. Thus far, the microstructural evolution of UO2 and U3Si under electron excitation still remains unclear. In this work, the structural evolution of UO2 and U3Si under electron excitation is investigated by employing the AIMD method, and the possible origin of their different response behaviors is explored. It is revealed that the U3Si is more resistant to electron excitation than the insulating UO2 due to its metallic character, suggesting that the U3Si has excellent structural stability under electron and laser irradiation.
2. Computational Methods
Because of the existence of U 5f electrons in UO2 and U3Si, strong correlation effects cannot be ignored [41]. To correct the on-site Coulomb interaction between the U 5f electrons, the Hubbard U correction proposed by Dudarev et al. [42] is utilized in this work. In this study, the responses of UO2 and U3Si to electron excitation are simulated by using the AIMD U (ab initio molecular dynamics plus Hubbard U correction) method, as implemented in the Vienna Ab Initio Simulation Package (VASP) [43]. The effective Hubbard parameter is employed to be 4.0 eV [44] for UO2 and 1.5 eV [45] for U3Si. The interactions between ions and electrons are described by the projector-augmented wave (PAW) pseudopotential, as described in [46,47] and the exchange–correlation potential between electrons is described by the Ceperly Alder parameterization under local density approximation (LDA) [48]. With spin-polarized effects taken into account, the cut-off energy for the plane-wave basis is set to 400 eV. A 1 1 1 K-point sampling in the Brillouin zone created by the Monkhorst-Pack [49] technique is used in AIMD calculations. Uranium dioxide (UO2) is of a fluorite structure in which the cations are located in a face-centered cubic (fcc) sublattice and the anions are in a cubic sublattice [30]. The U3Si crystal is of a tetragonal structure with the space group I4/mcm [50]. The UO2 has 12 atoms in the unit cell and the U3Si has 16 atoms in the unit cell. In the AIMD simulation, a 2 × 2 × 2 (96 atoms) and a 2 × 2 × 1 (64 atoms) supercell are employed for UO2 and U3Si, respectively, and periodic boundary conditions are applied along three directions. Figure 1 shows a schematic view of the geometrical structures of UO2 and U3Si. For UO2, anti-ferromagnetic ordering is considered, and the magnetic moment is determined to be 2.06 µB, which agrees well with the experimental value of 2 µB [51]. Electron excitation can be achieved by removing several electrons from the valence band states during the AIMD simulation, and the charge loss due to electron removal is compensated by a jellium background [36]. The electronic excitation concentration is defined as the ratio of the number of excited electrons to the total number of electrons. For a 2 × 2 × 2 supercell of the UO2 crystal, the total number of electrons is 3456, and the number of removed electrons ranges from 83 to 208, corresponding to an excitation concentration of 2.4~6%. For a 2 × 2 × 1 supercell of U3Si crystal, the total number of electrons is 4640, and the number of removed electrons ranges from 111 to 278, corresponding to an excitation concentration of 2.4~6%. The intensity of the generated electron-hole pairs can be calculated as , where F and represent the laser fluence and frequency, respectively, and R and represent the sample’s reflectivity and effective absorption coefficient, respectively [52]. Under laser beam irradiation, employing volume = 1.31 × 10⁻²¹ cm3, = 5 eV, R (248 nm) = 22% [53], and (248 nm) = 0.43 × 105 cm−1, the predicted laser fluence at 248 nm for 3.6% excitation in UO2 is 2.27 × 10³ mJ/cm2. The AIMD simulation is conducted with a time step of 1.5 fs and a canonical ensemble, and the Nosé–Hoover thermostat [54] is employed to control the temperature.
3. Results and Discussion
The RDF defines variations in the surrounding matter density as a function of distance from a point, as well as the frequency with which specific distances occur [55], which is obtained in the simulation model by counting the number of atom pairs separated by particular distances. Figure 2 illustrates the RDFs of UO2 and U3Si with and without electron excitation at a temperature of 300 K. When a material is crystalline, its structure is ordered at both short-range and long-range distances; when the material is amorphous, its structure is ordered at short-range distances and disordered at long-range distances. The strong and weak RDFs (with peak values approaching 1) correspond to structural ordering and disordering, respectively. Figure 2a presents the radial distribution functions of UO2 and U3Si as a function of the electronic excitation concentration at 300 K. For UO2, it is noted that its structure remains ordered at both short-range and long-range distances under electronic excitation concentrations of 0% and 2.4%, as indicated by the strong peaks in the whole considered interatomic distance range; however, as the electronic excitation concentration increases to 3.6%, structural short-range ordering and long-range disordering are observed, i.e., a crystalline-to-amorphous phase transformation is induced. A similar phenomenon has been observed in SrTiO3, titanate pyrochlores, and nickel oxide [33,40,56] for which electron excitation also causes a crystalline-to-amorphous phase transformation. In particular, new peaks appear at 1.171.3 Å, which can be attributed to the formation of O2 molecules. In the case of U3Si, it is noticeable that the situation is somewhat different. U3Si is shown to be strongly tolerant to electron excitation and maintains a crystalline structure under electronic excitation concentrations of 0.0%, 2.4%, 3.6%, and 4.8%, as indicated by the strong RDF peaks in the whole interatomic distance range in Figure 2b. When the electronic excitation concentration is as high as 6.0%, a crystalline-to-amorphous phase transformation occurs. Obviously, U3Si is more resistant to electron excitation than UO2.
Figure 3 illustrates the geometrical configurations of UO2 after electron excitation at different electronic excitation concentrations. It is shown that the UO2 remains in a crystalline structure when no electrons are excited. For an electronic excitation concentration of 2.4%, there is a slight lattice disordering for anions, and the cations maintain the lattice ordering well. When the electronic excitation concentration reaches 3.6%, the structure of UO2 changes significantly. In particular, the anions are dramatically disordered, and O2-like molecules are formed. The <O-O> distances are determined to be approximately 1.13 Å, which is close to the bond length of 1.24 Å for O2 [40]. As the electronic excitation concentration further increases to 4.8% and 6.0%, more and more O2-like molecules are formed. Moreover, cation disordering has become increasingly significant. Obviously, during the electron excitation process, anions are first disordered, which drives cation disordering and eventual structural amorphization. Such an amorphization mechanism is found to be similar to that of titanate pyrochlores [40]. In comparison to UO2, electron excitation with 2.46.0% concentration has a more limited influence on the geometrical structure of U3Si. As can be seen from Figure 4b–d, for electronic excitation concentrations of 2.4%, 3.6%, and 4.8%, the structures of U3Si are well ordered; in the case of 6.0% electronic excitation concentration, it is noted that lattice disordering occurs on U atoms rather than Si atoms (see Figure 4e), suggesting that the structural amorphization in U3Si is driven by cation disordering instead of anion disordering. This is different from the amorphization mechanism of UO2. Experimentally, the microstructural evolution in UO2 and U3Si under electron excitation has not been investigated yet, since they are radioactive materials and direct experimental study is not easy. However, electron excitation-induced structural amorphization has been experimentally observed in alloys, semiconductors, and ceramics [38,57,58,59].
To evaluate if the structural amorphization is a solid–liquid transition, an AIMD approach is utilized to simulate the structural evolution of UO2 and U3Si at 5000 K, which is much higher than their respective melting temperatures of 3147 ± 20 K [4,5] and ~1258 K [60]. Figure 5a compares the RDFs of melted and excited UO2 with an electronic excitation concentration of 6.0%. As shown in Figure 5a, the RDF peak located at an interatomic distance of ~1.13 Å for excited UO2 disappears for melted UO2, implying that no O2-like molecules are formed during the melting process. In the case of U3Si (see Figure 5b), the peak intensity of RDF at short-range distances for melted U3Si is much stronger than that for excited U3Si, indicating strengthened short-range ordering. Obviously, the structural amorphization induced by high-temperature melting is different from that induced by electron excitation. Figure 5c,d compares the mean square displacements of cations and anions in melted and excited UO2 and U3Si with a 6% electronic excitation concentration. As shown in Figure 5c, with a simulation time of 3 ps, the displacements of O and U atoms in melted UO2 are approximately six and ten times larger than those of excited UO2, respectively. As for U3Si, after a simulation time of 6 ps, the displacements of U and Si atoms in melted U3Si are over thirty times larger than those in excited U3Si, as illustrated in Figure 5d. These results suggest that the electron excitation-induced phase transition in UO2 and U3Si is different from the thermal melting-induced phase transition, and the former is a solid–solid transition rather than a solid–liquid transition. In the literature, a similar phenomenon is reported for titanate pyrochlores [40] and In2Se3 nanowires [61].
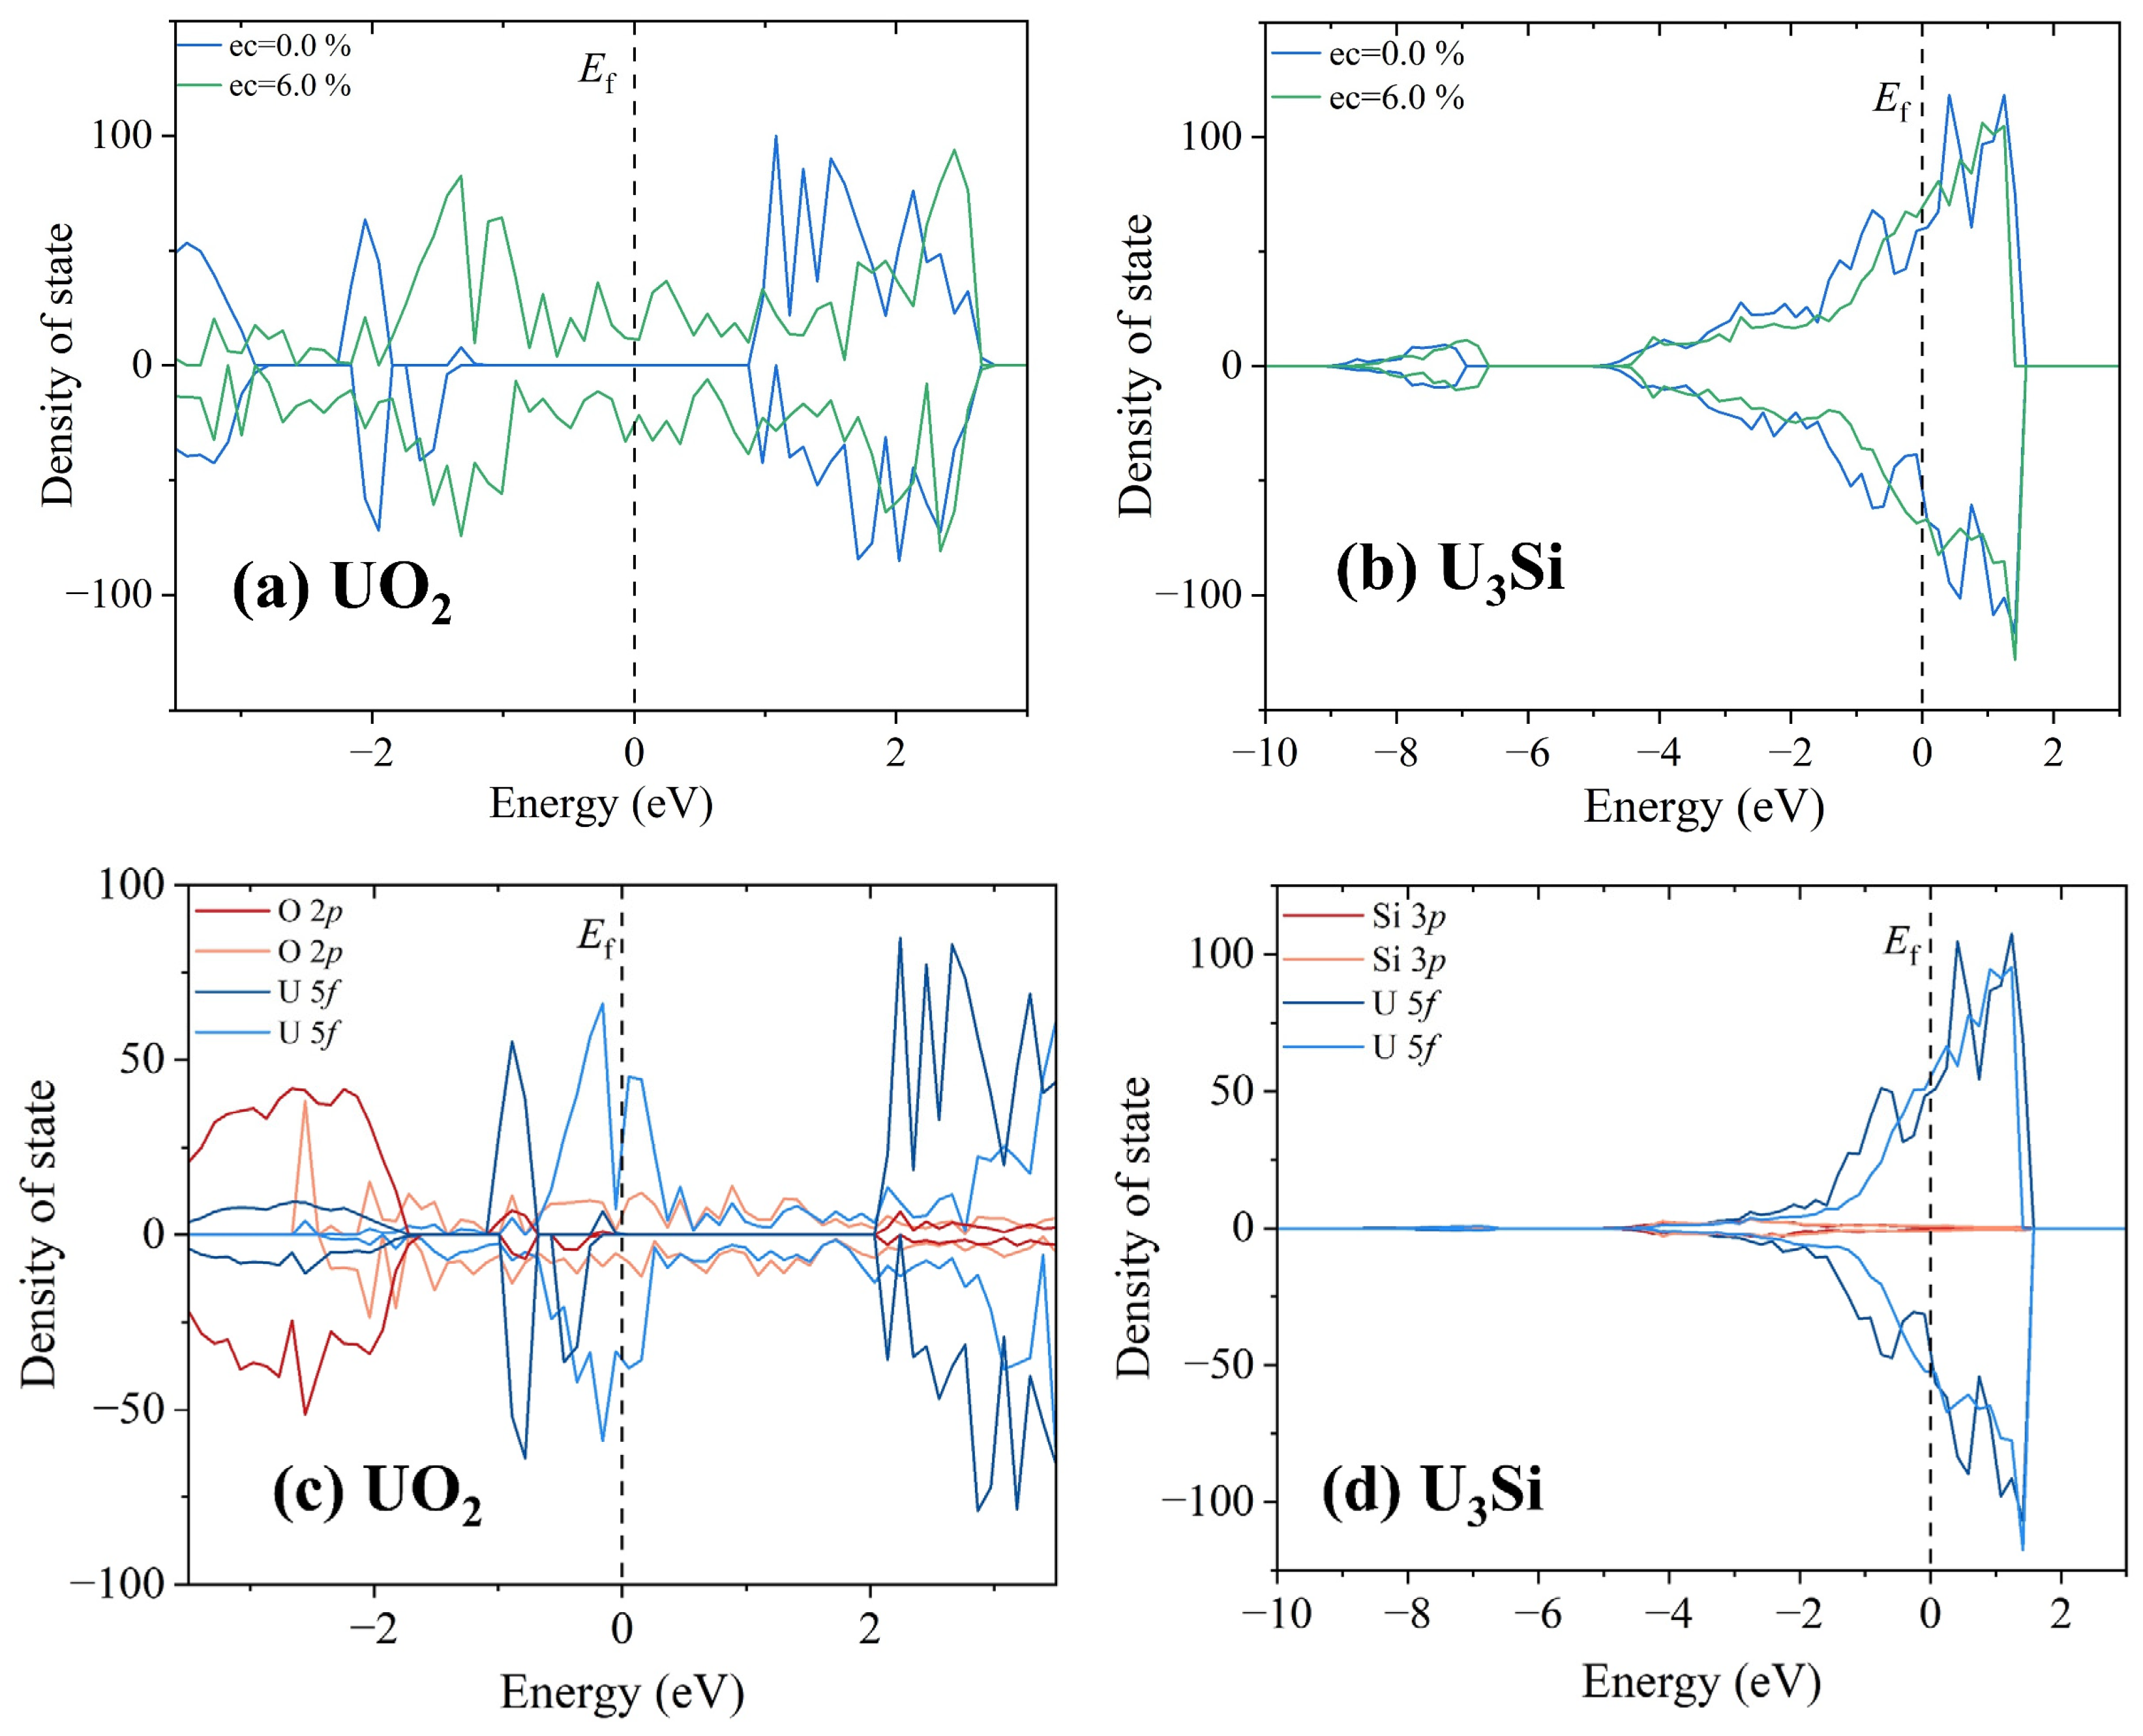
To explore the origin of the discrepancy in microstructural evolution under electron excitation between UO2 and U3Si, the total and projected density of state distributions of UO2 and U3Si with and without an electronic excitation concentration of 6.0% are illustrated in Figure 6. The Fermi level is set to be 0 eV. For ground state UO2, the band gap is determined to be 1.89 eV without spin–orbital coupling compared with the experimental value of ~2.1 eV [62]. In the case of ground state U3Si, electrons are distributed on the Fermi level, indicative of metallic character, which agrees well with the experimental results [24]. Clearly, the electronic structure of ground state UO2 is very different from that of ground state U3Si, which may result in different responses of UO2 and U3Si to electron excitation. For UO2, the valence band maximum is mainly contributed by U 5f orbitals, indicating that the valence electrons located at U 5f orbitals are relatively more easily excited. When the number of excited electrons is large enough, the excitation of U 5f electrons induces charge redistribution, resulting in cation disordering and the generation of O2-like molecules. As for U3Si, the U 5f electrons dominate the Fermi level. Therefore, the structural amorphization in U3Si is also driven by cation disordering. Since the electron work function of the U element is as high as 3.63 eV, as described in [63,64], the electrons in U3Si are more difficult excite than those in UO2. Consequently, the U3Si is more resistant to electron excitation than the UO2.
4. Conclusions
In summary, an AIMD simulation method is employed to investigate the response behaviors of UO2 and U3Si to electron excitation at room temperature. It is found that a crystalline-to-amorphous phase transition can be induced in UO2 with an electronic excitation concentration of 3.6%, whereas in U3Si, the threshold electronic excitation concentration for structural amorphization is as high as 6.0%. This structural amorphization induced by electron excitation is a solid–solid transition rather than a solid–liquid transition. The different electronic structures of ground-state UO2 and U3Si might result in different responses to electron excitation. The UO2 is an insulator, for which the U 5f valence electrons are relatively more easily excited, which drives anion disordering and eventually structural amorphization. U3Si exhibits a metallic character, and the U 5f electrons dominate the Fermi level. Electron excitation causes cation disordering, which leads to structural amorphization. This study reveals that U3Si undergoes crystalline-to-amorphous structural transitions less easily than UO2 when electronic excitation occurs, suggesting that U3Si has better potential under electron or laser irradiation as a nuclear fuel than UO2.
Author Contributions
Writing—original draft, R.J.; Writing—review & editing, S.Z.; Supervision, H.X.; Validation, H.X. All authors have read and agreed to the published version of the manuscript.
Funding
H. Xiao was supported by the Joint Funds of the National Natural Science Foundation of China (Grant No. U1930120).
Institutional Review Board Statement
Not applicable.
Informed Consent Statement
Not applicable.
Data Availability Statement
The raw/processed data required to reproduce these findings cannot be shared at this time as the data also form part of an ongoing study.
Acknowledgments
The authors acknowledge Hefei Advanced Computing Center for providing HPC resources that contributed to the research results reported within this paper.
Conflicts of Interest
The authors declare no conflict of interest.
References
- Liu, R. Multiphysics Coupled Modeling of Light Water Reactor Fuel Performance. Prog. Nucl. Energy 2016, 91, 38–48. [Google Scholar]
- Mirzaei, M. Structural variation within uraniumVI heterocyclic carboxylates: Solid and solution states studies. Inorganica Chim. Acta 2011, 370, 141–149. [Google Scholar] [CrossRef]
- Mirzaei, M. A new solvated complex of the uranyl ion (UO22+) with 8-hydroxyquinoline. Inorganica Chim. Acta 2015, 426, 136–141. [Google Scholar] [CrossRef]
- Manara, D. Melting of Stoichiometric and Hyperstoichiometric Uranium Dioxide. J. Nucl. Mat. 2005, 342, 148–163. [Google Scholar] [CrossRef]
- Yakub, E. Thermodynamic model of solid non-stoichiometric uranium dioxide. J. Phys. Condens. Matter 2006, 18, 1227–1248. [Google Scholar] [CrossRef]
- Owen, W.M. Diffusion in undoped and Cr-doped amorphous UO2. J. Nucl. Mat. 2023, 576, 154270. [Google Scholar] [CrossRef]
- Ševeček, M. Development of high thermal conductivity UO2–Th heterogeneous fuel. Prog. Nucl. Energy 2018, 108, 489–496. [Google Scholar] [CrossRef]
- White, J.T. Thermophysical Properties of U3Si2 to 1773 K. J. Nucl. Mat. 2015, 464, 275–280. [Google Scholar] [CrossRef]
- Idiri, M. Behavior of actinide dioxides under pressure: UO2 and ThO2. Phys. Rev. B 2004, 70, 014113. [Google Scholar] [CrossRef]
- Gorton, J.P. Impact of Uranium Oxide (UO2) Fuel with Molybdenum (Mo) Inserts on Pressurized Water Reactor Performance and Safety. J. Nucl. Mat. 2020, 542, 152492. [Google Scholar]
- Balboa, H. Damage characterization of (U,Pu)O2 under irradiation by molecular dynamics simulations. J. Nucl. Mat. 2018, 512, 440–449. [Google Scholar]
- Kandan, R. Calorimetric measurements on (U,Th)O2 solid solutions. J. Nucl. Mat. 2009, 384, 231–235. [Google Scholar] [CrossRef]
- Meyer, M.K. 7—Research reactor fuels. Adv. Nucl. Fuel Chem. 2020, 273–312. [Google Scholar] [CrossRef]
- Yin, Q. Electronic correlation and transport properties of nuclear fuel materials. Phys. Rev. B 2011, 84, 195111. [Google Scholar] [CrossRef]
- Matzke, H. Diffusion Processes in Nuclear Fuels. J. Less-Common Met. 1986, 121, 537–564. [Google Scholar]
- White, J. Thermophysical properties of U3Si to 1150 K. J. Nucl. Mat. 2014, 452, 304–310. [Google Scholar] [CrossRef]
- Wang, T. First-principles investigations on the electronic structures of U3Si2. J. Nucl. Mat. 2016, 469, 194–199. [Google Scholar] [CrossRef]
- Metzger, K.E. Determination of mechanical behavior of U3Si2 nuclear fuel by microindentation method. Prog. Nucl. Energy 2017, 99, 147–154. [Google Scholar] [CrossRef]
- Albarhoum, M. Thermohydraulic features of the use of U3Si LEU fuel in low-power research reactors. Prog. Nucl. Energy 2010, 52, 819. [Google Scholar]
- Mei, Z.-G. First-principles study of surface properties of uranium silicides. J. Nucl. Mat. 2019, 513, 192–197. [Google Scholar] [CrossRef]
- Mohamad, A. Thermal and Mechanical Properties of U3Si and USi3. Ann. Nucl. Energy 2019, 133, 186–193. [Google Scholar] [CrossRef]
- Middleburgh, S.C. Structural Stability and Fission Product Behaviour in U3Si. J. Nucl. Mat. 2015, 466, 739–744. [Google Scholar] [CrossRef]
- Rest, J. A Generalized Model for Radiation-Induced Amorphization and Crystallization of U3Si and U3Si2 and Recrystallization of UO2. J. Nucl. Mater. 1997, 240, 205–214. [Google Scholar] [CrossRef]
- Onofri, C. Full characterization of dislocations in ion-irradiated polycrystalline UO2. J. Nucl. Mater. 2017, 494, 252–259. [Google Scholar] [CrossRef]
- Willie, K.D.A. Analysis of Burnup effects and Its Integrity Assessment in the Interim of Irradiation with Molecular Dynamics. MRS Adv. 2020, 5, 1799–1810. [Google Scholar] [CrossRef]
- Yun, D. Current state and prospect on the development of advanced nuclear fuel system materials: A review. Mater. Rep. Energy 2021, 1, 100007. [Google Scholar] [CrossRef]
- Barthe, M.F. Positron annihilation characteristics in UO2: For lattice and vacancy defects induced by electron irradiation. Phys. Status Solidi 2007, 4, 3627–3632. [Google Scholar] [CrossRef]
- Miao, Y. Nano-crystallization induced by high-energy heavy ion irradiation in UO2. Scr. Mater. 2018, 155, 169–174. [Google Scholar] [CrossRef]
- Miao, Y. Microstructure investigations of U3Si2 implanted by high-energy Xe ions at 600 °C. J. Nucl. Mater. 2018, 503, 314–322. [Google Scholar] [CrossRef]
- Jiang, M. An AIMD+U simulation of low-energy displacement events in UO2. J. Nucl. Mater. 2020, 540, 152379. [Google Scholar] [CrossRef]
- Xiao, H.Y. Ab initio molecular dynamics simulations of low-energy recoil events in ThO2, CeO2, and ZrO2. Phys. Rev. B 2012, 86, 054109. [Google Scholar] [CrossRef]
- Itoh, N. Material modification by electronic excitation. Radiat. Eff. Defects Solids 2006, 146, 1–10. [Google Scholar] [CrossRef]
- Zhao, S. Ab Initio Study of Electronic Excitation Effects on SrTiO3. J. Phys. Chem. C 2017, 121, 26622–26628. [Google Scholar] [CrossRef]
- Ullah, A. Continuous Stiffness Measurements and Nanoindentation Studies of bcc Mo: An Atomistic Approach. Indian Inst. Met. 2022, 75, 1555–1561. [Google Scholar] [CrossRef]
- Li, S.M. Contribution of F-Electron Excitation to Electronic Stopping Power of Platinum for Protons. Phys. Rev. B 2022, 106, 014103. [Google Scholar] [CrossRef]
- Li, X.B. Role of electronic excitation in the amorphization of Ge-Sb-Te alloys. Phys. Rev. Lett. 2011, 107, 015501. [Google Scholar] [CrossRef]
- Kabler, M.N. Vacancy-interstitial pair production via electron-hole recombination in halide crystals. Phys. Rev. B 1978, 18, 4. [Google Scholar] [CrossRef]
- Jiang, N. Electron beam damage in oxides: A review. Rep. Prog. Phys. 2016, 79, 016501. [Google Scholar] [CrossRef]
- Hobbs, L.W. The role of topology and geometry in the irradiation-induced amorphization of network structures. J. Non-Cryst. Solids 1995, 182, 27–39. [Google Scholar] [CrossRef]
- Xiao, H.Y. Electronic excitation induced amorphization in titanate pyrochlores: An ab initio molecular dynamics study. Sci. Rep. 2015, 5, 8265. [Google Scholar] [CrossRef]
- Kohn, W. Self-Consistent Equations Including Exchange and Correlation Effects. Phys. Rev. 1965, 140, A1133–A1138. [Google Scholar] [CrossRef]
- Dudarev, S.L. Electron-Energy-Loss Spectra and the Structural Stability of Nickel Oxide: An Lsda+U Study. Phys. Rev. B 1998, 57, 1505–1509. [Google Scholar] [CrossRef]
- Kresse, G. Ab Initio Molecular Dynamics for Liquid Metals. Phys. Rev. B 1993, 47, 558–561. [Google Scholar] [CrossRef] [PubMed]
- Geng, H.Y. Structural behavior of uranium dioxide under pressure by LSDA+Ucalculations. Phys. Rev. B 2007, 75, 054111. [Google Scholar] [CrossRef]
- Noordhoek, M.J. Phase equilibria in the U-Si system from first-principles calculations. J. Nucl. Mater. 2016, 479, 216–223. [Google Scholar] [CrossRef]
- Kresse, G. Efficient Iterative Schemes for Ab Initio Total-Energy Calculations Using a Plane-Wave Basis Set. Phys. Rev. B 1996, 54, 11169–11186. [Google Scholar] [CrossRef]
- Kresse, G. Efficiency of Ab-Initio Total Energy Calculations for Metals and Semiconductors Using a Plane-Wave Basis Set. Comput. Mater. Sci. 1996, 6, 15–50. [Google Scholar] [CrossRef]
- Ceperley, D.M. Ground State of the Electron Gas by a Stochastic Method. Phys. Rev. Lett. 1980, 45, 566–569. [Google Scholar] [CrossRef]
- Blöchl, P.E. Improved Tetrahedron Method for Brillouin-Zone Integrations. Phys. Rev. B 1994, 49, 16223–16233. [Google Scholar] [CrossRef]
- Feng, S. The effects of Xe/Cs occupation on the thermal transport properties of U3Si: A first-principles study. J. Nucl. Mater. 2023, 586, 154657. [Google Scholar] [CrossRef]
- Dudarev, S.L. Electronic Structure and Elastic Properties of Strongly Correlated Metal Oxides from First Principles: LSDA + U, SiC-LSDA and Eels Study of UO2 and NiO. Phys. Status Solidi 1998, 166, 429–443. [Google Scholar] [CrossRef]
- Sokolowski, K. Ultrafast laser-induced order-disorder transitions in semiconductors. Phys. Rev. B 1995, 51, 14186. [Google Scholar] [CrossRef]
- Chen, Q.Y. First-principles study of the electronic structure and optical properties of UO2. J. Nucl. Mater. 2010, 401, 118–123. [Google Scholar] [CrossRef]
- Chen, Y. Multi-layered cement-hydrogel composite with high toughness, low thermal conductivity, and self-healing capability. Nat. Commun. 2023, 14, 3438. [Google Scholar] [CrossRef] [PubMed]
- Sha, W. Electroless Copper and Nickel–Phosphorus Plating; Woodhead Publishing: Cambridge, UK, 2011; pp. 82–103. [Google Scholar]
- Weber, W.J. Radiation Effects in Crystalline Ceramics for the Immobilization of High-Level Nuclear Waste and Plutonium. J. Mater. Res. 1998, 13, 1434. [Google Scholar] [CrossRef]
- Gupta, A. Laser Irradiation Induced Atomic Structure Modifications in Strontium Titanate. JOM 2022, 74, 143. [Google Scholar] [CrossRef]
- Takeda, S. Amorphization in Silicon by Electron Irradiation. Phys. Rev. Lett. 1999, 83, 320. [Google Scholar] [CrossRef]
- Konishi, M. Ultrafast amorphization in Ge10Sb2Te13 thin film induced by single femtosecond laser pulse. Appl. Opt. 2010, 49, 3470. [Google Scholar] [CrossRef]
- Ugajin, M. Behavior of Neutron-Irradiated U3Si. J. Nucl. Mater. 1997, 248, 204–208. [Google Scholar] [CrossRef]
- Mafi, E. Electronically Driven Amorphization in Phase-Change In2Se3 Nanowires. J. Phys. Chem. C 2012, 116, 22539–22544. [Google Scholar] [CrossRef]
- Killeen, J.C. The Effect of Niobium Oxide Additions on the Electrical Conductivity of UO2. J. Nucl. Mater. 1980, 88, 185–192. [Google Scholar] [CrossRef]
- Luo, Y. Electron work function: An indicative parameter towards a novel material design methodology. Sci. Rep. 2021, 11, 11565. [Google Scholar] [CrossRef] [PubMed]
- Michaelson, H.B. The work function of the elements and its periodicity. J. Appl. Phys. 1977, 48, 4729–4733. [Google Scholar] [CrossRef]
Figure 1.
Schematic view of the geometrical structures of (a) UO2 and (b) U3Si. The grey, red, and blue spheres represent the U, O, and Si atoms, respectively. For UO2, anti-ferromagnetic ordering is illustrated, and the “↑” and “↓” signs on U atoms denote spin up and spin down, respectively.
Figure 1.
Schematic view of the geometrical structures of (a) UO2 and (b) U3Si. The grey, red, and blue spheres represent the U, O, and Si atoms, respectively. For UO2, anti-ferromagnetic ordering is illustrated, and the “↑” and “↓” signs on U atoms denote spin up and spin down, respectively.
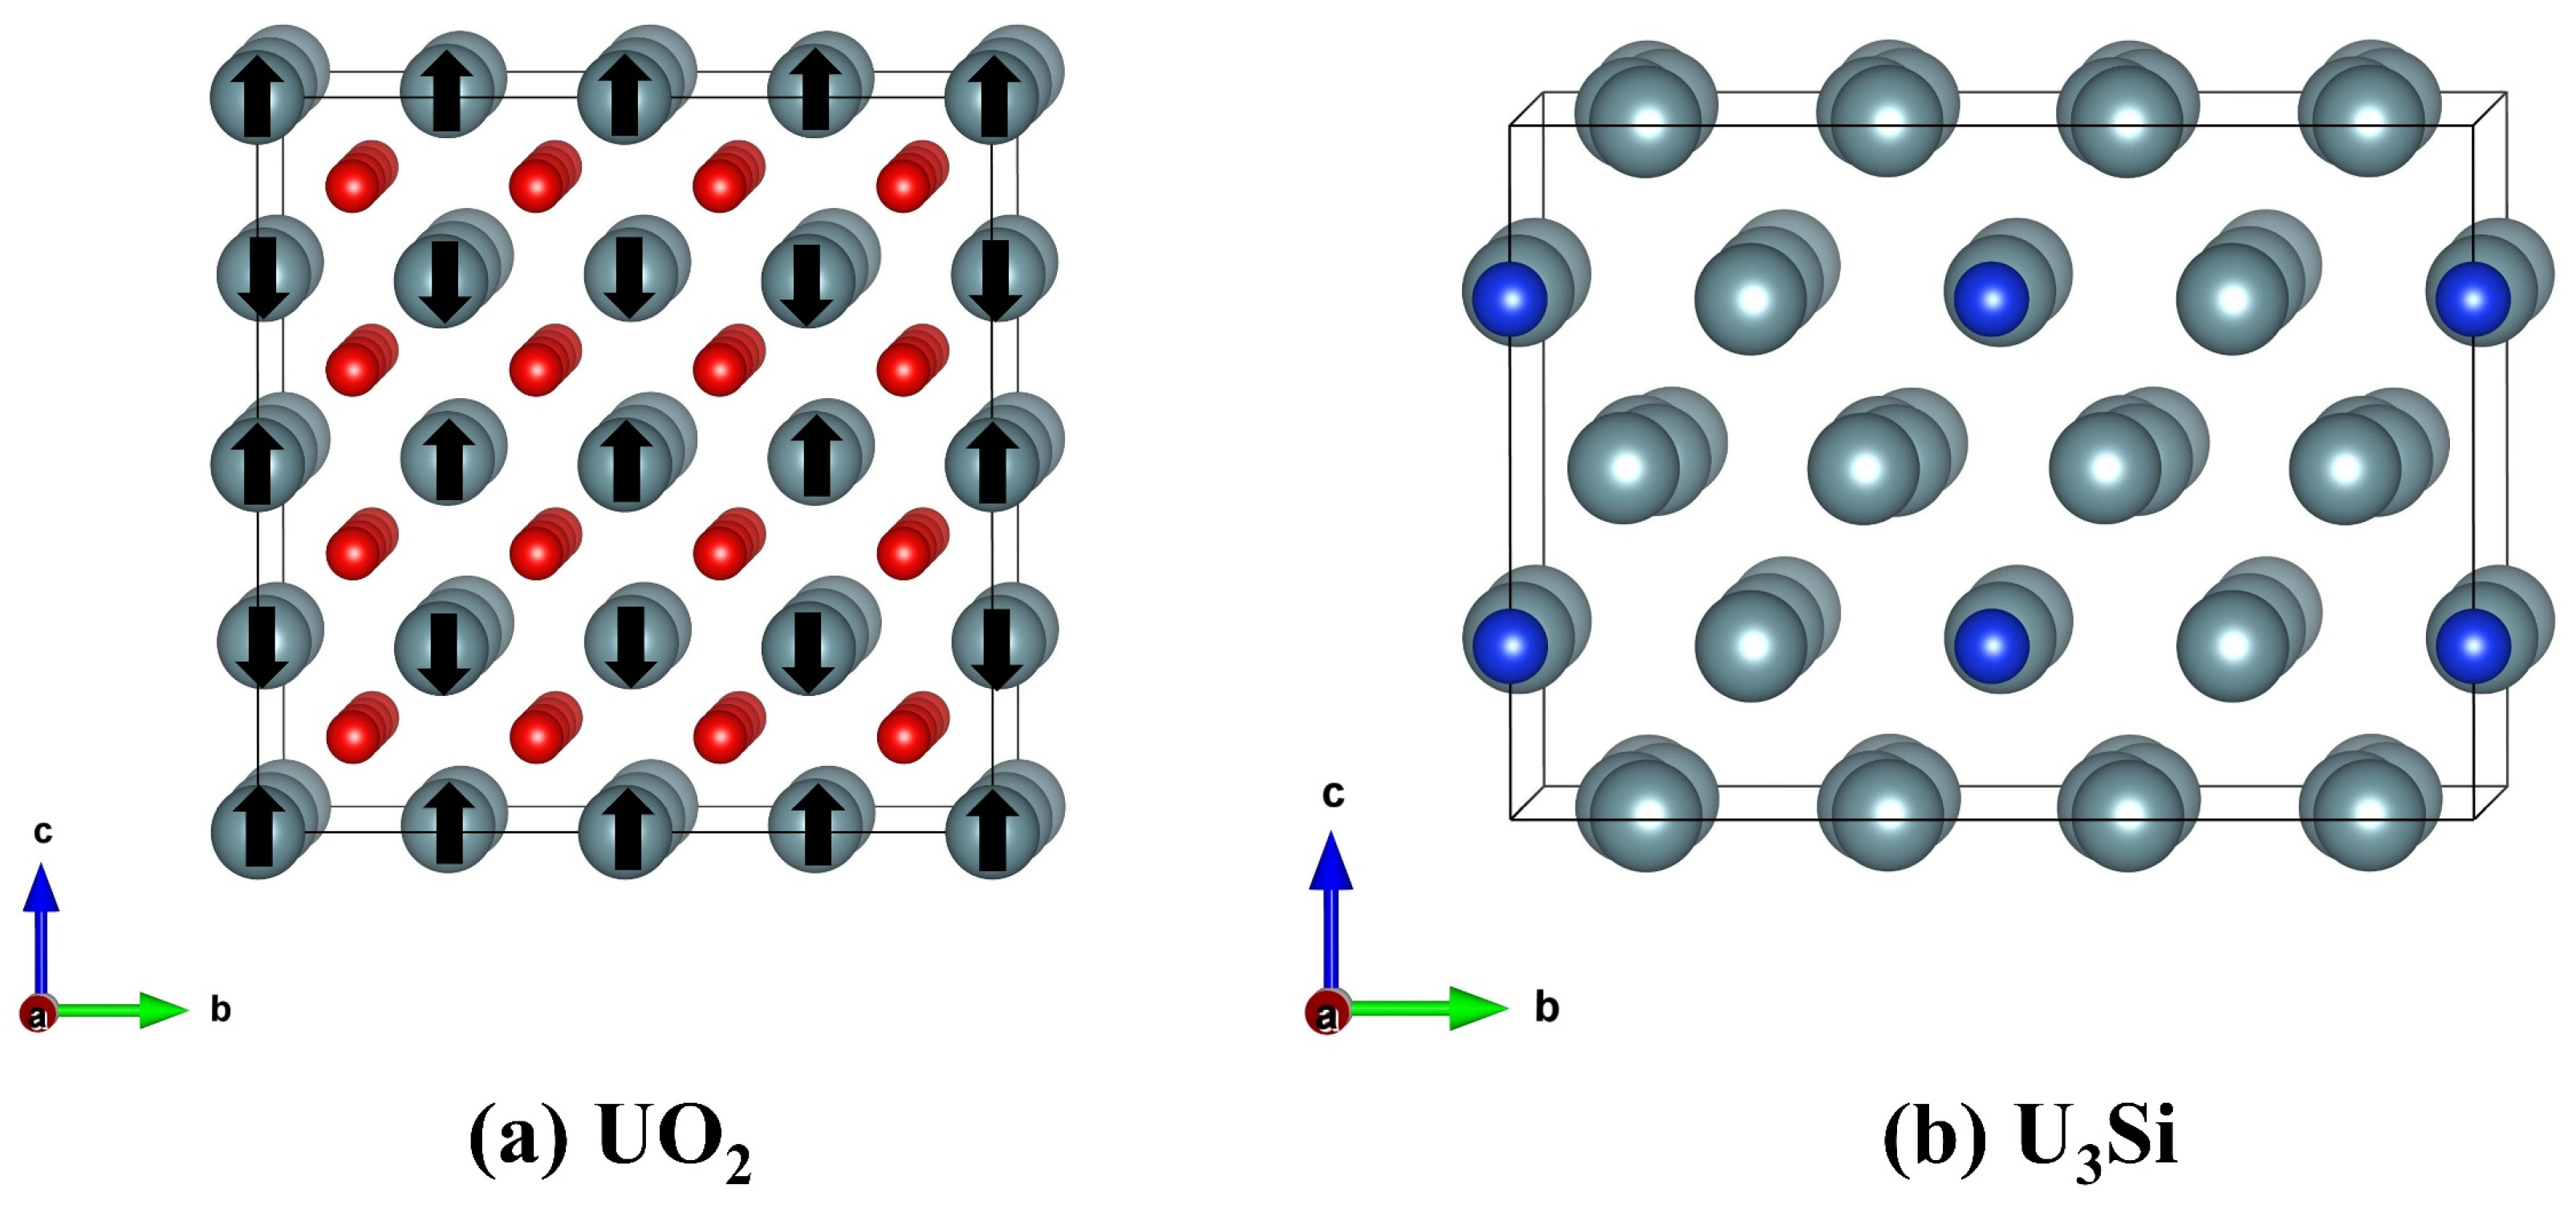
Figure 2.
The radial distribution functions of (a) UO2 and (b) U3Si as a function of electronic excitation concentration at 300 K.
Figure 2.
The radial distribution functions of (a) UO2 and (b) U3Si as a function of electronic excitation concentration at 300 K.

Figure 3.
Equilibrium geometrical structures of UO2 with electronic excitation concentrations of (a) 0.0%; (b) 2.4%; (c) 3.6%; (d) 4.8%; (e) 6.0% at 300 K. The grey and red spheres represent U and O, respectively. The <O-O> chemical bonds between 1.171.3 Å are represented by red sticks.
Figure 3.
Equilibrium geometrical structures of UO2 with electronic excitation concentrations of (a) 0.0%; (b) 2.4%; (c) 3.6%; (d) 4.8%; (e) 6.0% at 300 K. The grey and red spheres represent U and O, respectively. The <O-O> chemical bonds between 1.171.3 Å are represented by red sticks.
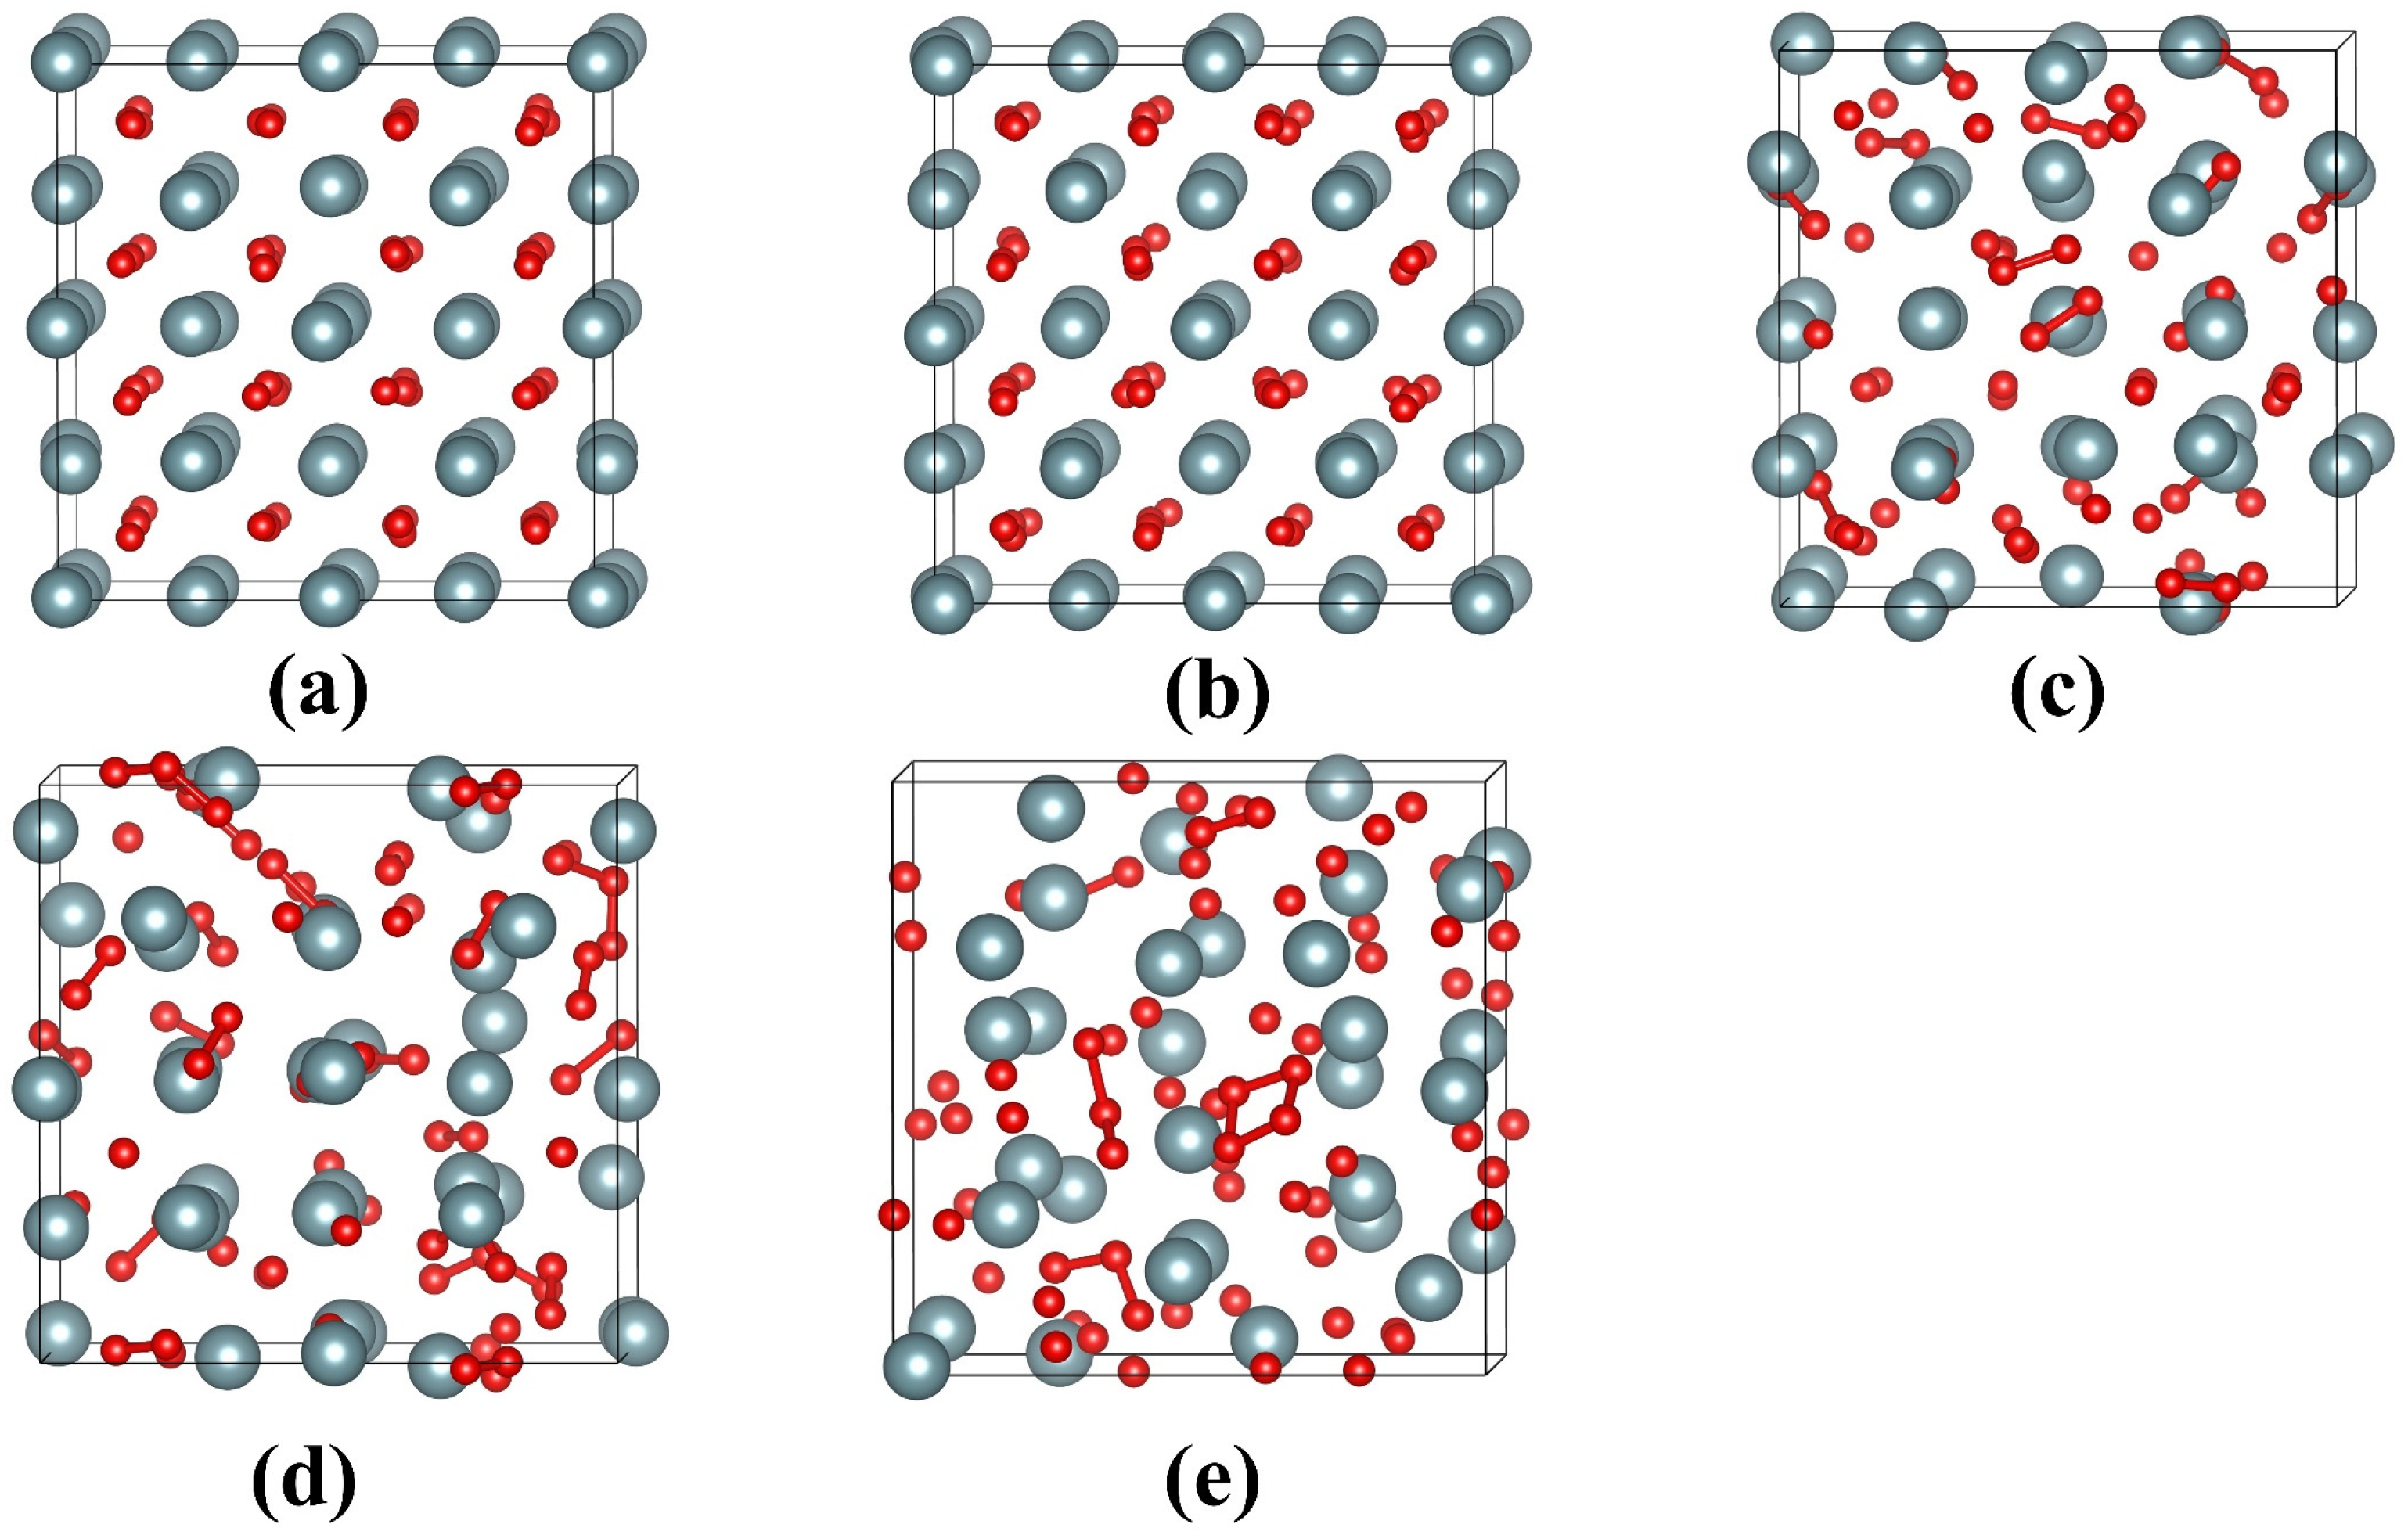
Figure 4.
Equilibrium geometrical structures of U3Si with electronic excitation concentrations of (a) 0.0%; (b) 2.4%; (c) 3.6%; (d) 4.8%; (e) 6.0% at 300 K. The grey and blue spheres represent U and Si, respectively.
Figure 4.
Equilibrium geometrical structures of U3Si with electronic excitation concentrations of (a) 0.0%; (b) 2.4%; (c) 3.6%; (d) 4.8%; (e) 6.0% at 300 K. The grey and blue spheres represent U and Si, respectively.
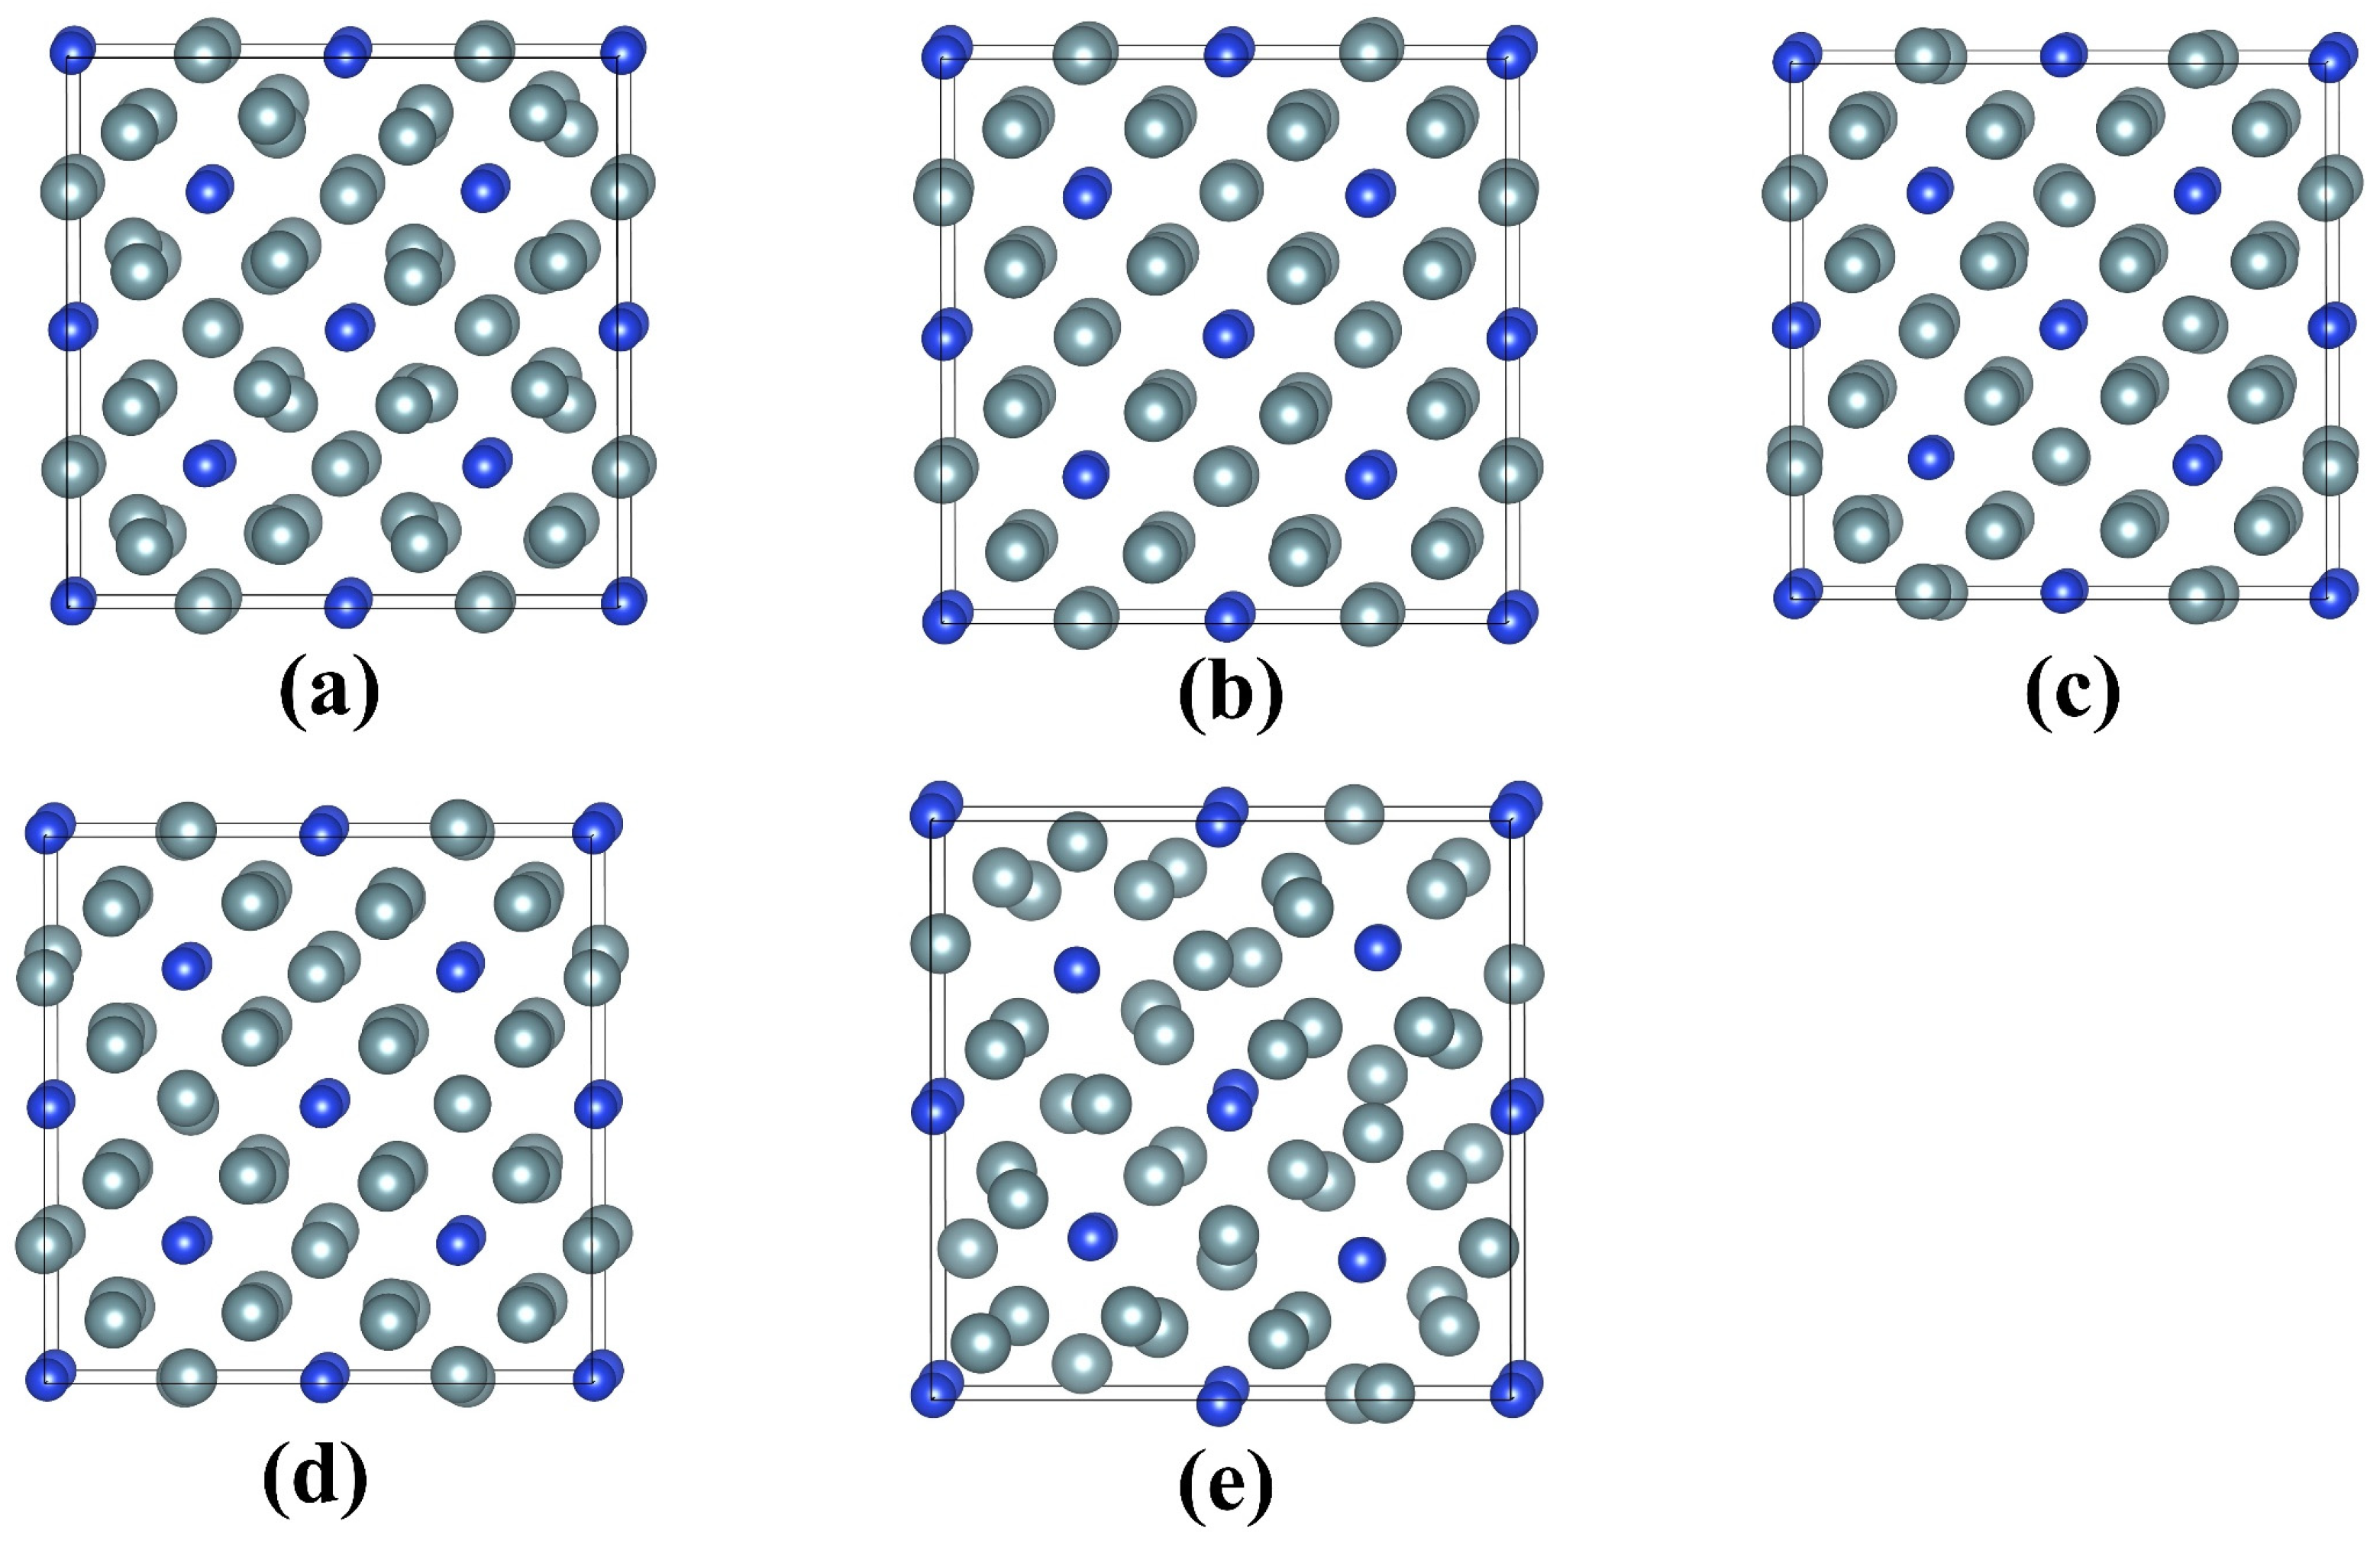
Figure 5.
(a,b) The radial distribution functions and (c,d) mean square displacements of UO2 and U3Si. The melted UO2 and U3Si are simulated at a temperature of 5000 K above their melting points. The excited UO2 and U3Si are simulated with an electronic excitation concentration of 6.0%.
Figure 5.
(a,b) The radial distribution functions and (c,d) mean square displacements of UO2 and U3Si. The melted UO2 and U3Si are simulated at a temperature of 5000 K above their melting points. The excited UO2 and U3Si are simulated with an electronic excitation concentration of 6.0%.
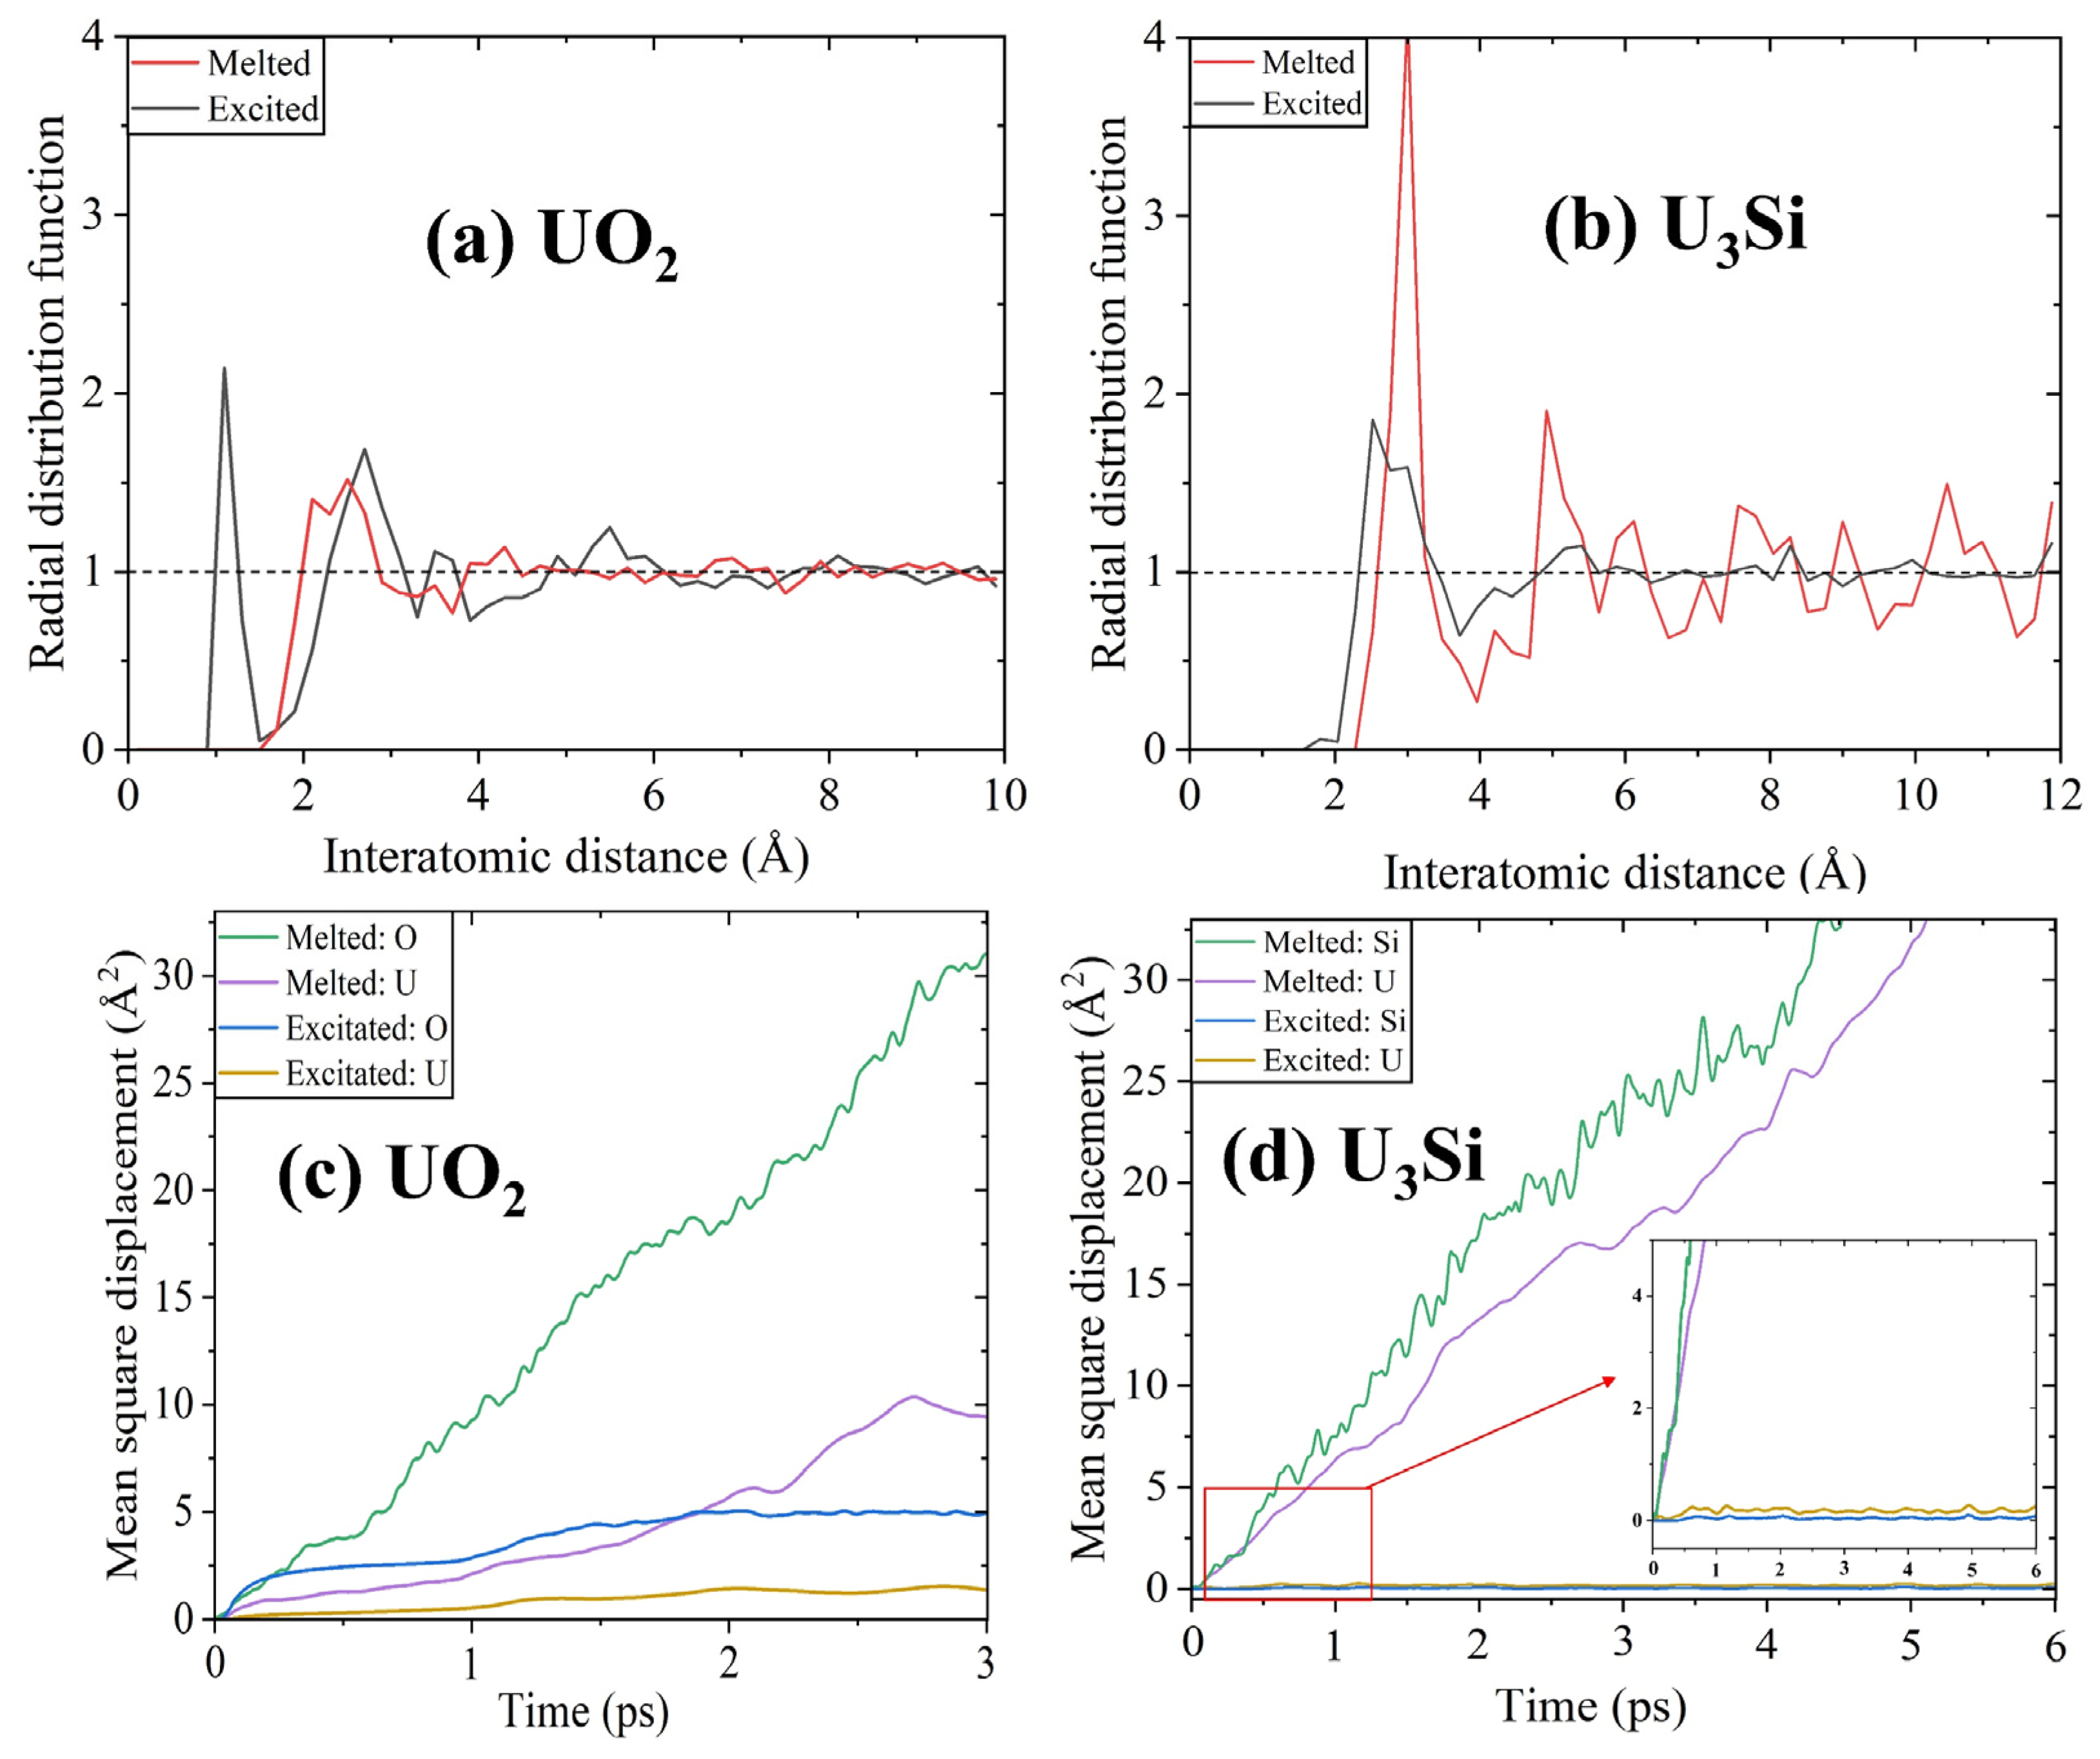
Figure 6.
The total density of state distributions for (a) UO2 and (b) U3Si without and with an electronic excitation concentration of 6.0%; (c) partial density of state distributions projected on 2p orbitals of O atom and 5f orbitals of U atom of UO2 without and with an electronic excitation concentration of 6.0%; (d) partial density of state distributions projected on 3p orbitals of Si atom and 5f orbitals of U atom of U3Si without and with an electronic excitation concentration of 6.0%.
Disclaimer/Publisher’s Note: The statements, opinions and data contained in all publications are solely those of the individual author(s) and contributor(s) and not of MDPI and/or the editor(s). MDPI and/or the editor(s) disclaim responsibility for any injury to people or property resulting from any ideas, methods, instructions or products referred to in the content. |
© 2023 by the authors. Licensee MDPI, Basel, Switzerland. This article is an open access article distributed under the terms and conditions of the Creative Commons Attribution (CC BY) license (https://creativecommons.org/licenses/by/4.0/).
Share and Cite
MDPI and ACS Style
Jin, R.; Zhao, S.; Xiao, H. Ab Initio Molecular Dynamics Study of Electron Excitation Effects on UO2 and U3Si. Materials 2023, 16, 6911. https://doi.org/10.3390/ma16216911
AMA Style
Jin R, Zhao S, Xiao H. Ab Initio Molecular Dynamics Study of Electron Excitation Effects on UO2 and U3Si. Materials. 2023; 16(21):6911. https://doi.org/10.3390/ma16216911
Chicago/Turabian StyleJin, Ruoyan, Siqin Zhao, and Haiyan Xiao. 2023. "Ab Initio Molecular Dynamics Study of Electron Excitation Effects on UO2 and U3Si" Materials 16, no. 21: 6911. https://doi.org/10.3390/ma16216911
Note that from the first issue of 2016, this journal uses article numbers instead of page numbers. See further details here.