Article

Improved Lithium Storage Performance of a TiO2 Anode Material Doped by Co

1
Spintronics Institute, University of Jinan, Jinan 250022, China
2
College of Physics, Weihai Innovation Research Institute, Institute of Materials for Energy and Environment, Qingdao University, Qingdao 266071, China
*
Author to whom correspondence should be addressed.
Materials 2023, 16(4), 1325; https://doi.org/10.3390/ma16041325
Submission received: 8 December 2022 / Revised: 27 January 2023 / Accepted: 29 January 2023 / Published: 4 February 2023
(This article belongs to the Special Issue Anode and Energy Storage Mechanism of Battery)

Abstract

:
TiO2 is a promising anode material for lithium-ion batteries (LIBs) due to its low cost, suitable operating voltage, and excellent structural stability. The inherent poor electron conductivity and low ion diffusion coefficient, however, severely limit its application in lithium storage. Here, Co-doped TiO2 is synthesized by a hydrothermal method as an anode material since Co@TiO2 possesses a large specific surface area and high electronic conductivity. Thanks to the Co dopants, the ion diffusion and electron transport are both greatly improved, which is very beneficial for cycle stability, coulombic efficiency (CE), reversible capacity, and rate performance. As a result, Co@TiO2 shows a high reversible capacity of 227 mAh g−1 at 3 C, excellent rate performance, and cycling stability with a capacity of about 125 mAh g−1 at 10C after 600 cycles (1 C = 170 mA g−1).

1. Introduction

Lithium-ion batteries have been widely used in various electronic devices, owing to their high energy density, excellent cycle stability, and environmental friendliness [1,2,3,4,5]. In recent years, they have been considered one of the most promising power sources for electrical vehicles and new energy storage in order to reduce costs and consider the impact on the environment. Graphite, as an important anode electrode material, has been used in commercial LIBs. However, it easily forms lithium dendrites at a low operating voltage, causing a series of safety problems [6]. Moreover, it undergoes an irreversible capacity loss during initial discharge due to the formation of a solid electrolyte interphase (SEI) film [7,8]. Therefore, LIBs urgently need new anode materials with reinforced electrochemical performance. It is worth noting that TiO2 is a promising anode material candidate because of its excellent operational safety, good reversible capacity, environmental benignity, suitable operating voltage, and superior structural stability [5,9]. However, it has inherent poor electronic conductivity and low ion diffusion rate, which seriously limit its actual electrochemical performance. In particular, the low theoretical capacity seriously affects its practical application in business [10].
To enhance the lithium storage performance of LIBs, several effective strategies have been proposed [11,12]. The most common way is to adjust the shape on the nanometer scale, such as nanowires/nanofibers [13,14], nanorods [15,16], nanospheres [17,18,19], and nanotubes [20,21,22]. These special morphologies with large specific surface areas can provide more active surface sites for electrolyte permeation and lithium storage. Second, to improve the diffusion rate of lithium ions, a practical method is to synthesize nanoscale materials, which greatly reduces the diffusion distance, thereby effectively shortening the diffusion time of lithium ions [23]. Then, the composite materials can be formed by combining with other transition metal oxides, such as iron oxide [24] and nickel oxide [25,26], due to their higher theoretical capacity. In addition, some methods are proposed to further enhance the conductivity of TiO2. For example, the combination of carbon nanotubes, graphite, and other conductive additives is used to form some composite materials [27,28,29,30,31,32,33]. Although these conductive additives can effectively improve the electron transport rate on the surface of the particles, they still suffer from low conductivity in TiO2.
Here, a Co-doped anatase TiO2 composite with excellent lithium storage capacity was synthesized by an economical wet chemistry process. Co atoms replace some Ti atoms, which can not only effectively inhibit the growth of TiO2 crystals, but also reduce the band gap, thereby enhancing the electronic conductivity. Moreover, the charge-transfer resistance was decreased. In the meanwhile, the lithium diffusion coefficient was increased by Co doping. Therefore, the Co@TiO2 exhibits excellent electrochemical performance, which is promising for the anode material of LIBs.

2. Experimental

2.1. Materials and Synthesis

Co-doped TiO2 was synthesized via a hydrothermal method, which includes hydrolysis of tetrabutyl titanate (TBT) in a mixture of ethylene glycol and CoCl2·6H2O, followed by heating at 500 °C. Typically, 0.42 g CoCl2·6H2O was homogeneously dispersed in 50 mL ethylene glycol stirred for 2 h, and then 5 mL TBT was added to a uniformly distributed yellow solution and stirred vigorously for 2 h. After that, a Teflon-lined autoclave was used to seal the mixture and kept for 5 h at 180 °C. Then, the yellow precipitate was collected and dried in a vacuum oven at 80 °C for 12 h. Finally, the sample was annealed at 500 °C for 3 h under an air atmosphere. This product is marked as Co@TiO2. By comparison, undoped TiO2 was prepared under the same conditions except with CoCl2·6H2O as an additive.

2.2. Materials Characterization

The morphology of the materials was characterized by scanning electron microscopy (SEM, JSM-6700F) (JEOL, Beijing, China). The morphology and microstructure were further investigated by transmission electron microscopy (TEM) and HRTEM (JEOL JEM-2100F) (JEOL, Beijing, China). Energy-dispersive X-ray spectroscopy (EDS) was assembled with SEM. Nitrogen adsorption/desorption isotherms were registered on an ASAP 2020 instrument (Micrometrics, Norcross, GA, USA). The specific surface area and pore size distribution were calculated using the Brunauer–Emmett–Teller (BET) and Barrett–Joyner–Halenda (BJH) theories. The crystal structures were performed by X-ray diffraction (XRD) (Bruker, Billerica, MA, USA) with Cu Kα radiation. The valence state of Co@TiO2 was determined by X-ray photoelectron spectroscopy (XPS) using a Thermo Scientific ESCALAB 250XI photoelectron spectrometer with a wavelength of 450 nm (Thermo Fisher Scientific, Wuhan, China). The magnetic properties were investigated by a Quantum Design PPMS magnetometer at ambient temperature. The applied field dependence of magnetization was measured with steps of 0.01 and 0.01 T in the ranges from −0.05 to 0.05 T and from ±0.05 to ±3 T, respectively.

2.3. Electrochemical Measurements

The electrochemical properties of the samples were measured by CR-2032 coin-type cells. The working electrode, coated on the copper foil and then dried at 70°C for 12 h in a vacuum oven, was composed of active material (TiO2 or Co@TiO2), conductive carbon black (Super P), and sodium carboxymethyl cellulose (CMC) at a weight ratio of 7:2:1. The electrodes were pressed into disks (10 mm, diameter). The average active mass loading of the electrode is 1.5–2.0 mg cm−1 on current collectors. The coins were assembled in an argon-filled glove box (<0.1 ppm of H2O, <0.1 ppm of O2). The electrolyte was 1 M LiPF6 dissolved in a 1:1:1 mixture of ethylene carbonate (EC)/dimethyl carbonate (DMC)/diethyl carbonate (DEC). Celgard 2032 film was utilized as the separator (Whatman). Lithium metal was used as the reference electrode in LIBs. The discharge/charge measurements were performed on a NEWARE battery testing system at various current rates between 0.01 and 3.0 V vs. Li/Li+. Cyclic voltammetry (CV) measurement was performed on a CHI660E electrochemical workstation (CH Instruments Inc., Shanghai, China) at a scan rate of 0.5 mV·s−1 between 0.01 and 3.0 V. Electrochemical impedance spectroscopy (EIS) was conducted at open circuit potential state in the frequency range of 0.01–100 kHz with 5 mV amplitude on a CHI660E electrochemical workstation (CH Instruments Inc., Shanghai, China). The galvanostatic intermittent titration technique (GITT) method proposed by Weppner et al., as a reliable technique with highly resolved data, was used to determine the Li+ ions diffusion coefficient (DLi) in the electrode materials [34]. The DLi can be calculated by the following equation [35,36]:
D L i + = 4 π ( m V M M S ) 2 ( Δ E s Δ E τ ) 2
where the m (g) is mass, the VM (cm3 mol−1) and M (g mol−1) are the molar volume of the active material and molecular weight, respectively. S is the surface area of the electrode.

3. Results and Discussion

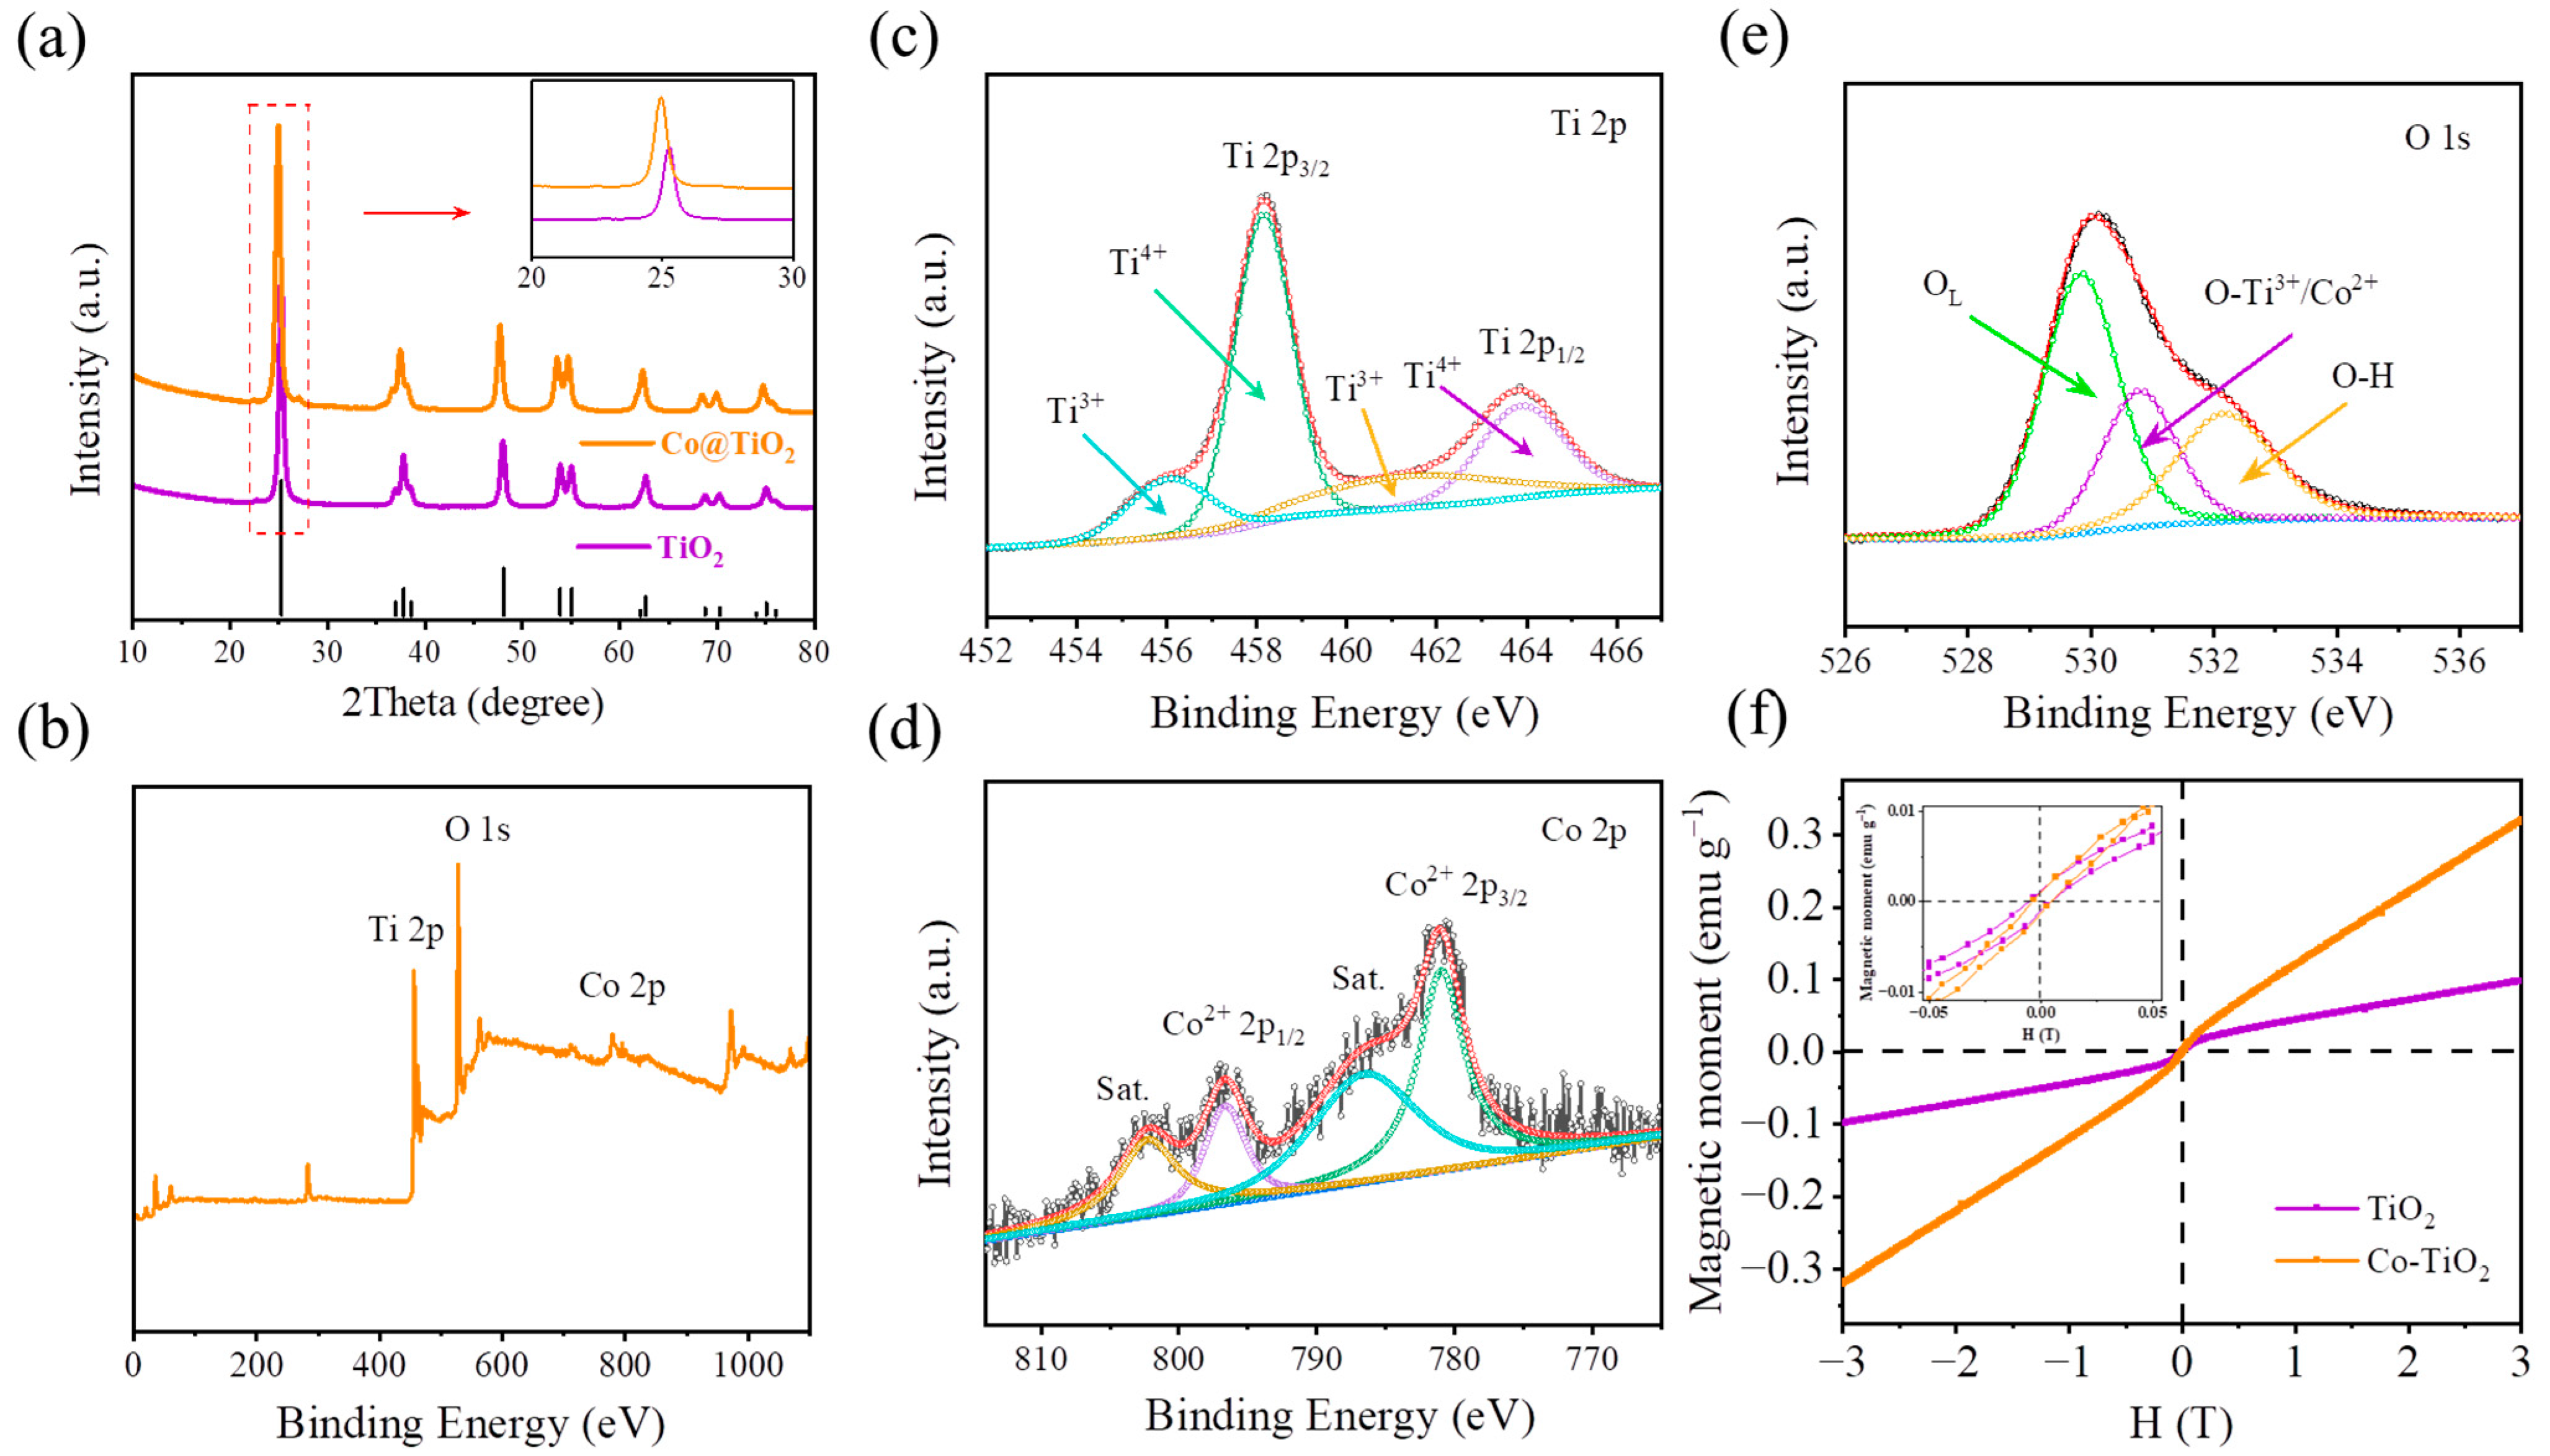
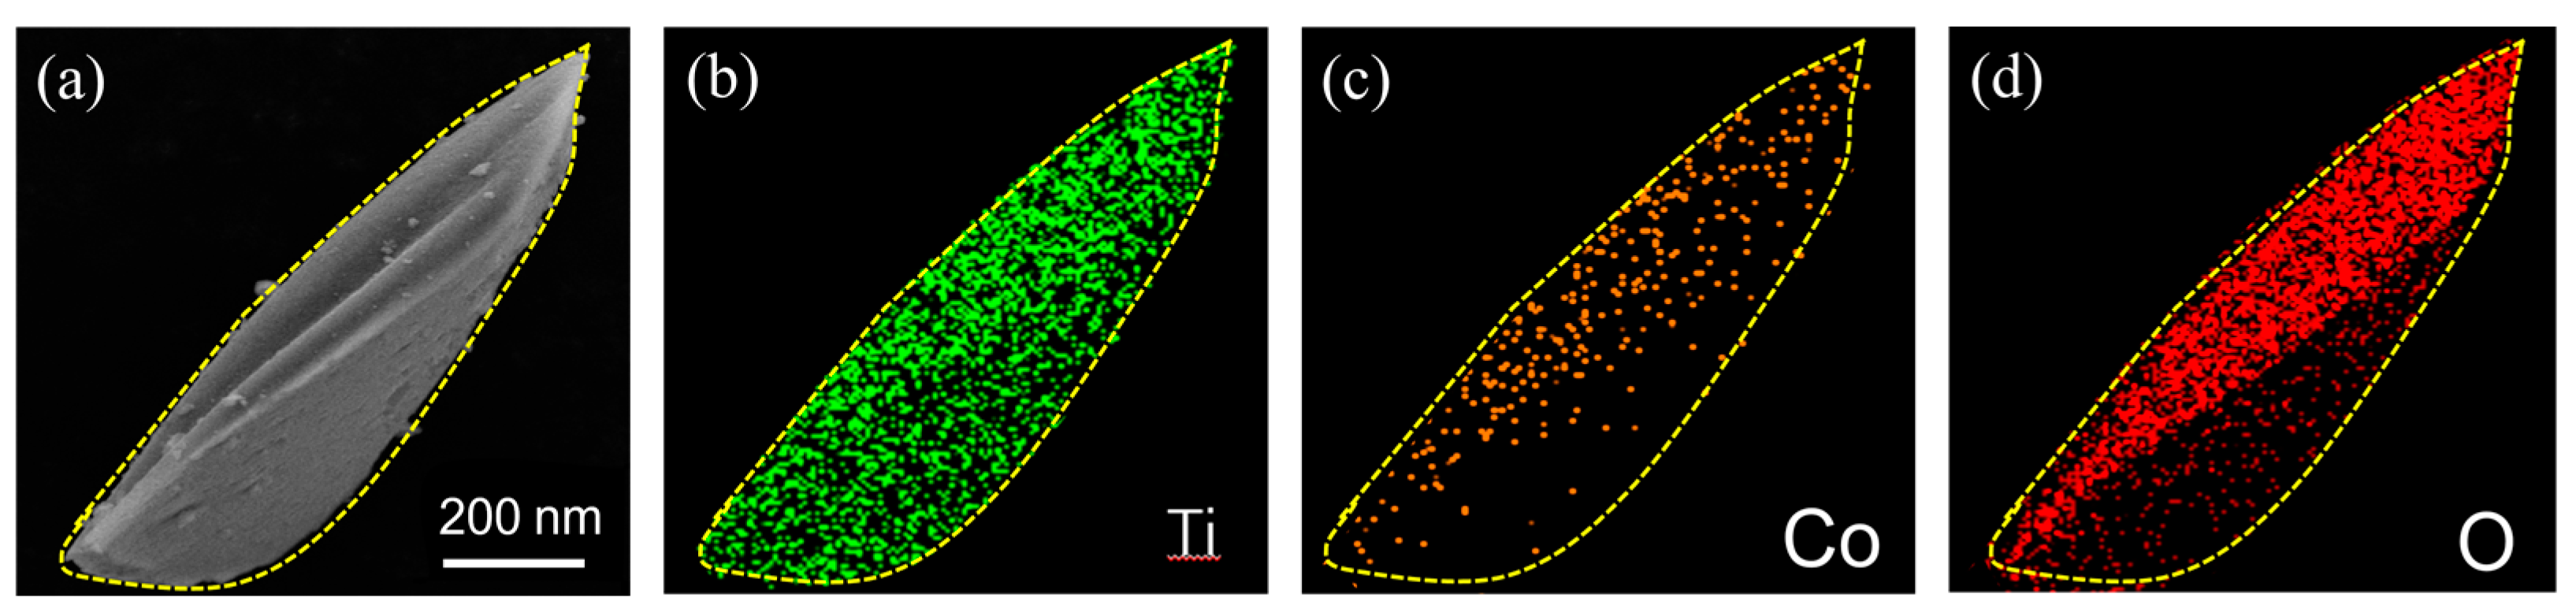
3.1. Materials Characterizations

The morphology and structure of the pristine TiO2 and Co@TiO2 materials were confirmed by SEM, TEM, and HRTEM images, as shown in Figure 1. Figure 1a,b display the SEM images of TiO2 and Co@TiO2, respectively. Obviously, both before and after doping the materials possess similar morphology that looks like an irregular prism of high quality. TEM (Figure 1c) shows that TiO2 is composed of a large number of tiny nanocrystals (8–12 nm). HRTEM (Figure 1e) shows a lattice fringe of 0.35 nm, which can be marked as the (101) crystal plane spacing of the anatase phase. Furthermore, the inset of Figure 1e exhibits the SAED pattern, which demonstrates the desired phase of the sample. The insert ring pattern in Figure 1f formed by small diffraction spots indicates a nanocrystalline structure of the irregular prism. In fact, the irregular prism image (Figure 1d) was made up of tiny nanocrystal subunits with a diameter of 7–10 nm. The crystallite sizes for all the samples were calculated using Scherrer’s formula [37]. In the comparative experiment, it is worth noting that the modified product shows a smaller size. This may be attributed to the dopants’ inhibition of the growth of the TiO2 crystal [38].
In order to prove the specific surface area and pore size distribution of the products, the N2 adsorption–desorption isotherm measurements were carried out, as shown in Figure 2. Note that both of them exhibit a typical type-IV isotherm. Figure 2a,b show the specific surface area and pore size distribution, respectively. Obviously, both represent mesoporous properties. The specific surface area of Co@TiO2 is 131.929 m2 g−1, which is larger than that of the TiO2 sample at 92.251 m2 g−1. Thanks to the dopants, the growth of the TiO2 crystal will be inhibited to form smaller particles, thus having a larger specific surface area [27,39]. From the pore size distribution, it can be observed that both products show a unimodal peak. TiO2 possesses a wide pore size distribution according to BJH analysis, with most of the pores measuring around 8 nm, which is larger than the pore size of Co@TiO2 (7 nm). The pore volume of anatase TiO2 was determined to be 0.128 cm3 g−1. Compared with TiO2, the modified sample displays a larger pore volume of 0.238 cm3 g−1. These results indicate a significantly increased specific surface area and pore volume, which can provide more active sites for lithium-ion intercalation, improving the cycle stability and specific capacity of LIBs [40,41].
The crystal structure of the samples was characterized by XRD. Considering that the crystal phase, grain size, and morphology of TiO2 are affected by temperature, anatase TiO2 with good crystallinity was synthesized using a wet chemical method [27]. Figure 3a illustrates the XRD patterns of TiO2 and Co@TiO2, demonstrating that the crystals are indexed to an anatase phase (JCPDS no. 21-1272). In contrast to TiO2, the inset of Figure 3a displays a slight shift in the (101) diffraction peak to the low angle for Co@TiO2, indicating that Co doping was achieved in TiO2 [39]. The surface chemical composition and element valence of Co@TiO2 were determined by XPS, as shown in Figure 3b. From the XPS survey spectrum of Co@TiO2, it is obvious that Co, Ti, and O are found on the surface of the composite. Figure 3c shows that the Ti spectrum of the Co@TiO2 sample can be fitted with four peaks corresponding to Ti4+ 2p3/2 at 458.1 eV, Ti4+ 2p1/2 at 463.82 eV, Ti3+ 2p3/2 at 456.05 eV, and Ti3+ 2p1/2 at 461.65 eV, the line separation between Ti4+ 2p1/2 and Ti4+ 2p3/2 being 5.72 eV, which is consistent with the standard binding energy of TiO2 [42]. However, the occurrence of Ti3+ peaks may be related to the Co doping content [43]. Figure 3d shows that the Co peak can be deconvoluted into two peaks: one at 780.8 eV, which corresponds to Co 2p3/2, and another at 796.2 eV, corresponding to Co 2p1/2 in Co 2p spectra, followed by two satellite peaks at approximately 786 eV and 802.5 eV, respectively. This further confirms the Co dopant in TiO2 [44]. The corresponding energy-dispersive X-ray spectroscopy (EDS) mapping also confirmed that TiO2 irregular prisms were uniformly doped by Co2+, as shown in Figure 4a–d. In addition, the content of Co2+ in the Co@TiO2 is about 10%. The deconvoluted O 1s spectrum (Figure 3e) is revealed by three Gaussian curves, which is consistent with the previous literature [45]. One accurate peak of O 1s, located at about 529.9 eV, arises due to the oxygen in the TiO2 crystal lattice (OL), while the other oxygen peaks, located at 530.9 eV and 532.1 eV, can be attributed to the outcome of Ti−O/Co−O bonds and the hydroxyl group (OH), respectively [43].
Magnetic characterization helps to understand the reaction mechanism of transition metals and provides valuable insights for the design of high-performance anodes [46,47,48,49,50]. In order to deeply understand the magnetic properties of TiO2 after Co doping, hysteresis loops were obtained by a Quantum Design PPMS magnetometer under ambient temperature, as shown in Figure 3f. Obviously, Co@TiO2 shows a greater magnetization, indicating the achievement of Co doping. The inset in Figure 3f shows that the variation is almost identical in the coercivity (HC) of the two samples, which confirms the ferromagnetic ordering at room temperature. However, it is known that pure TiO2 is diamagnetic. So far, there is no unified explanation for the cause of ferromagnetism in diamagnetic materials. There are two mainstream views; one explains this fact by the model of bound polarons [51,52], and the other attributes it to the existence of intrinsic point defects (oxygen vacancy, Ti vacancy, or Ti3+) [53,54,55,56,57,58,59]. Here, the ferromagnetism of TiO2 may be caused by oxygen vacancy/Ti3+ according to the analysis in Figure 3c,e. The above results indicate that Co may enter the lattice of TiO2, thereby improving the intrinsic electrical conductivity inside the TiO2 bulk. Meanwhile, more active materials may be activated due to the existence of Co, which helps to enhance lithium storage performance, especially in terms of capacity.
Over the past few decades, compared with rutile and TiO2 (B), anatase has been the most extensively studied because of its stable nanoscale crystal phase [5,60]. A variety of basic tests of the electrochemical performance of the products were conducted to evaluate their potential applicability in LIBs. The anatase phase of TiO2 can accommodate lithium ions via the electrochemical reaction. The insertion/extraction of Li+ ions in the crystal structure is performed according to the following equation [5,27]:
TiO2 + x Li+ + x eLixTiO2
In terms of the anatase phase, the theoretical capacity of TiO2 will attain 336 mAh g−1 when x equals 1. However, the mole of electrons transferred is usually about 0.5 in electrochemical reaction [27,61].

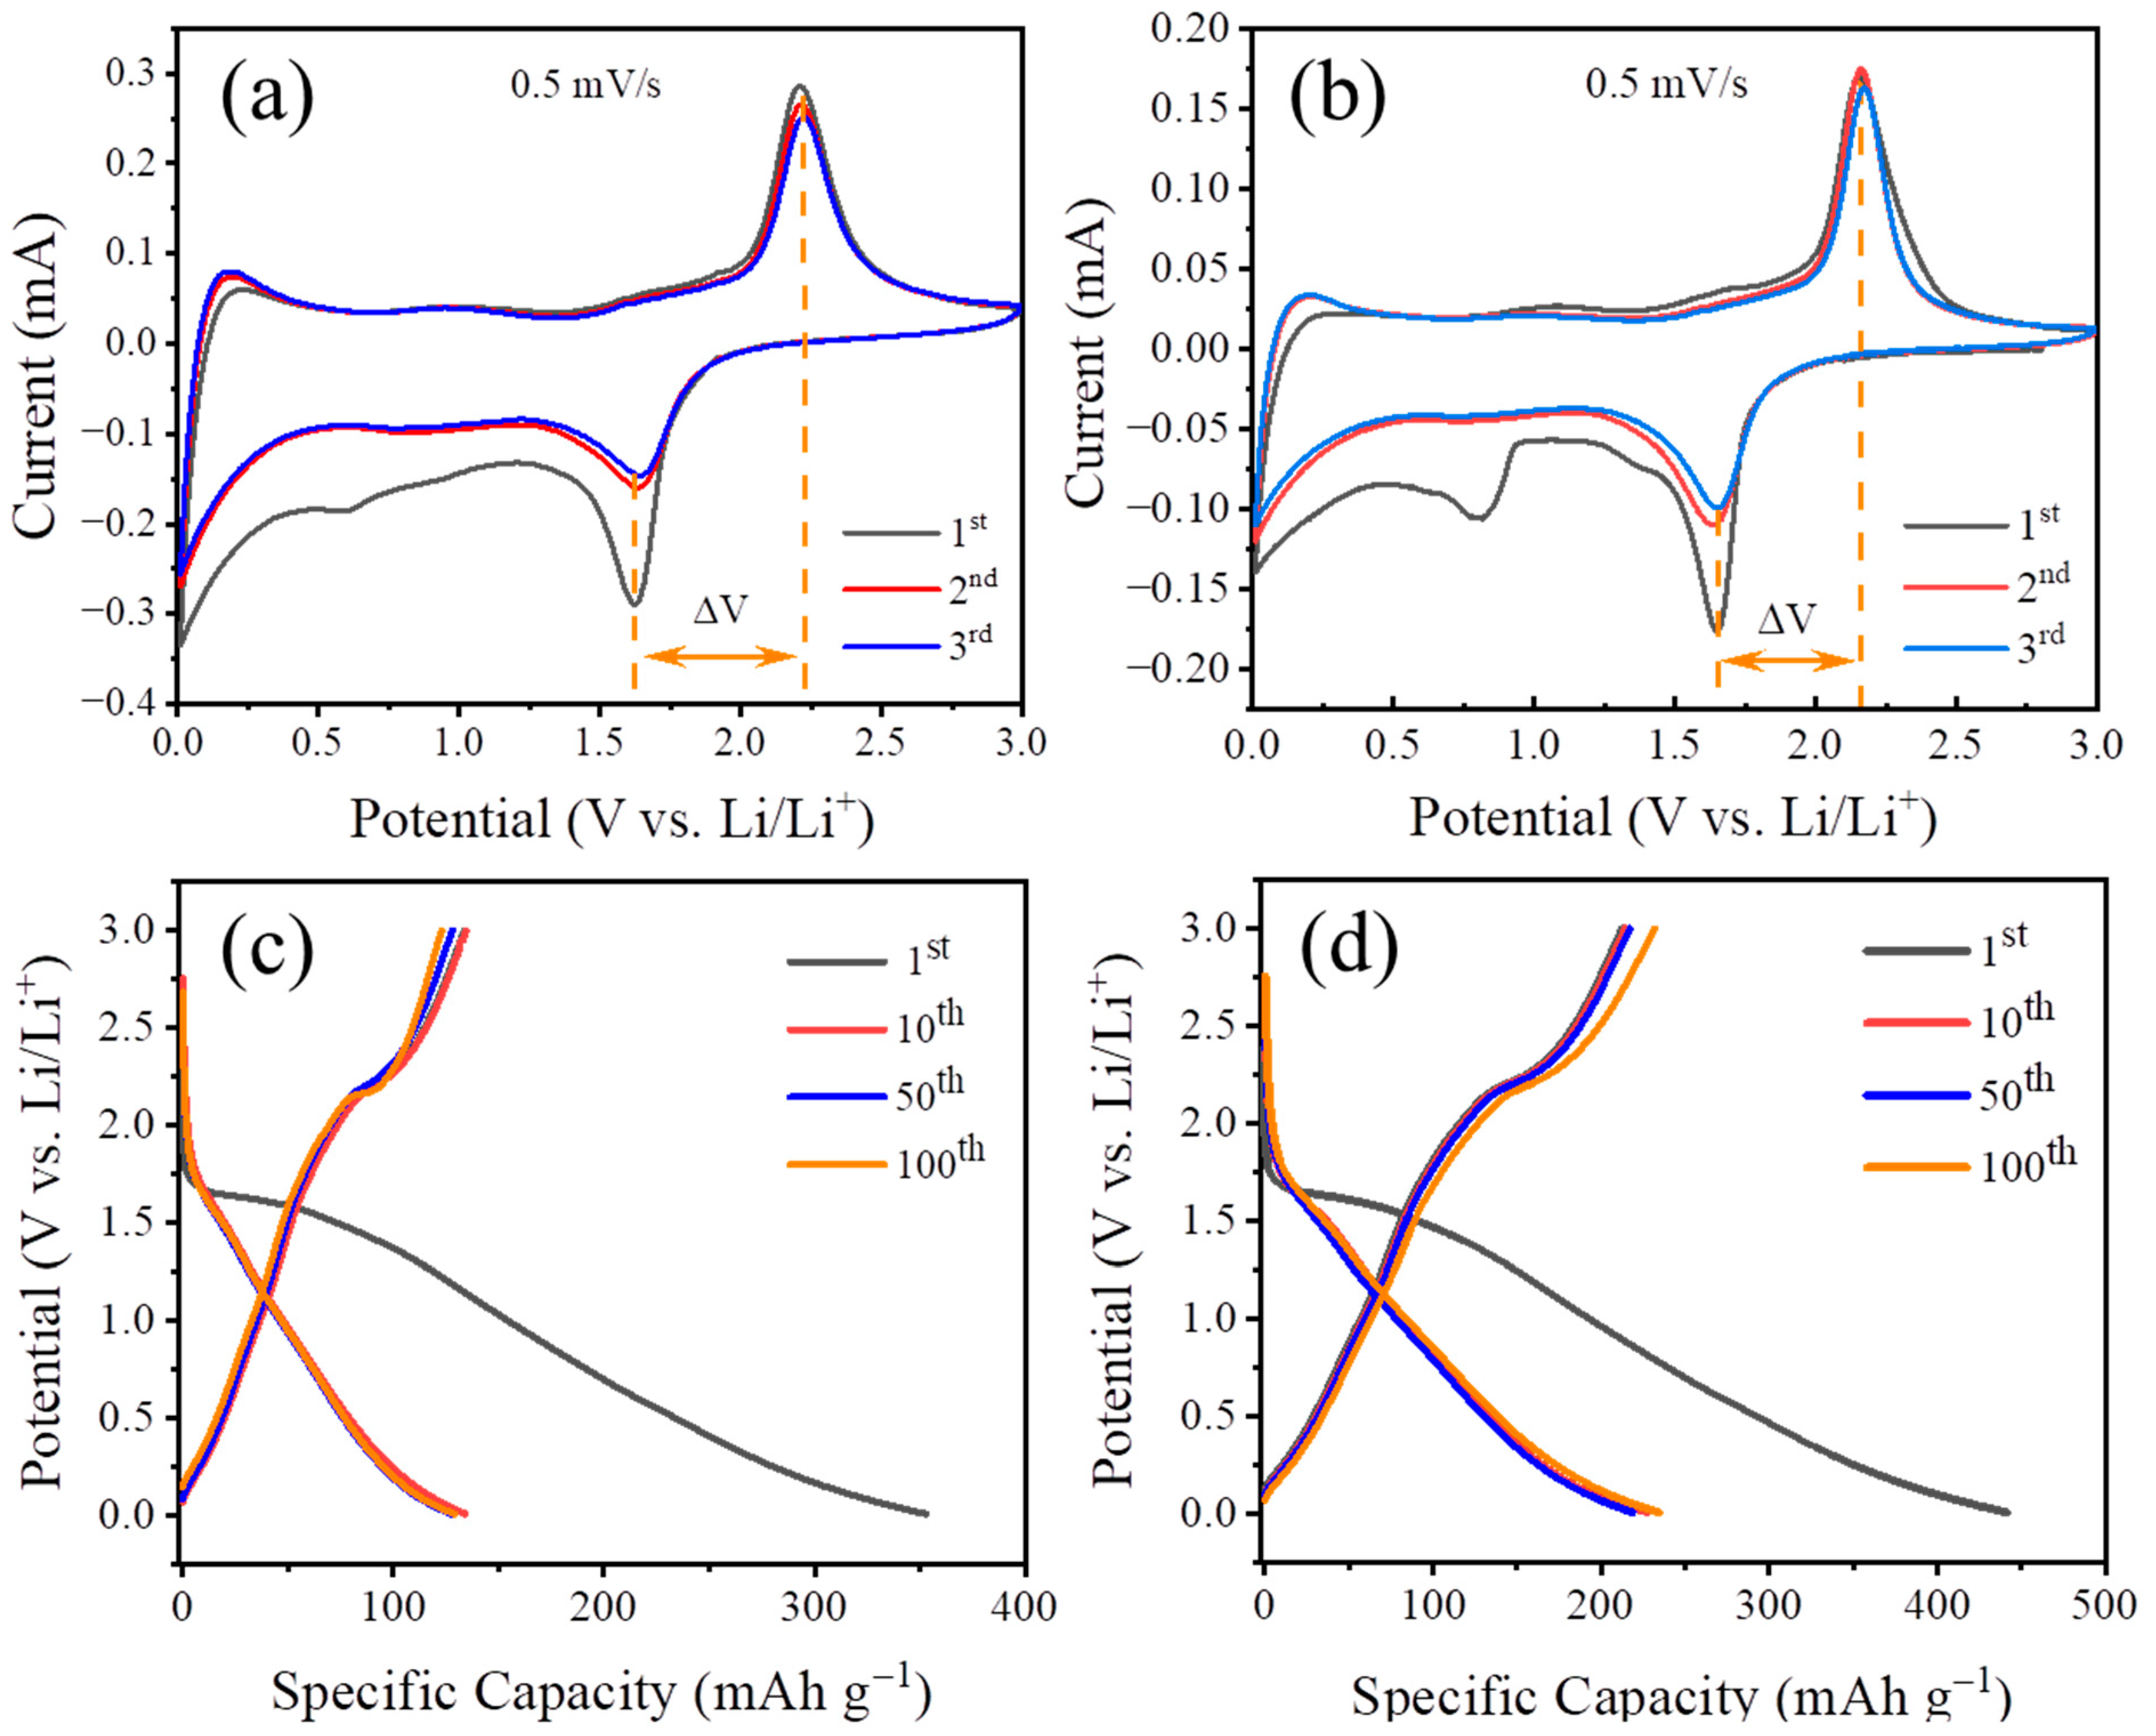
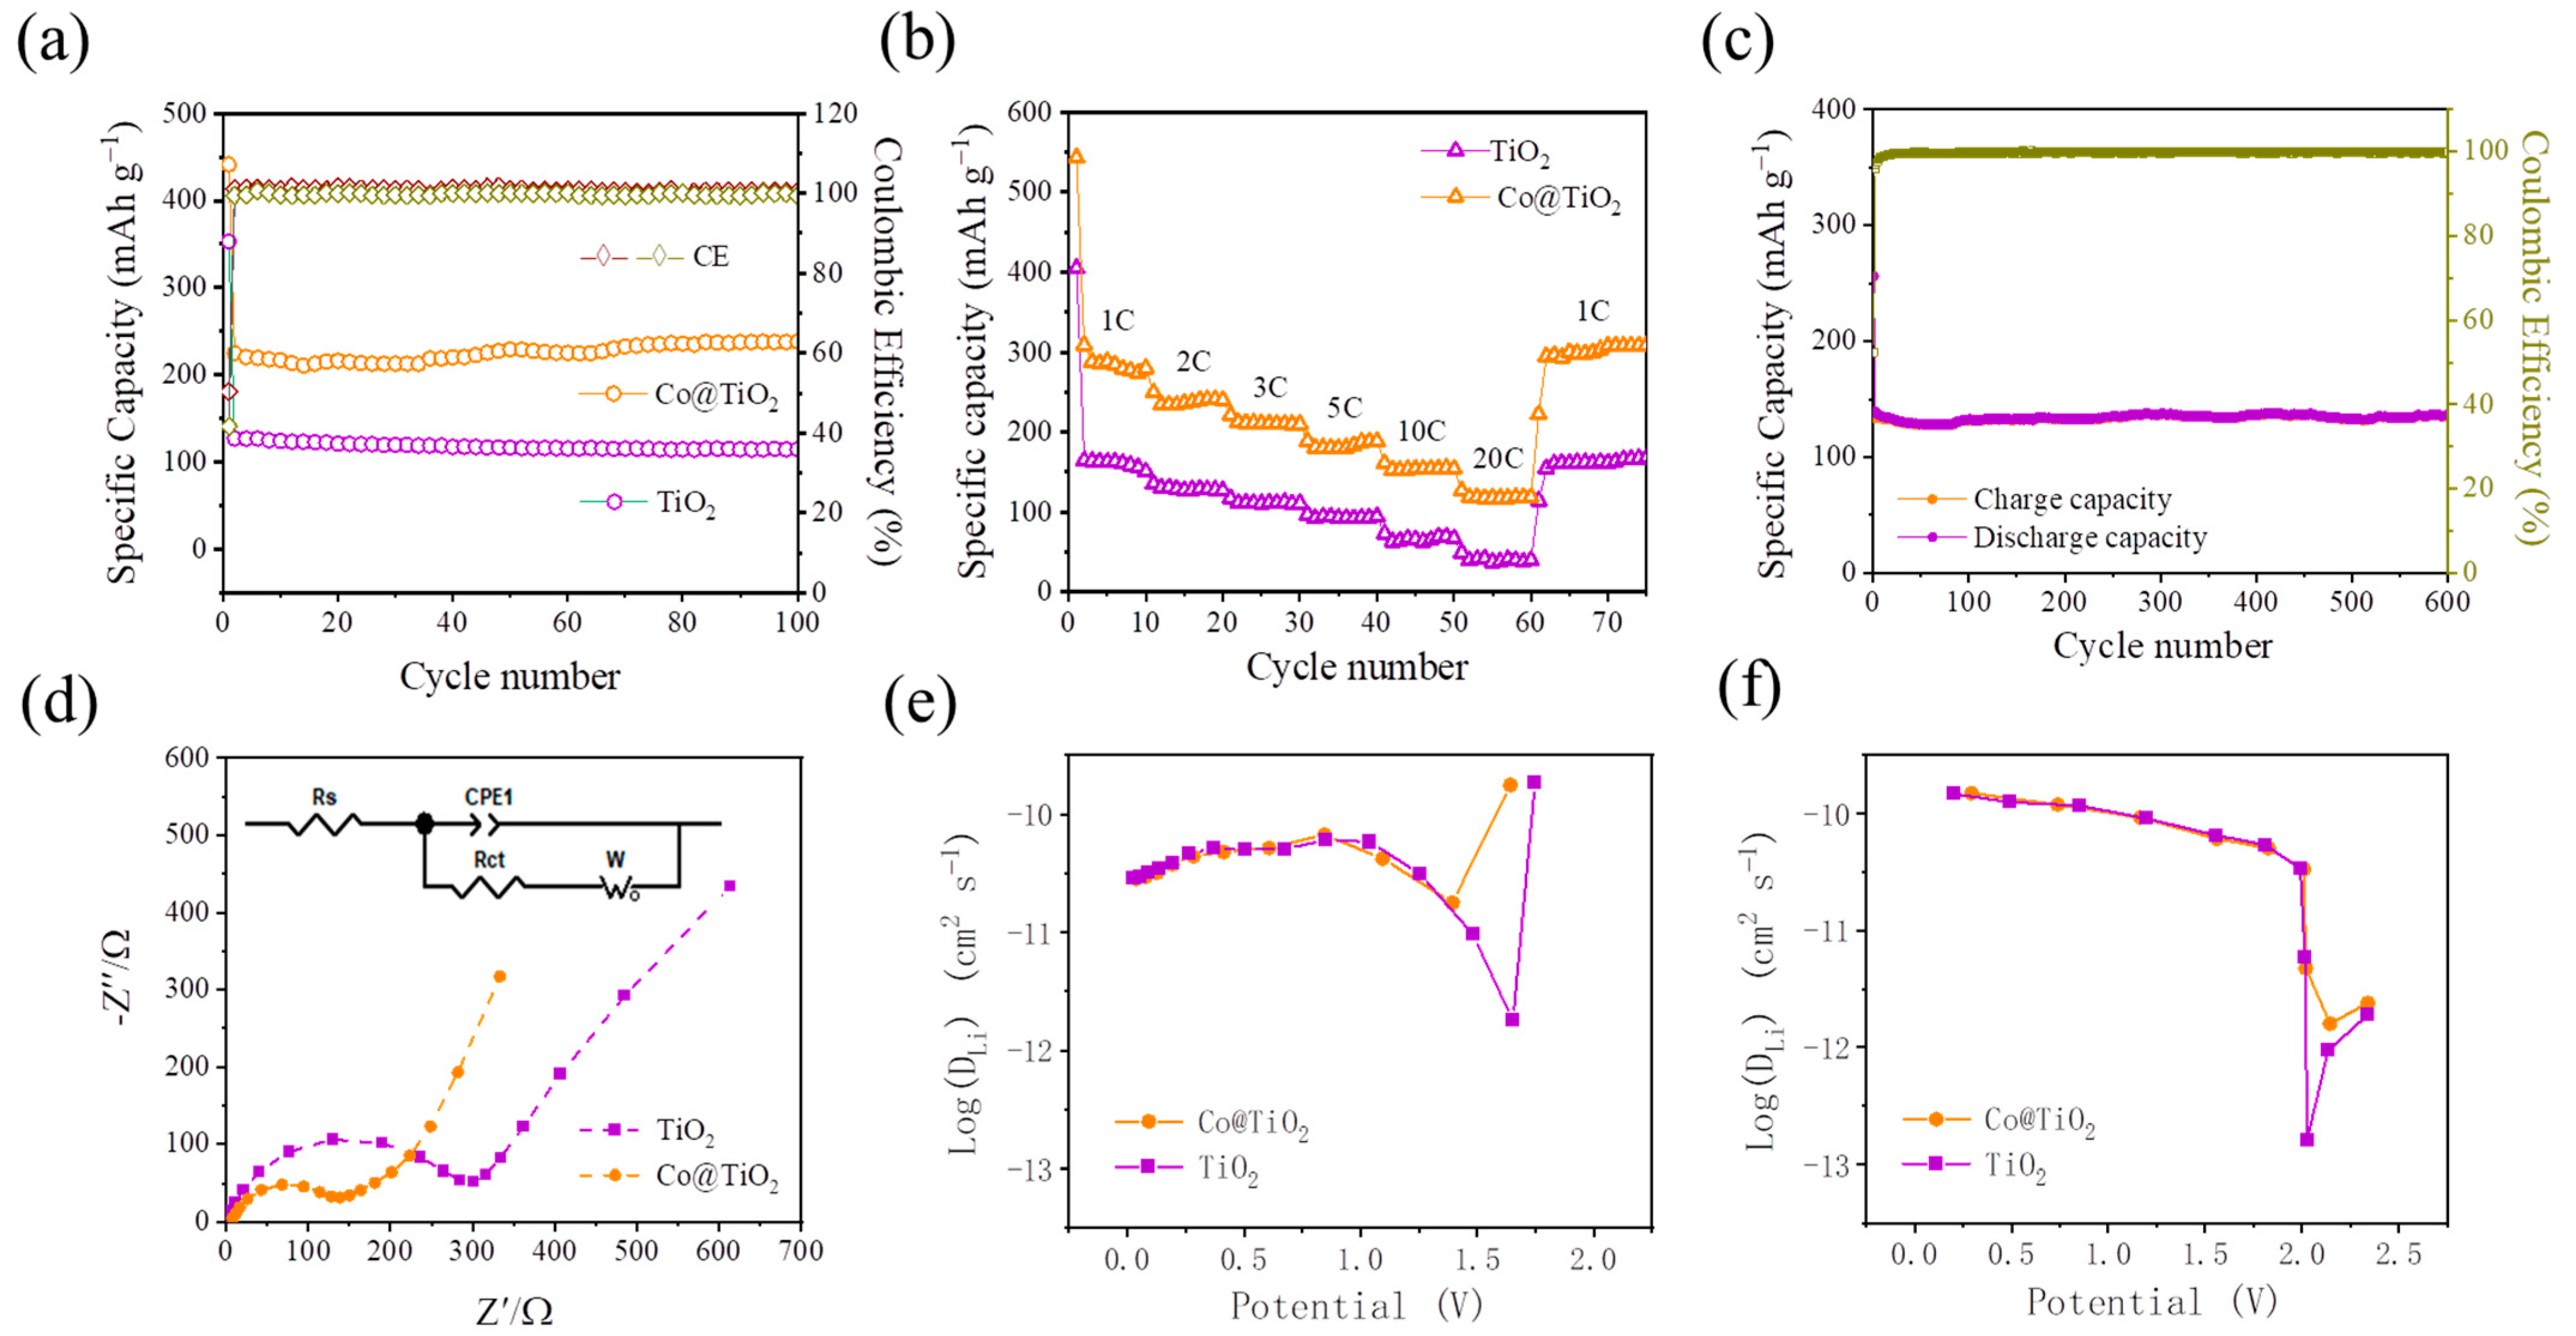
3.2. Electrochemical Performance and Kinetic Analysis

The lithium-ion battery is composed of TiO2 or Co@TiO2 as the anode and lithium metal as the reference electrode. Figure 5a,b show the CV curves of TiO2 and Co@TiO2 electrodes at a scan rate of 0.5 mV s−1 for the first three cycles, respectively. The initial potentials of TiO2 and Co@TiO2 are 2.6 V and 2.7 V, respectively. It is obvious that, other than the first curve, the next four curves nearly overlap, demonstrating the highly reversible nature of the assembled battery. As shown in Figure 5a, a couple of redox peaks at ~1.62 V and ~2.22 V are observed from CV measurement, which can be attributed to the lithium ions intercalation into and deintercalation from the interstitial sites of TiO2. Figure 5b shows two reduction peaks located at 0.8 V and 1.65 V, respectively, and one oxidation peak located at 2.15 V in the first cycle. The reduction peak at 0.8 V should be attributed to the formation of a solid electrolyte interphase (SEI) film [39], which may be related to the catalysis of the Co [50]. Compared with TiO2, the separation between reduction and oxidation peaks (ΔV) of the modified sample decreases slightly, indicating that Co doping can reduce the polarization and impedance at the electrode and electrolyte interface, which is conducive to a better charge/discharge reversibility [27,39]. Moreover, the intensity of the oxidation peak decreases and shifts to a lower potential after Co doping. This phenomenon indicates the increase in lithium ion insertion dynamics and wettability of the Co@TiO2 electrode material, which is due to the decrease in the band gap under the action of Co [39]. Figure 5c,d shows the charge/discharge potential profiles of both TiO2 and Co@TiO2 electrodes for the 1st, 5th, 10th, and 100th cycles at 3 C between 0.01 and 3 V. Obviously, Co@TiO2 exhibits a higher discharge specific capacity of 441 mAh g−1 in the initial discharge process, the corresponding charge capacity being 227 mAh g−1 (Figure 5c). As for TiO2, it shows a lower capacity of 353 mAh g−1 with a corresponding charge capacity of 133 mAh g−1, as shown in Figure 5d. Obviously, for Co-doped TiO2, the doping of cobalt metal can provide capacity, which may come from the redox reaction [62,63] and interface space charge [51,64]. This theoretical capacity is closely related to the content of cobalt and is difficult to quantify. The first coulombic efficiencies (CE) of 51.5% and 37.7% were obtained for Co@TiO2 and TiO2, respectively. Noting that the initial CE of Co@TiO2 is higher than that of TiO2, which is mainly due to the improvement in the electronic conductivity of TiO2 after the transition metal doping [39,65]. Notably, both exhibit an irreversible capacity loss during the first cycle, which can be attributed to the formation of the SEI film [66,67]. Fortunately, the irreversible capacity of Co@TiO2 gradually decreases in the subsequent cycle, indicating that the electrochemical reaction becomes stable in the process of lithium insertion/extraction. This can be ascribed to the enhancement in structural stability and electronic conductivity by Co doping. In addition, TiO2 shows larger irreversible capacity decay, which may be caused by its inherent poor conductivity.
The electrochemical properties of TiO2 and Co@TiO2 were evaluated in assembled LIBs with lithium metal counter electrodes and CR2032 coin battery geometry. The cycling capacity of both TiO2 and Co@TiO2 at a current density of 3 C between 0.01 V and 3 V is shown in Figure 6a. The capacity of TiO2 decreases gradually. Compared with TiO2, Co@TiO2 has better cycle performance. Moreover, it is clearly observed that the cyclic retention of Co@TiO2 with a reversible capacity of 237 mAh g−1 is significantly higher than that of TiO2 (114 mAh g−1) after 100 cycles. Due to the difference between the oxidation states of cobalt (Co2+) and titanium (Ti4+), Co doping introduces lattice distortion and oxygen vacancies in the crystal structure, which helps to reduce the band gap and improve the electron transport rate [68]. Even after 600 cycles, the Co@TiO2 electrode still provides a stable and high reversible capacity of 125 mAh g−1 at a heavy current rate of 10 C, which is at a relatively high level compared with those of the reported anode materials, as shown in Figure 6c. The details are described in Table 1. Figure 6b exhibits an excellent rate performance of Co@TiO2 at charge–discharge rates between 1 C and 20 C. The specific capacities of 274, 240, 209, 180, and 147, 117 mAh g−1 can be delivered at current densities of 1, 2, 3, 5, 10, and 20 C, respectively. When the current density returns to 1 C, a high specific capacity of 275 mAh g−1 can be maintained. These results clearly demonstrate that the Co@TiO2 has excellent lithium storage performance with long cycle life and great rate capability for the fast charge–discharge process. In short, the excellent lithium storage property of Co@TiO2 as an anode material for LIBs can be attributed to several aspects. First of all, a higher BET specific surface area, and more electrochemical active sites and electrolyte/electrode interfaces, promote better electrolyte permeation and provide more possibilities for lithium storage. Secondly, the porous structure of electrode materials has the advantage of not only shortening the distance of ion transport, but also buffering severe volume fluctuation during lithiation/de-lithiation. Thirdly, the smaller impedance and larger diffusion coefficient can accelerate the electrochemical kinetics. Additionally, the increased electrical conductivity can promote electron transport. All these features demonstrate that Co@TiO2 has an enhanced electrochemical performance, especially in terms of capacity.
In order to investigate the kinetic properties of the TiO2 and Co@TiO2, EIS and GITT were conducted. As presented in Figure 6d, both Co@TiO2 and TiO2 have similar characteristics, including electrolyte resistance (Rs) at high frequencies, a depressed semicircle at the middle frequencies corresponding to the charge transfer process (Rct), and a straight line at low frequencies caused by Warburg impedance (W) reflecting the solid-state diffusion of lithium ions in the electrode. Both curves are fitted with a typical equivalent circuit (the inset of Figure 6d). According to the fitting impedance data, Rct of 300 Ω and 140 Ω was obtained for TiO2 and Co@TiO2, respectively. Obviously, the charge transfer resistance of the Co@TiO2 electrode is much lower, almost half that of the TiO2 electrode. This is due to the increase in conductivity, which should come from the mixed valence state induced by the Co2+ ions [69].
Furthermore, the GITT was performed to research the lithium diffusion coefficient (DLi), as shown in Figure 6e. Obviously, the change in DLi strongly depends on the charge and discharge process. The DLi value of TiO2 in the initial discharge is 1.88 × 10⁻¹⁰ cm2 s−1. Subsequently, DLi decreases rapidly and achieves a minimum value of 1.76 × 10⁻¹² cm2 s−1. Next, DLi increases to 6.05 × 10⁻¹¹ cm2 s−1. In the end, DLi slightly decreases again to 2.90 × 10⁻¹¹ cm2 s−1. As can be seen from Figure 6e, Co doping significantly improves the DLi of TiO2. In particular, the minimum DLi is 1.79 × 10⁻¹¹ cm2 s−1 in the reduction platform region, about 10 times higher than that of TiO2. Similarly, Co@TiO2 shows a faster ion diffusion rate in the oxidation plateau region than TiO2 (Figure 6f). The results show that Co doping enhances the dynamic performance of TiO2, thereby improving the overall electrochemical performance [36].

4. Conclusions

In conclusion, Co-doped anatase TiO2 has been successfully synthesized with superior reversible capacity by a hydrothermal method. It is worth noting that the Co2+-doped TiO2 not only possesses a large specific surface area, pore volume, and mesoporous structure with narrow pore distribution, but also has enhanced conductivity. It is found that doping Co2+ in the TiO2 anode can improve its reversible capacity, rate performance, and coulombic efficiency. Compared with undoped TiO2, the Co@TiO2 electrode shows superior electrochemical performance. Therefore, as an advanced anode material for lithium storage, it exhibits high capacity and good cycling ability. The performance of electrode materials can be greatly improved by doping, which can promote the commercial application of TiO2 anode materials.

Author Contributions

Conceptualization, L.C., F.-C.G., Q.L. and Q.C.; data curation, L.C. and S.-M.M.; formal analysis, L.C., A.-Q.Z. and H.D.; funding acquisition, Q.C.; investigation, L.C., Z.-Z.L. and Z.-F.G.; methodology, L.C., D.-S.L. and Q.L.; validation, L.C., X.-X.X., Y.L. and Q.L.; visualization, L.C. and X.-X.X.; writing—original draft, L.C.; writing—review and editing, L.C., Q.L. and Q.C. All authors have read and agreed to the published version of the manuscript.

Funding

This research was funded by the National Natural Science Foundation of China, grant numbers 11974145 and 22179066. This research was financially supported by the National Science Foundation of Shandong Province, grant numbers ZR2020ZD28 and ZR2020MA073.

Institutional Review Board Statement

Not applicable.

Informed Consent Statement

Not applicable.

Data Availability Statement

Not applicable.

Conflicts of Interest

The authors declare no conflict of interest.

References

  1. Croguennec, L.; Palacin, M.R. Recent Achievements on Inorganic Electrode Materials for Lithium-Ion Batteries. J. Am. Chem. Soc. 2015, 137, 3140–3156. [Google Scholar] [CrossRef] [PubMed]
  2. Armand, M.; Tarascon, J.M. Building better batteries. Nature 2008, 451, 652–657. [Google Scholar] [CrossRef] [PubMed]
  3. Zhang, M.-M.; Chen, J.-Y.; Li, H.; Wang, C.-R. Recent progress in Li-ion batteries with TiO2 nanotube anodes grown by electrochemical anodization. Rare Met. 2021, 40, 249–271. [Google Scholar] [CrossRef]
  4. Teng, X.-L.; Sun, X.-T.; Guan, L.; Hu, H.; Wu, M.-B. Self-supported transition metal oxide electrodes for electrochemical energy storage. Tungsten 2020, 2, 337–361. [Google Scholar] [CrossRef]
  5. Liang, S.; Wang, X.; Cheng, Y.-J.; Xia, Y.; Mueller-Buschbaum, P. Anatase titanium dioxide as rechargeable ion battery electrode- A review. Energy Storage Mater. 2022, 45, 201–264. [Google Scholar] [CrossRef]
  6. Novoselov, K.S.; Geim, A.K.; Morozov, S.V.; Jiang, D.; Zhang, Y.; Dubonos, S.V.; Grigorieva, I.V.; Firsov, A.A. Electric field effect in atomically thin carbon films. Science 2004, 306, 666–669. [Google Scholar] [CrossRef] [PubMed]
  7. Waldmann, T.; Hogg, B.-I.; Wohlfahrt-Mehrens, M. Li plating as unwanted side reaction in commercial Li-ion cells—A review. J. Power Sources 2018, 384, 107–124. [Google Scholar] [CrossRef]
  8. Nazari, A.; Farhad, S. Heat generation in lithium-ion batteries with different nominal capacities and chemistries. Appl. Therm. Eng. 2017, 125, 1501–1517. [Google Scholar] [CrossRef]
  9. Ren, H.; Yu, R.; Wang, J.; Jin, Q.; Yang, M.; Mao, D.; Kisailus, D.; Zhao, H.; Wang, D. Muftishelled TiO2 Hollow Microspheres as Anodes with Superior Reversible Capacity for Lithium Ion Batteries. Nano Lett. 2014, 14, 6679–6684. [Google Scholar] [CrossRef] [PubMed]
  10. Hu, H.; Yu, L.; Gao, X.; Lin, Z.; Lou, X.W. Hierarchical tubular structures constructed from ultrathin TiO2(B) nanosheets for highly reversible lithium storage. Energy Environ. Sci. 2015, 8, 1480–1483. [Google Scholar] [CrossRef] [Green Version]
  11. Guo, Y.-G.; Hu, Y.-S.; Sigle, W.; Maier, J. Superior electrode performance of nanostructured mesoporous TiO2 (anatase) through efficient hierarchical mixed conducting networks. Adv. Mater. 2007, 19, 2087–2091. [Google Scholar] [CrossRef]
  12. Yang, Y.; Ji, X.; Jing, M.; Hou, H.; Zhu, Y.; Fang, L.; Yang, X.; Chen, Q.; Banks, C.E. Carbon dots supported upon N-doped TiO2 nanorods applied into sodium and lithium ion batteries. J. Mater. Chem. A 2015, 3, 5648–5655. [Google Scholar] [CrossRef]
  13. Liu, B.; Deng, D.; Lee, J.Y.; Aydil, E.S. Oriented single-crystalline TiO2 nanowires on titanium foil for lithium ion batteries. J. Mater. Res. 2010, 25, 1588–1594. [Google Scholar] [CrossRef]
  14. Nam, S.H.; Shim, H.-S.; Kim, Y.-S.; Dar, M.A.; Kim, J.G.; Kim, W.B. Ag or Au Nanoparticle-Embedded One-Dimensional Composite TiO2 Nanofibers Prepared via Electrospinning for Use in Lithium-Ion Batteries. ACS Appl. Mater. Interfaces 2010, 2, 2046–2052. [Google Scholar] [CrossRef]
  15. Bao, S.-J.; Bao, Q.-L.; Li, C.-M.; Dong, Z.-L. Novel porous anatase TiO2 nanorods and their high lithium electroactivity. Electrochem. Commun. 2007, 9, 1233–1238. [Google Scholar] [CrossRef]
  16. Qiu, Y.; Yan, K.; Yang, S.; Jin, L.; Deng, H.; Li, W. Synthesis of Size-Tunable Anatase TiO2 Nanospindles and Their Assembly into Anatase@Titanium Oxynitride/Titanium Nitride-Graphene Nanocomposites for Rechargeable Lithium Ion Batteries with High Cycling Performance. ACS Nano 2010, 4, 6515–6526. [Google Scholar] [CrossRef] [PubMed]
  17. Guo, Y.-G.; Hu, Y.-S.; Maier, J. Synthesis of hierarchically mesoporous anatase spheres and their application in lithium batteries. Chem. Commun. 2006, 2783–2785. [Google Scholar] [CrossRef]
  18. Chen, J.; Yang, L.; Tang, Y. Electrochemical lithium storage of TiO2 hollow microspheres assembled by nanotubes. J. Power Sources 2010, 195, 6893–6896. [Google Scholar] [CrossRef]
  19. Jiao, H.; Sun, G.; Wang, Y.; Zhang, Z.; Wang, Z.; Wang, H.; Li, H.; Feng, M. Defective TiO2 hollow nanospheres as photo-electrocatalysts for photo-assisted Li-O2 batteries. Chin. Chem. Lett. 2022, 33, 4008–4012. [Google Scholar] [CrossRef]
  20. Fang, J.; Liu, W.; Yu, F.; Qin, F.; Wang, M.; Zhang, K.; Lai, Y. Fe, S co-doped anatase TiO2 nanotubes as anodes with improved electrochemical performance for lithium ion batteries. Rsc Adv. 2016, 6, 70133–70140. [Google Scholar] [CrossRef]
  21. Ortiz, G.F.; Hanzu, I.; Djenizian, T.; Lavela, P.; Tirado, J.L.; Knauth, P. Alternative Li-Ion Battery Electrode Based on Self-Organized Titania Nanotubes. Chem. Mater. 2009, 21, 63–67. [Google Scholar] [CrossRef]
  22. Zhang, Z.-J.; Zhao, J.; Qiao, Z.-J.; Wang, J.-M.; Sun, S.-H.; Fu, W.-X.; Zhang, X.-Y.; Yu, Z.-Y.; Dou, Y.-H.; Kang, J.-L.; et al. Nonsolvent-induced phase separation-derived TiO2 nanotube arrays/porous Ti electrode as high-energy-density anode for lithium-ion batteries. Rare Met. 2021, 40, 393–399. [Google Scholar] [CrossRef]
  23. Wang, Y.; Li, H.; He, P.; Hosono, E.; Zhou, H. Nano active materials for lithium-ion batteries. Nanoscale 2010, 2, 1294–1305. [Google Scholar] [CrossRef] [PubMed]
  24. Lim, J.; Um, J.H.; Ahn, J.; Yu, S.-H.; Sung, Y.-E.; Lee, J.-K. Soft Template Strategy to Synthesize Iron Oxide-Titania Yolk-Shell Nanoparticles as High-Performance Anode Materials for Lithium-Ion Battery Applications. Chem.-A Eur. J. 2015, 21, 7954–7961. [Google Scholar] [CrossRef] [PubMed]
  25. An, L.P.; Gao, X.P.; Li, G.R.; Yan, T.Y.; Zhu, H.Y.; Shen, P.W. Electrochemical lithium storage of titania nanotubes modified with NiO nanoparticles. Electrochim. Acta 2008, 53, 4573–4579. [Google Scholar] [CrossRef]
  26. Choi, S.H.; Lee, J.-H.; Kang, Y.C. One-pot rapid synthesis of core-shell structured NiO@TiO2 nanopowders and their excellent electrochemical properties as anode materials for lithium ion batteries. Nanoscale 2013, 5, 12645–12650. [Google Scholar] [CrossRef]
  27. Lai, Y.; Liu, W.; Fang, J.; Qin, F.; Wang, M.; Yu, F.; Zhang, K. Fe-doped anatase TiO2/carbon composite as an anode with superior reversible capacity for lithium storage. RSC Adv. 2015, 5, 93676–93683. [Google Scholar] [CrossRef]
  28. Li, J.; Cai, Y.; Yao, X.; Tian, H.; Su, Z. Europium modified TiO2 as a high-rate long-cycle life anode material for lithium-ion batteries. New J. Chem. 2022, 46, 2266–2271. [Google Scholar] [CrossRef]
  29. Opra, D.P.; Gnedenkov, S.V.; Sinebryukhov, S.L.; Podgorbunsky, A.B.; Sokolov, A.A.; Ustinov, A.Y.; Kuryavyi, V.G.; Mayorov, V.Y.; Zheleznov, V.V. Doping of titania with manganese for improving cycling and rate performances in lithium-ion batteries. Chem. Phys. 2020, 538, 110864. [Google Scholar] [CrossRef]
  30. Kashale, A.A.; Dwivedi, P.K.; Sathe, B.R.; Shelke, M.V.; Chang, J.Y.; Ghule, A.V. Biomass-Mediated Synthesis of Cu-Doped TiO2 Nanoparticles for Improved-Performance Lithium-Ion Batteries. ACS Omega 2018, 3, 13676–13684. [Google Scholar] [CrossRef] [PubMed]
  31. Jeong, J.-H.; Jung, D.-W.; Shin, E.W.; Oh, E.-S. Boron-doped TiO2 anode materials for high-rate lithium ion batteries. J. Alloys Compd. 2014, 604, 226–232. [Google Scholar] [CrossRef]
  32. Andriamiadamanana, C.; Laberty-Robert, C.; Sougrati, M.T.; Casale, S.; Davoisne, C.; Patra, S.; Sauvage, F. Room-temperature synthesis of iron-doped anatase TiO2 for lithium-ion batteries and photocatalysis. Inorg. Chem. 2014, 53, 10129–10139. [Google Scholar] [CrossRef]
  33. Geng, H.; Ming, H.; Ge, D.; Zheng, J.; Gu, H. Designed fabrication of fluorine-doped carbon coated mesoporous TiO2 hollow spheres for improved lithium storage. Electrochim. Acta 2015, 157, 1–7. [Google Scholar] [CrossRef]
  34. Tawa, S.; Matsumoto, K.; Hagiwara, R. Reaction Pathways of Iron Trifluoride Investigated by Operation at 363 K Using an Ionic Liquid Electrolyte. J. Electrochem. Soc. 2019, 166, A2105–A2110. [Google Scholar] [CrossRef]
  35. Seok, D.I.; Wu, M.; Shim, K.B.; Kang, Y.; Jung, H.K. High-rate performance of Ti3+ self-doped TiO2 prepared by imidazole reduction for Li-ion batteries. Nanotechnology 2016, 27, 435401. [Google Scholar] [CrossRef]
  36. Zhang, Y.; Du, F.; Yan, X.; Jin, Y.; Zhu, K.; Wang, X.; Li, H.; Chen, G.; Wang, C.; Wei, Y. Improvements in the electrochemical kinetic properties and rate capability of anatase titanium dioxide nanoparticles by nitrogen doping. ACS Appl. Mater. Interfaces 2014, 6, 4458–4465. [Google Scholar] [CrossRef]
  37. Ishikawa, K.; Yoshikawa, K.; Okada, N. Size effect on the ferroelectric phase transition in PbTiO3 ultrafine particles. Phys. Rev. B Condens. Matter 1988, 37, 5852–5855. [Google Scholar] [CrossRef]
  38. Deng, L.; Wang, S.; Liu, D.; Zhu, B.; Huang, W.; Wu, S.; Zhang, S. Synthesis, Characterization of Fe-doped TiO2 Nanotubes with High Photocatalytic Activity. Catal. Lett. 2009, 129, 513–518. [Google Scholar] [CrossRef]
  39. Hong, Z.; Kang, M.; Chen, X.; Zhou, K.; Huang, Z.; Wei, M. Synthesis of Mesoporous Co2+-Doped TiO2 Nanodisks Derived from Metal Organic Frameworks with Improved Sodium Storage Performance. ACS Appl. Mater. Interfaces 2017, 9, 32071–32079. [Google Scholar] [CrossRef]
  40. Hong, Z.; Zhou, K.; Zhang, J.; Huang, Z.; Wei, M. Facile synthesis of rutile TiO2 mesocrystals with enhanced sodium storage properties. J. Mater. Chem. A 2015, 3, 17412–17416. [Google Scholar] [CrossRef]
  41. Hong, Z.; Zhou, K.; Huang, Z.; Wei, M. Iso-Oriented Anatase TiO2 Mesocages as a High Performance Anode Material for Sodium-Ion Storage. Sci. Rep. 2015, 5, 11960. [Google Scholar] [CrossRef]
  42. Sanjines, R.; Tang, H.; Berger, H.; Gozzo, F.; Margaritondo, G.; Levy, F. Electronic-structure of anatase TiO2 oxide. J. Appl. Phys. 1994, 75, 2945–2951. [Google Scholar] [CrossRef]
  43. Akshay, V.R.; Arun, B.; Manda, G.; Mutta, G.R.; Chanda, A.; Vasundhara, M. Observation of Optical Band-Gap Narrowing and Enhanced Magnetic Moment in Co-Doped Sol-Gel-Derived Anatase TiO2 Nanocrystals. J. Phys. Chem. C 2018, 122, 26592–26604. [Google Scholar] [CrossRef]
  44. Huang, W.; Zuo, Z.; Han, P.; Li, Z.; Zhao, T. XPS and XRD investigation of Co/Pd/TiO2 catalysts by different preparation methods. J. Electron Spectrosc. Relat. Phenom. 2009, 173, 88–95. [Google Scholar] [CrossRef]
  45. Zhuang, J.; Weng, S.; Dai, W.; Liu, P.; Liu, Q. Effects of Interface Defects on Charge Transfer and Photoinduced Properties of TiO2 Bilayer Films. J. Phys. Chem. C 2012, 116, 25354–25361. [Google Scholar] [CrossRef]
  46. Li, X.; Su, J.; Li, Z.; Zhao, Z.; Zhang, F.; Zhang, L.; Ye, W.; Li, Q.; Wang, K.; Wang, X.; et al. Revealing interfacial space charge storage of Li+/Na+/K+ by operando magnetometry. Sci. Bull. 2022, 67, 1145–1153. [Google Scholar] [CrossRef]
  47. Xia, Q.; Li, X.; Wang, K.; Li, Z.; Liu, H.; Wang, X.; Ye, W.; Li, H.; Teng, X.; Pang, J.; et al. Unraveling the Evolution of Transition Metals during Li Alloying- Dealloying by In-Operando Magnetometry. Chem. Mater. 2022, 34, 5852–5859. [Google Scholar] [CrossRef]
  48. Li, Z.; Zhang, Y.; Li, X.; Gu, F.; Zhang, L.; Liu, H.; Xia, Q.; Li, Q.; Ye, W.; Ge, C.; et al. Reacquainting the Electrochemical Conversion Mechanism of FeS2 Sodium-Ion Batteries by Operando Magnetometry. J. Am. Chem. Soc. 2021, 143, 12800–12808. [Google Scholar] [CrossRef]
  49. Zhang, F.; Li, Z.; Xia, Q.; Zhang, Q.; Ge, C.; Chen, Y.; Li, X.; Zhang, L.; Wang, K.; Li, H.; et al. Li-ionic control of magnetism through spin capacitance and conversion. Matter 2021, 4, 3605–3620. [Google Scholar] [CrossRef]
  50. Li, X.; Li, Z.; Liu, Y.; Liu, H.; Zhao, Z.; Zheng, Y.; Chen, L.; Ye, W.; Li, H.; Li, Q. Transition metal catalysis in lithium-ion batteries studied by operando magnetometry. Chin. J. Catal. 2022, 43, 158–166. [Google Scholar] [CrossRef]
  51. Coey, J.M.D.; Venkatesan, M.; Fitzgerald, C.B. Donor impurity band exchange in dilute ferromagnetic oxides. Nat. Mater. 2005, 4, 173–179. [Google Scholar] [CrossRef] [PubMed]
  52. Wang, Q.; Liu, X.; Wei, X.; Dai, J.; Li, W. Ferromagnetic Property of Co and Ni Doped TiO2 Nanoparticles. J. Nanomater. 2015, 2015, 371582. [Google Scholar] [CrossRef]
  53. Dakhel, A.A.; Hamad, H.; Jaafar, A. Investigation to the Structural, Optical, and Magnetic Properties of Synthesized Ni-Doped Anatase Nanoparticles: Essential Role of Treatment in Hydrogen on Long-Range Ferromagnetic Order. J. Supercond. Nov. Magn. 2019, 32, 253–260. [Google Scholar] [CrossRef]
  54. Santara, B.; Giri, P.K.; Dhara, S.; Imakita, K.; Fujii, M. Oxygen vacancy-mediated enhanced ferromagnetism in undoped and Fe-doped TiO2 nanoribbons. J. Phys. D-Appl. Phys. 2014, 47, 235304. [Google Scholar] [CrossRef]
  55. Bao, N.N.; Yi, J.B.; Fan, H.M.; Qin, X.B.; Zhang, P.; Wang, B.Y.; Ding, J.; Li, S. Vacancy-induced room-temperature ferromagnetism in Ga-TiO2. Scr. Mater. 2012, 66, 821–824. [Google Scholar] [CrossRef]
  56. Zhang, S.; Ogale, S.B.; Yu, W.; Gao, X.; Liu, T.; Ghosh, S.; Das, G.P.; Wee, A.T.S.; Greene, R.L.; Venkatesan, T. Electronic Manifestation of Cation-Vacancy-Induced Magnetic Moments in a Transparent Oxide Semiconductor: Anatase Nb:TiO2. Adv. Mater. 2009, 21, 2282–2287. [Google Scholar] [CrossRef]
  57. Bai, Y.; Chen, Q. First principle study of the cation vacancy in anatase TiO2. Phys. Status Solidi-Rapid Res. Lett. 2008, 2, 25–27. [Google Scholar] [CrossRef]
  58. Bao, N.N.; Fan, H.M.; Ding, J.; Yi, J.B. Room temperature ferromagnetism in N-doped rutile TiO2 films. J. Appl. Phys. 2011, 109, 07C302. [Google Scholar] [CrossRef]
  59. Zhou, S.; Cizmar, E.; Potzger, K.; Krause, M.; Talut, G.; Helm, M.; Fassbender, J.; Zvyagin, S.A.; Wosnitza, J.; Schmidt, H. Origin of magnetic moments in defective TiO2 single crystals. Phys. Rev. B 2009, 79, 113201. [Google Scholar] [CrossRef]
  60. Olson, C.L.; Nelson, J.; Islam, M.S. Defect chemistry, surface structures, and lithium insertion in anatase TiO2. J. Phys. Chem. B 2006, 110, 9995–10001. [Google Scholar] [CrossRef] [Green Version]
  61. Sun, X.D.; Ma, C.L.; Wang, Y.D.; Li, H.D. Al-13-pillared anatase TiO2 as a cathode for a lithium battery. Nanotechnology 2004, 15, 1535–1538. [Google Scholar] [CrossRef]
  62. Li, Z.; Zhao, Z.; Shang, X.; Zhang, J.; Cai, L.; Pan, Y.; Li, Q.; Li, H.; Cao, Q.; Li, Q. Electrical control of ON–OFF magnetism and exchange bias via reversible ionic motion. Appl. Phys. Lett. 2022, 120, 082405. [Google Scholar] [CrossRef]
  63. Li, H.; Hu, Z.; Xia, Q.; Zhang, H.; Li, Z.; Wang, H.; Li, X.; Zuo, F.; Zhang, F.; Wang, X.; et al. Operando Magnetometry Probing the Charge Storage Mechanism of CoO Lithium-Ion Batteries. Adv. Mater. 2021, 33, e2006629. [Google Scholar] [CrossRef]
  64. Li, Z.; Liu, H.; Zhao, Z.; Zhang, Q.; Fu, X.; Li, X.; Gu, F.; Zhong, H.; Pan, Y.; Chen, G.; et al. Space-Charge Control of Magnetism in Ferromagnetic Metals: Coupling Giant Magnitude and Robust Endurance. Adv. Mater. 2022, e2207353. [Google Scholar] [CrossRef]
  65. Liu, Y.; Li, X.; Zhang, F.; Long, G.; Fan, S.; Zheng, Y.; Ye, W.; Li, Q.; Wang, X.; Li, H.; et al. Fe, N co-doped amorphous carbon as efficient electrode materials for fast and stable Na/K-storage. Electrochim. Acta 2021, 396, 139265. [Google Scholar] [CrossRef]
  66. Kim, K.-T.; Ali, G.; Chung, K.Y.; Yoon, C.S.; Yashiro, H.; Sun, Y.-K.; Lu, J.; Amine, K.; Myung, S.-T. Anatase Titania Nanorods as an Intercalation Anode Material for Rechargeable Sodium Batteries. Nano Lett. 2014, 14, 416–422. [Google Scholar] [CrossRef]
  67. Yan, D.; Yu, C.; Li, D.; Zhang, X.; Li, J.; Lu, T.; Pan, L. Improved sodium-ion storage performance of TiO2 nanotubes by Ni2+ doping. J. Mater. Chem. A 2016, 4, 11077–11085. [Google Scholar] [CrossRef]
  68. Yadav, H.M.; Otari, S.V.; Koli, V.B.; Mali, S.S.; Hong, C.K.; Pawar, S.H.; Delekar, S.D. Preparation and characterization of copper-doped anatase TiO2 nanoparticles with visible light photocatalytic antibacterial activity. J. Photochem. Photobiol. A-Chem. 2014, 280, 32–38. [Google Scholar] [CrossRef]
  69. Zhu, J.; Zeng, K.; Lu, L. In-situ nanoscale mapping of surface potential in all-solid-state thin film Li-ion battery using Kelvin probe force microscopy. J. Appl. Phys. 2012, 111, 063723. [Google Scholar] [CrossRef]
Figure 1. (a) SEM, (c) TEM, and (e) HRTEM images of TiO2. (b) SEM, (d) TEM, and (f) HRTEM images of Co@TiO2. The insets in (e,f) are the TiO2- and Co@TiO2-related SAED patterns, respectively.
Materials 16 01325 g001
Figure 2. (a) N2 adsorption–desorption curves and (b) pore size distribution of TiO2 and Co@TiO2.
Materials 16 01325 g002
Figure 3. (a) XRD patterns of TiO2 and Co@TiO2. The inset in Figure 3a is the corresponding enlarged XRD pattern from the typical peak. (b) XPS spectra of Co@TiO2. XPS spectra of the Co@TiO2 sample: (c) Ti 2p, (d) Co 2p, and (e) O 1s. (f) Magnetic hysteresis loop for TiO2 and Co@TiO2 samples. The inset in Figure 3f shows the M (H) curve.
Materials 16 01325 g003
Figure 4. (a) SEM image of the Co@TiO2 and the corresponding elemental mapping for (b) Ti, (c) Co, (d) O. Elemental distributions in Co@TiO2.
Materials 16 01325 g004
Figure 5. CV curves of the TiO2 (a) and Co@TiO2 (b) electrodes at a scan rate of 0.5 mV s−1. Discharge–charge potential profiles of the TiO2 (c) and Co@TiO2 (d) electrodes for the 1st, 10th, 50th, and 100th cycles over the potential window 0.01–3.0 V at 3 C.
Materials 16 01325 g005
Figure 6. (a) Cycling performance over the potential window 0.01–3.0 V at 3 C. (b) Rate performance at various current rates of TiO2 and Co@TiO2 over the potential window 0.01–3.0 V. (c) Cycling performance of the Co@TiO2 sample over the potential window 0.01–3.0 V at 10 C. (d) EIS of the Co@TiO2 and TiO2 electrodes. (e,f) GITT curves and DLi values of the Co@TiO2 and TiO2 electrodes.
Materials 16 01325 g006
Table 1. The comparison of different doped TiO2 as anode for LIBs.
AnodeCycle PerformanceRfs (Year)
Fe–S-doped anatase TiO2 nanotubes61.4 mAh g−1 at 1680 mA g−1 after 500 cycles[20] (2016)
Fe-doped anatase TiO2/carbon composite
Europium-modified TiO2
Mn-doped TiO2
Cu-doped TiO2
B-doped TiO2
F-doped carbon coated mesoporous TiO2
Co-doped TiO2
158.6 mAh g−1 at 1700 mA g−1 after 300 cycles
219.1 mAh g−1 at 850 mA g−1 after 600 cycles
113 mAh g−1 at 170 mA g−1 after 118 cycles
250 mAh g−1 at 500 mA g−1 after 100 cycles
119.4 mAh g−1 at 1680 mA g−1 after 100 cycles
210 mAh g−1 at 84 mA g−1 after 100 cycles
125 mAh g−1 at 1700 mA g−1 after 600 cycles
[27] (2015)
[28] (2022)
[29] (2020)
[30] (2018)
[31] (2014)
[33] (2014)
In this work
Disclaimer/Publisher’s Note: The statements, opinions and data contained in all publications are solely those of the individual author(s) and contributor(s) and not of MDPI and/or the editor(s). MDPI and/or the editor(s) disclaim responsibility for any injury to people or property resulting from any ideas, methods, instructions or products referred to in the content.

