
Expanded Glass for Thermal and Acoustic Insulation from Recycled Post-Consumer Glass and Textile Industry Process Waste
 , , and
Abstract
:1. Introduction
2. Materials and Methods
2.1. Foam Production
2.2. Samples Dimension, Mass and Density
2.3. Porosity Characterization
2.4. Mechanical Tests
2.5. Sound Absorption Properties
2.6. Thermal Conductivity
3. Results and Discussion
3.1. Characterization of the Raw Materials
3.2. Sample Production
3.3. Sample Properties
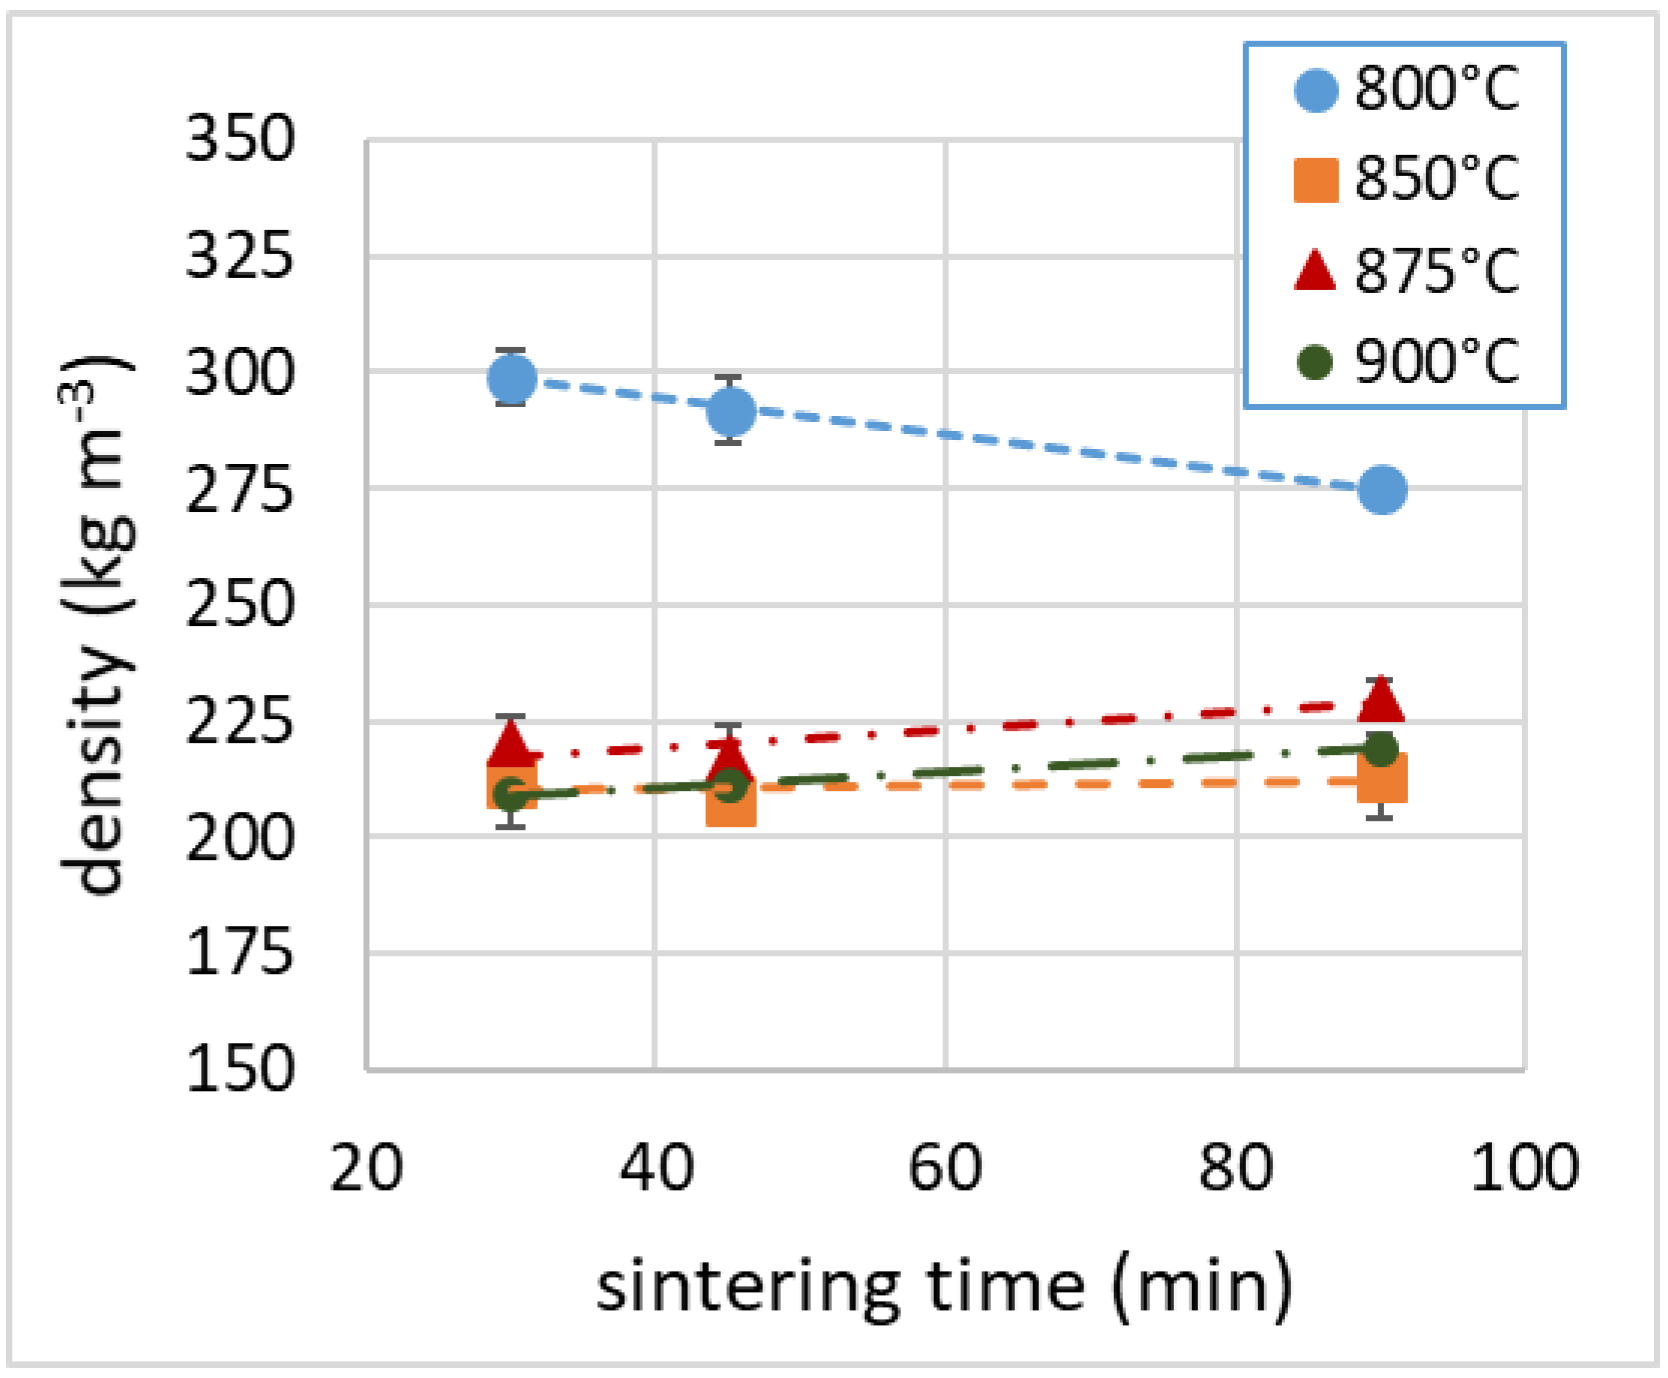
3.4. Density
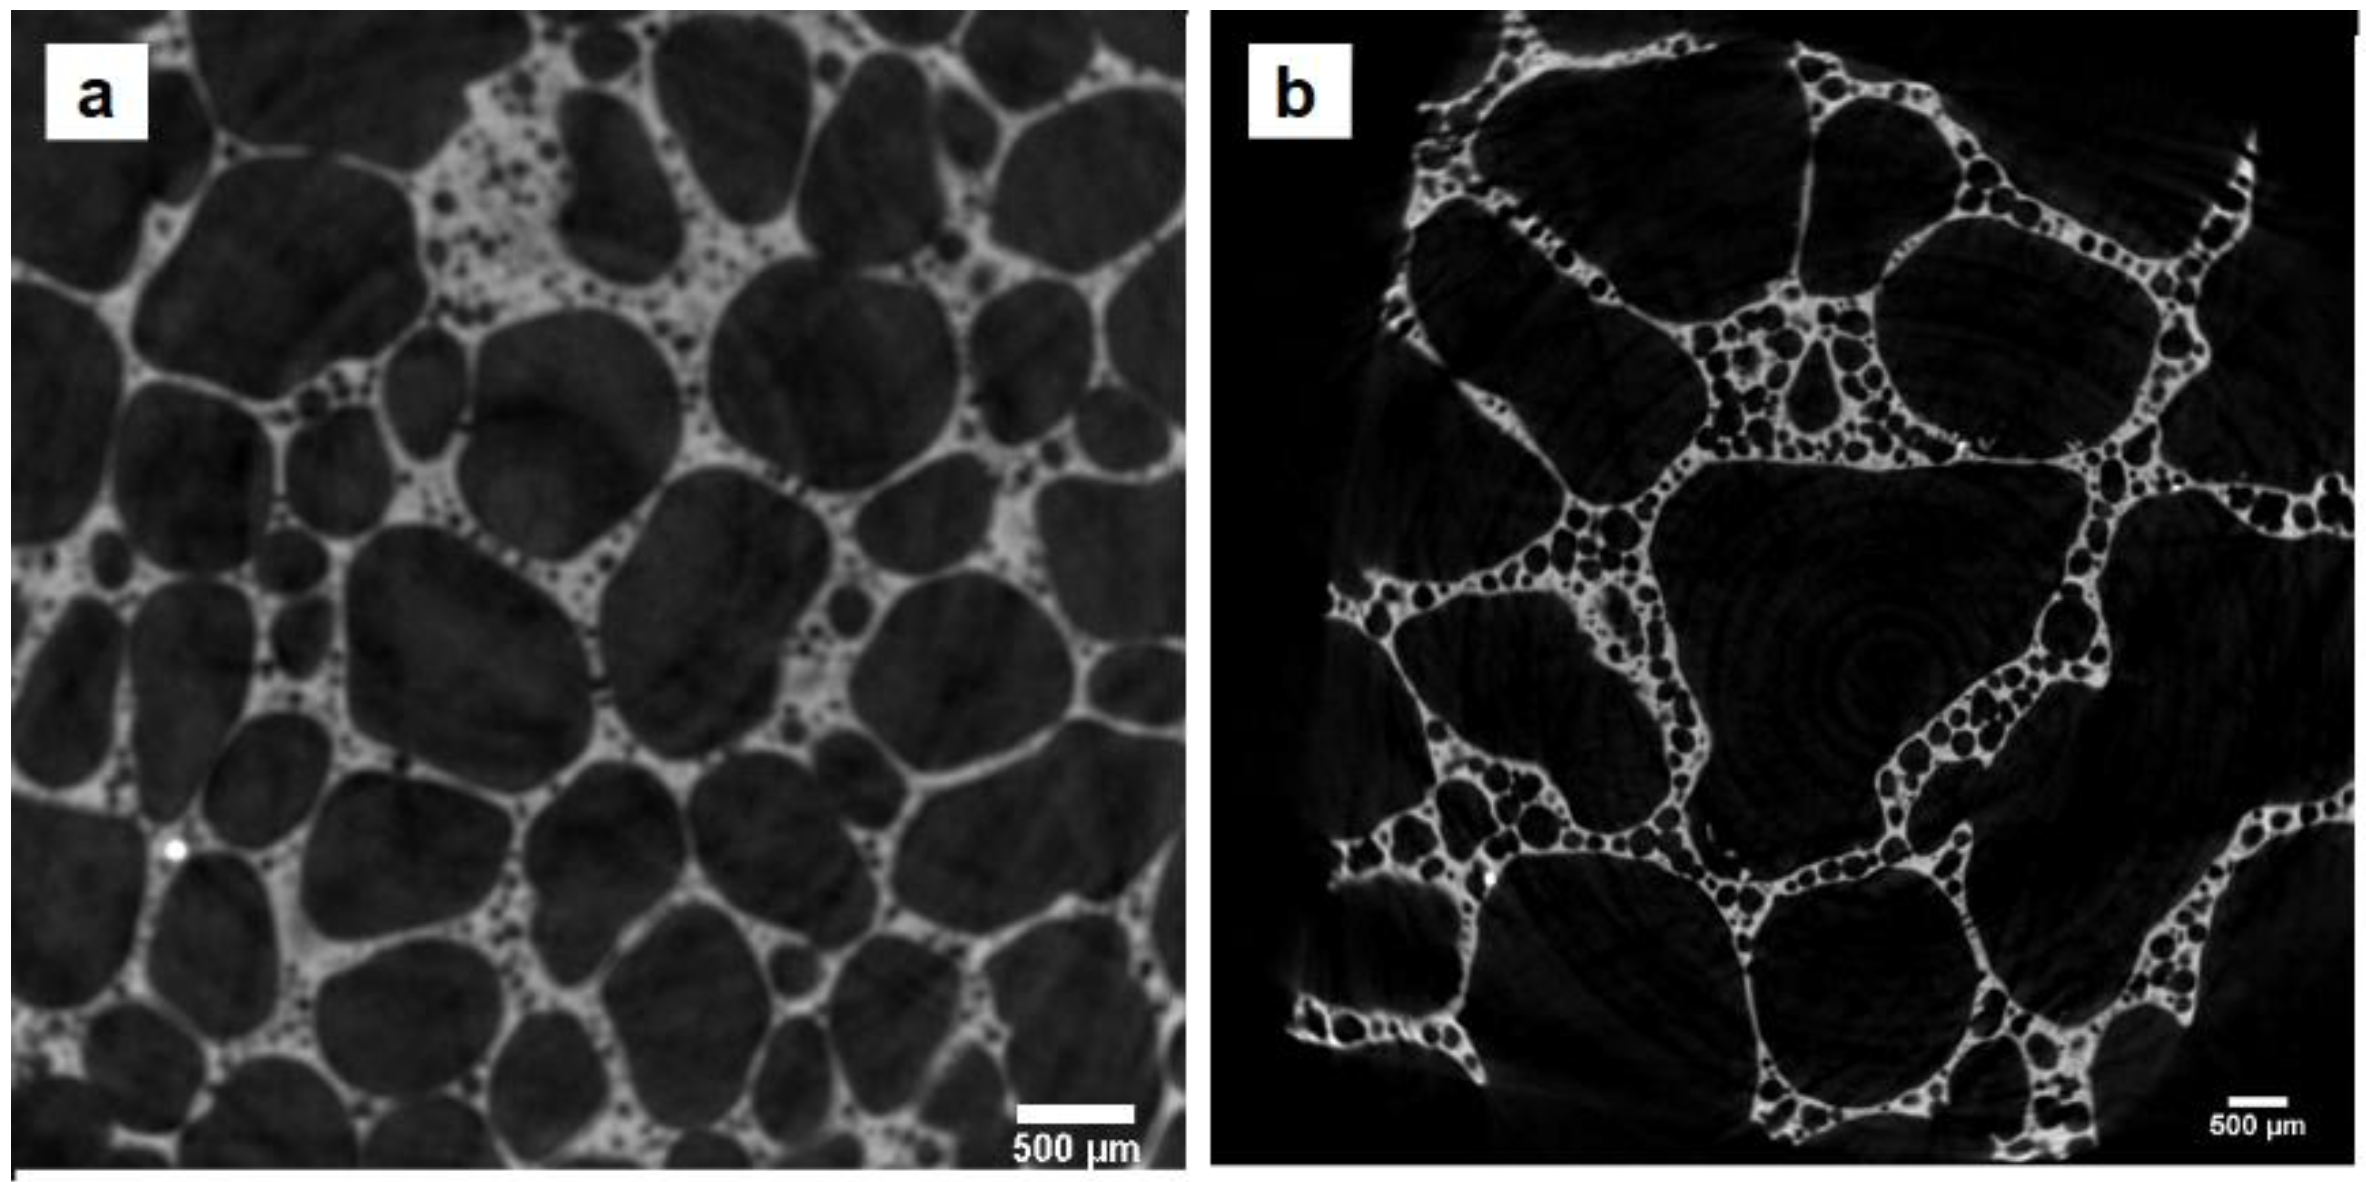
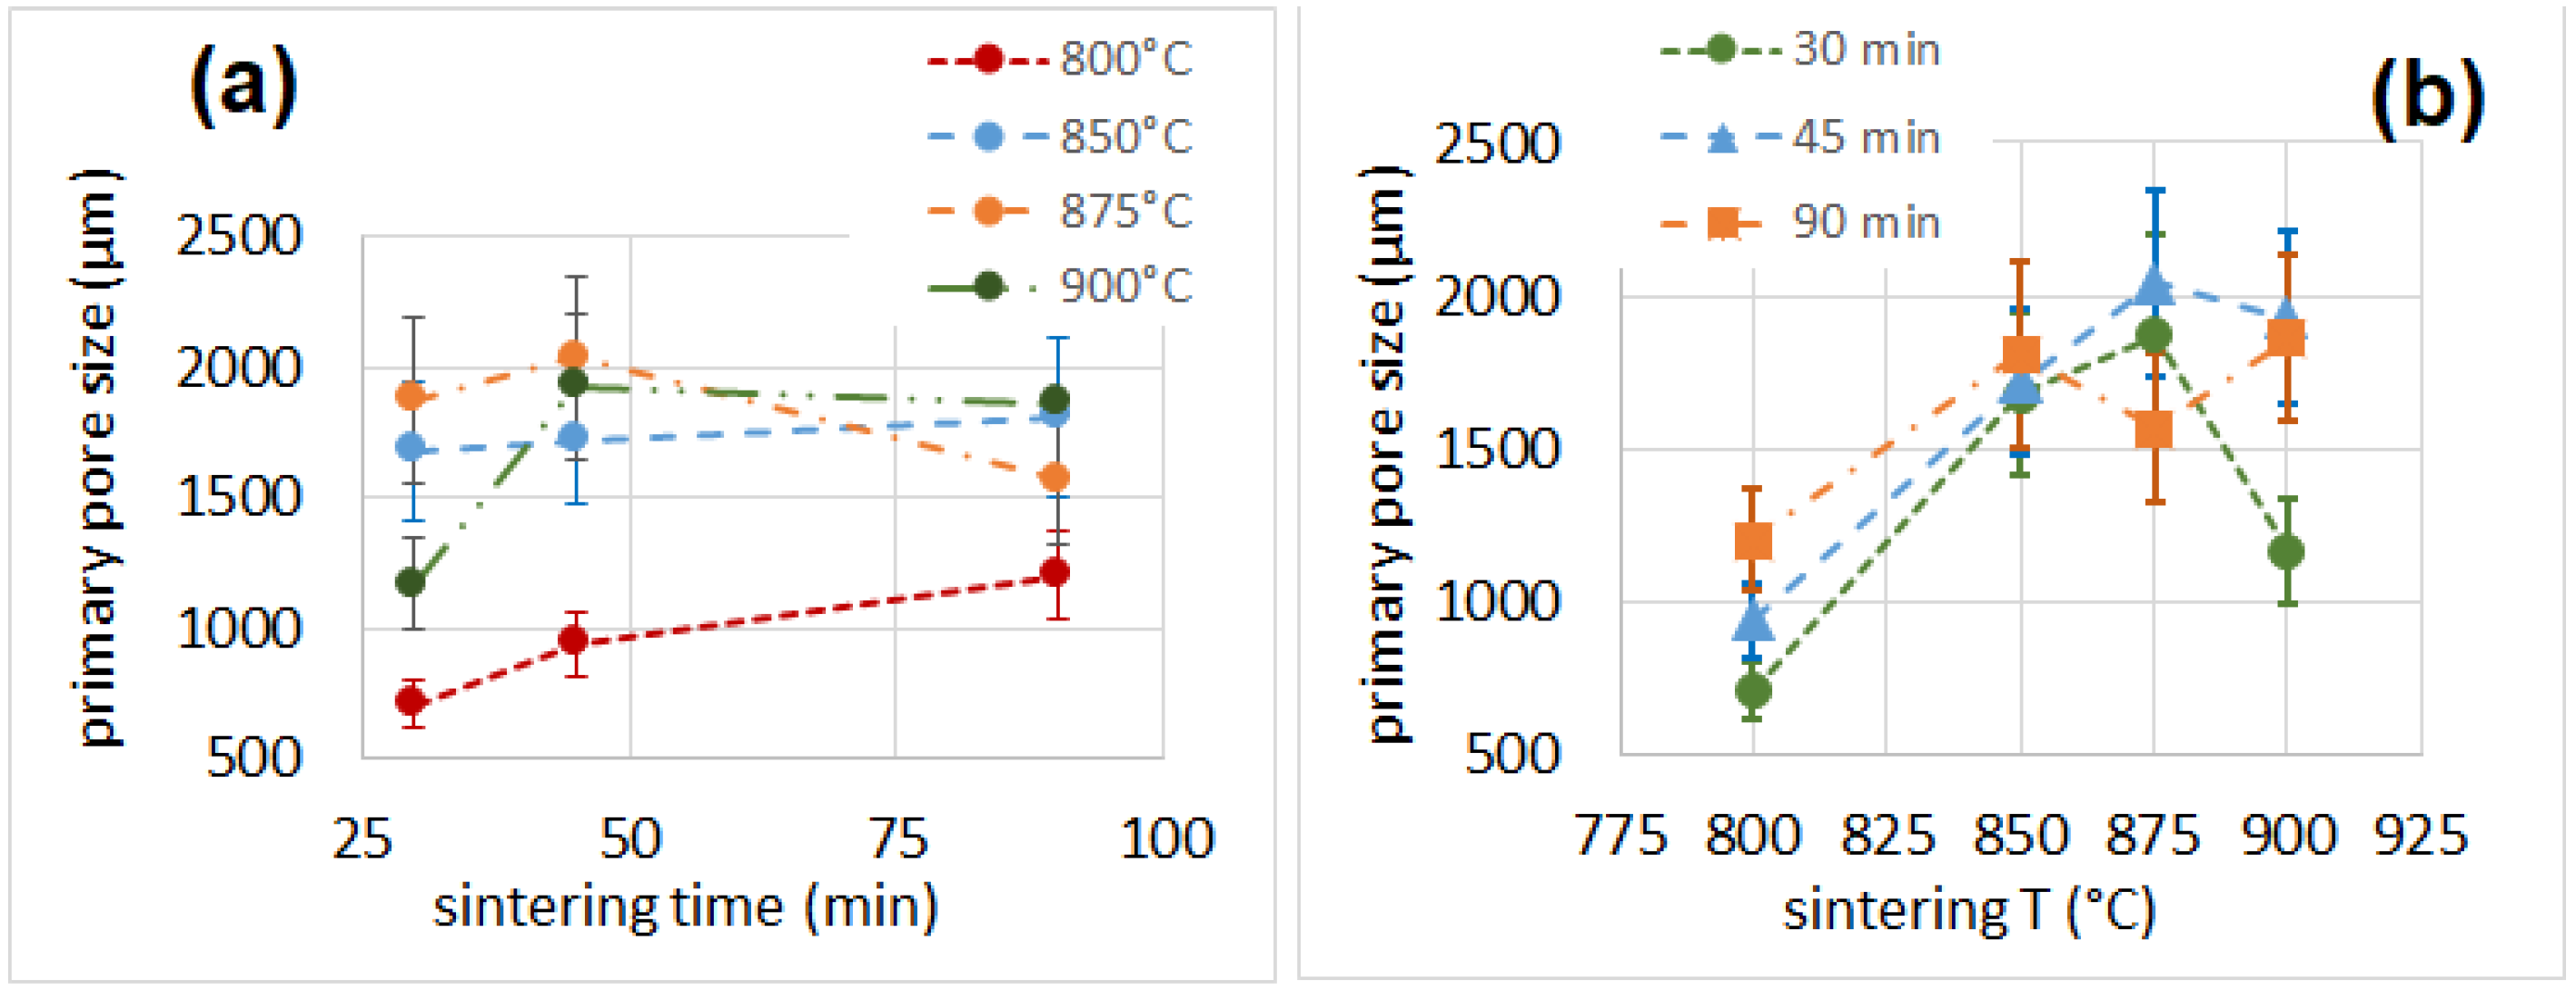
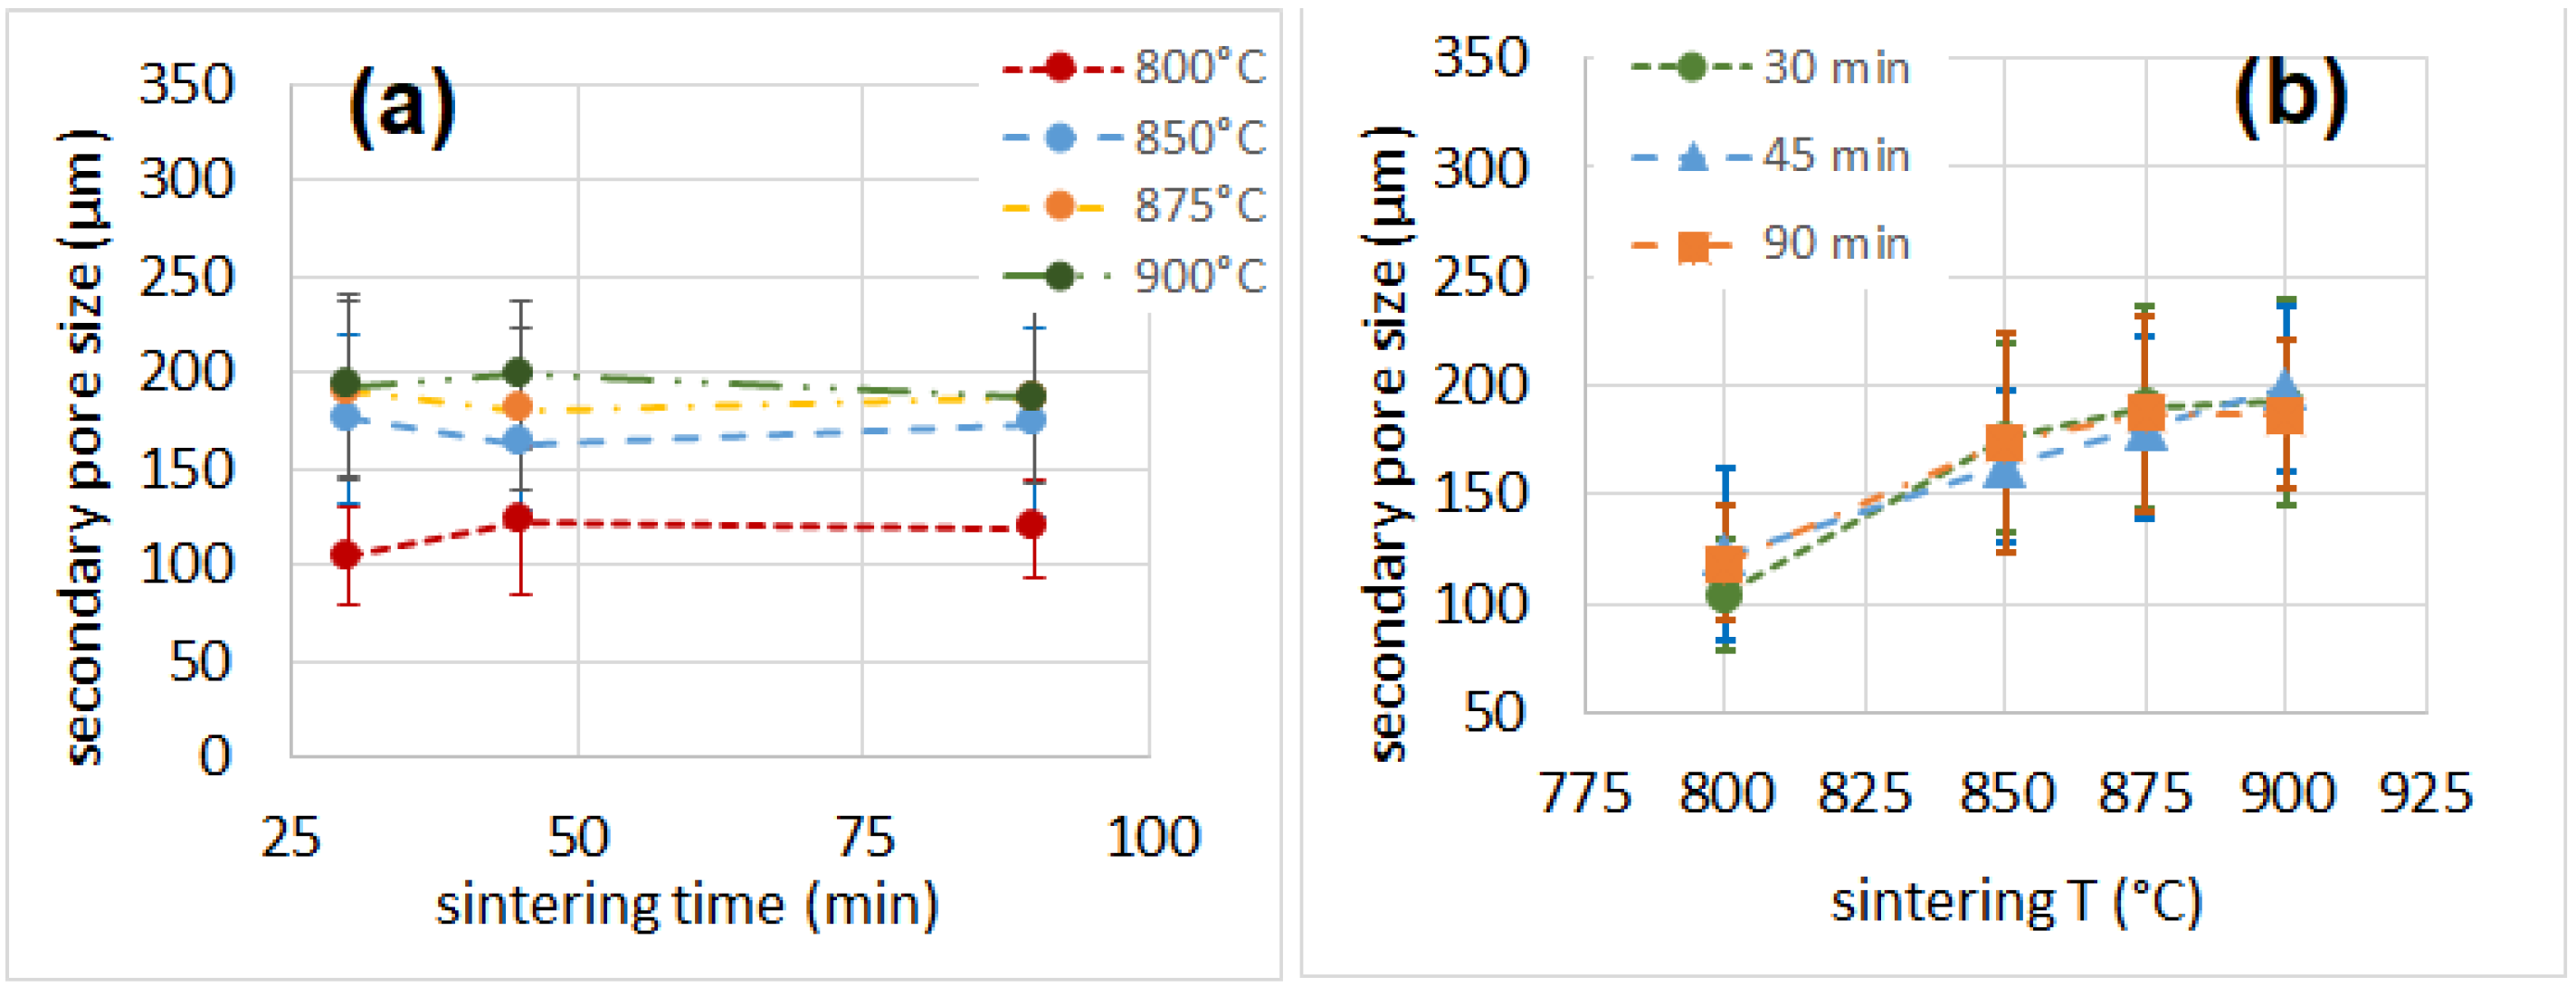
3.5. Porosity
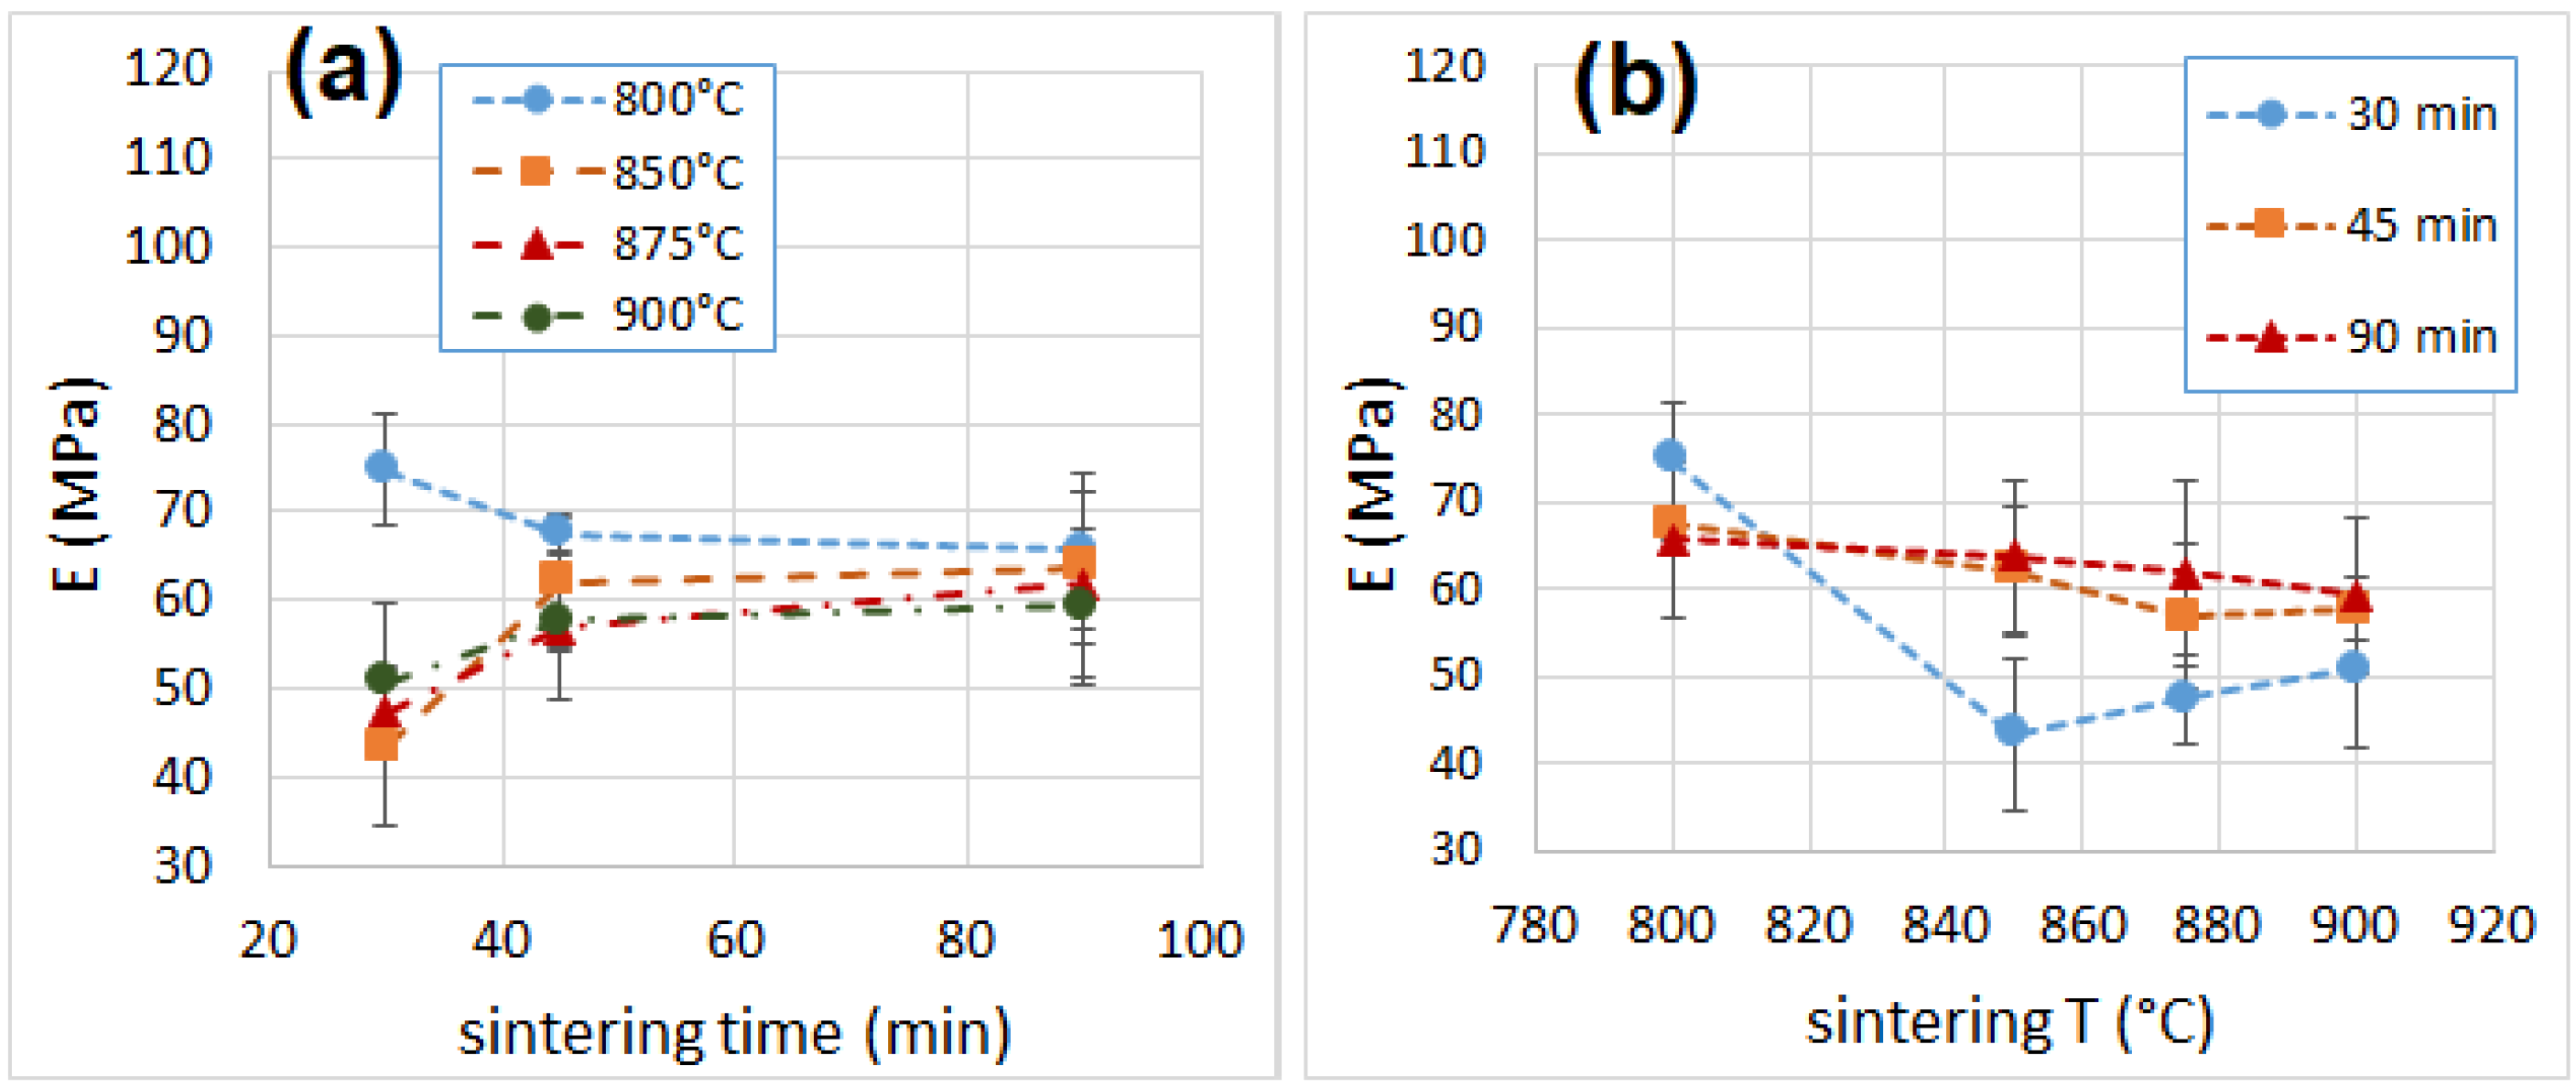
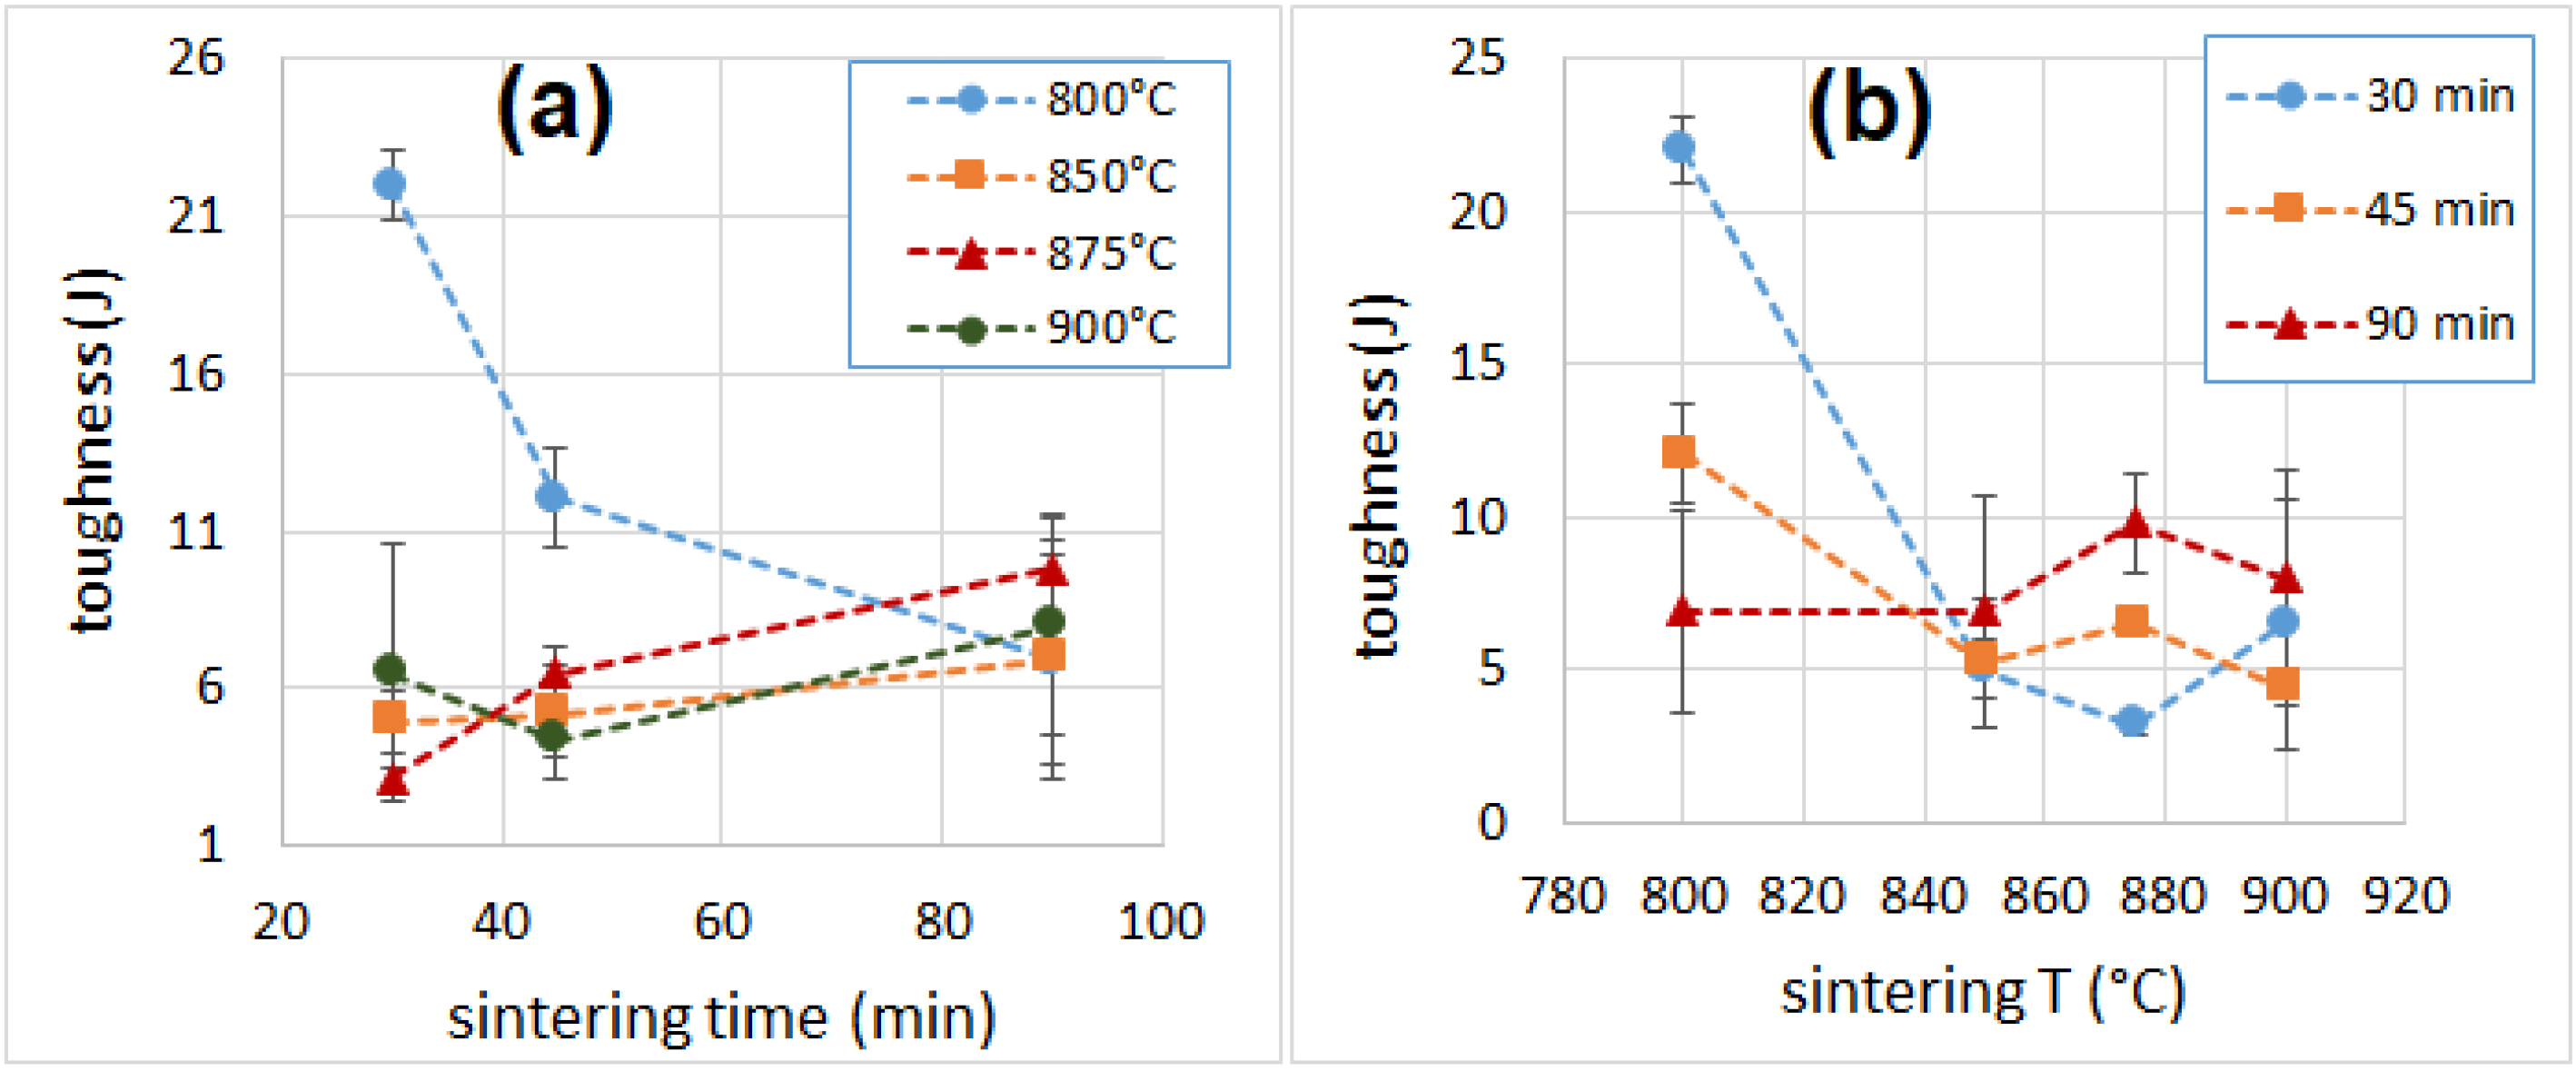
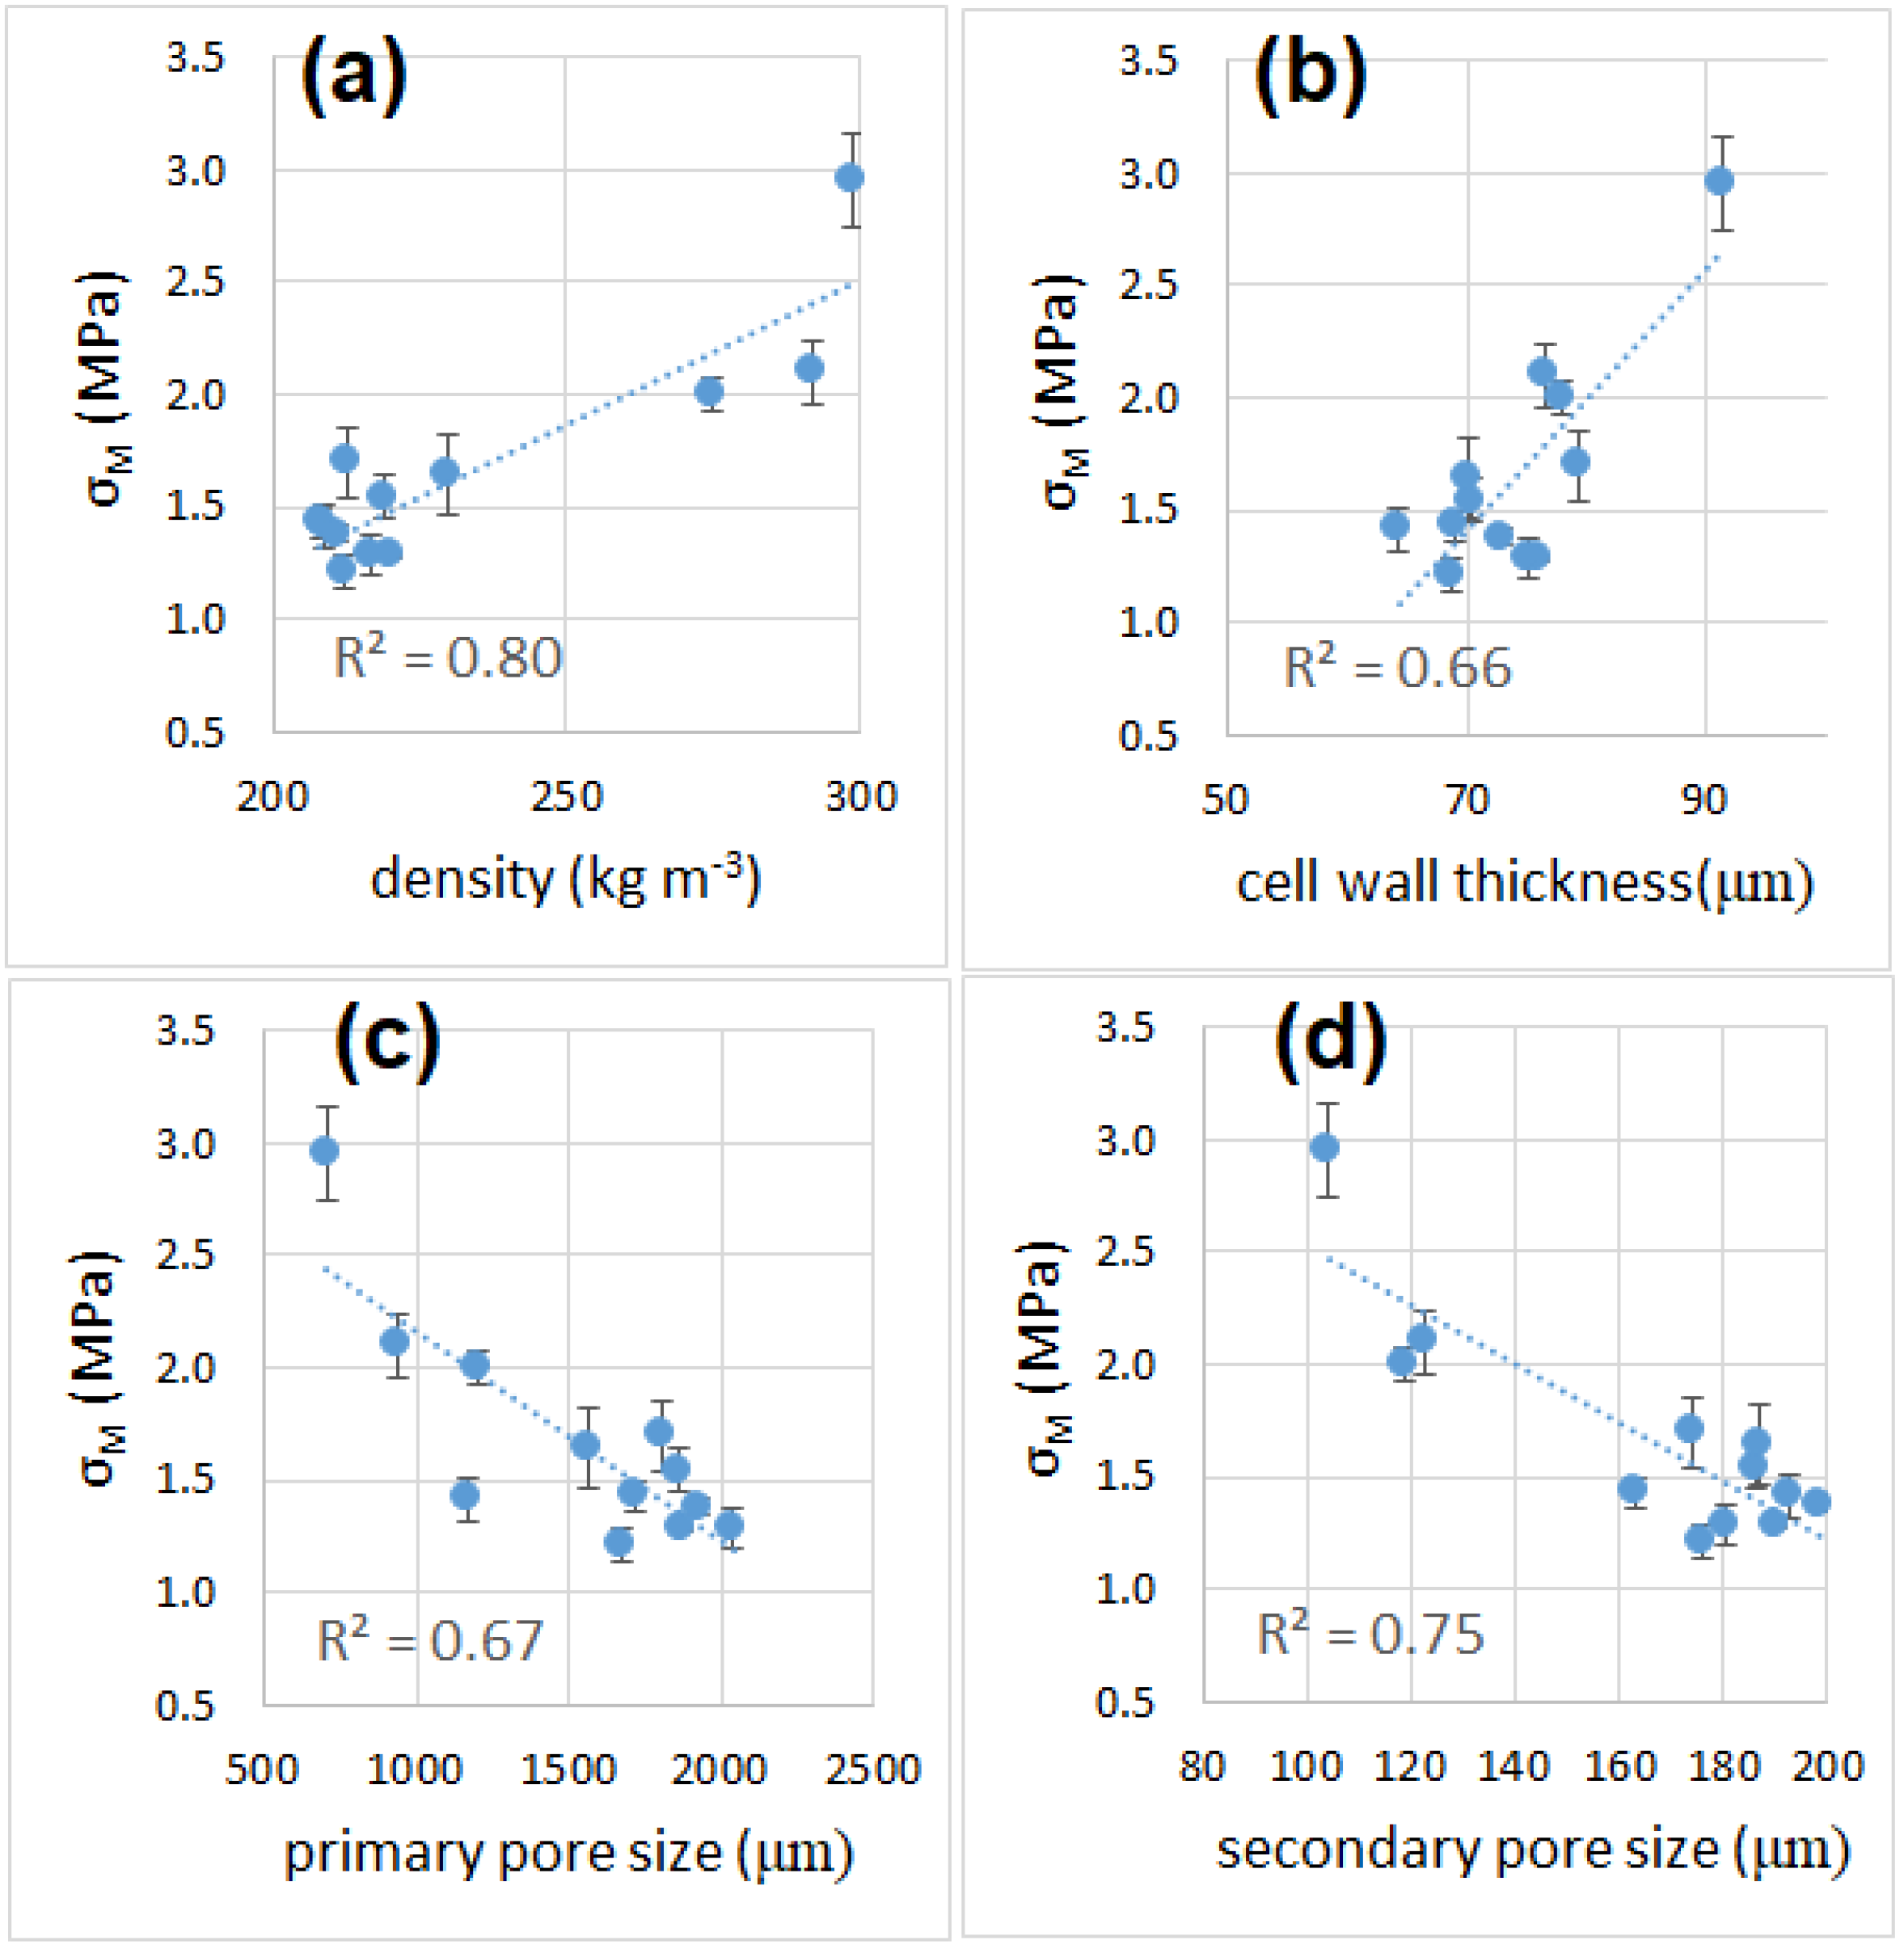
3.6. Mechanical Properties
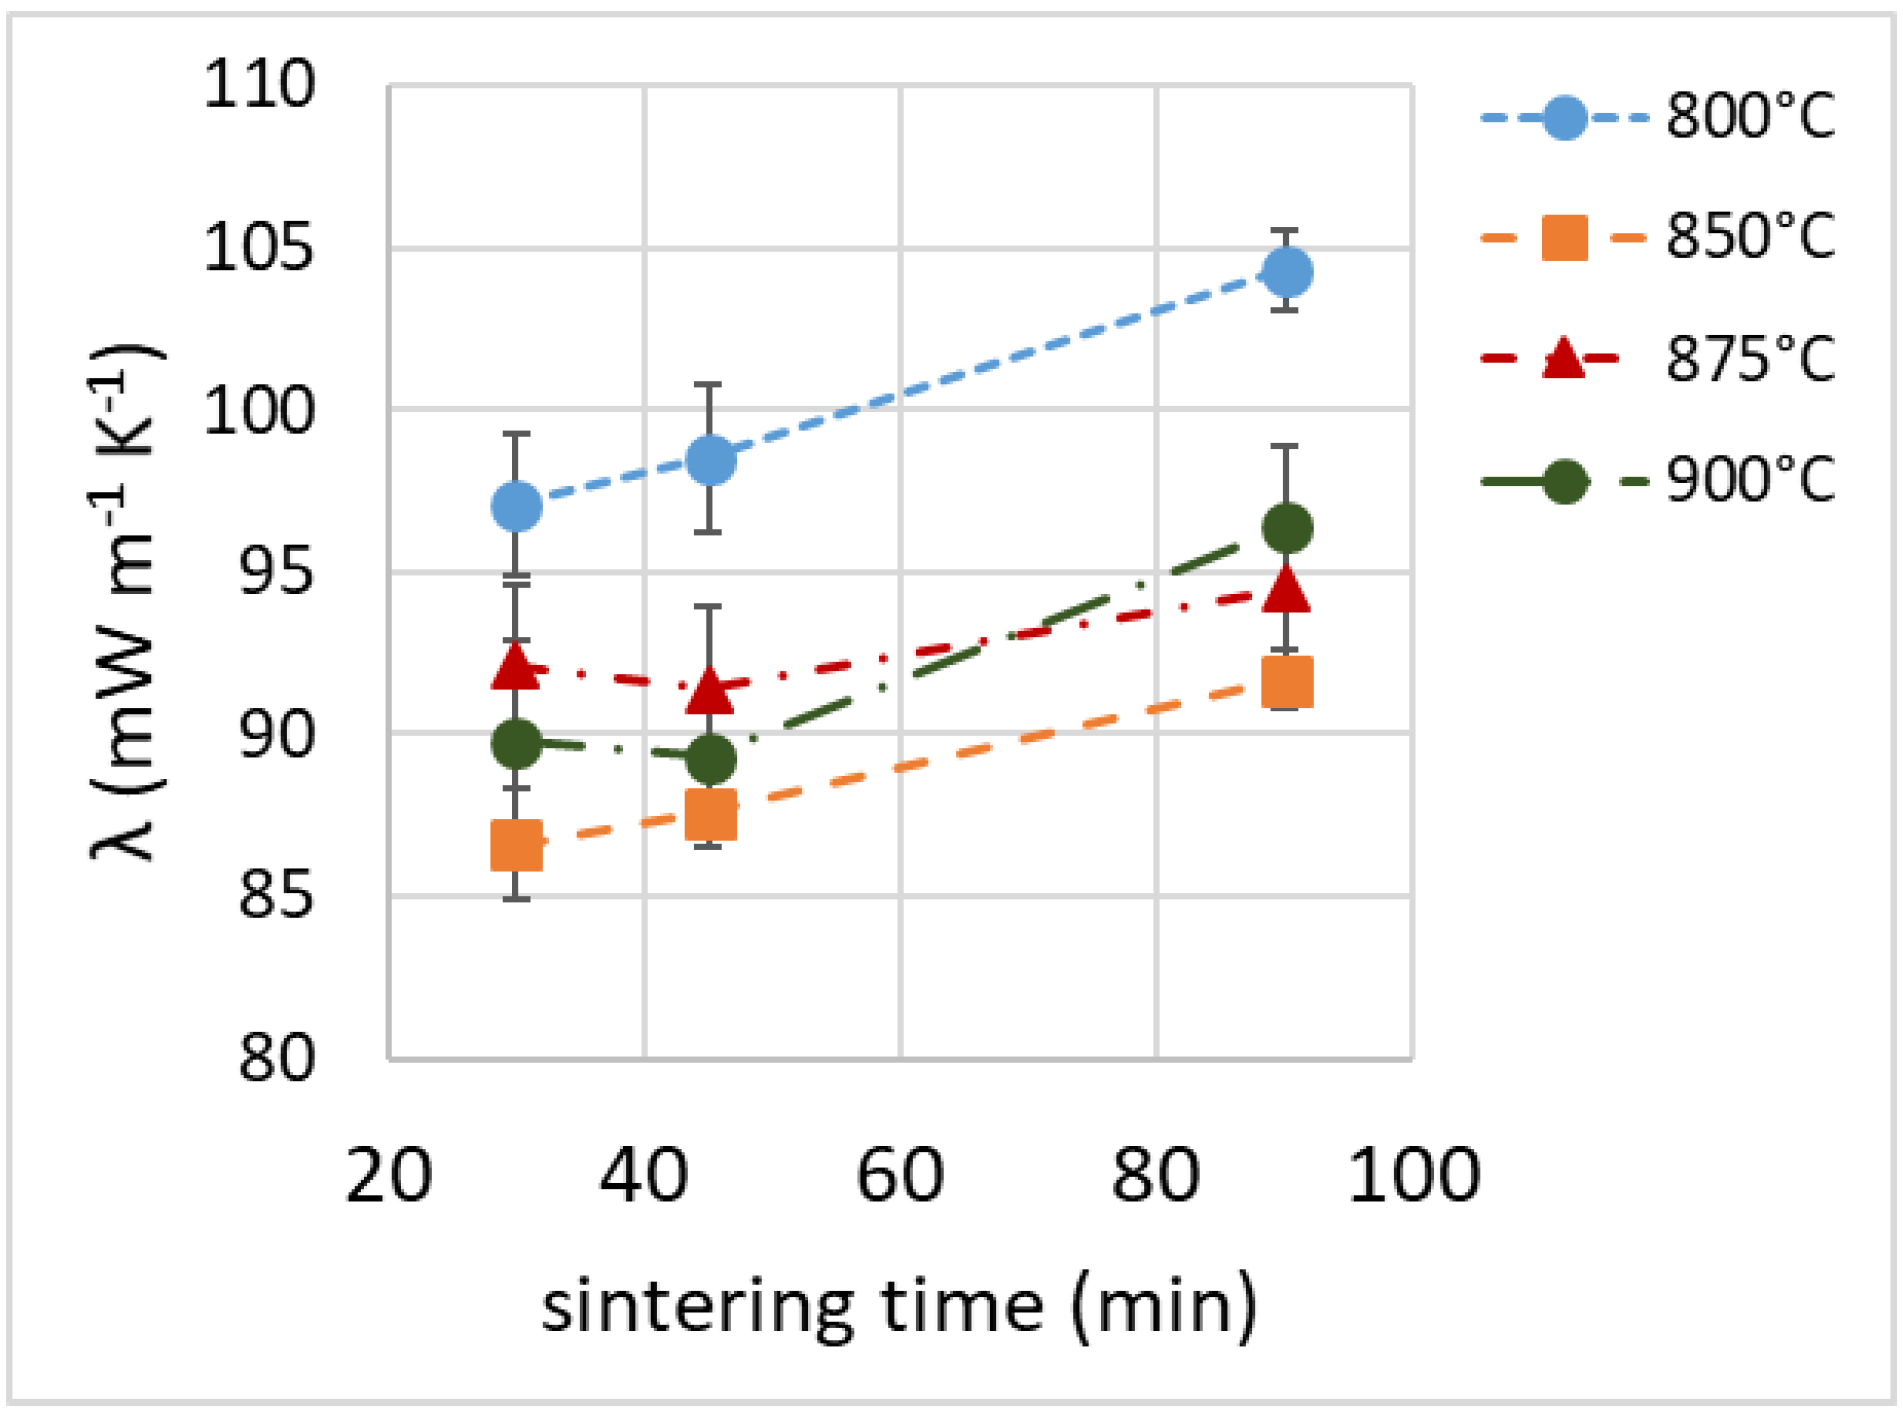
3.7. Thermal Insulation Properties
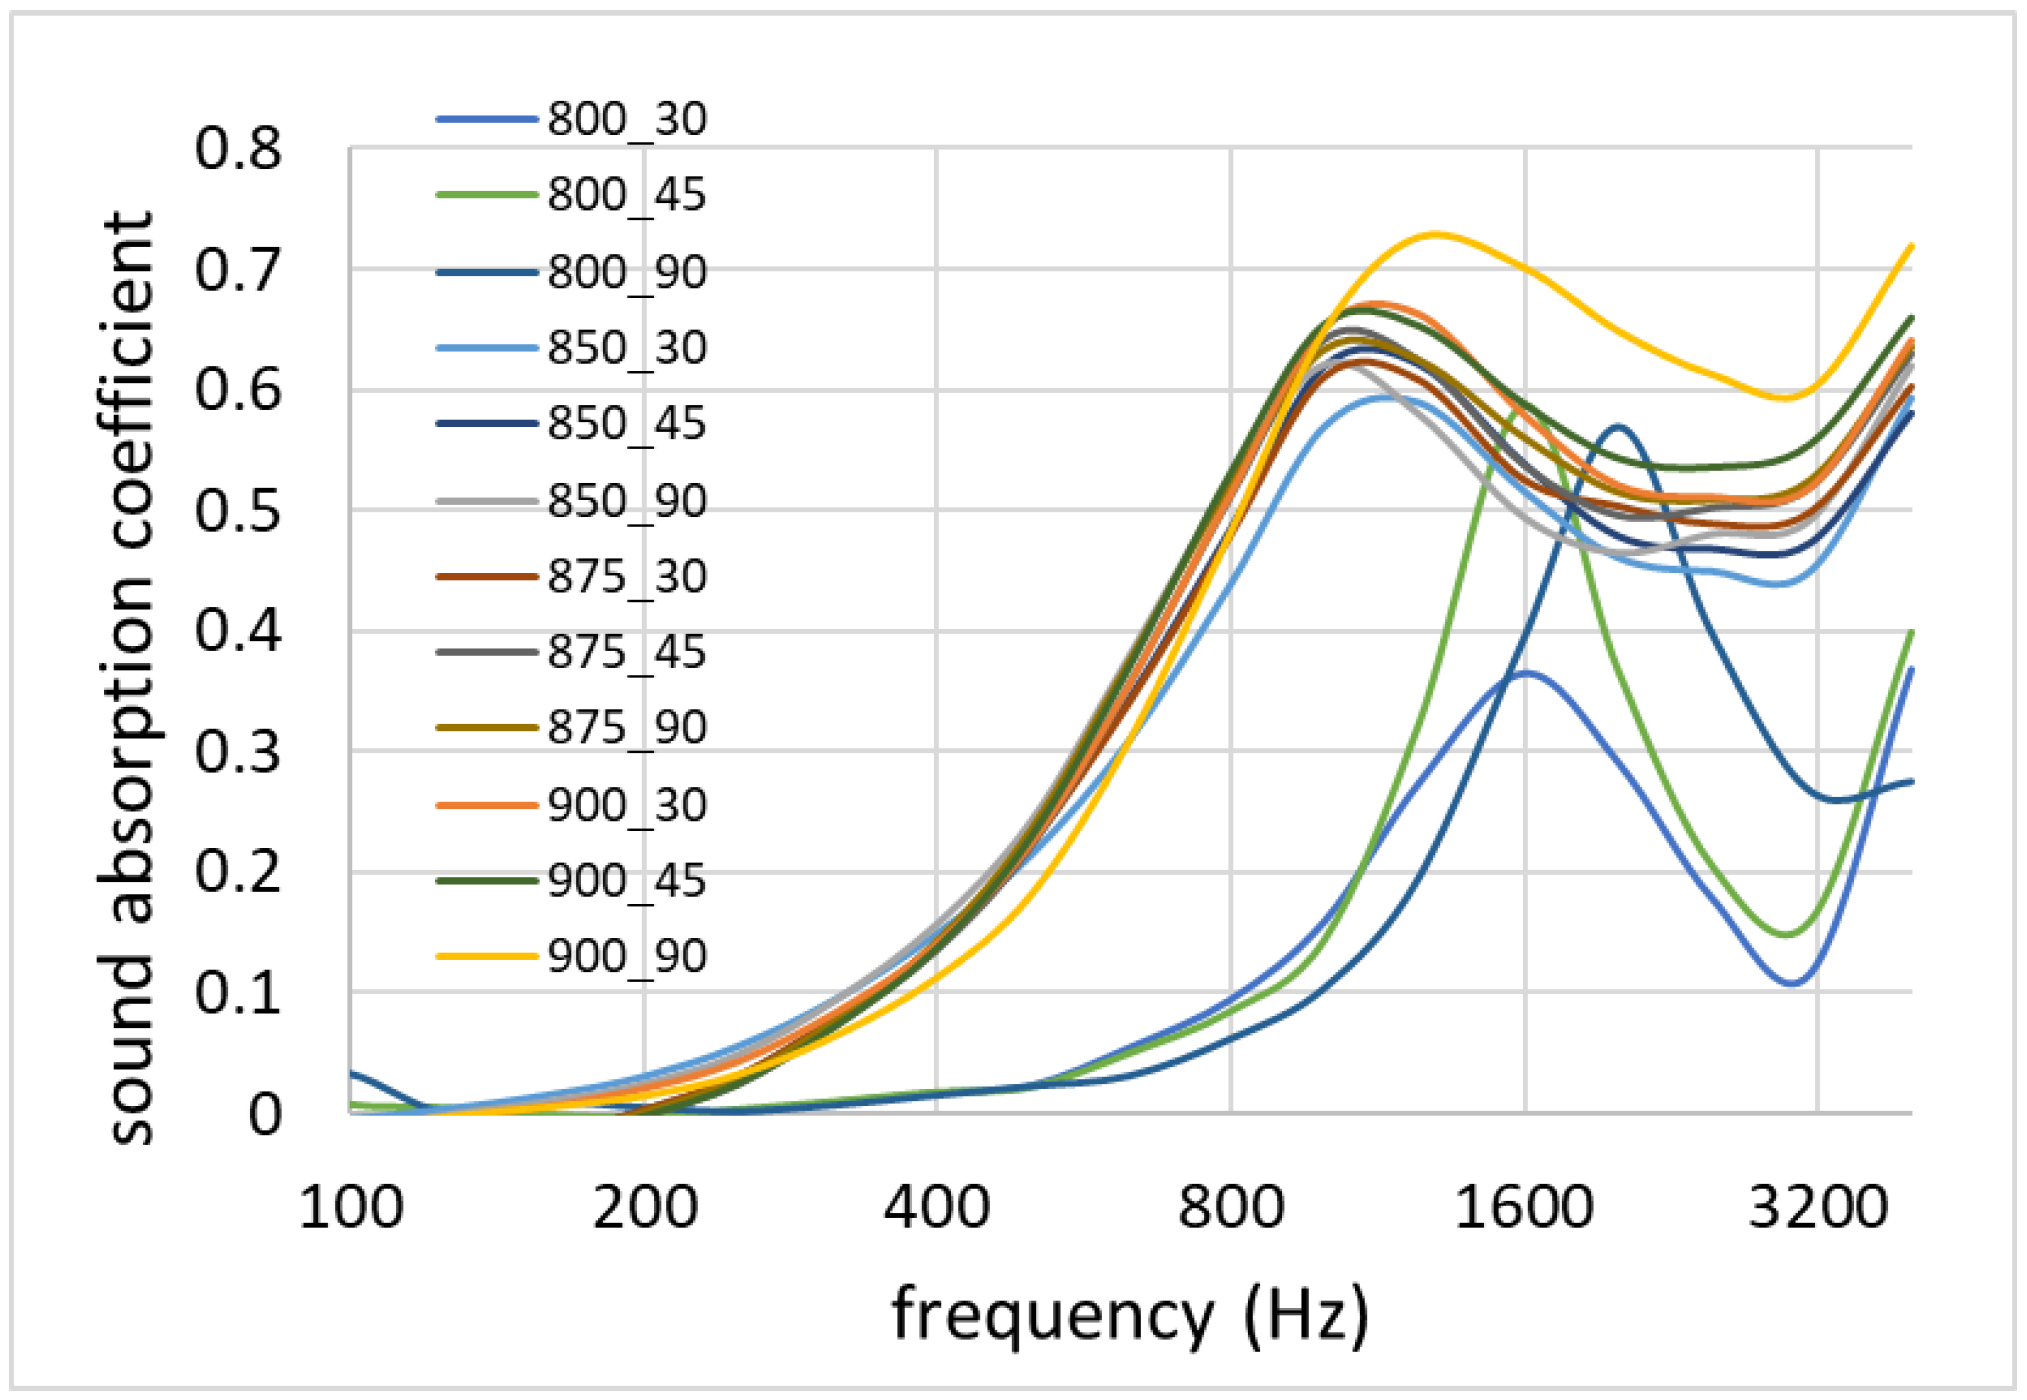
3.8. Acoustic Properties
3.9. Process Parameters
4. Conclusions
Supplementary Materials
Author Contributions
Funding
Institutional Review Board Statement
Informed Consent Statement
Data Availability Statement
Conflicts of Interest
References
- European Commission. Energy Efficiency in Buildings. 2020. Available online: https://ec.europa.eu/info/news/focus-energy-efficiency-buildings-2020-lut-17 (accessed on 1 September 2022).
- US Deptartment of Energy. Building Energy Data Book. 2012. Available online: https://openei.org/doe-opendata/dataset/6aaf0248-bc4e-4a33-9735-2babe4aef2a5/resource/3edf59d2-32be-458b-bd4c-796b3e14bc65/download/2011bedb.pdf (accessed on 1 September 2022).
- UN Environ. Program. Sustainable Buildings and Climate Initiative. 2013. Available online: https://www.unenvironment.org/explore-topics/resource-efficiency/what-we-do/cities/sustainable-buildings (accessed on 1 September 2022).
- Schiavoni, S.; D’Alessandro, F.; Bianchi, F.; Asdrubali, F. Insulation materials for the building sector: A review and comparative analysis. Renew. Sustain. Energy Rev. 2016, 62, 988–1011. [Google Scholar] [CrossRef]
- Cabeza, L.; Castell, A.; Medrano, M.; Martorell, I.; Pérez, G.; Fernández, I. Experimental study on the performance of insulation materials in Mediterranean construction. Energy Build. 2010, 42, 630–636. [Google Scholar] [CrossRef]
- European Commission. Energy Performance of Buildings Directive. 2018. Available online: https://energy.ec.europa.eu/topics/energy-efficiency/energy-efficient-buildings/energy-performance-buildings-directive_en (accessed on 1 September 2022).
- Holman, J.P. Heat Transfer, 7th ed.; McGraw-Hill Education: New York, NY, USA, 2012. [Google Scholar]
- Zeschky, J.; Goetz-Neunhoeffer, F.; Neubauer, J.; Jason Lo, S.H.; Kummer, B.; Scheffler, M.; Greil, P. Preceramic polymer derived cellular ceramics. Compos. Sci. Technol. 2003, 63, 2361–2370. [Google Scholar] [CrossRef]
- Tingley, D.D.; Hathway, A.; Davison, B. An environmental impact comparison of external wall insulation types. Build. Environ. 2015, 85, 182–189. [Google Scholar] [CrossRef]
- Schmidt, A.C. A comparative Life Cycle assessment of building insulation products made of stone wool, paper wool and flax—Part 2. Int. J. Life Cycle Assess. 2004, 9, 122–129. [Google Scholar] [CrossRef]
- Asdrubali, F.; D’Alessandro, F.; Schiavoni, S. A review of unconventional sustainable building insulation materials. Sustain. Mater. Technol. 2015, 4, 1–17. [Google Scholar] [CrossRef]
- Ingrao, C.; Lo Giudice, A.; Tricase, C.; Rana, R.; Mbohwa, C.; Siracusa, V. Recycled-PET fibre based panels for building thermal insulation: Environmental impact and improvement potential assessment for a greener production. Sci. Total Environ. 2014, 493, 914–929. [Google Scholar] [CrossRef]
- Patnaik, A.; Mvubu, M.; Muniyasamy, S.; Botha, A.; Anandjiwala, R.D. Thermal and sound insulation materials from waste wool and recycled polyester fibers and their biodegradation studies. Energy Build. 2015, 92, 161–169. [Google Scholar] [CrossRef]
- Binici, H.; Eken, M.; Dolaz, M.; Aksogan, O.; Kara, M. An environmentally friendly thermal insulation material from sunflower stalk, textile waste and stubble fibres. Constr. Build. Mater. 2014, 51, 24–33. [Google Scholar] [CrossRef]
- Intini, F.; Kühtz, S. Recycling in buildings: An LCA case study of a thermal insulation panel made of polyester fiber, recycled from post-consumer PET bottles. Int. J. Life Cycle Assess. 2011, 16, 306–315. [Google Scholar] [CrossRef]
- Andreola, F.; Barbieri, L.; Lancellotti, I.; Leonelli, C.; Manfredini, T. Recycling of industrial wastes in ceramic manufacturing: State of art and glass case studies. Ceram. Int. 2016, 42, 13333–13338. [Google Scholar] [CrossRef]
- Blengini, G.A.; Busto, M.; Fantoni, M.; Fino, D. Eco-efficient waste glass recycling: Integrated waste management and green product development through LCA. Waste Manag. 2012, 32, 1000–1008. [Google Scholar] [CrossRef]
- Cozzarini, L.; Marsich, L.; Ferluga, A.; Schmid, C. Life cycle analysis of a novel thermal insulator obtained from recycled glass waste. Dev. Built Environ. 2020, 3, 100014. [Google Scholar] [CrossRef]
- Bernardo, E.; Cedro, R.; Florean, M.; Hreglich, S. Reutilization and stabilization of wastes by the production of glass foams. Ceram. Int. 2007, 33, 963–968. [Google Scholar] [CrossRef]
- Fernandes, H.R.; Ferreira, D.D.; Andreola, F.; Lancellotti, I.; Barbieri, L.; Ferreira, J.M.F. Environmental friendly management of CRT glass by foaming with waste egg shells, calcite or dolomite. Ceram. Int. 2014, 40, 13371–13379. [Google Scholar] [CrossRef]
- McLellan, G.W.; Shand, E.B. Glass Engineering Handbook, 3rd ed.; McGraw-Hill: New York, NY, USA, 1984. [Google Scholar]
- Butler, J.H.; Hooper, P. Glass Waste. In Waste—A Handbook for Management; Letcher, T.M., Vallero, D.A., Eds.; Academic Press: Boston, MA, USA, 2011; pp. 151–165. [Google Scholar] [CrossRef]
- Mugoni, C.; Montorsi, M.; Siligardi, C.; Andreola, F.; Lancellotti, I.; Bernardo, E.; Barbieri, L. Design of glass foams with low environmental impact. Ceram. Int. 2015, 41, 3400–3408. [Google Scholar] [CrossRef]
- König, J.; Petersen, R.R.; Yue, Y. Fabrication of highly insulating foam glass made from CRT panel glass. Ceram. Int. 2015, 41, 9793–9800. [Google Scholar] [CrossRef]
- Spiridonov, Y.A.; Orlova, L.A. Problems of Foam Glass Production. Glass Ceram. 2003, 60, 313–314. [Google Scholar] [CrossRef]
- Dias, G.; Arcaro, S.; Cesconeto, F.; Maia, B.; Raupp-Pereira, F.; De Oliveira, A.P.N. Production and characterization of glass foams for thermal insulation. Chem. Eng. Trans. 2015, 43, 1777–1782. [Google Scholar] [CrossRef]
- König, J.; Petersen, R.R.; Yue, Y.; Suvorov, D. Gas-releasing reactions in foam-glass formation using carbon and MnxOy as the foaming agents. Ceram. Int. 2017, 43, 4638–4646. [Google Scholar] [CrossRef]
- Bayer, G. Foaming of borosilicate glasses by chemical reactions in the temperature range 950–1150°C. J. Non Cryst. Solids. 1980, 38–39, 855–860. [Google Scholar] [CrossRef]
- König, J.; Petersen, R.R.; Yue, Y. Influence of the glass–calcium carbonate mixture’s characteristics on the foaming process and the properties of the foam glass. J. Eur. Ceram. Soc. 2014, 34, 1591–1598. [Google Scholar] [CrossRef]
- König, J.; Petersen, R.R.; Yue, Y. Influence of the glass particle size on the foaming process and physical characteristics of foam glasses. J. Non Cryst. Solids. 2016, 447, 190–197. [Google Scholar] [CrossRef]
- König, J.; Petersen, R.R.; Iversen, N.; Yue, Y. Suppressing the effect of cullet composition on the formation and properties of foamed glass. Ceram. Int. 2018, 44, 11143–11150. [Google Scholar] [CrossRef]
- Fernandes, H.R.; Andreola, F.; Barbieri, L.; Lancellotti, I.; Pascual, M.J.; Ferreira, J.M.F. The use of egg shells to produce Cathode Ray Tube (CRT) glass foams. Ceram. Int. 2013, 39, 9071–9078. [Google Scholar] [CrossRef]
- Teixeira, L.B.; Fernandes, V.K.; Maia, B.G.O.; Arcaro, S.; de Oliveira, A.P.N. Vitrocrystalline foams produced from glass and oyster shell wastes. Ceram. Int. 2017, 43, 6730–6737. [Google Scholar] [CrossRef]
- Dos Santos, P.A.M.; Priebbnow, A.V.; Arcaro, S.; da Silva, R.M.; Lopez, D.A.R.; Rodriguez, A.D.A.L. Sustainable Glass Foams Produced from Glass Bottles and Tobacco Residue. Mater. Res. 2018, 22. [Google Scholar] [CrossRef]
- Arcaro, S.; de Oliveira Maia, B.G.; Souza, M.T.; Cesconeto, F.R.; Granados, L.; de Oliveira, A.P.N. Thermal Insulating Foams Produced From Glass Waste and Banana Leaves. Mater. Res. 2016, 19, 1064–1069. [Google Scholar] [CrossRef] [Green Version]
- Vancea, C.; Lazău, I. Glass foam from window panes and bottle glass wastes. Open Chem. 2014, 12, 804–811. [Google Scholar] [CrossRef]
- Bernardo, E.; Scarinci, G.; Bertuzzi, P.; Ercole, P.; Ramon, L. Recycling of waste glasses into partially crystallized glass foams. J. Porous Mater. 2010, 17, 359–365. [Google Scholar] [CrossRef]
- Tulyaganov, D.U.; Fernandes, H.R.; Agathopoulos, S.; Ferreira, J.M.F. Preparation and characterization of high compressive strength foams from sheet glass. J. Porous Mater. 2006, 13, 133–139. [Google Scholar] [CrossRef]
- Guo, H.W.; Gong, Y.X.; Gao, S.Y. Preparation of high strength foam glass–ceramics from waste cathode ray tube. Mater. Lett. 2010, 64, 997–999. [Google Scholar] [CrossRef]
- Llaudis, A.S.; Tari, M.J.O.; Ten, F.J.G.; Bernardo, E.; Colombo, P. Foaming of flat glass cullet using Si3N4 and MnO2 powders. Ceram. Int. 2009, 35, 1953–1959. [Google Scholar] [CrossRef]
- Mio, A.; Bertagna, S.; Cozzarini, L.; Laurini, E.; Bucci, V.; Marinò, A.; Fermeglia, M. Multiscale modelling techniques in life cycle assessment: Application to nanostructured polymer systems in the maritime industry. Sustain. Mater. Technol. 2021, 29, e00327. [Google Scholar] [CrossRef]
- ASTM International. ASTM C165-07—Standard Test Method for Measuring Compressive Properties of Thermal Insulations. 2007. Available online: https://www.astm.org/c0165-07r17.html (accessed on 1 September 2022).
- International Organization for Standardization. Acoustics—Determination of Sound Absorption Coefficient and Impedance in Impedance Tubes—Part 2. 1998. Available online: https://www.iso.org/cms/render/live/en/sites/isoorg/contents/data/standard/02/28/22851.html (accessed on 1 September 2022).
- ASTM International. ASTM C518—Standard Test Method for Steady-State Thermal Transmission Properties by Means of the Heat Flow Meter Apparatus. 2021. Available online: https://www.astm.org/c0518-21.html (accessed on 1 September 2022).
- National Institute of Standards and Technology. NIST Chemistry WebBook—Terephthalic Acid, Disodium Salt. 2021. Available online: https://webbook.nist.gov/cgi/inchi?ID=B6002190&Mask=80#IR-Spec (accessed on 1 September 2022).
- Petersen, R.R.; König, J.; Yue, Y. The mechanism of foaming and thermal conductivity of glasses foamed with MnO2. J. Non Cryst. Solids 2015, 425, 74–82. [Google Scholar] [CrossRef]
- Stobbe, E.R.; de Boer, B.A.; Geus, J.W. The reduction and oxidation behaviour of manganese oxides. Catal. Today 1999, 47, 161–167. [Google Scholar] [CrossRef]
- Seward, T.P.; Vascott, T., III. High Temperature Glass Melt Property Database for Process Modeling; Wiley: Hoboken, NJ, USA, 2005. [Google Scholar]
- König, J.; Lopez-Gil, A.; Cimavilla-Roman, P.; Rodriguez-Perez, M.A.; Petersen, R.R.; Østergaard, M.B.; Iversen, N.; Yue, Y.; Spreitzer, M. Synthesis and properties of open- and closed-porous foamed glass with a low density. Constr. Build. Mater. 2020, 247, 118574. [Google Scholar] [CrossRef]
- Petersen, R.R.; König, J.; Yue, Y. The viscosity window of the silicate glass foam production. J. Non Cryst. Solids. 2017, 456, 49–54. [Google Scholar] [CrossRef]
- Abu-Jdayil, B.; Mourad, A.-H.; Hittini, W.; Hassan, M.; Hameedi, S. Traditional, state-of-the-art and renewable thermal building insulation materials: An overview. Constr. Build. Mater. 2019, 214, 709–735. [Google Scholar] [CrossRef]
- Villasmil, W.; Fischer, L.J.; Worlitschek, J. A review and evaluation of thermal insulation materials and methods for thermal energy storage systems. Renew. Sustain. Energy Rev. 2019, 103, 71–84. [Google Scholar] [CrossRef]
- ASTM International. ASTM C578-18—Standard, Specification for Rigid, Cellular Polystyrene Thermal Insulation. 2018. Available online: https://www.astm.org/c0578-18.html (accessed on 1 September 2022).
- ASTM C1029-20—Standard Specification for Spray-Applied Rigid Cellular Polyurethane Thermal Insulation. 2020. Available online: https://www.astm.org/c1029-20.html (accessed on 1 September 2022).
- Buska, A.; Mačiulaitis, R. The compressive strength properties of mineral wool slabs: Influence of structure anisotropy and methodical factors. J. Civ. Eng. Manag. 2007, 13, 97–106. [Google Scholar] [CrossRef]
- Gibson, L.J.; Ashby, M.F. Cellular Solids: Structure and Properties, 2nd ed.; Cambridge University Press: Cambridge, UK, 1997. [Google Scholar] [CrossRef]
- Gibson, L.J.; Ashby, M.F. The mechanics of three-dimensional cellular materials. Proc. R. Soc. Lond. Math. Phys. Sci. 1982, 382, 43–59. [Google Scholar] [CrossRef]
- Méar, F.; Yot, P.; Viennois, R.; Ribes, M. Mechanical behaviour and thermal and electrical properties of foam glass. Ceram. Int. 2007, 33, 543–550. [Google Scholar] [CrossRef]
- Papadopoulos, A.M.; Giama, E. Environmental performance evaluation of thermal insulation materials and its impact on the building. Build. Environ. 2007, 42, 2178–2187. [Google Scholar] [CrossRef]


| Sample | Density (kg m−3) | λ (mW m−1 K−1) | NRC | E (MPa) | σM (MPa) | Toughness (J) |
|---|---|---|---|---|---|---|
| 800_30 | 299 ± 6 | 97.1 ± 2.2 | 0.15 | 74.8 ± 6.4 | 2.95 ± 0.21 | 22.0 ± 1.1 |
| 850_30 | 212 ± 3 | 86.6 ± 1.7 | 0.35 | 43.3 ± 8.7 | 1.21 ± 0.08 | 5.0 ± 1.0 |
| 875_30 | 220 ± 6 | 92.1 ± 2.5 | 0.35 | 47.3 ± 5.2 | 1.28 ± 0.01 | 3.2 ± 0.3 |
| 900_30 | 209 ± 7 | 89.8 ± 3.1 | 0.35 | 50.7 ± 8.8 | 1.42 ± 0.10 | 6.5 ± 4.1 |
| 800_45 | 292 ± 7 | 98.5 ± 2.3 | 0.15 | 67.5 ± 2.1 | 2.10 ± 0.14 | 12.1 ± 1.6 |
| 850_45 | 208 ± 4 | 87.6 ± 1.1 | 0.35 | 62.0 ± 7.4 | 1.43 ± 0.07 | 5.2 ± 2.0 |
| 875_45 | 217 ± 7 | 91.4 ± 2.5 | 0.35 | 56.8 ± 8.2 | 1.29 ± 0.09 | 6.5 ± 0.3 |
| 900_45 | 211 ± 4 | 89.3 ± 0.4 | 0.35 | 57.7 ± 3.5 | 1.38 ± 0.04 | 4.4 ± 0.6 |
| 800_90 | 275 ± 2 | 104.3 ± 1.2 | 0.15 | 65.6 ± 8.9 | 2.00 ± 0.08 | 6.9 ± 3.3 |
| 850_90 | 213 ± 9 | 91.7 ± 0.9 | 0.35 | 63.7 ± 8.8 | 1.70 ± 0.16 | 7.0 ± 3.8 |
| 875_90 | 230 ± 4 | 94.5 ± 2.2 | 0.35 | 81.8 ± 10.7 | 1.64 ± 0.18 | 9.8 ± 1.6 |
| 900_90 | 219 ± 1 | 96.4 ± 2.5 | 0.40 | 59.3 ± 9.0 | 1.55 ± 0.09 | 8.0 ± 3.5 |
| Sample | Cell Wall Thickness (µm) | Primary Pore Size (µm) | Secondary Pore Size (µm) | Porosity % |
|---|---|---|---|---|
| 800_30 | 91 ± 14 | 707 ± 95 | 104 ± 26 | 81.1 |
| 850_30 | 69 ± 10 | 1677 ± 268 | 176 ± 44 | 88.4 |
| 875_30 | 76 ± 11 | 1873 ± 322 | 190 ± 46 | 88.6 |
| 900_30 | 64 ± 9 | 1169 ± 322 | 193 ± 47 | 86.8 |
| 800_45 | 77 ± 11 | 941 ± 124 | 123 ± 39 | 83.7 |
| 850_45 | 69 ± 10 | 1716 ± 239 | 163 ± 35 | 88.8 |
| 875_45 | 75 ± 11 | 2040 ± 308 | 181 ± 42 | 89.2 |
| 900_45 | 73 ± 11 | 1925 ± 283 | 200 ± 38 | 89.9 |
| 800_90 | 79 ± 11 | 1202 ± 165 | 119 ± 26 | 85.3 |
| 850_90 | 79 ± 18 | 1808 ± 302 | 174 ± 50 | 87.5 |
| 875_90 | 70 ± 10 | 1569 ± 249 | 187 ± 44 | 87.7 |
| 900_90 | 71 ± 10 | 1860 ± 269 | 187 ± 34 | 89.5 |
| Sample | Density (kg m−3) | E (MPa) | E*1 (φ = 1) (MPa) | E*5 (φ = 5) (MPa) | Φ* |
|---|---|---|---|---|---|
| 800_30 | 299 | 74.8 | 285 | 107 | >5 |
| 850_30 | 212 | 43.3 | 121 | 32 | 3.8 |
| 875_30 | 220 | 47.3 | 131 | 38 | 3.8 |
| 900_30 | 209 | 50.7 | 118 | 34 | 2.8 |
| 800_45 | 292 | 67.5 | 262 | 96 | >5 |
| 850_45 | 208 | 62.0 | 116 | 33 | 2.2 |
| 875_45 | 217 | 56.8 | 127 | 37 | 2.7 |
| 900_45 | 211 | 57.7 | 120 | 34 | 2.4 |
| 800_90 | 275 | 65.6 | 225 | 70 | >5 |
| 850_90 | 213 | 63.7 | 122 | 35 | 2.2 |
| 875_90 | 230 | 61.8 | 143 | 43 | 2.9 |
| 900_90 | 219 | 59.3 | 129 | 38 | 2.6 |
Disclaimer/Publisher’s Note: The statements, opinions and data contained in all publications are solely those of the individual author(s) and contributor(s) and not of MDPI and/or the editor(s). MDPI and/or the editor(s) disclaim responsibility for any injury to people or property resulting from any ideas, methods, instructions or products referred to in the content. |
© 2023 by the authors. Licensee MDPI, Basel, Switzerland. This article is an open access article distributed under the terms and conditions of the Creative Commons Attribution (CC BY) license (https://creativecommons.org/licenses/by/4.0/).
Share and Cite
Cozzarini, L.; De Lorenzi, L.; Barago, N.; Sbaizero, O.; Bevilacqua, P. Expanded Glass for Thermal and Acoustic Insulation from Recycled Post-Consumer Glass and Textile Industry Process Waste. Materials 2023, 16, 1721. https://doi.org/10.3390/ma16041721
Cozzarini L, De Lorenzi L, Barago N, Sbaizero O, Bevilacqua P. Expanded Glass for Thermal and Acoustic Insulation from Recycled Post-Consumer Glass and Textile Industry Process Waste. Materials. 2023; 16(4):1721. https://doi.org/10.3390/ma16041721
Chicago/Turabian StyleCozzarini, Luca, Lorenzo De Lorenzi, Nicolò Barago, Orfeo Sbaizero, and Paolo Bevilacqua. 2023. "Expanded Glass for Thermal and Acoustic Insulation from Recycled Post-Consumer Glass and Textile Industry Process Waste" Materials 16, no. 4: 1721. https://doi.org/10.3390/ma16041721