
The Beneficial Impact of Mineral Content in Spent-Coffee-Ground-Derived Hard Carbon on Sodium-Ion Storage
 , , and
Abstract
:1. Introduction
2. Materials and Methods
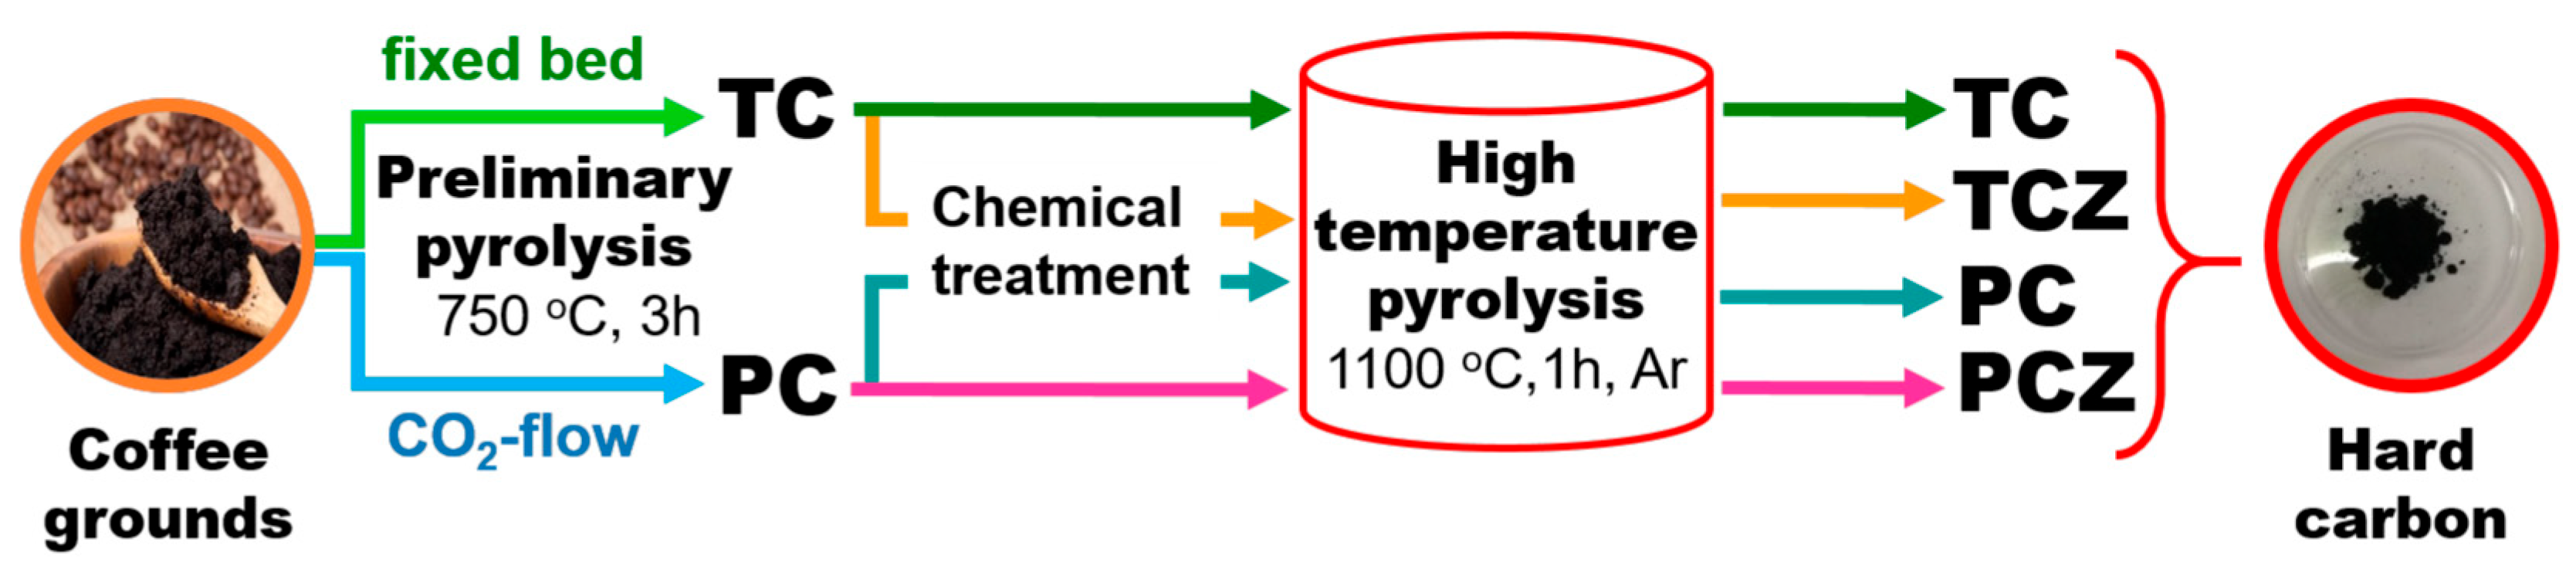
2.1. Synthesis Procedure
2.2. Characterization Methods
2.3. Electrode Preparation and Electrochemical Characterization
3. Results
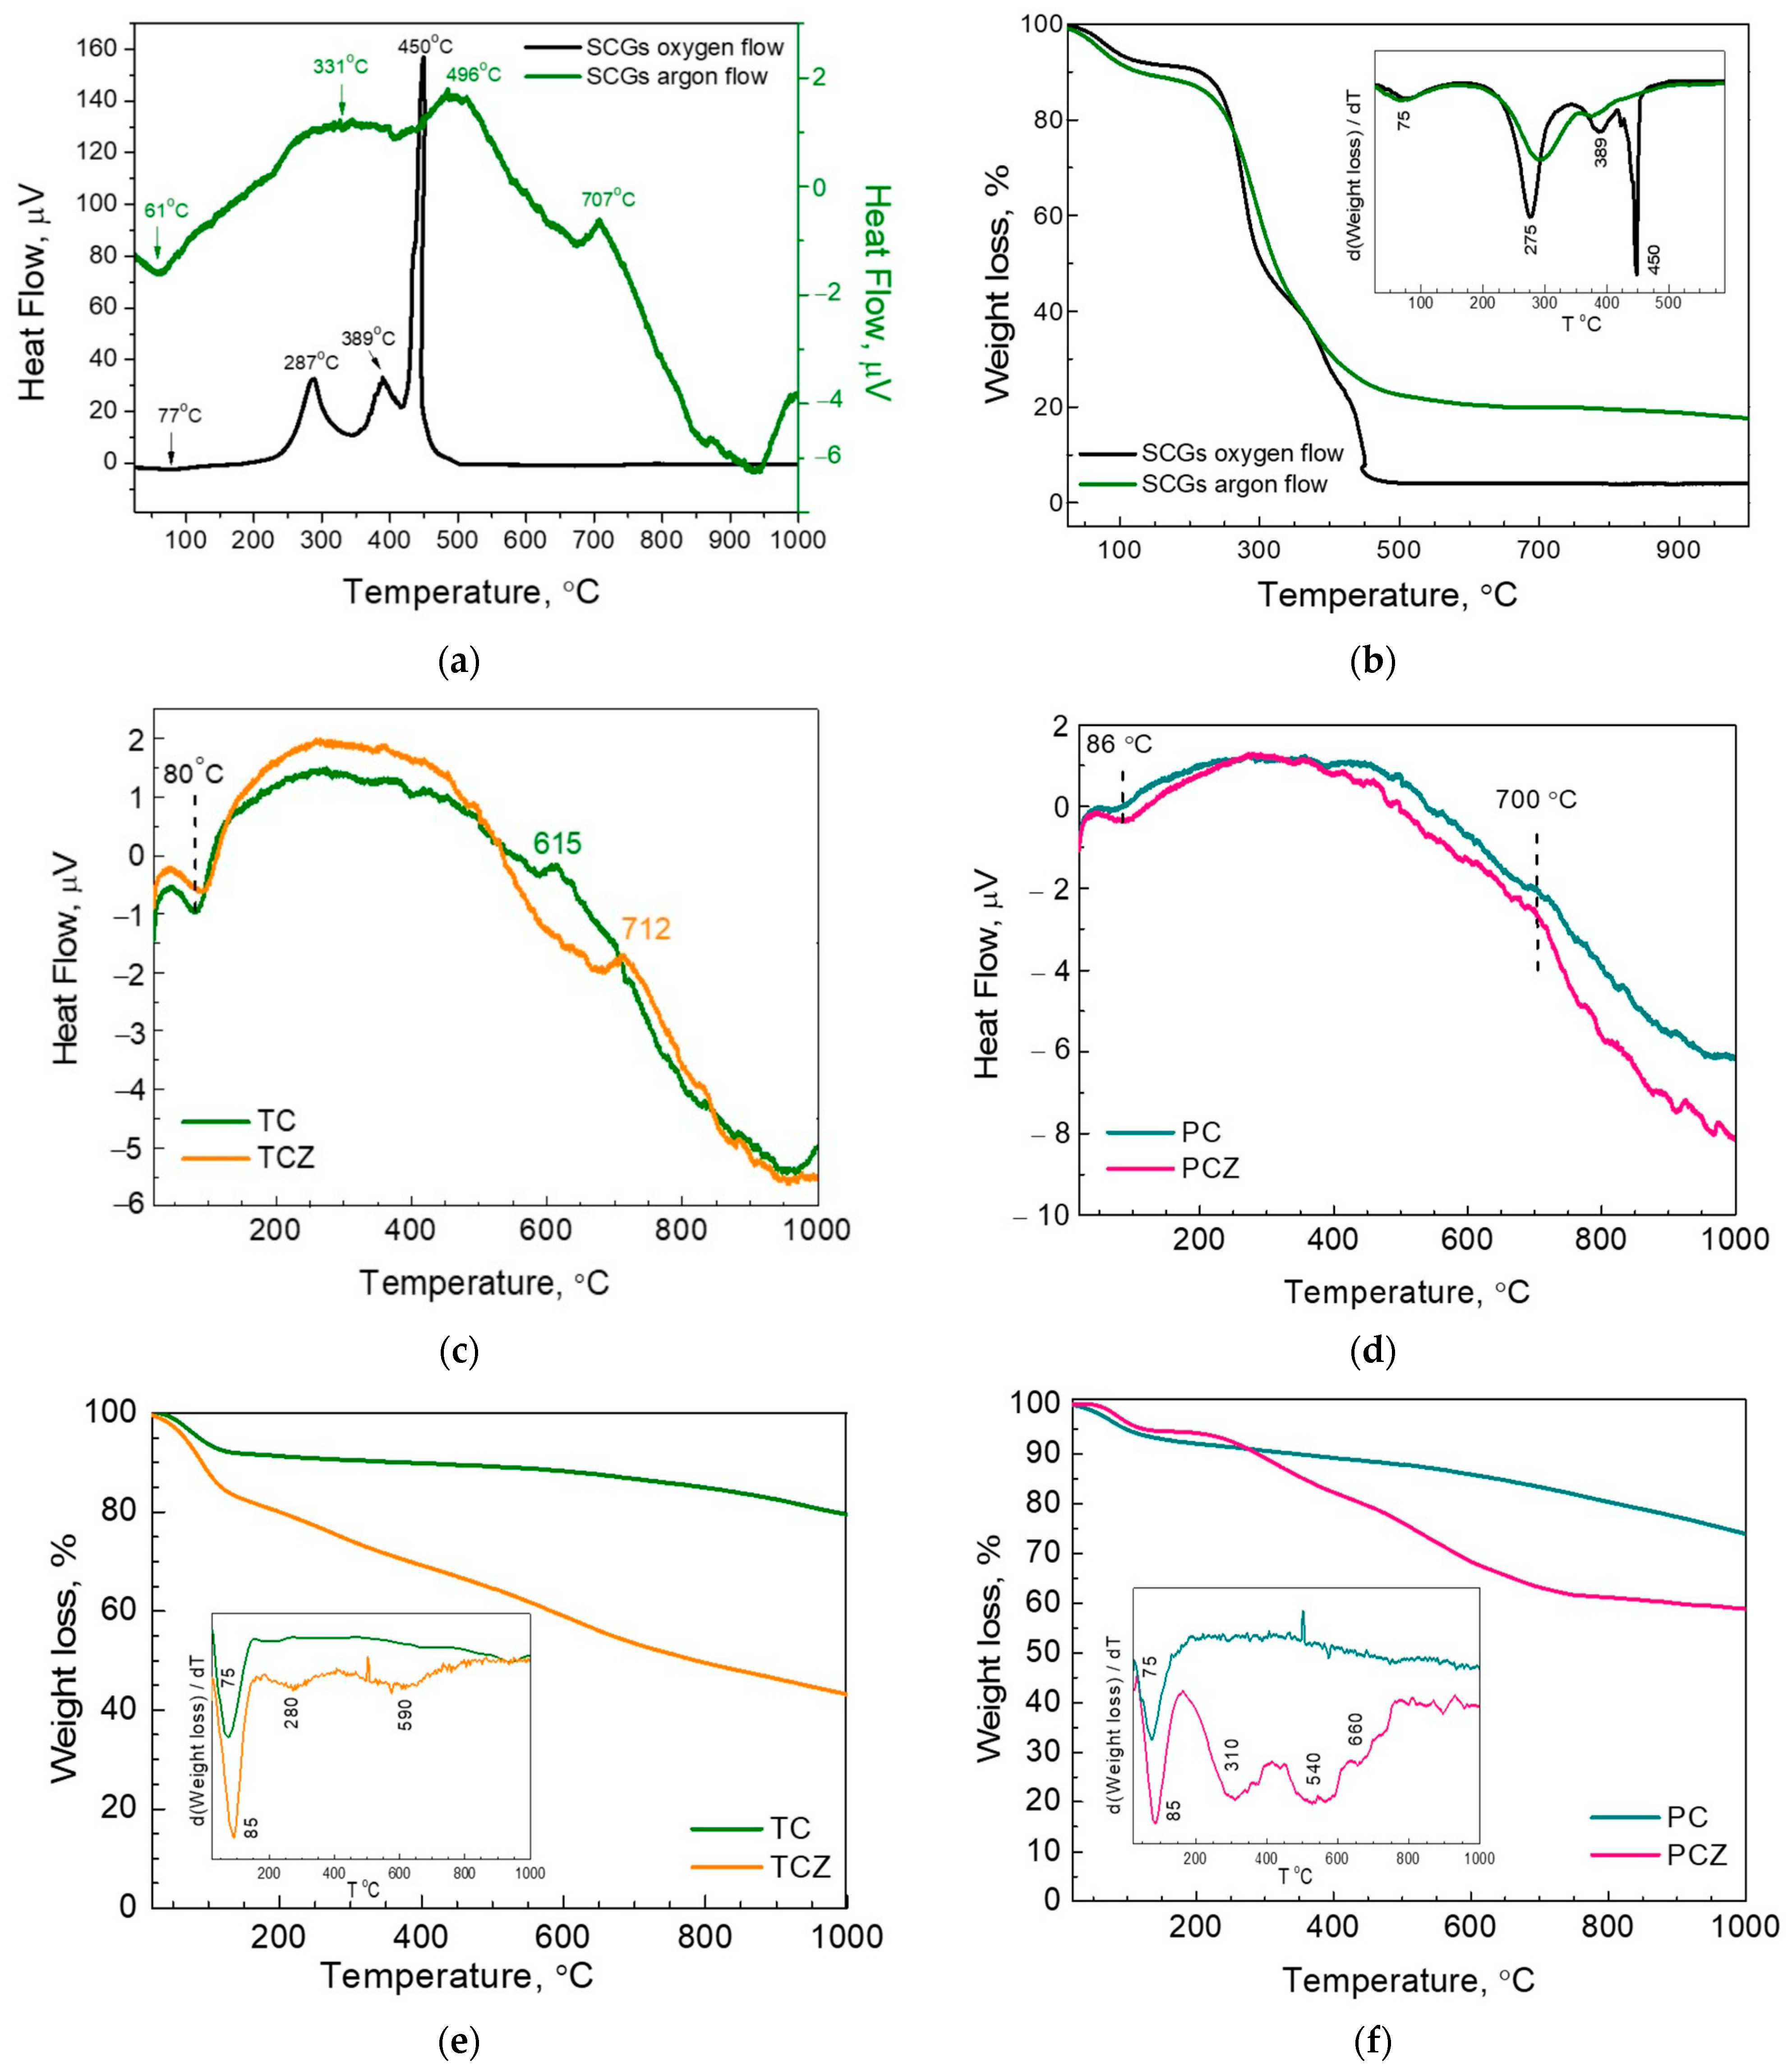
3.1. Formation of Carbons from SCGs
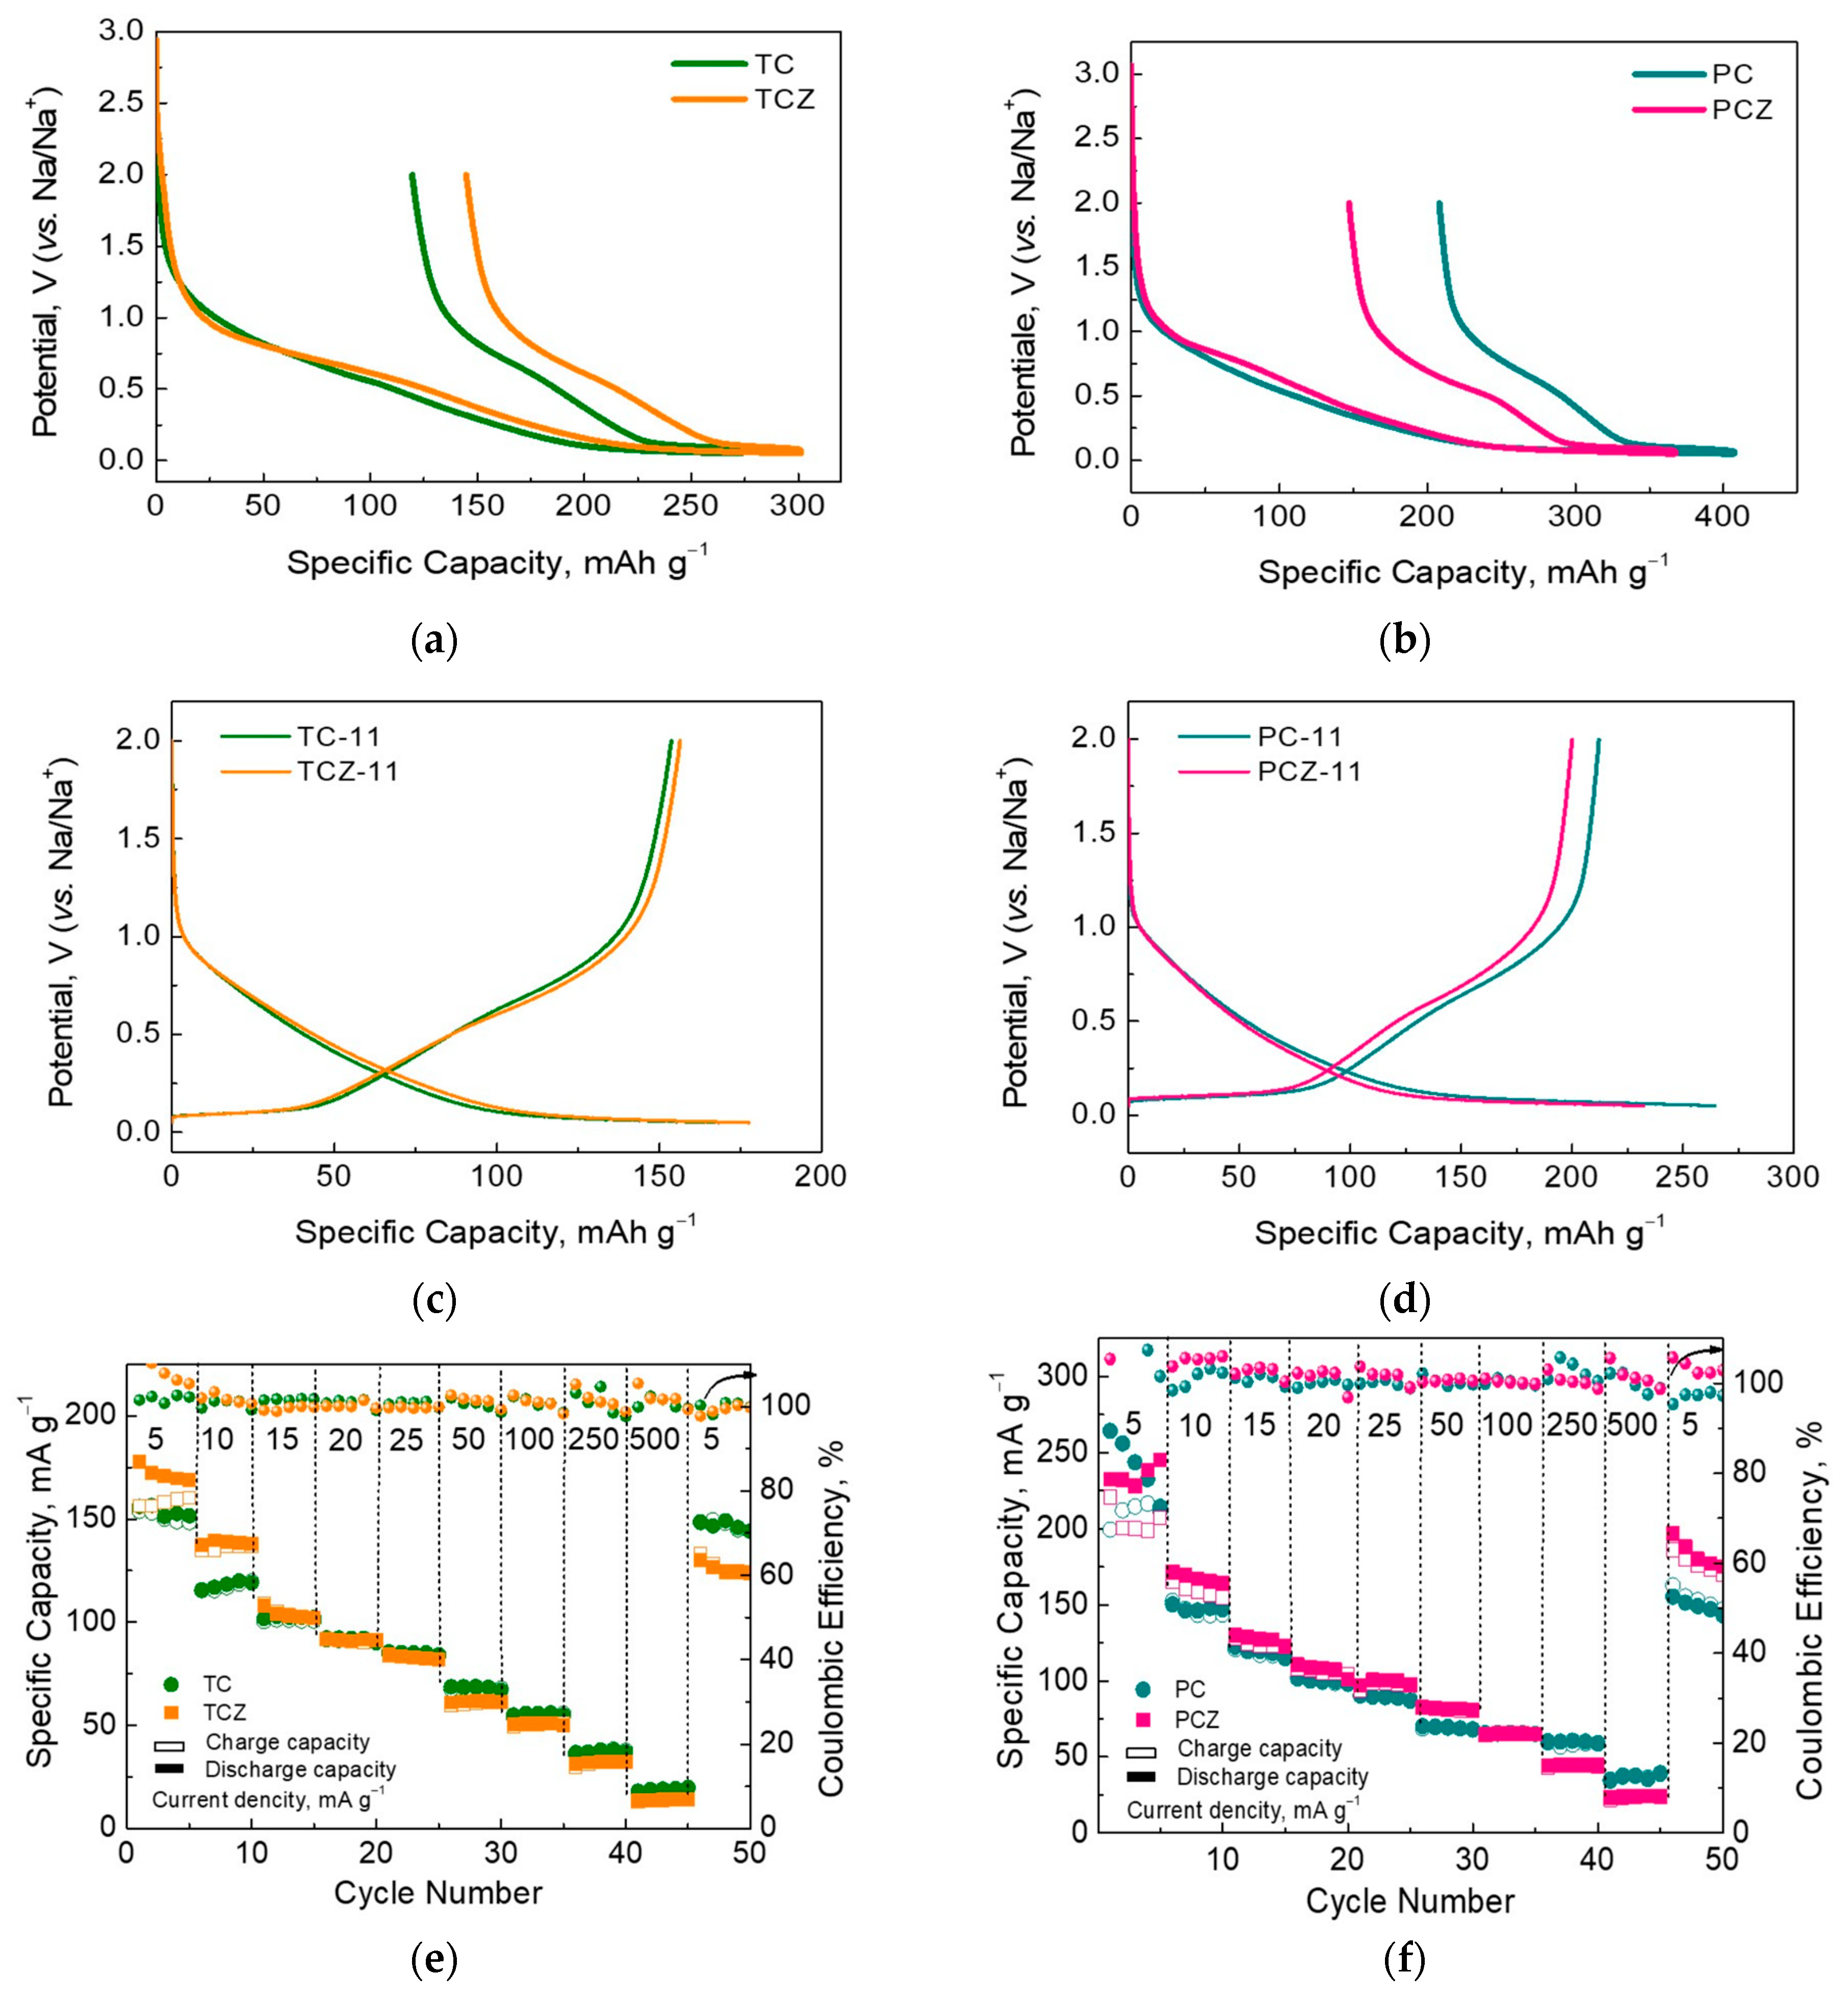
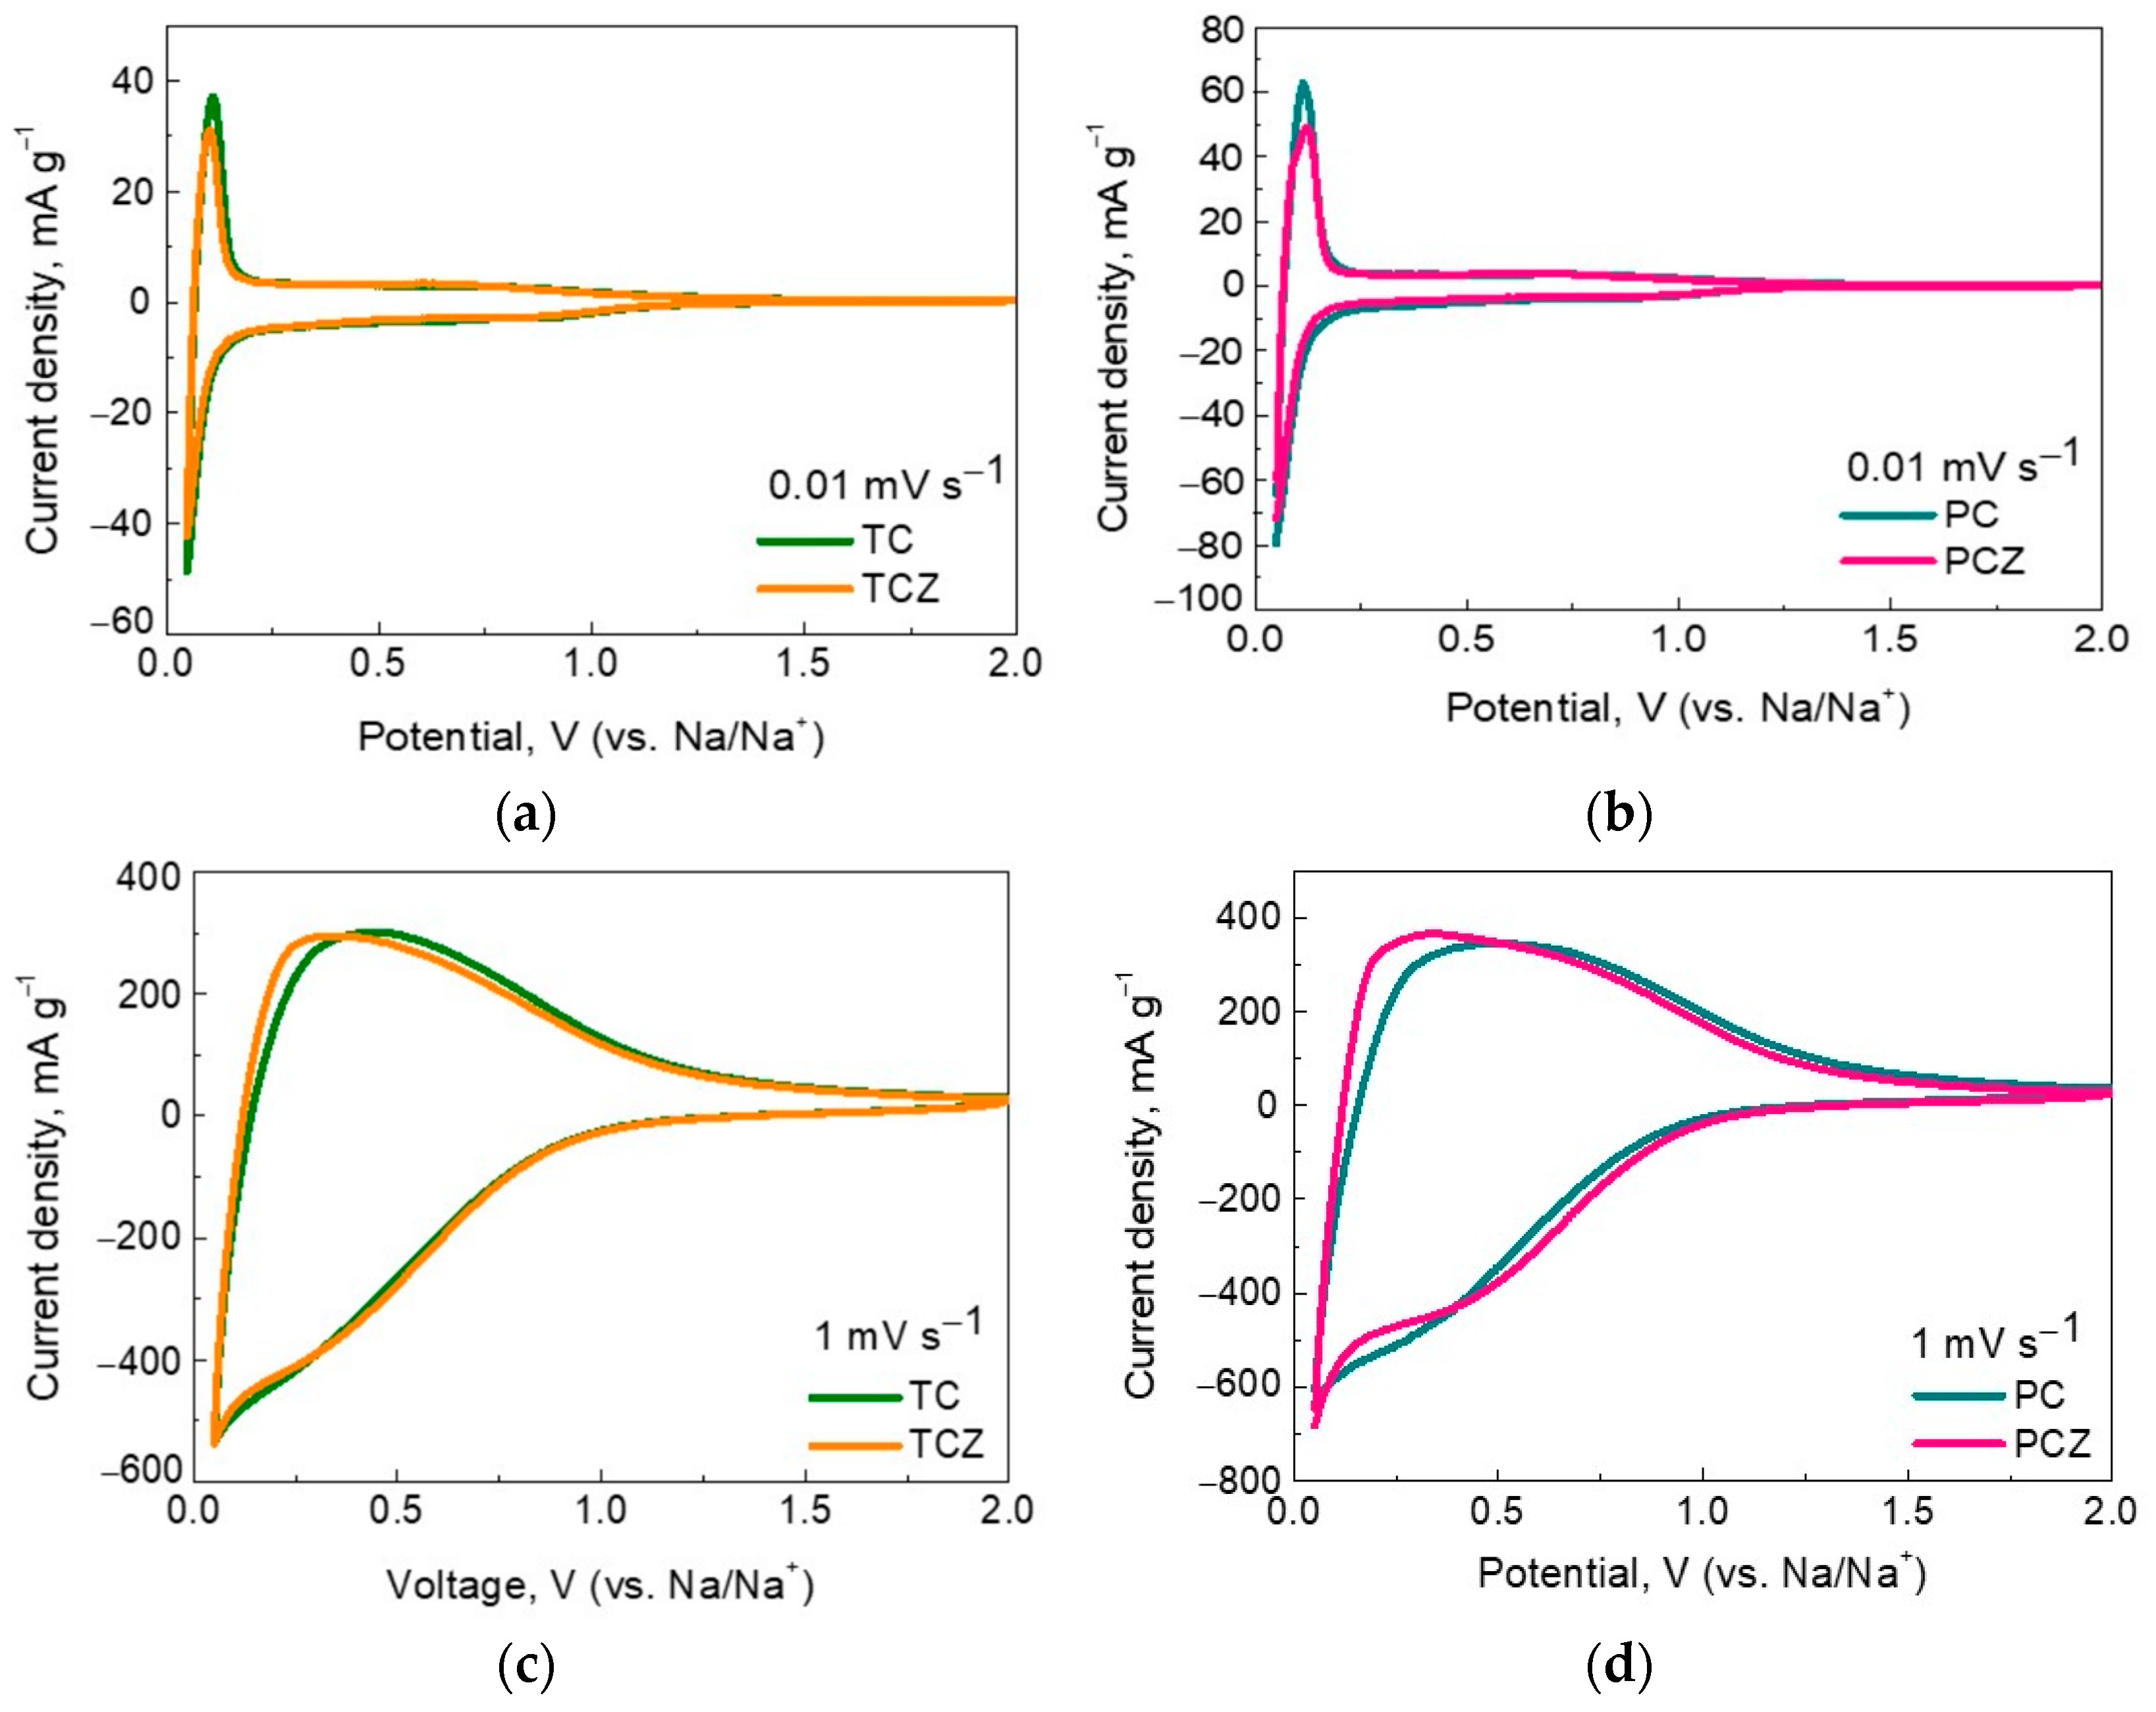
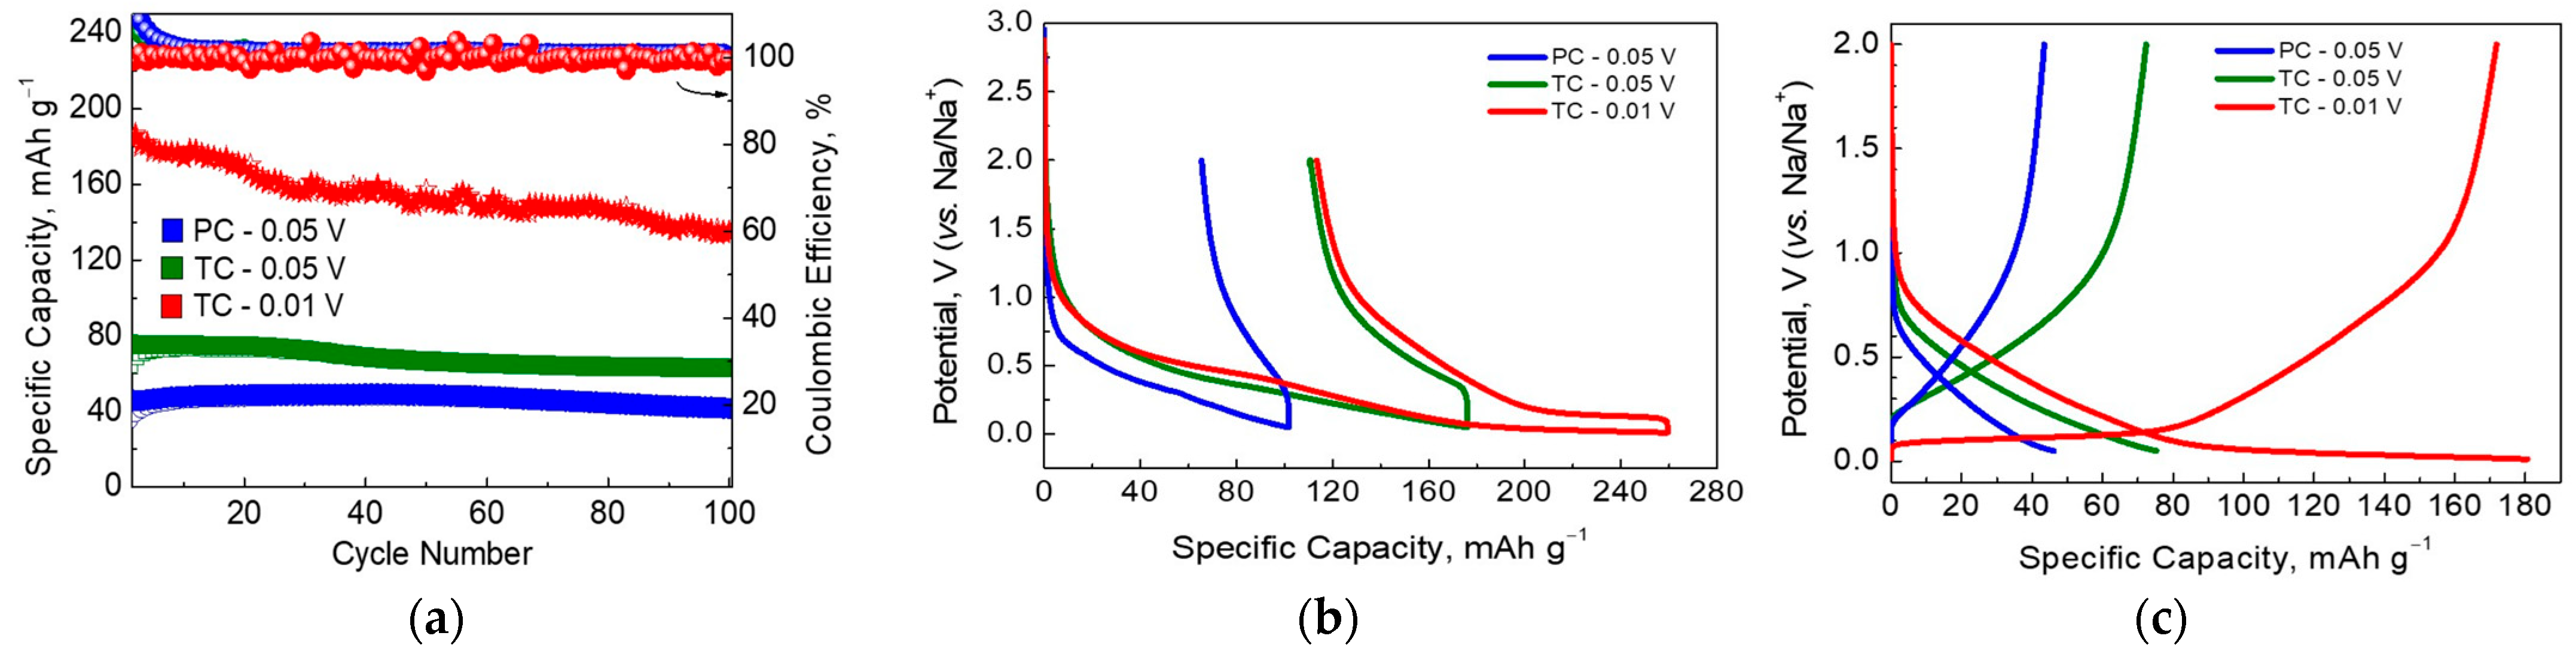
3.2. Sodium Storage Performance of SCG-Derived Carbons
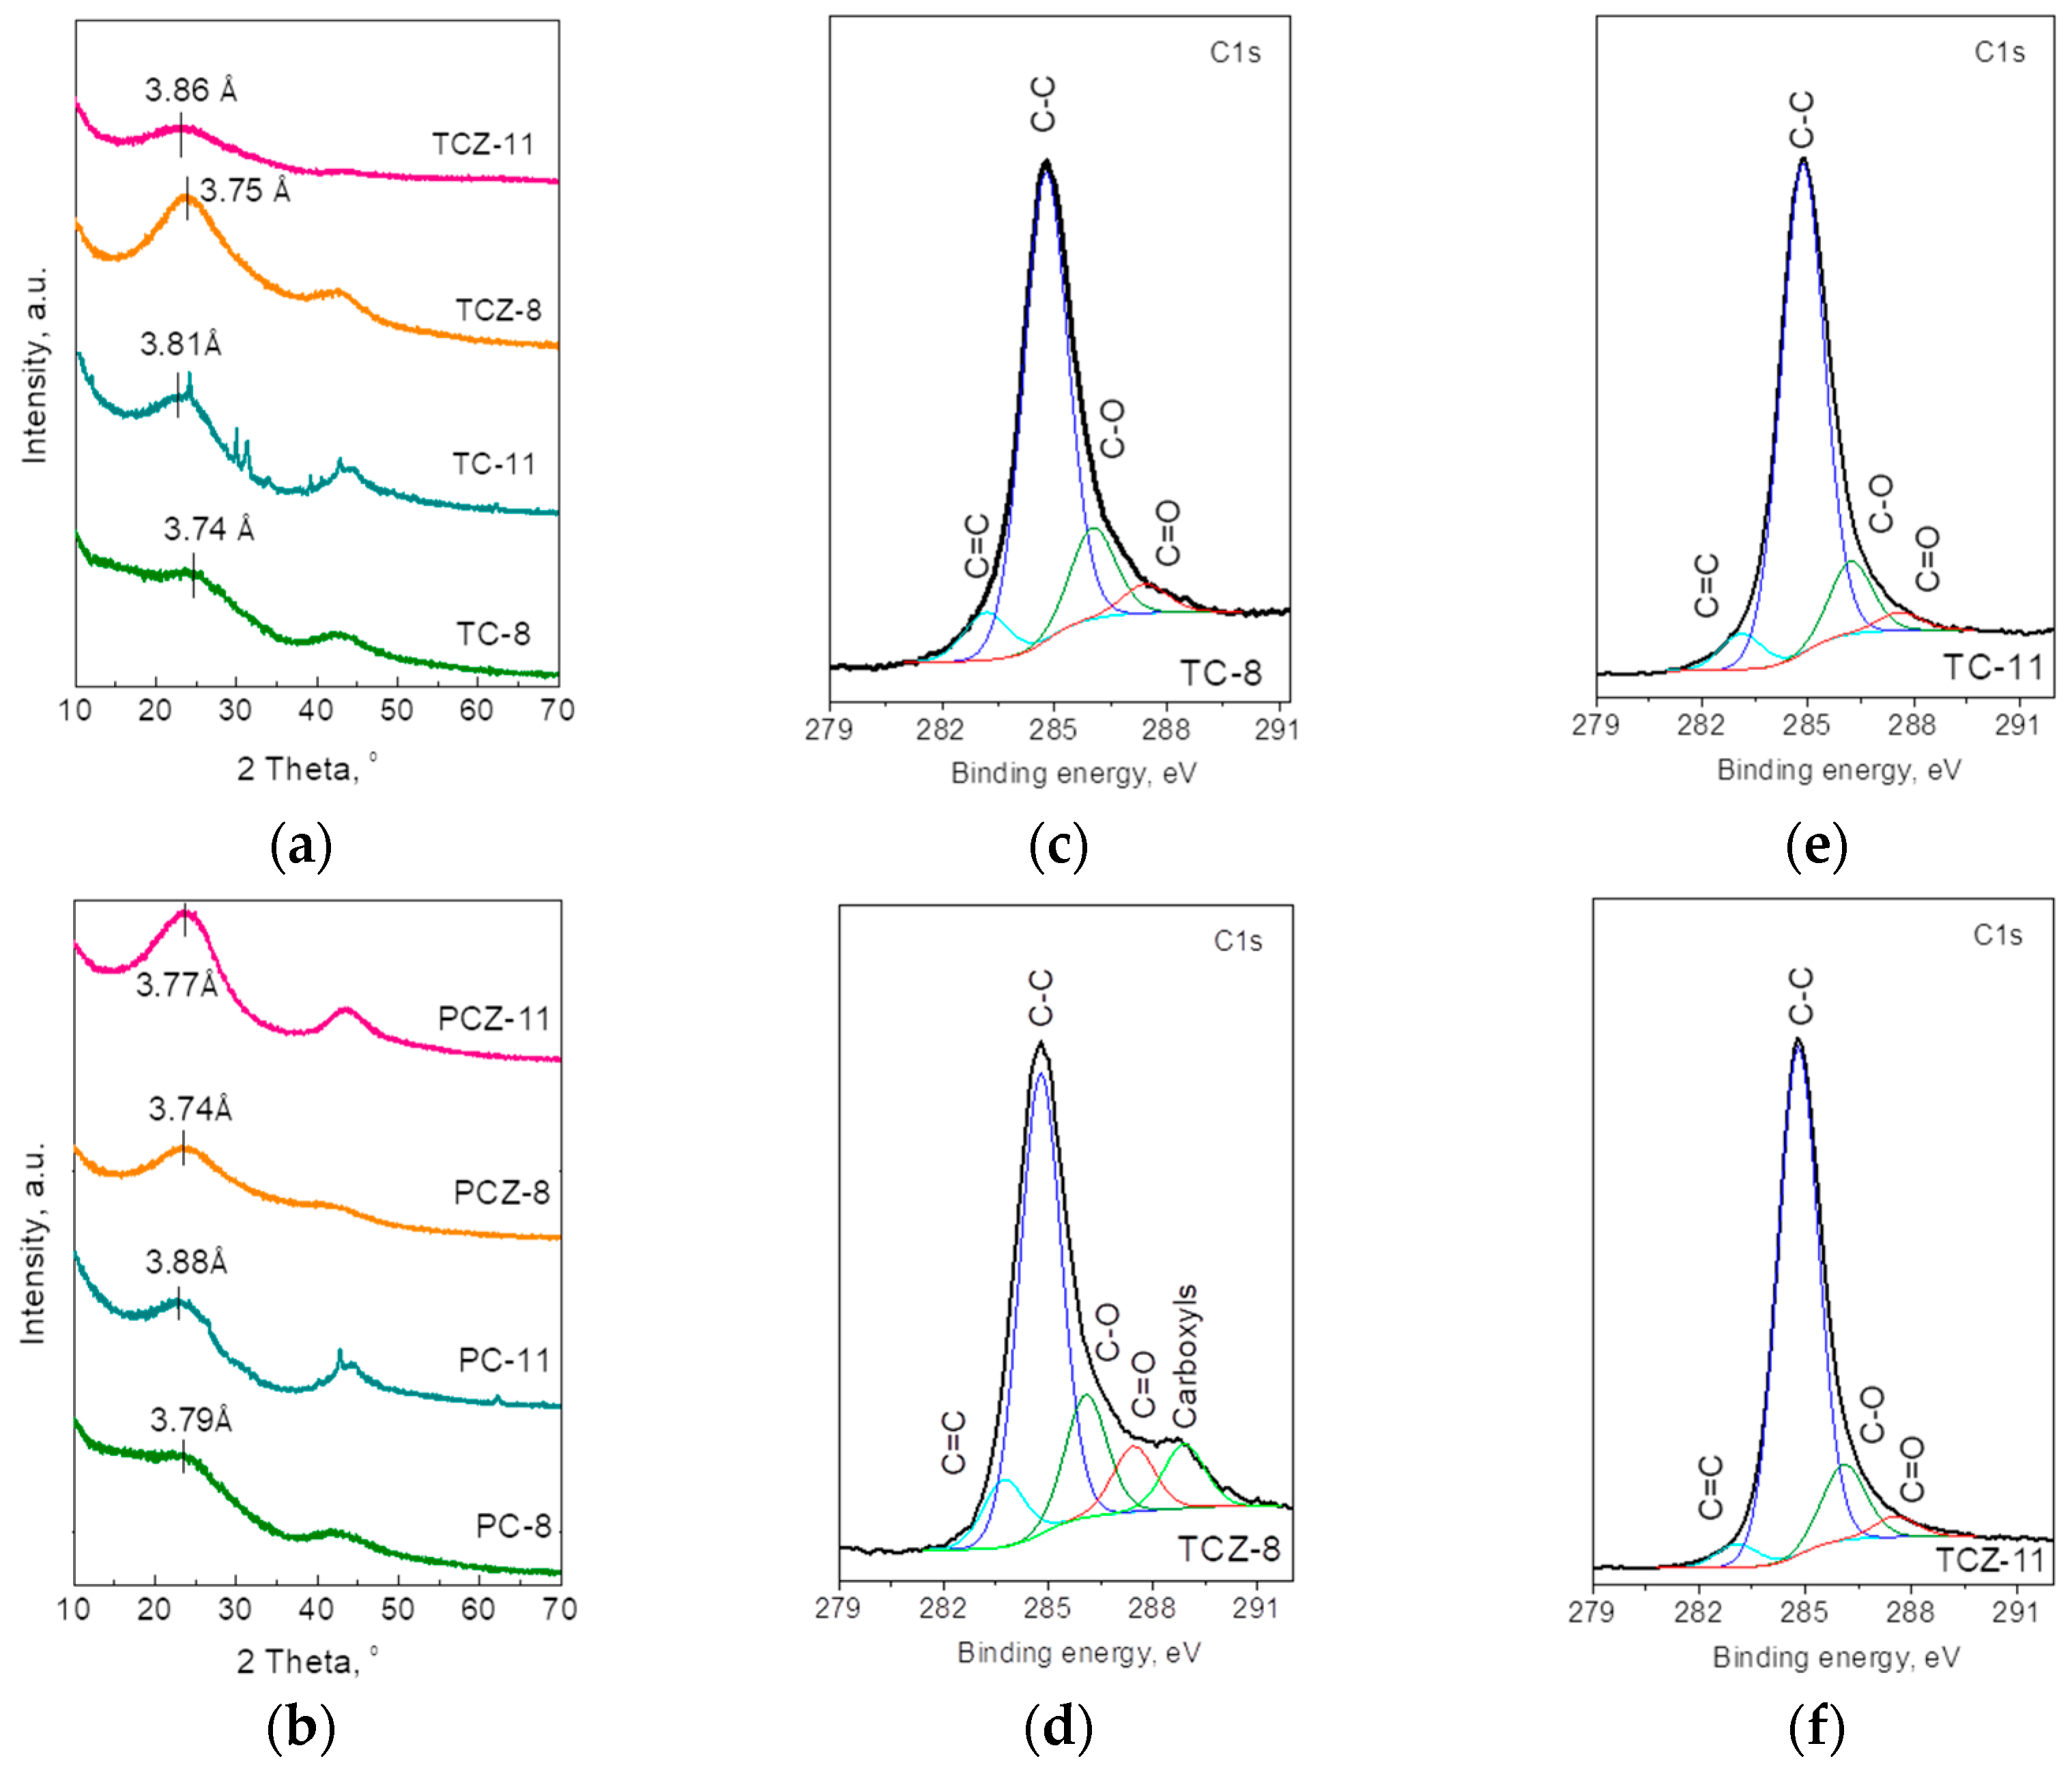
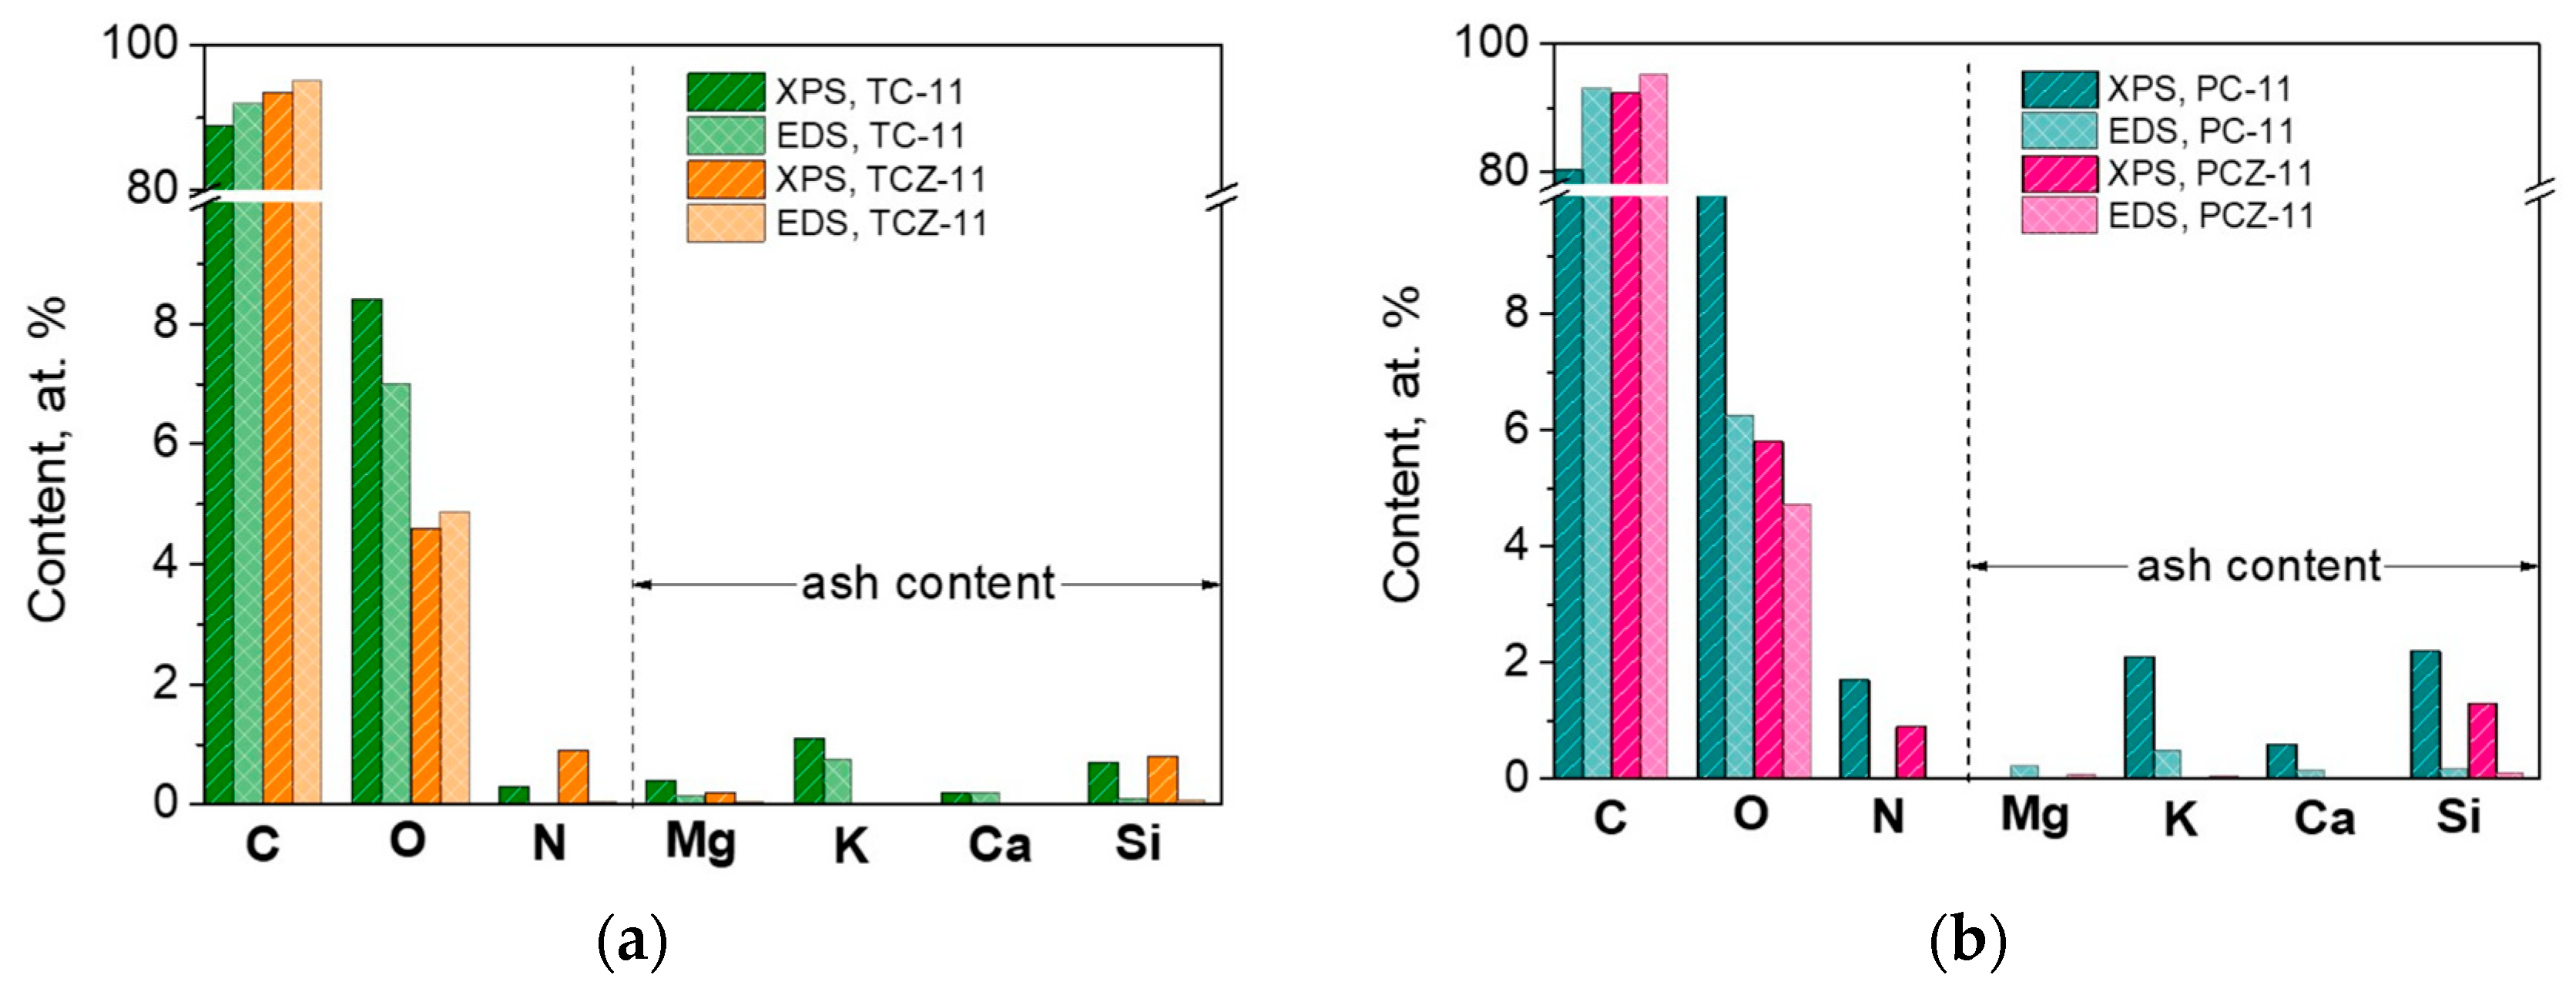
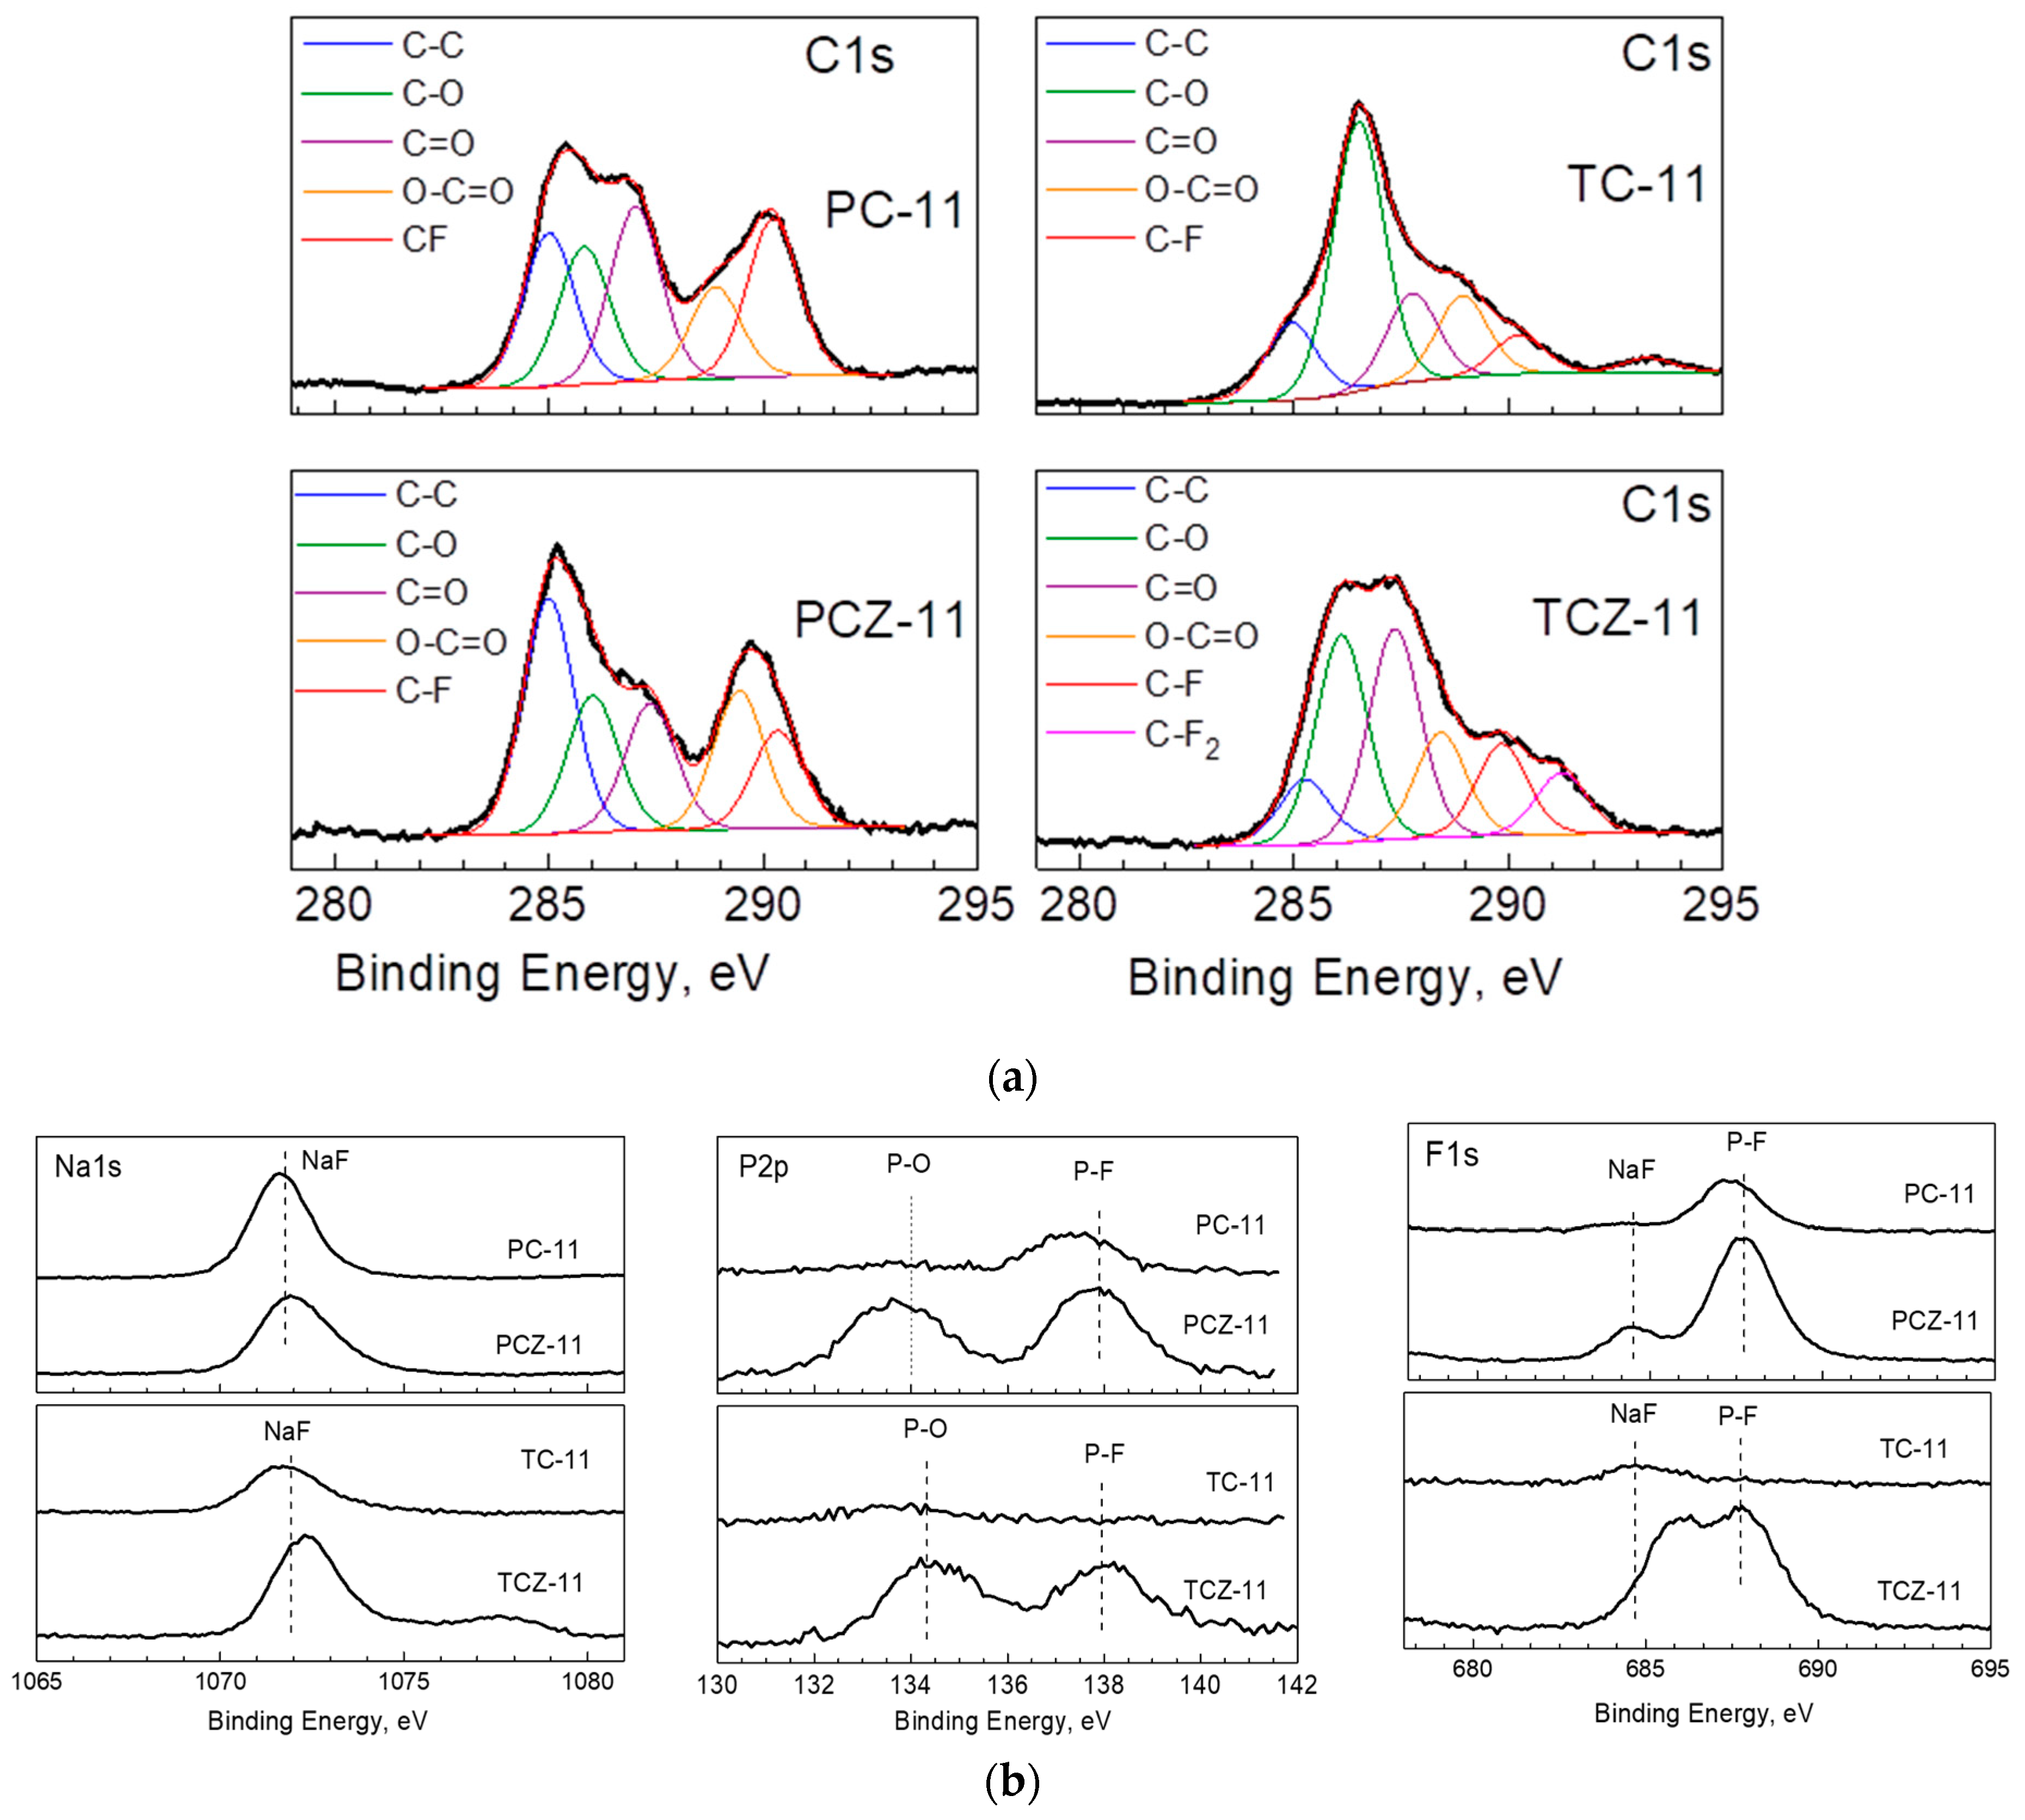
3.3. Ex Situ XPS Analysis
4. Conclusions
Supplementary Materials
Author Contributions
Funding
Institutional Review Board Statement
Informed Consent Statement
Data Availability Statement
Acknowledgments
Conflicts of Interest
References
- Hirsh, H.S.; Li, Y.; Tan, D.H.S.; Zhang, M.; Zhao, E.; Meng, Y.S. Sodium-Ion Batteries Paving the Way for Grid Energy Storage. Adv. Energy Mater. 2020, 10, 2001274. [Google Scholar] [CrossRef]
- Simons, S.; Schmitt, J.; Tom, B.; Bao, H.; Pettinato, B.; Pechulis, M. Chapter 10-Advanced concepts. In Thermal, Mechanical, and Hybrid Chemical Energy Storage System; Brun, K., Allison, T., Dennis, R., Eds.; Academic Press, Elsevier Inc.: Cambridge, MA, USA, 2021; pp. 569–596. [Google Scholar]
- Pan, H.; Hu, Y.-S.; Chen, L. Room-temperature stationary sodium-ion batteries for large-scale electric energy storage. Energy Environ. Sci. 2013, 6, 2338–2360. [Google Scholar] [CrossRef]
- Hwang, J.-Y.; Myung, S.-T.; Sun, Y.-K. Sodium-ion batteries: Present and future. Chem. Soc. Rev. 2017, 46, 3529–3614. [Google Scholar] [CrossRef]
- Li, H.Q.; He, X.J.; Wu, T.T.; Jin, B.; Yang, L.; Qiu, J. Synthesis, modification strategies and applications of coal-based carbon materials. Fuel Process. Technol. 2022, 230, 107203. [Google Scholar] [CrossRef]
- Genier, F.S.; Pathreeker, S.; Schuarca, R.L.; Islam, M.; Hosein, I.D. Hard Carbon Derived from Avocado Peels as a High-Capacity, High-Performance Anode Material for Sodium-Ion Batteries. ECS Adv. 2022, 1, 030502. [Google Scholar] [CrossRef]
- Dou, X.; Hasa, I.; Hekmatfar, M.; Diemant, T.; Behm, R.J.; Buchholz, D.; Passerini, S. Pectin, Hemicellulose, or Lignin? Impact of the Biowaste Source on the Performance of Hard Carbons for Sodium Ion Batteries. ChemSusChem 2017, 10, 2668–2676. [Google Scholar] [CrossRef]
- Zhu, Y.-E.; Gu, H.; Chen, Y.-N.; Yang, D.; Wei, J.; Zhou, Z. Hard carbon derived from corn straw piths as anode materials for sodium ion batteries. Ionics 2018, 24, 1075–1081. [Google Scholar] [CrossRef]
- Janissen, B.; Huynh, T. Chemical composition and value-adding applications of coffee industry byproducts: A review. Resour. Conserv. Recycl. 2018, 128, 110–117. [Google Scholar] [CrossRef]
- Khusyaeri, H.; Pratiwi, D.; Kurniawan, H.A.; Nurohmah, A.R.; Yudha, C.S.; Purwanto, A. Synthesis of High-Performance Hard Carbon from Waste Coffee Ground as Sodium Ion Battery Anode Material: A Review. Mater. Sci. Forum 2021, 1044, 25–39. [Google Scholar] [CrossRef]
- International Coffee Organization. Available online: https://www.ico.org/trade_statistics.asp?section=Statistics (accessed on 13 November 2023).
- Forcina, A.; Petrillo, A.; Travaglioni, M.; di Chiara, S.; De Felice, F. A comparative life cycle assessment of different spent coffee ground reuse strategies and a sensitivity analysis for verifying the environmental convenience based on the location of sites. J. Clean. Prod. 2023, 385, 135727. [Google Scholar] [CrossRef]
- Rios, C.d.M.S.; Simonin, L.; Geyer, A.d.; Ghimbeu, C.M.; Dupont, C. Unraveling the Properties of Biomass-Derived Hard Carbons upon Thermal Treatment for a Practical Application in Na-Ion Batteries. Energies 2020, 13, 3513. [Google Scholar] [CrossRef]
- Krikstolaityte, V.; Joshua, O.E.Y.; Veksha, A.; Wai, N.; Lisak, G.; Lim, T.M. Conversion of Spent Coffee Beans to Electrode Material for Vanadium Redox Flow Batteries. Batteries 2018, 4, 56. [Google Scholar] [CrossRef]
- Gao, G.; Cheong, L.-Z.; Wang, D.; Shen, C. Pyrolytic carbon derived from spent coffee grounds as anode for sodium-ion batteries. Carbon Resour. Convers. 2018, 1, 104–108. [Google Scholar] [CrossRef]
- Liu, X.; Zhang, S.; Wen, X.; Chen, X.; Wen, Y.; Shi, X.; Mijowska, E. High yield conversion of biowaste coffee grounds into hierarchical porous carbon for superior capacitive energy storage. Sci. Rep. 2020, 10, 3518. [Google Scholar] [CrossRef] [PubMed]
- Navarro-Suárez, A.M.; Saurel, D.; Sánchez-Fontecoba, P.; Castillo-Martínez, E.; Carretero-González, J.; Rojo, T. Temperature effect on the synthesis of lignin-derived carbons for electrochemical energy storage applications. J. Power Sources 2018, 397, 296–306. [Google Scholar] [CrossRef]
- Wang, C.-C.; Su, W.-L. Understanding acid pretreatment of lotus leaves to prepare hard carbons as anodes for sodium ion batteries. J. Surf. Coat. 2021, 415, 127125. [Google Scholar] [CrossRef]
- Chiang, P.-H.; Liu, S.-F.; Hung, Y.-H.; Tseng, H.; Guo, C.-H.; Chen, H.-Y. Coffee-Ground-Derived Nanoporous Carbon Anodes for Sodium-Ion Batteries with High Rate Performance and Cyclic Stability. Energy Fuels 2020, 34, 7666–7675. [Google Scholar] [CrossRef]
- Darjazi, H.; Staffolani, A.; Sbrascini, L.; Bottoni, L.; Tossici, R.; Nobili, F. Sustainable Anodes for Lithium- and Sodium-Ion Batteries Based on Coffee Ground-Derived Hard Carbon and Green Binders. Energies 2020, 13, 6216. [Google Scholar] [CrossRef]
- Nieto, N.; Porte, J.; Saurel, D.; Djuandhi, L.; Sharma, N.; Lopez-Urionabarrenechea, A.; Palomares, V.; Rojo, T. Use of Hydrothermal Carbonization to Improve the Performance of Biowaste-Derived Hard Carbons in Sodium Ion-Batteries. ChemSusChem 2023, 16, e202301053. [Google Scholar] [CrossRef]
- Lee, M.E.; Kwak, H.W.; Jin, H.-J.; Yun, Y.S. Waste Beverage Coffee-Induced Hard Carbon Granules for SodiumIon Batteries. ACS Sustain. Chem. Eng. 2019, 7, 12734–12740. [Google Scholar] [CrossRef]
- Stevens, D.A.; Dahn, J.R. High Capacity Anode Materials for Rechargeable Sodium-Ion Batteries. J. Electrochem. Soc. 2000, 147, 1271–1273. [Google Scholar] [CrossRef]
- Alvin, S.; Yoon, D.; Chandra, C.; Susanti, R.F.; Chang, W.; Ryu, C.; Kim, J. Extended flat voltage profile of hard carbon synthesized using a two-step carbonization approach as an anode in sodium ion batteries. J. Power Sources 2019, 430, 157–168. [Google Scholar] [CrossRef]
- Zhang, T.; Mao, J.; Liu, X.; Xuan, M.; Bi, K.; Zhang, X.L.; Hu, J.; Fan, J.; Chen, S.; Shao, G. Pinecone biomass-derived hard carbon anodes for high-performance sodium-ion batteries. RSC Adv. 2017, 7, 41504–41511. [Google Scholar] [CrossRef]
- Rios, C.d.M.S.; Simone, V.; Simonin, L.; Martinet, S.; Dupont, C. Biochars from various biomass types as precursors for hard carbon anodes in sodium-ion batteries. Biomass Bioenergy 2018, 117, 32–37. [Google Scholar] [CrossRef]
- Ballesteros, L.F.; Teixeira, J.A.; Mussatto, S.I. Chemical, Functional, and Structural Properties of Spent Coffee Grounds and Coffee Silverskin. Food Bioprocess Technol. 2014, 7, 3493–3503. [Google Scholar] [CrossRef]
- Campos-Vega, R.; Loarca-Piña, G.; Vergara-Castañeda, H.A.; Oomah, B.D. Spent coffee grounds: A review on current research and future prospects. Trends Food Sci. Technol. 2015, 45, 24–36. [Google Scholar] [CrossRef]
- Mussatto, S.I.; Ballesteros, L.F.; Martins, S.; Teixeira, J.A. Extraction of antioxidant phenolic compounds from spent coffee grounds. Sep. Purif. Technol. 2011, 83, 173–179. [Google Scholar] [CrossRef]
- Colantoni, A.; Paris, E.; Bianchini, L.; Ferri, S.; Marcantonio, V.; Carnevale, M.; Palma, A.; Civitarese, V.; Gallucci, F. Spent coffee ground characterization, pelletization test and emissions assessment in the combustion process. Sci. Rep. 2021, 11, 5119. [Google Scholar] [CrossRef]
- Eliche-Quesada, D.; Martínez-García, C.; Martínez-Cartas, M.L.; Cotes-Palomino, M.T.; Pérez-Villarejo, L.; Cruz-Pérez, N.; Corpas-Iglesias, F.A. The use of different forms of waste in the manufacture of ceramic bricks. Appl. Clay Sci. 2011, 52, 270–276. [Google Scholar] [CrossRef]
- Boström, D.; Skoglund, N.; Grimm, A.; Boman, C.; Öhman, M.; Broström, M.; Backman, R. Ash Transformation Chemistry during Combustion of Biomass. Energy Fuels 2012, 26, 85–93. [Google Scholar] [CrossRef]
- Susanti, R.F.; Alvin, S.; Kim, J. Toward high-performance hard carbon as an anode for sodium-ion batteries: Demineralization of biomass as a critical step. J. Ind. Eng. Chem. 2020, 91, 317–329. [Google Scholar] [CrossRef]
- Rios, C.d.M.S.; Simonin, C.M.; Ghimbeu, L.; Vaulot, C.; Perez, D.d.S.; Dupont, C. Impact of the biomass precursor composition in the hard carbon properties and performance for application in a Na-ion battery. Fuel Process. Technol. 2022, 231, 107223. [Google Scholar] [CrossRef]
- Beda, A.; Le Meins, J.-M.; Taberna, P.-L.; Simon, P.; Ghimbeu, C.M. Impact of biomass inorganic impurities on hard carbon properties and performance in Na-ion batteries. Sustain. Mater. Technol. 2020, 26, e00227. [Google Scholar] [CrossRef]
- Wu, F.; Liu, L.; Yuan, Y.; Li, Y.; Bai, Y.; Li, T.; Lu, J.; Wu, C. Expanding Interlayer Spacing of Hard Carbon by Natural K+ Doping to Boost Na-Ion Storage. ACS Appl. Mater. Interfaces 2018, 10, 27030–27038. [Google Scholar] [CrossRef]
- Technical Association of the Pulp and Paper Industry (TAPPI) Standard. Available online: https://www.tappi.org/ (accessed on 30 January 2023).
- Pujol, D.; Liu, C.; Gomincho, J.; Olivella, M.À.; Fiol, N.; Villaescusa, I.; Pereira, H. The chemical composition of exhausted coffee waste. Ind. Crops Prod. 2013, 50, 423–429. [Google Scholar] [CrossRef]
- Garcia, E.; Ejim, I.F.; Liu, H. Thermogravimetric analysis of co-combustion of a bituminous coal and coffee industry by-products. Thermochim. Acta 2022, 715, 179296. [Google Scholar] [CrossRef]
- Chen, J.; Liu, J.; He, Y.; Huang, L.; Sun, S.; Sun, J.; Chang, K.; Kuo, J.; Huang, S.; Ning, X. Investigation of co-combustion characteristics of sewage sludge and coffee grounds mixtures using thermogravimetric analysis coupled to artificial neural networks modeling. Bioresour. Technol. 2017, 225, 234–245. [Google Scholar] [CrossRef]
- Zarrinbakhsh, M.; Wang, T.; Rodriguez-Uribe, A.; Misra, M.; Mohanty, A.K. Characterization of wastes and coproducts from the coffee industry for composite material production. BioResources 2016, 11, 7637–7653. [Google Scholar] [CrossRef]
- Wang, G.; Dai, Y.; Yang, H.; Xiong, Q.; Wang, K.; Zhou, J.; Li, Y.; Wang, S. A Review of Recent Advances in Biomass Pyrolysis. Energy Fuels 2020, 34, 15557–15578. [Google Scholar] [CrossRef]
- Yang, H.; Yan, R.; Chen, H.; Ho Lee, D.; Zheng, C. Characteristic of hemicellulose, cellulose and lignin pyrolysis. Fuel 2007, 86, 1781–1788. [Google Scholar] [CrossRef]
- Wacheter, I.; Rantuch, P.; Drienovsky, M.; Martinka, J.; Haz, A.; Stefko, T. Determining the activation energy of spent coffee grounds by the thermogravimetric analysis. J. Univ. Chem. Technol. Metall. 2022, 57, 1006–1018. [Google Scholar]
- Tsuzuki, Y.; Kadota, S.; Takashima, I. Dissolution process of albite and albite glass in acid solutions at 47 °C. Chem. Geol. 1985, 49, 127–140. [Google Scholar] [CrossRef]
- Gruber, C.; Kutuzov, I.; Ganor, J. The combined effect of temperature and pH on albite dissolution rate under far-from-equilibrium conditions. Geochim. Cosmochim. Acta 2016, 186, 154–167. [Google Scholar] [CrossRef]
- Lin, X.; Liu, Y.; Tan, H.; Zhang, B. Advanced lignin-derived hard carbon for Na-ion batteries and a comparison with Li and K ion storage. Carbon 2020, 157, 316–323. [Google Scholar] [CrossRef]
- Cao, Y.; Xiao, L.; Sushko, M.L.; Wang, W.; Schwenzer, B.; Xiao, J.; Nie, Z.; Saraf, L.V.; Yang, Z.; Liu, J. Sodium Ion Insertion in Hollow Carbon Nanowires for Battery Applications. Nano Lett. 2012, 12, 3783–3787. [Google Scholar] [CrossRef]
- Vassilev, S.V.; Vassileva, C.G.; Song, Y.-C.; Li, W.-Y.; Feng, J. Ash contents and ash-forming elements of biomass and their significance for solid biofuel combustion. Fuel 2017, 208, 377–409. [Google Scholar] [CrossRef]
- Vassilev, S.V.; Baxter, D.; Andersen, L.K.; Vassileva, C.G. An overview of the composition and application of biomass ash. Part 1. Phase–Mineral and chemical composition and classification. Fuel 2013, 105, 40–76. [Google Scholar] [CrossRef]
- Jordan, C.A.; Akay, G. Speciation and distribution of alkali, alkali earth metals and major ash forming elements during gasification of fuel cane bagasse. Fuel 2012, 91, 253–263. [Google Scholar] [CrossRef]
- Ganguly, A.; Sharma, S.; Papakonstantinou, P.; Hamilton, J. Probing the Thermal Deoxygenation of Graphene Oxide Using High-Resolution In Situ X-ray-Based Spectroscopies. J. Phys. Chem. C 2011, 115, 17009–17019. [Google Scholar] [CrossRef]
- Reiche, S.; Blume, R.; Zhao, X.C.; Su, D.; Kunkes, E.; Behrens, M.; Schlögl, R. Reactivity of mesoporous carbon against water–An in-situ XPS study. Carbon 2014, 77, 175–183. [Google Scholar] [CrossRef]
- Kundu, S.; Wang, Y.M.; Xia, W.; Muhler, M. Thermal stability and reducibility of oxygen-containing functional groups on multiwalled carbon nanotube surfaces: A quantitative highresolution XPS and TPD/TPR study. J. Phys. Chem. C 2008, 112, 16869–16878. [Google Scholar] [CrossRef]
- Clark, D.T.; Dilks, A. ESCA applied to polymers. 23. RF glow discharge modification of polymers in pure oxygen and helium oxygen mixtures. J. Polym. Sci. Pol. Chem. 1979, 17, 957–976. [Google Scholar] [CrossRef]
- Thommes, M.; Kaneko, K.; Neimark, A.; Olivier, J.P.; Rodriguez-Reinoso, F.; Rouquerol, J.; Sing, K.S.W. Physisorption of gases, with special reference to the evaluation of surface area and pore size distribution (IUPAC Technical Report). Pure Appl. Chem. 2015, 87, 1051–1069. [Google Scholar] [CrossRef]
- Shields, J.E.; Lowell, S.; Thomas, M.A.; Thommes, M. Characterization of Porous Solids and Powders: Surface Area, Pore Size and Density; Kluwer Academic Publisher: Boston, MA, USA, 2004; pp. 43–45. [Google Scholar]
- Yang, J.; Wang, X.; Dai, W.; Lian, X.; Cui, X.; Zhang, W.; Zhang, K.; Lin, M.; Zou, R.; Loh, K.P.; et al. From Micropores to Ultra-micropores inside Hard Carbon: Toward Enhanced Capacity in Room-/Low-Temperature Sodium-Ion Storage. Nano-Micro Lett. 2021, 13, 98. [Google Scholar] [CrossRef]
- Zheng, Y.; Lu, Y.; Qi, X.; Wang, Y.; Mu, L.; Li, Y.; Ma, Q.; Li, J.; Hu, Y.-S. Superior electrochemical performance of sodium-ion full-cell using poplar wood derived hard carbon anode. Energy Storage Mater. 2019, 18, 269–279. [Google Scholar] [CrossRef]
- Alvin, S.; Yoon, D.; Chandra, C.; Cahyadi, H.S.; Park, J.-H.; Chang, W.; Chung, K.Y.; Kim, J. Revealing sodium ion storage mechanism in hard carbon. Carbon 2019, 145, 67–81. [Google Scholar] [CrossRef]
- Yin, X.; Lu, Z.; Wang, J.; Feng, X.; Roy, S.; Liu, X.; Yang, Y.; Zhao, Y.; Zhang, J. Enabling Fast Na+ Transfer Kinetics in the Whole-Voltage-Region of Hard-Carbon Anodes for Ultrahigh-Rate Sodium Storage. Adv. Mater. 2022, 34, 2109282. [Google Scholar] [CrossRef] [PubMed]
- Hijazi, H.; Ye, Z.; Zhang, L.; Deshmukh, J.; Johnson, M.B.; Dahn, J.R.; Metzger, M. Impact of Sodium Metal Plating on Cycling Performance of Layered Oxide/Hard Carbon Sodium-ion Pouch Cells with Different Voltage Cut-offs. J. Electrochem. Soc. 2023, 170, 070512. [Google Scholar] [CrossRef]
- Pfeifer, K.; Arnold, S.; Becherer, J.; Das, C.; Maibach, J.; Ehrenberg, H.; Dsoke, S. Can Metallic Sodium Electrodes Affect the Electrochemistry of Sodium-Ion Batteries? Reactivity Issues and Perspectives. ChemSusChem 2019, 12, 3312–3319. [Google Scholar] [CrossRef]
- Brisson, P.-Y.; Darmstadt, H.; Fafard, M.; Adnot, A.; Servant, G.; Soucy, G. X-ray photoelectron spectroscopy study of sodium reactions in carbon cathode blocks of aluminium oxide reduction cells. Carbon 2006, 44, 1438–1447. [Google Scholar] [CrossRef]
- Kalapsazova, M.; Zhecheva, E.; Tyuliev, G.; Nihtianova, D.; Mihaylov, L.; Stoyanova, R. Effects of the Particle Size Distribution and the Electrolyte Salt on the Intercalation Properties of P3-Na2/3Ni1/2Mn1/2O2. J. Phys. Chem. C 2017, 121, 5931–5940. [Google Scholar] [CrossRef]


| Sample | C, Mass % | H, Mass % | N, Mass % | S, Mass % | O, Difference | O/C |
|---|---|---|---|---|---|---|
| SCGs | 49.91 | 7.41 | 2.83 | 0.16 | 39.66 | 0.79 |
| TC-8 | 77.74 | 2.19 | 4.27 | 0.24 | 15.56 | 0.20 |
| TC-11 | 79.75 | 0.85 | 1.02 | 0.18 | 19.05 | 0.24 |
| TCZ-8 | 57.13 | 2.25 | 3.68 | 0.19 | 36.75 | 0.64 |
| TCZ-11 | 80.93 | 1.41 | 1.75 | 0.17 | 15.74 | 0.19 |
| PC-8 | 74.82 | 2.19 | 3.70 | 0.21 | 19.08 | 0.26 |
| PC-11 | 80.58 | 0.94 | 0.46 | 0.15 | 17.87 | 0.22 |
| PCZ-8 | 51.09 | 2.54 | 3.94 | 0.19 | 42.24 | 0.83 |
| PCZ-11 | 78.42 | 1.43 | 1.70 | 0.15 | 18.30 | 0.23 |
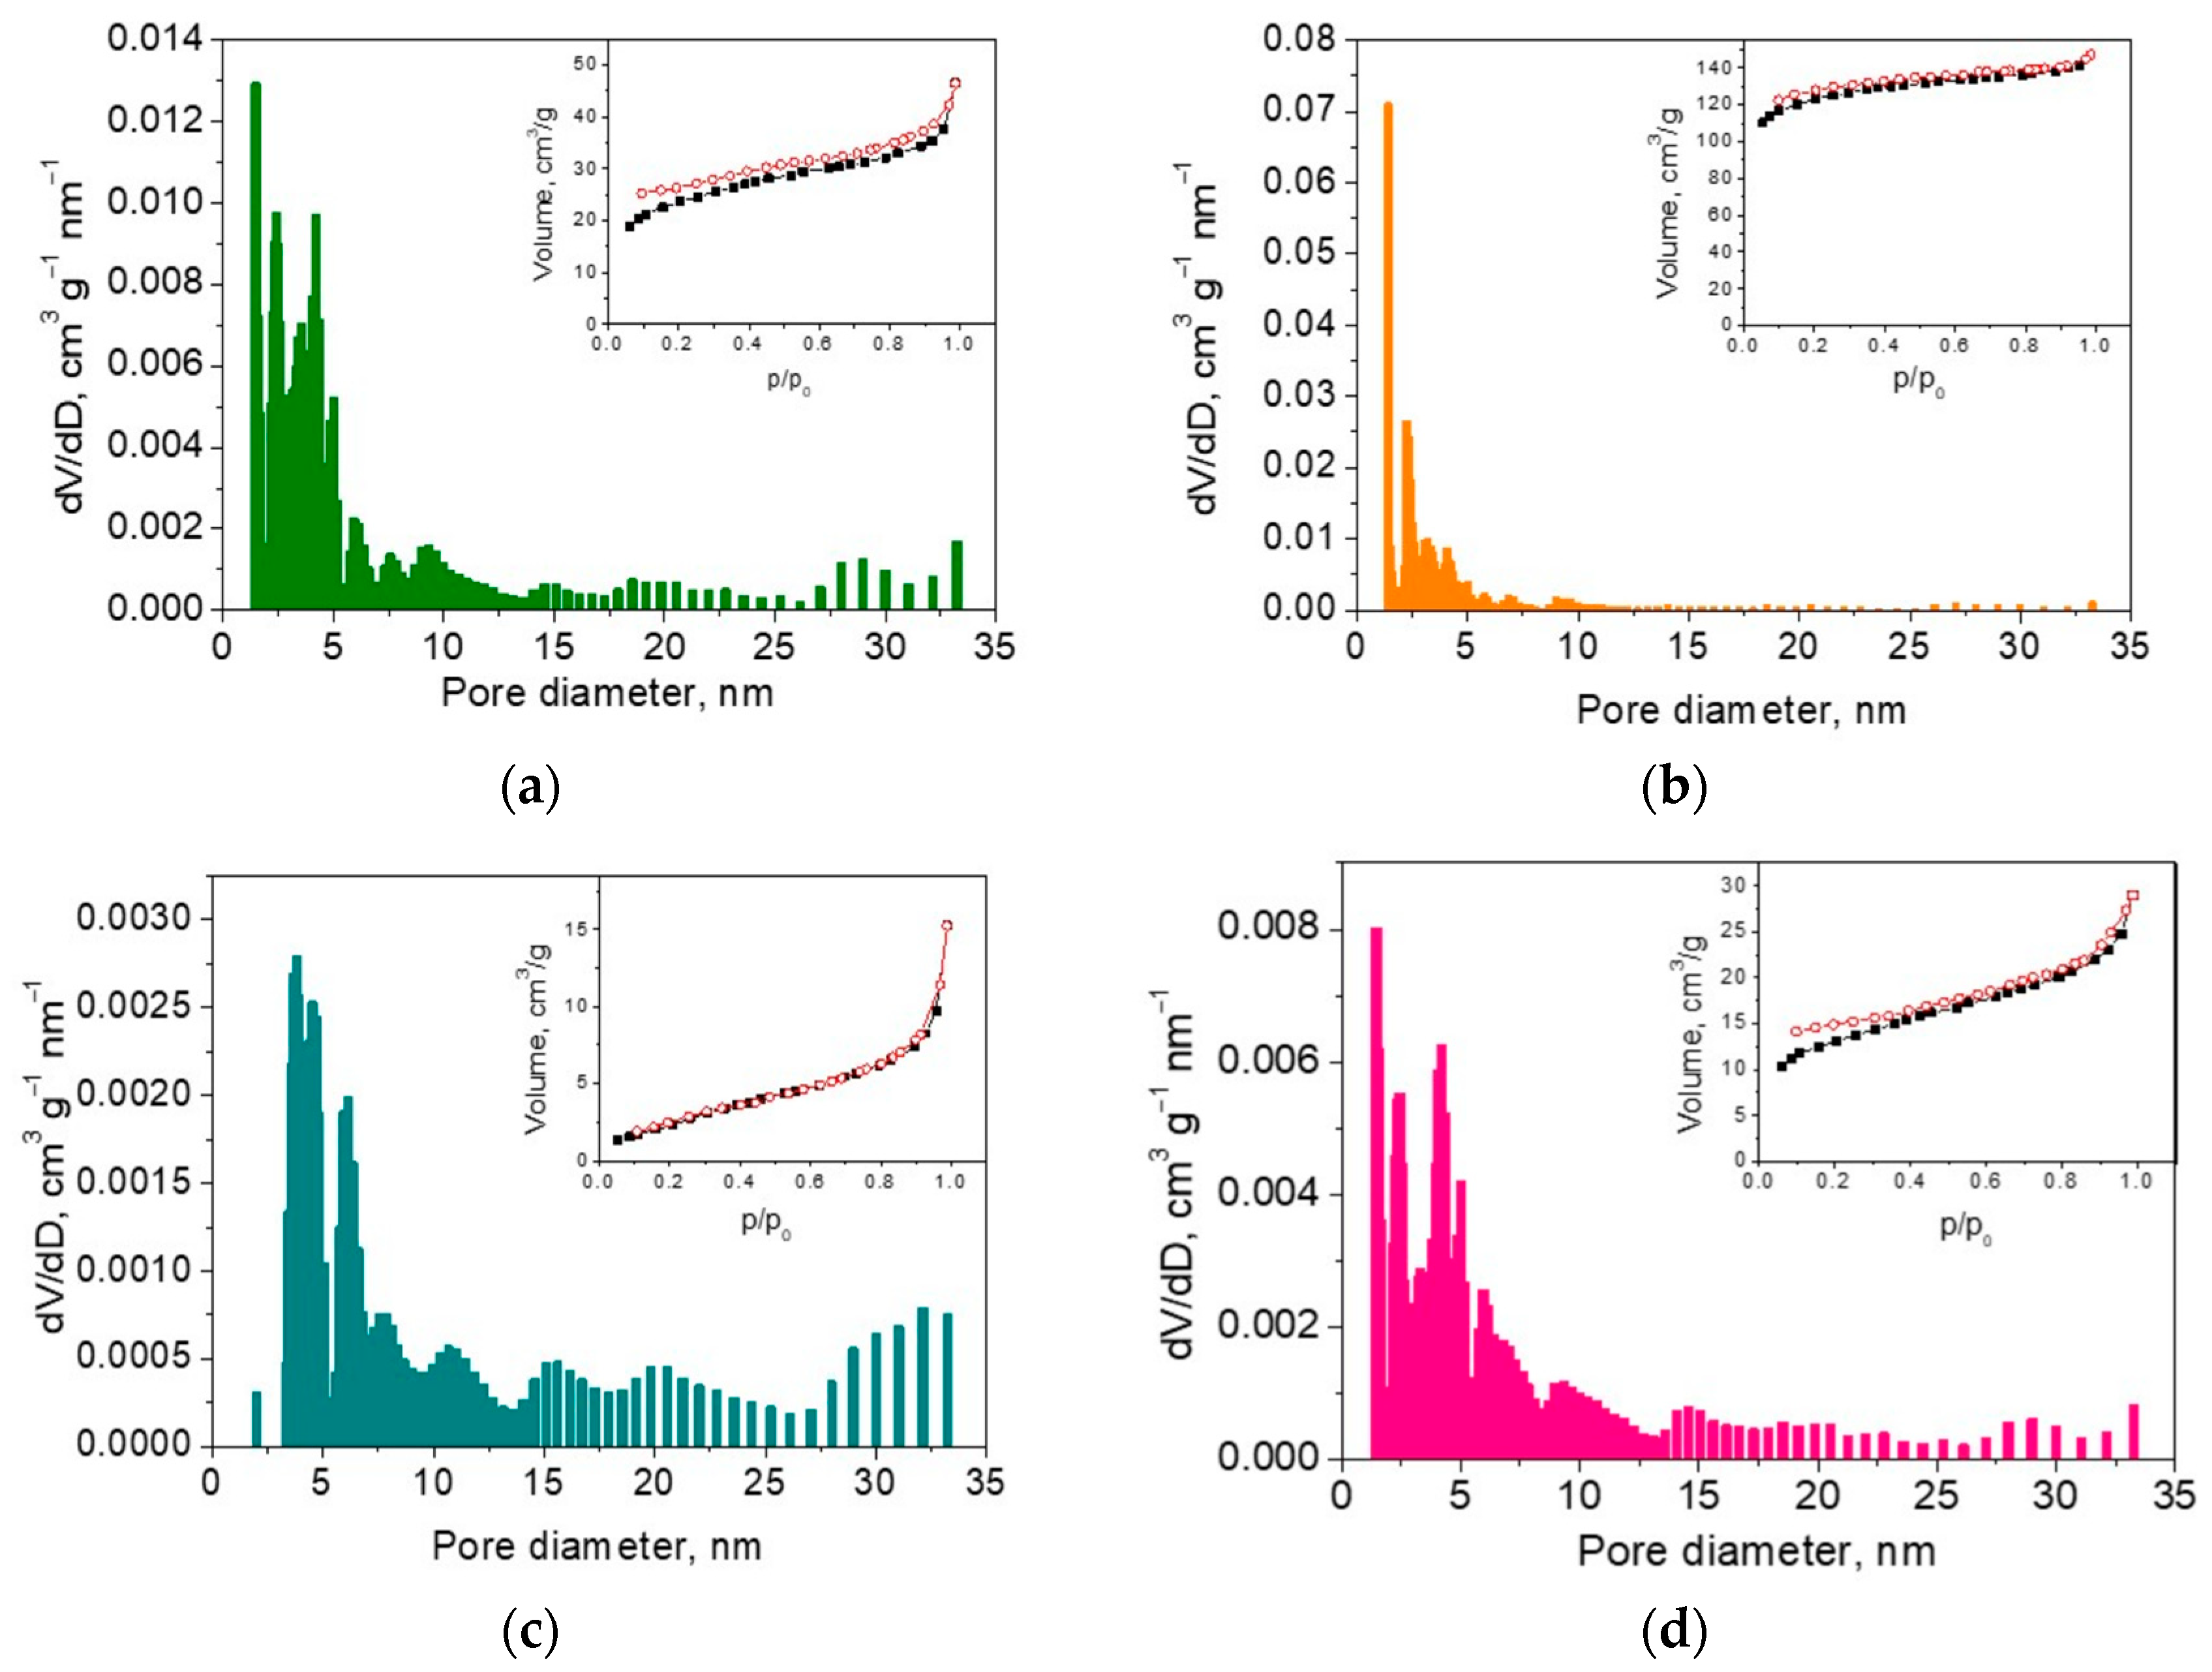
| Samples | S, m2 g−1 | V, cm3 g−1 | Dav, nm | Vmi, cm3 g−1 | Vmi/Vmes |
|---|---|---|---|---|---|
| TC-8 | 17 | 0.008 | 2.00 | 0.006 | 3 |
| TC-11 | 86 | 0.07 | 1.9 | 0.02 | 0.4 |
| TCZ-8 | 409 | 0.20 | 1.9 | 0.14 | 2.33 |
| TCZ-11 | 471 | 0.23 | 1.7 | 0.16 | 2.3 |
| PC-8 | 10 | 0.001 | 3.2 | - | - |
| PC-11 | 10 | 0.02 | 2.9 | 0.006 | 0.31 |
| PCZ-8 | 8 | 0.008 | 3.2 | 0.001 | 0.14 |
| PCZ-11 | 48 | 0.05 | 1.9 | 0.03 | 1.5 |
| Bio-Waste | Synthesis Procedure | Temperature Obtained | Current Density | Potential Range, (vs. Na/Na+) | ICE, % | First Cycle Reversible Capacity, mAh/g | Ref. |
|---|---|---|---|---|---|---|---|
| Spent coffee grounds |
| 700 °C | 50 mA/g | 0.01–3.00 V | 55 | 198 | [15] |
| Coffee grounds (CGs) |
| 900 °C | 50 mA/g | 0.01–3.00 V | 64 | 190 (untreated) | [19] |
| 39 | 144 (treated with KOH 1:1) | ||||||
| Coffee grounds (CGs) |
| 970 °C | C/5 (1C = 300 mAh/g) | 0.02–2.2 V | ~39 | ~130 (CMC binder) | [20] |
| Spent Coffee Grounds | One-step carbonization in N2. | 1200 °C | C/15 (1C = 372 mAh/g) | 0.002−2.0 V | 34 | 199 (untreated) | [21] |
| 32 | 219 (HTC pre-treated) | |||||
| Waste beverage coffee (WBC) | Two-step pyrolysis (first step at 800 °C in N2 and the second in Ar). | 1600 °C | 10 mA/g | 0.01−2.0 V | 56 | ~168 | [22] |
| 2000 °C | 90 | ~270 | |||||
| 2400 °C | 75 | ~225 | |||||
| 2600 °C | 64 | ~194 | |||||
| Our samples—spent coffee grounds | Two step pyrolysis in a fixed bed (TC) at 750 °C and 1100 °C in Ar flow. | 1100 °C | 50 mA/g | 0.05−2.0 V | 37 | 65 | |
| 0.01−2.0 V | 56 | 146 |
Disclaimer/Publisher’s Note: The statements, opinions and data contained in all publications are solely those of the individual author(s) and contributor(s) and not of MDPI and/or the editor(s). MDPI and/or the editor(s) disclaim responsibility for any injury to people or property resulting from any ideas, methods, instructions or products referred to in the content. |
© 2024 by the authors. Licensee MDPI, Basel, Switzerland. This article is an open access article distributed under the terms and conditions of the Creative Commons Attribution (CC BY) license (https://creativecommons.org/licenses/by/4.0/).
Share and Cite
Harizanova, S.; Uzunov, I.; Aleksandrov, L.; Shipochka, M.; Spassova, I.; Kalapsazova, M. The Beneficial Impact of Mineral Content in Spent-Coffee-Ground-Derived Hard Carbon on Sodium-Ion Storage. Materials 2024, 17, 1016. https://doi.org/10.3390/ma17051016
Harizanova S, Uzunov I, Aleksandrov L, Shipochka M, Spassova I, Kalapsazova M. The Beneficial Impact of Mineral Content in Spent-Coffee-Ground-Derived Hard Carbon on Sodium-Ion Storage. Materials. 2024; 17(5):1016. https://doi.org/10.3390/ma17051016
Chicago/Turabian StyleHarizanova, Sonya, Ivan Uzunov, Lyubomir Aleksandrov, Maria Shipochka, Ivanka Spassova, and Mariya Kalapsazova. 2024. "The Beneficial Impact of Mineral Content in Spent-Coffee-Ground-Derived Hard Carbon on Sodium-Ion Storage" Materials 17, no. 5: 1016. https://doi.org/10.3390/ma17051016