2.2. Chemisorption of Mixed Thiol Layer on GaAs Surface
Before protein grafting, we checked the organization of a 10% MHDA layer on the GaAs (100) surface.
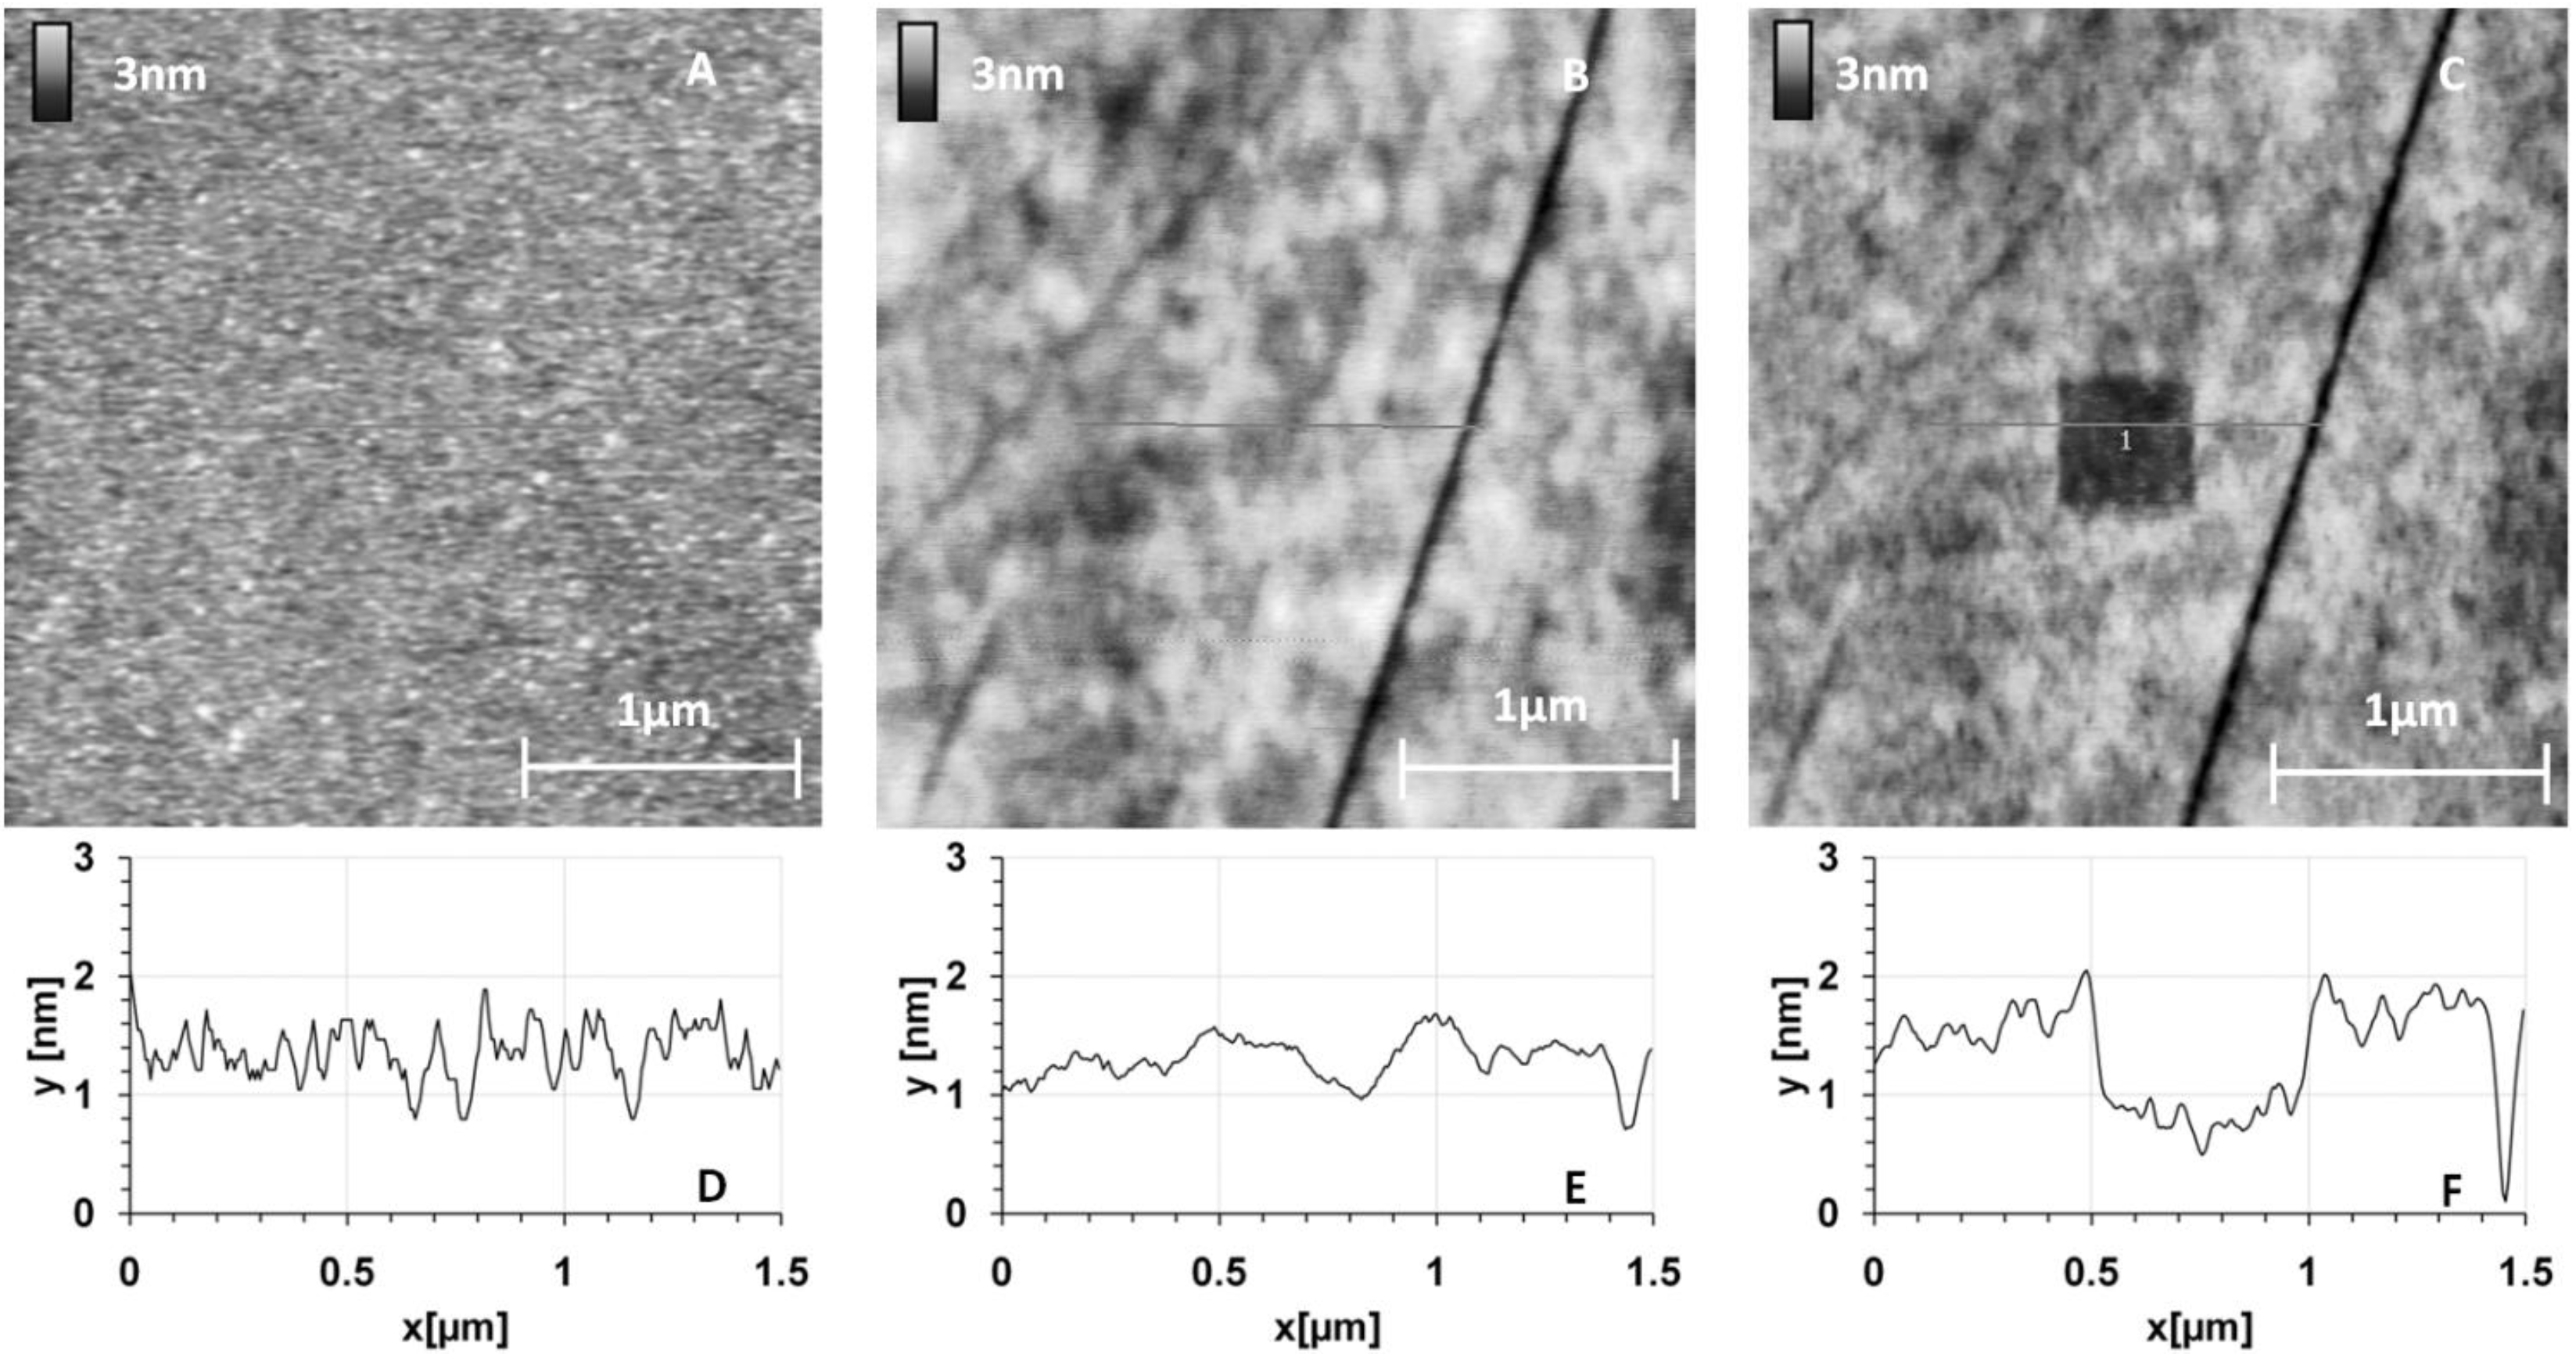
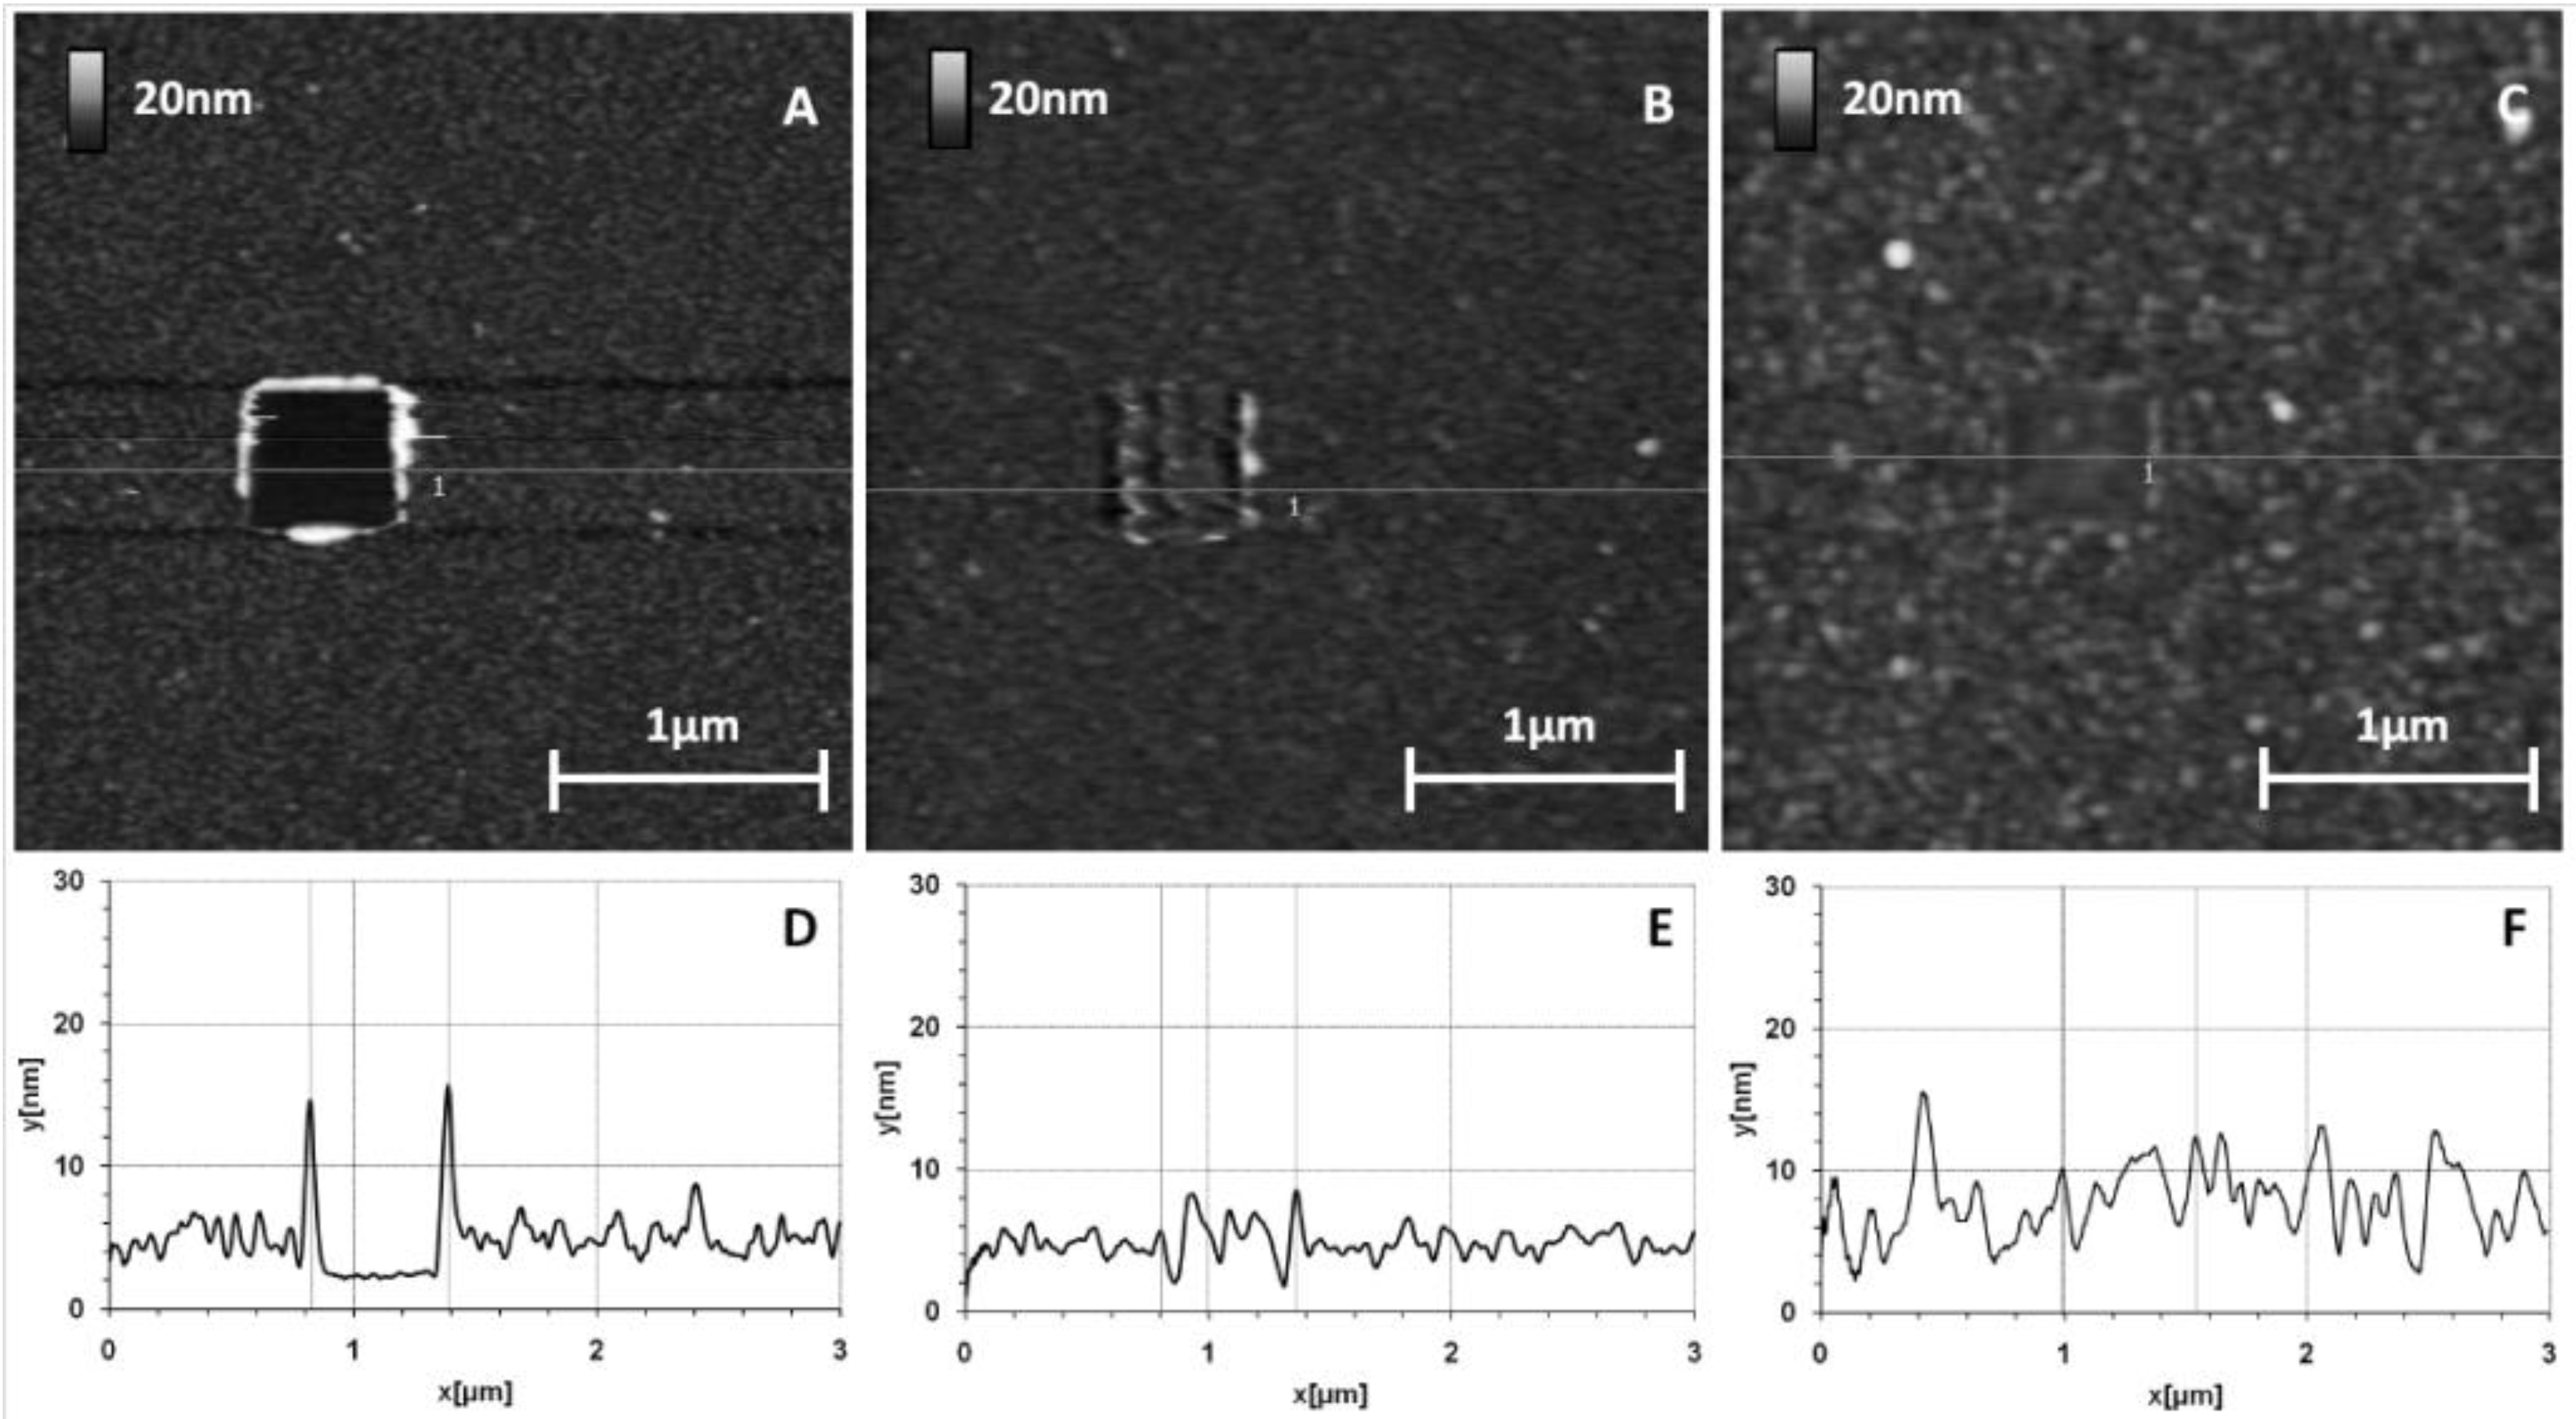
Figure 2 shows the surface topography of this layer.
Figure 2.
GaAs surface before (A) and after (B,C) thiolate functionalization (10% MHDA) and their corresponding sections (respectively D,E,F).
Figure 2.
GaAs surface before (A) and after (B,C) thiolate functionalization (10% MHDA) and their corresponding sections (respectively D,E,F).
Figure 2A shows the initial surface state of a bare GaAs wafer.
Figure 2B,C correspond to the same functionalized GaAs surface, without and with a 500 nm scraped zone respectively. Images of cleaned and functionalized surfaces show a very low roughness (z range 3 nm) corresponding to a highly smooth surface similar to those presented in other publications [
8,
23,
31,
32,
33]. Since the GaAs sample is polished on one side (see experimental section), topography images can reveal the presence of stripes on the substrate. These stripes give the black lines on the AFM images in
Figure 2B,C).
The functionalized surface is even smoother (
Figure 2E), which is confirmed by the decrease in arithmetic average and root mean square roughness values (Ra and RMS respectively), from Ra = 0.23 nm/RMS = 0.32 nm for a naked surface to Ra = 0.18 nm/RMS = 0.23 nm for a chemically functionalized surface. To measure the thickness of this layer, we made a hole by scraping a square of 500 nm width with a stiff cantilever (k = 0.58 N/m) (
Figure 2C). This scraping makes it possible to locally remove the layer of thiols as seen by a well-defined dark square. The section profile (
Figure 2F) highlights the material removal at this place and we observed a layer thickness of approximately 1 nm. Although this method precludes precise estimation of the thickness of the mixed thiol layer and any conclusion regarding its organization or composition, the AFM results tend to demonstrate that a homogeneous mixed thiolate layer has been established. The obtained thickness suggests that this layer is organized as a monolayer because this value is in the same range as those found by Zhou and Walker [
34] with single wavelength ellipsometry (SWE) measurements: 1.7 nm for MHDA and 1.4 nm for MUA (for 11-mercaptoundecanoic acid, a thiolate composed of 11 carbons, terminating with a carboxyl tail group). Then, we used complementary characterization methods like contact angle, ellipsometry and X-ray photoelectron spectroscopy (XPS) to validate the good organization and composition of this chemical layer. These results have previously been published [
28].
2.3. Protein Grafting on the Functionalized GaAs Surface
The protein was covalently grafted to MHDA / MUDO mixed SAM through its amine groups using the EDC/NHS activation of COOH docking sites presented by MHDA molecules. After the incubation of this surface with proteins, followed by a washing step with a 40 mM Octyl Glucoside solution, carboxyl group deactivation was finally performed with ethanolamine. The protein covered surfaces (
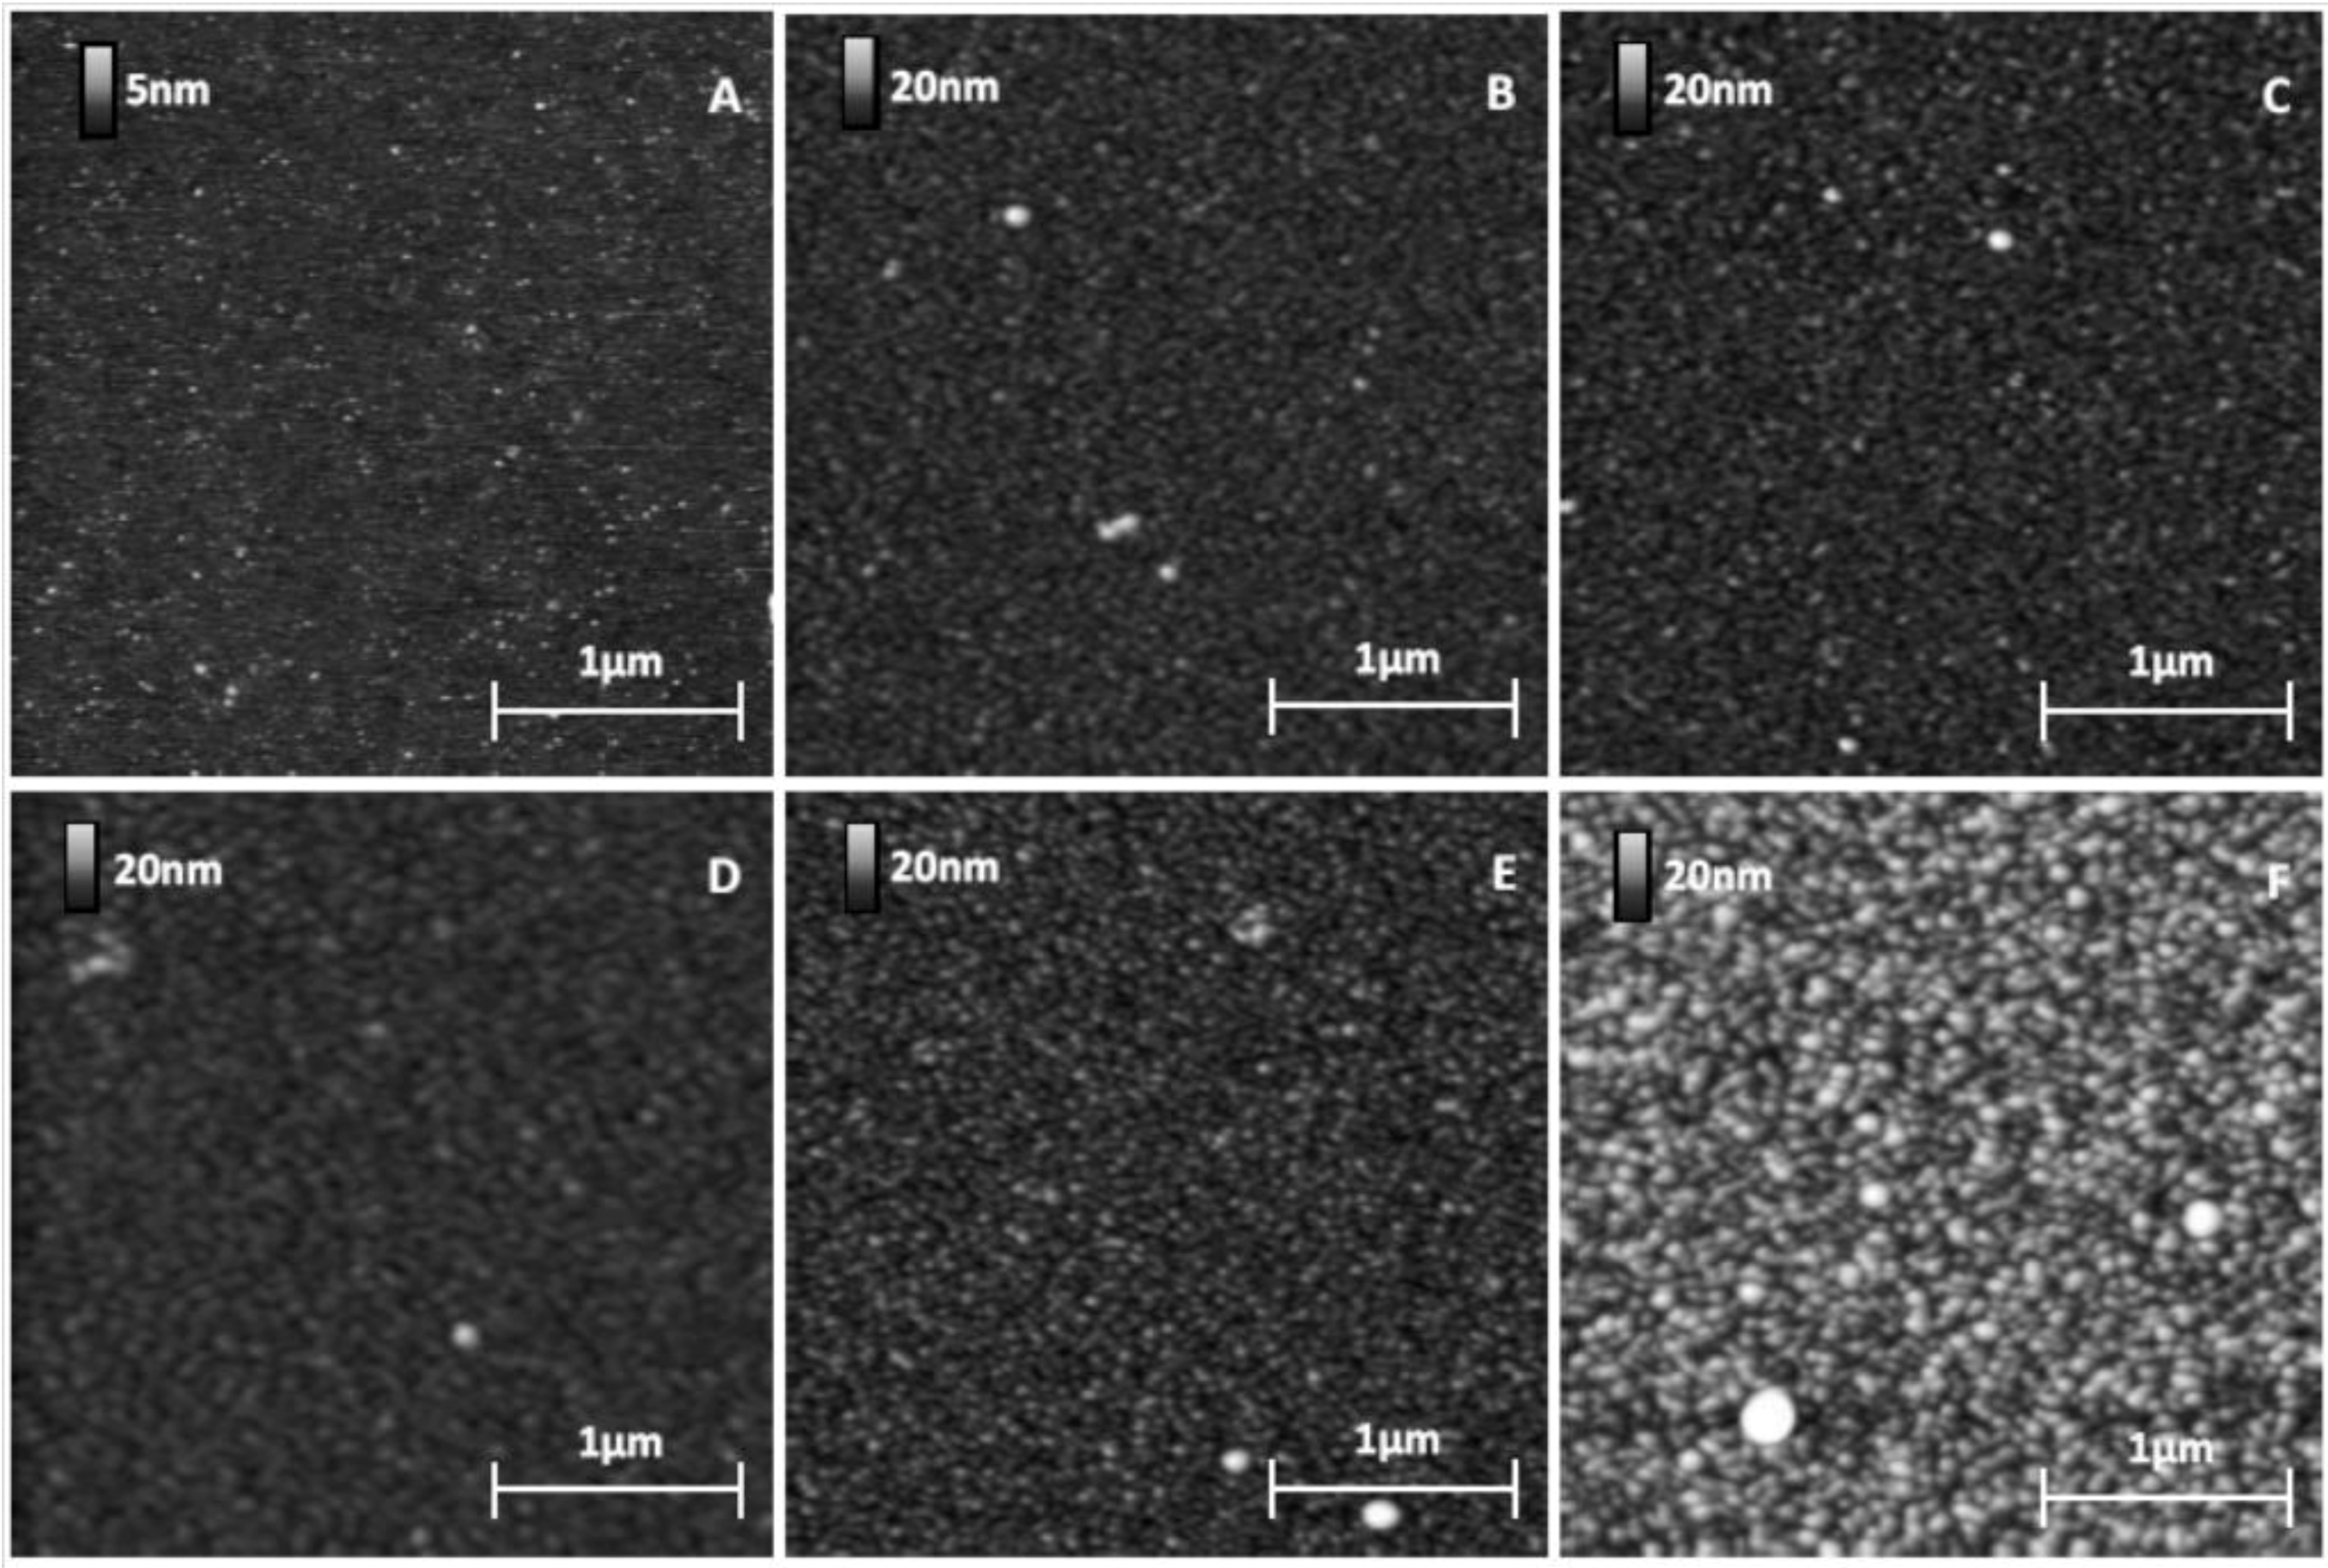
Figure 3D–F) and some references surfaces (
Figure 3A–C) were characterized.
The images (
Figure 3) give results on different chemically modified GaAs surfaces in the same experimental imaging conditions, as regards AFM tips and scan settings. Repeatability and reliability of results were controlled: three samples for each condition were taken, and measurements were performed in different places on each sample. Compared to the reference sample (
Figure 3A), we clearly observed a modification of the GaAs surface after the protein grafting protocol on the different chemically modified substrates. The initial very smooth surface (z range of 5 nm) was modified and the roughness strongly increased after this step (z range of 20 nm for the other samples).
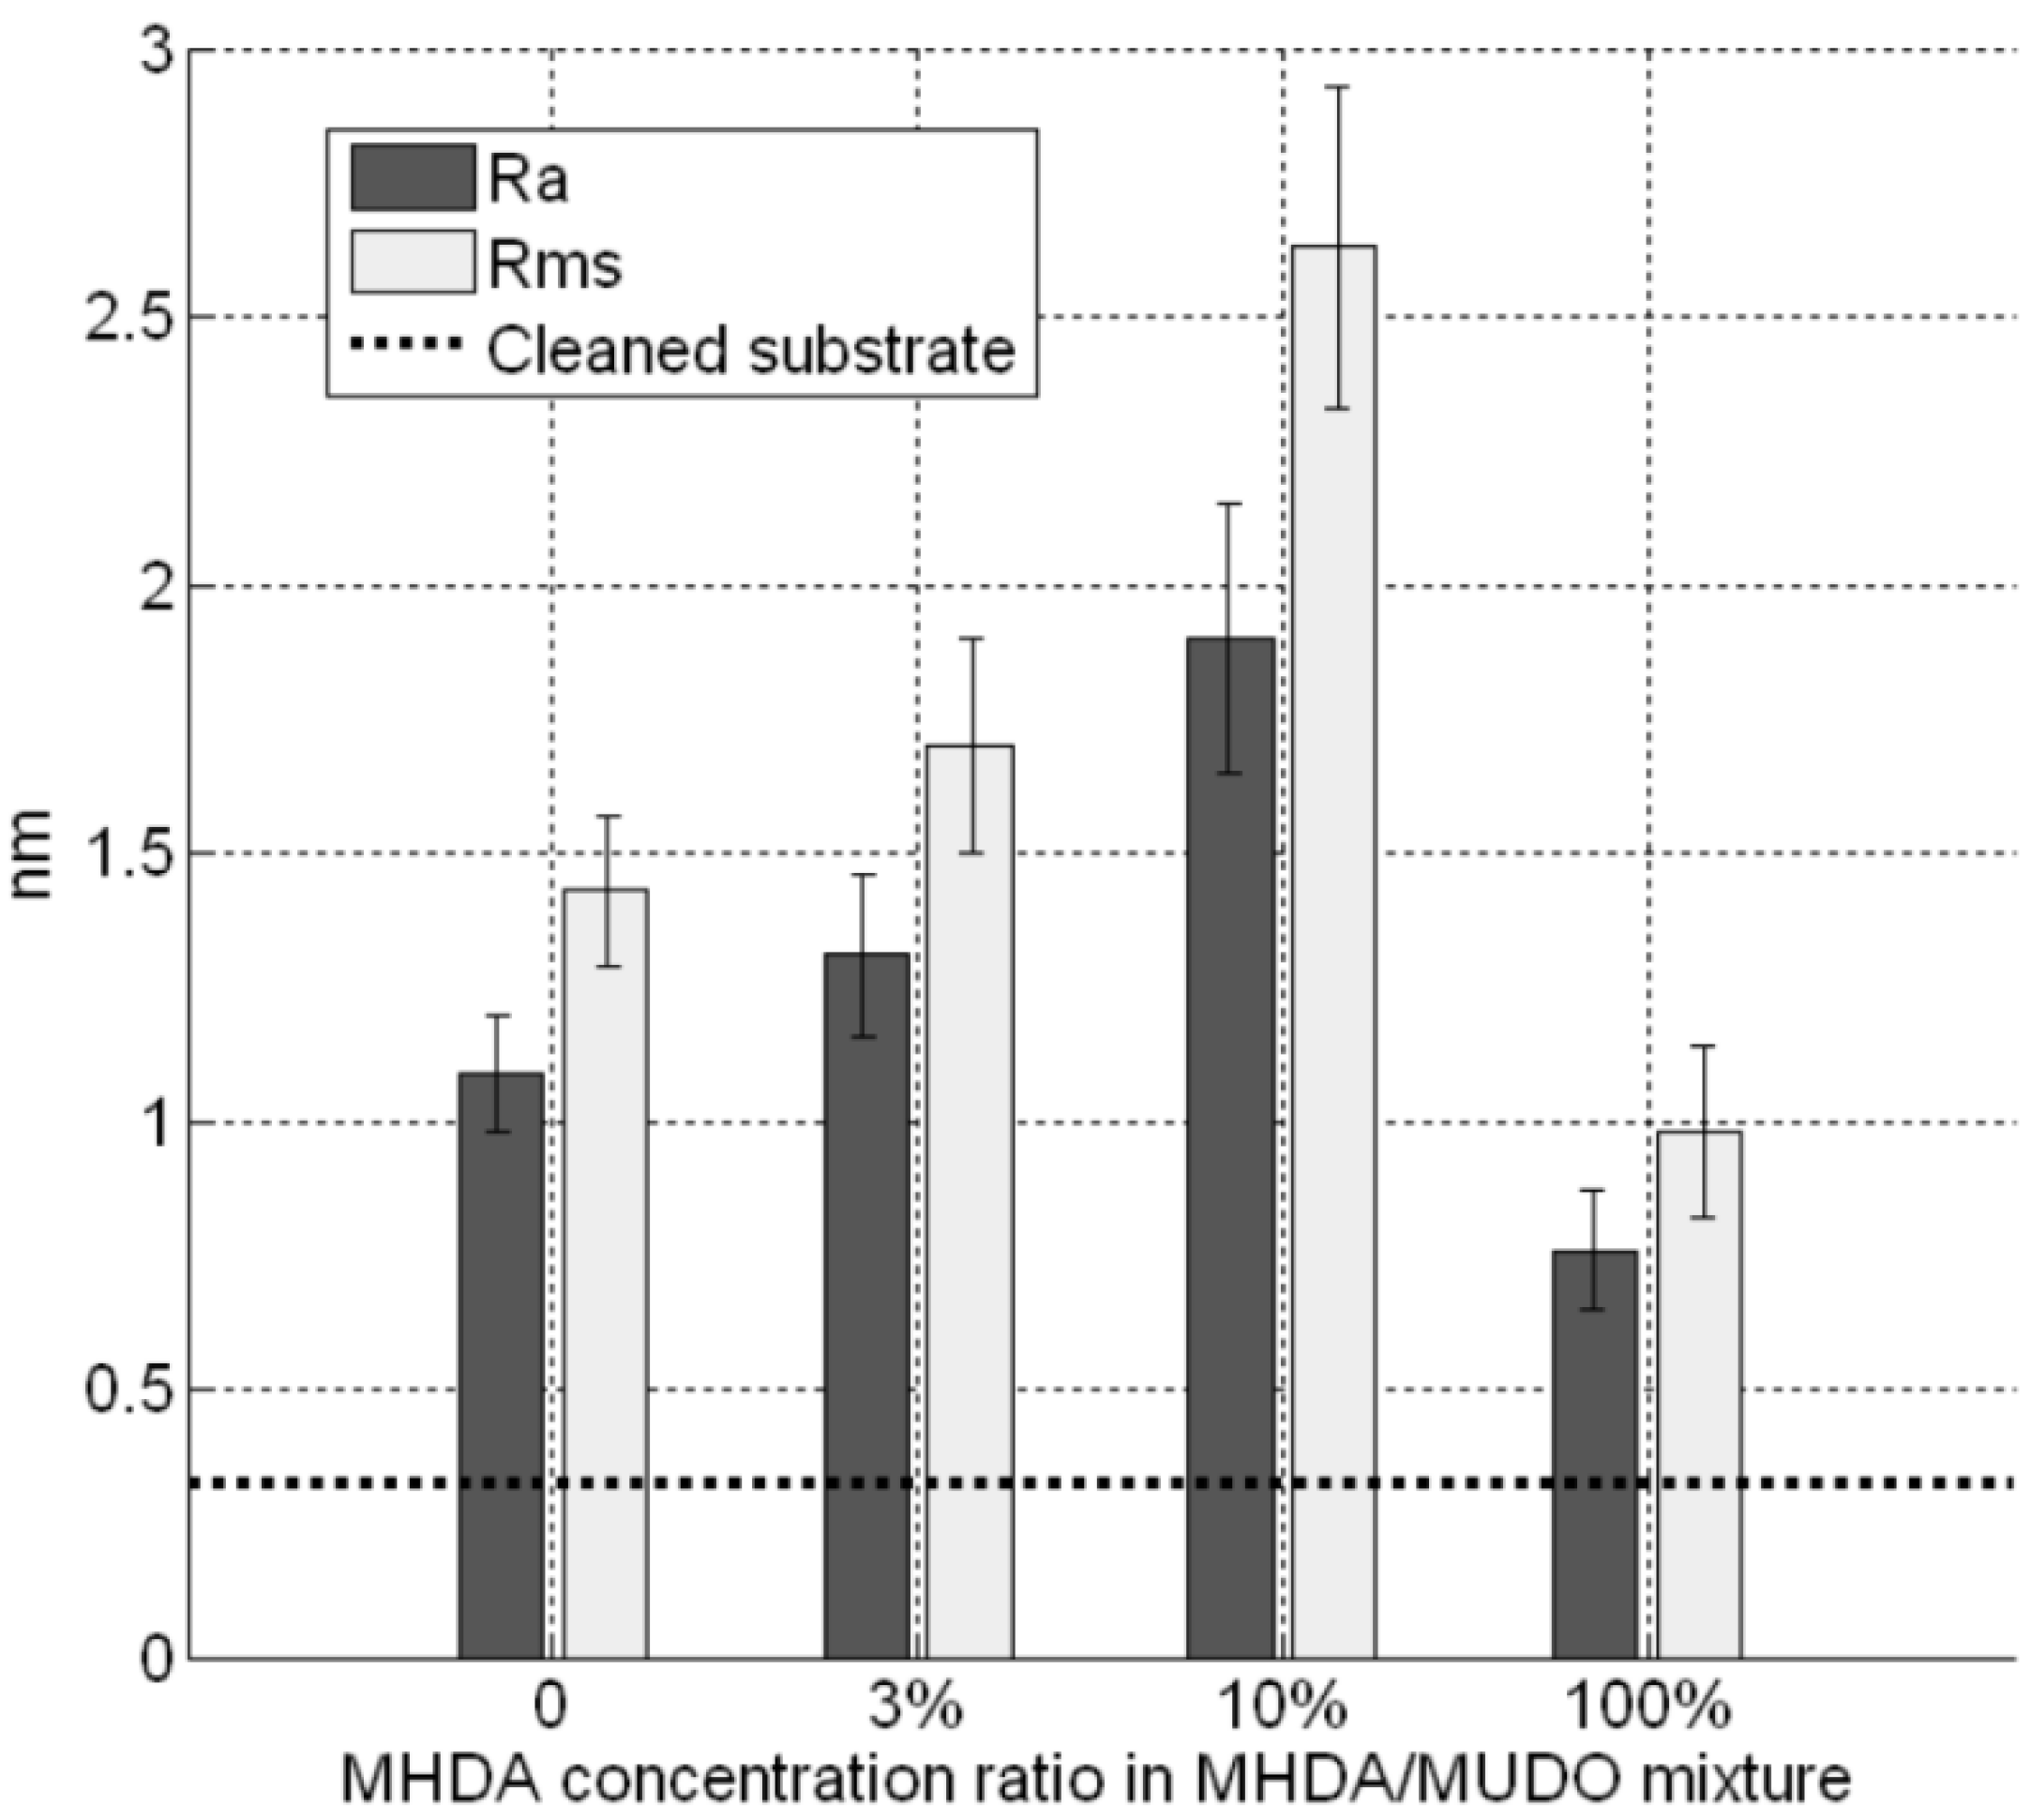
Figure 4 gives RMS values as a function of the MHDA percentage. The unfunctionalized (
Figure 3B) and 0% MHDA (
Figure 3C) surfaces behaved similarly, presenting fine and small grains. These motifs are probably proteins or aggregates of proteins. In spite of the detergent washing, some proteins or aggregates remained absorbed on the surface. Nevertheless, the substitution of some MUDO by MHDA molecules induced a change on the surface topography and bigger motifs were observed in these cases. With the mechanical filtering induced by the tip, the observed motifs had a size between 5 and 15 nm, which is consistent with 3–8 nm RSA protein dimensions [
35]. The 10% MHDA sample shows a highly rough surface compared to the others (RMS = 2.63 nm) and grafted proteins form a dense layer on the GaAs surface. The 3% MHDA covered surface presents an intermediate value of RMS. The 100% MHDA surface shows the least roughness. In this last case, it may be that the presence of supernumerary docking sites (100% MHDA) induced RSA grafting by several sites. These multiple protein-surface bonds could tend to flatten the proteins on the surface, thus smoothing out the surface (RMS = 0.98 nm).
Figure 3.
GaAs surface images before (A) and after protein grafting for several chemical interfaces: unfunctionalized (B); 0% MHDA (C); 100% MHDA (D); 3% MHDA (E); and 10% MHDA (F).
Figure 3.
GaAs surface images before (A) and after protein grafting for several chemical interfaces: unfunctionalized (B); 0% MHDA (C); 100% MHDA (D); 3% MHDA (E); and 10% MHDA (F).
The corresponding interpretation of these roughness values may be due to the number of docking sites offered by the different SAM layers. Indeed, if we assume the protein diameter to be 5 nm, a complete and saturated protein monolayer would give coverage of around 50,000 proteins per µm
2. The density of the thiolate layer is approximately 5 × 10
6 molecules per µm
2, because the surface occupied by a thiol on the GaAs (100) surface is roughly 20 Å
2 [
18,
36]. The surface ratio of thiolates to protein would be 100 thiolates for one protein. Theoretically, with this complementary information, self-assembled monolayers composed of 3%, 10% or 100% MHDA should offer successively 3, 10 and 100 docking sites for one protein. At this stage, we have to keep in mind that the ratio of thiolates in the solution is certainly not respected on the surface, due to several parameters like the thiolate functional groups and their chain length. Moreover, if we consider that MHDA molecules are non-uniformly distributed and that only a part of the carboxyl groups reacts (only 10% of docking sites activated for Ding
et al. [
37]), we can assume that self-assembled monolayers are composed of an insufficient number of docking sites at 3% MHDA, an excess at 100% MHDA and a good compromise at 10% MHDA. Based on the AFM images, the 10% MHDA layer seems to be an ideal ratio to immobilize enough proteins to create a dense protein layer. Similar to our AFM images of RSA grafted on 10% MHDA surface, Duplan
et al. [
32] showed AFM images of immobilized neutravidin (molecules close to RSA in size, with a molecular weight of 60,000 Da,
versus 64,500 Da for RSA) on GaAs modified by polyethylene glycol mixed thiol, and confirmed the ability to form an organized, densely packed protein layer on the GaAs surface. The authors used a ratio of 1/15 (6.66%) biotinylated docking sites distributed in a hydroxyl terminated PEG layer.
Figure 4.
GaAs surface roughness after protein incubation on different chemical interfaces.
Figure 4.
GaAs surface roughness after protein incubation on different chemical interfaces.
2.4. Protein Covalent Binding or Physisorption?
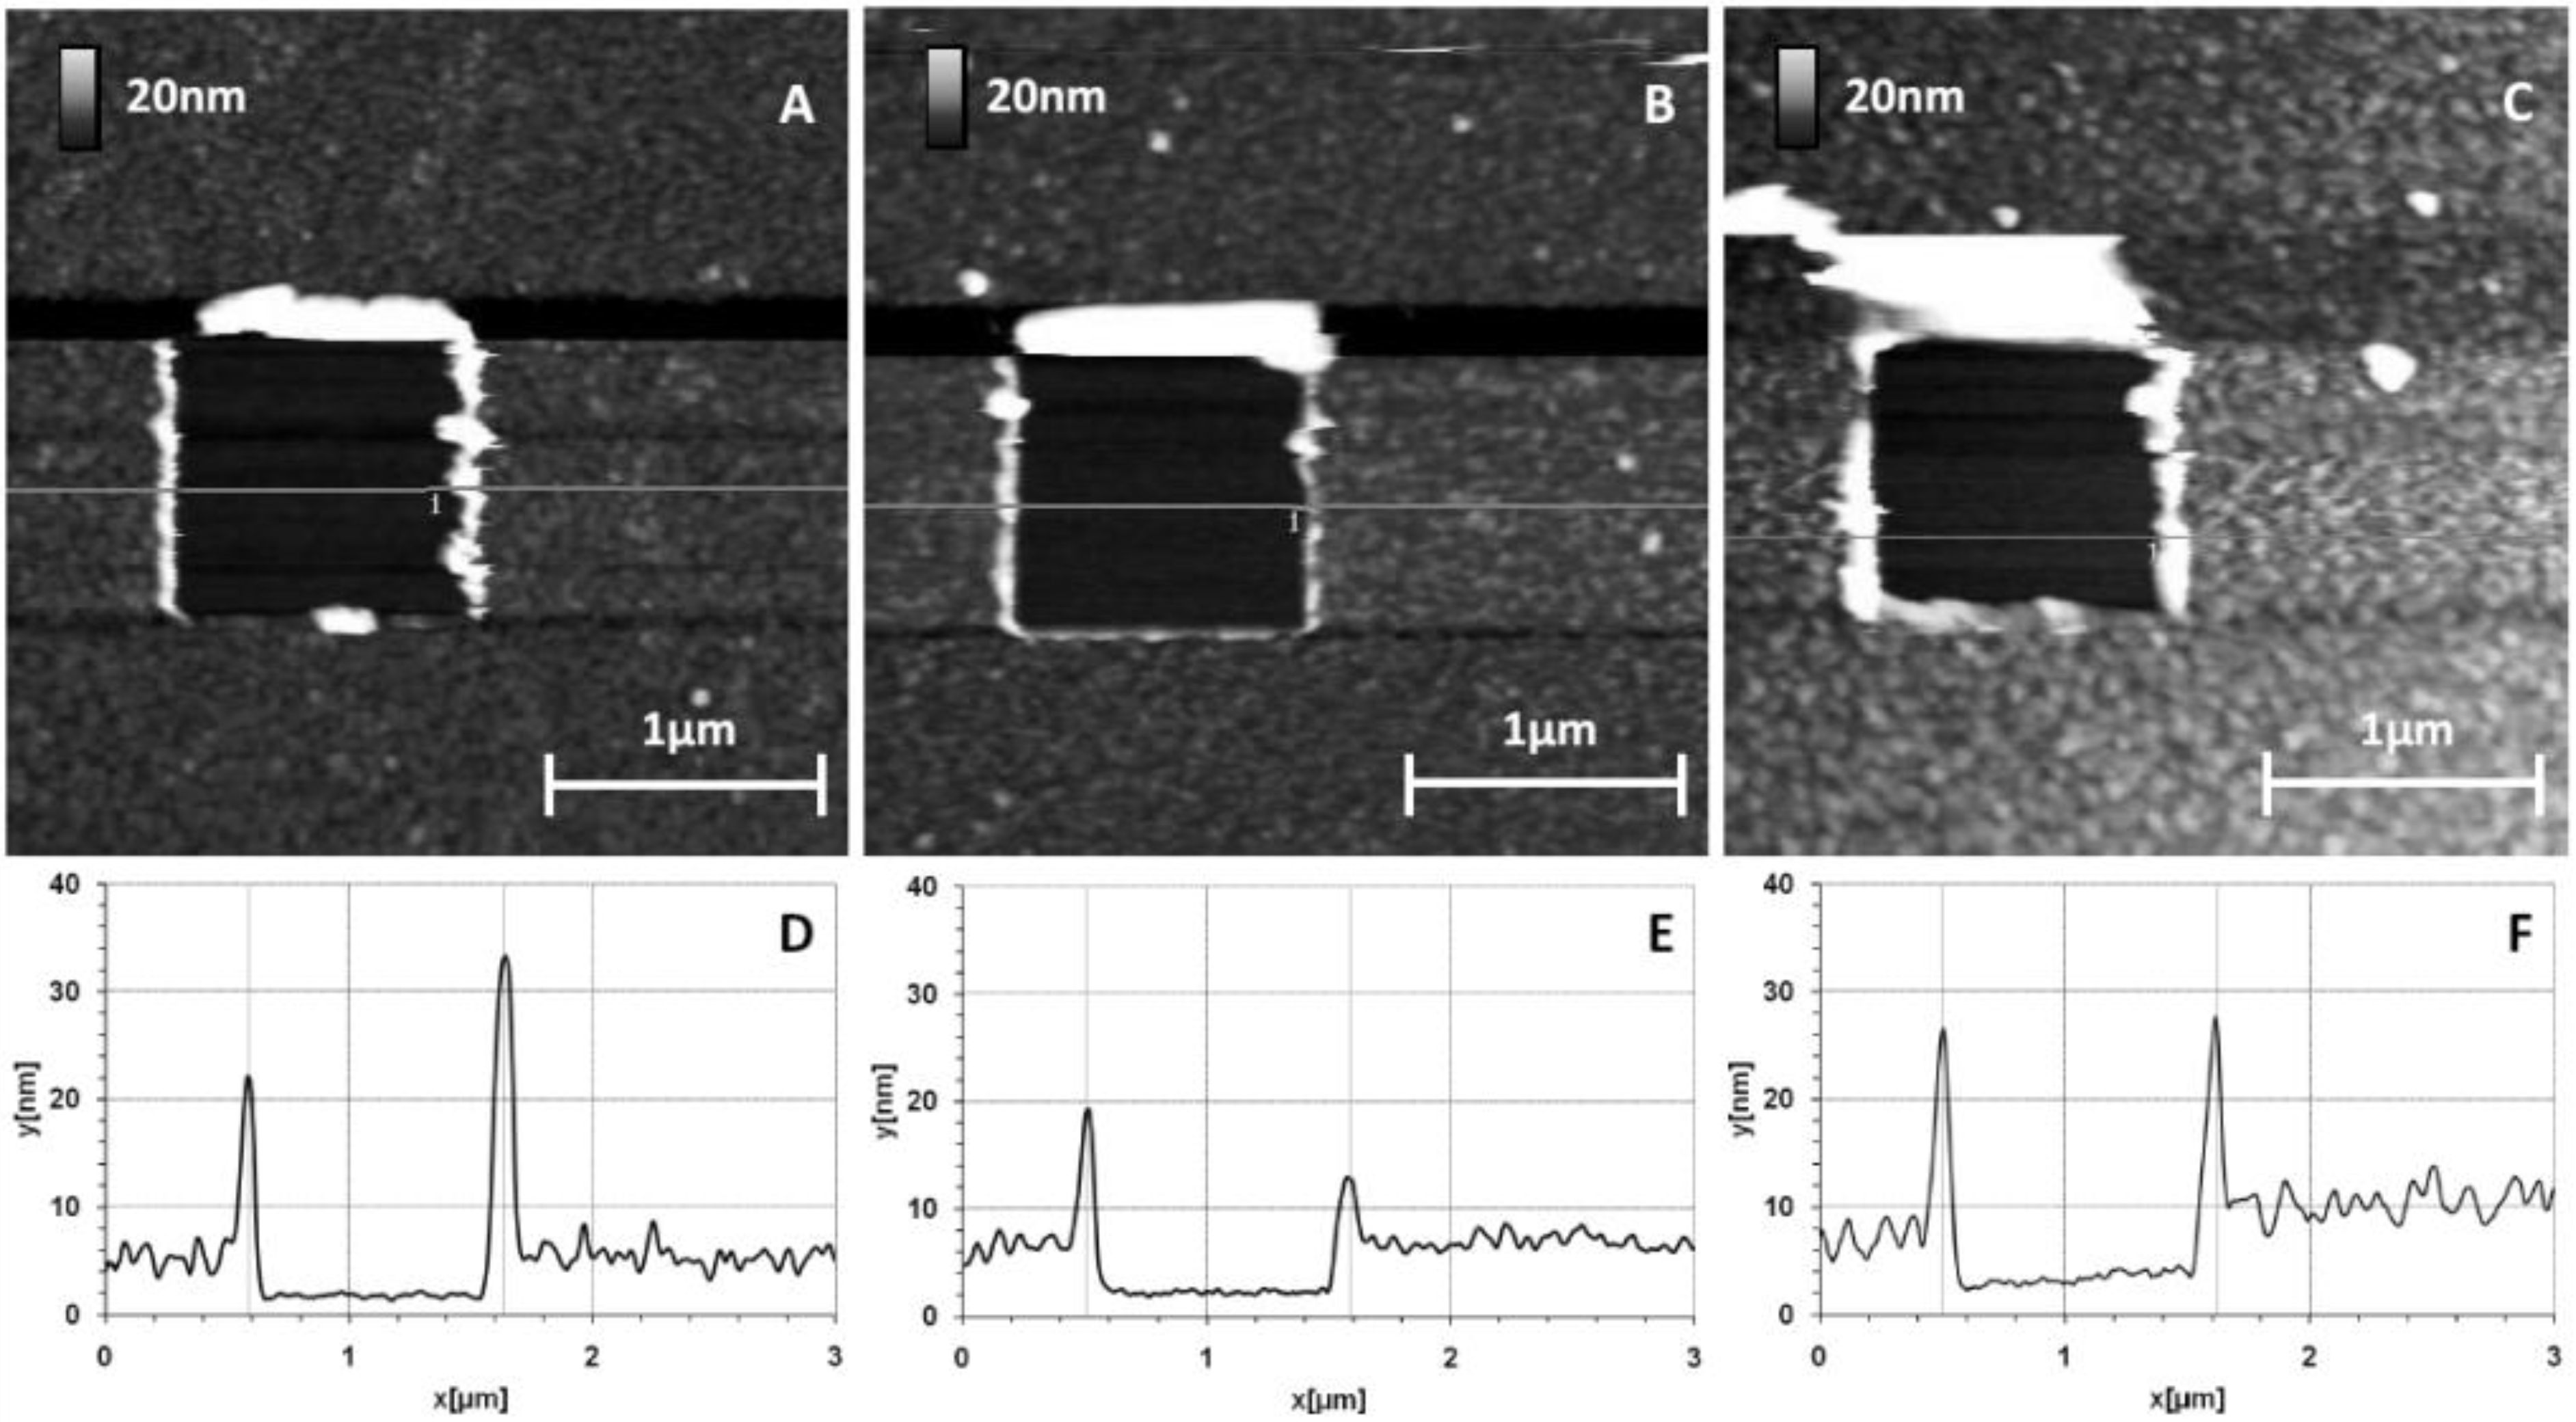
Figure 5 shows surface modifications after the protein deposition step, although the cleaned bare and 0% MHDA functionalized surfaces do not present functional chemical groups able to fix protein. To highlight the binding properties between the protein and each chemically modified surface, we tried to scratch the protein and thiolate layers by applying a controlled contact force with the tip on the surface. As explained in the experimental section, various AFM tips were used to apply medium or strong scraping tests. The applied force on the sample was adjusted by varying the contact setpoint and the same settings were used for each sample. A first set of tests was performed by applying a moderate force on the surface (scraping zone of 500 nm by 500 nm) thanks to a medium stiff tip (NPS10-B, k = 0.12 N/m). Results are reported in
Figure 5.
We observed that:
(i) The 0% MHDA and bare substrate surface (not presented) have the same typical physisorption behavior when incubated with the protein solution. The gallium arsenide surface is known to be attractive for protein adsorption but in our experiments, the GaAs side was relatively poorly covered after protein incubation, probably due to the efficiency of OG washing, as shown previously by Ding
et al. [
37]. On AFM images obtained on naked GaAs surfaces (data not shown), the step between the protein layer and the substrate was almost invisible and the rolls were very small. The GaAs naked surface does not seem to adsorb a lot of RSA protein.
(ii) On MUDO functionalized GaAs surfaces, the deposited proteins were easily scratched by this test and a square zone 500 nm wide and 3.5 nm thick appeared. On the sides of this square, we observed rolls corresponding to a heap of proteins displaced by the tip. The visible rolls prove that proteins are present on MUDO surfaces, but only weakly adsorbed since they are easily removed from the surface by a medium scraping test.
(iii) On the contrary, the 100% MHDA surface is not fundamentally affected by this scraping test. In the scraped zone, the surface appears “compacted” and the molecules appear to be stretched but not removed under the force applied by the tip. As the consequences of the scraping were limited to the apparent spreading (without pulling off) of molecules, it tends to prove that proteins are strongly attached to the GaAs substrate.
Figure 5.
Atomic force microscopy (AFM) images of medium scrapings (stiff tip k = 0.12 N/m) applied on GaAs bio-functionalized surfaces and corresponding sections: 0% MHDA (A,D); 100% MHDA (B,E); and 10% MHDA (C,F).
Figure 5.
Atomic force microscopy (AFM) images of medium scrapings (stiff tip k = 0.12 N/m) applied on GaAs bio-functionalized surfaces and corresponding sections: 0% MHDA (A,D); 100% MHDA (B,E); and 10% MHDA (C,F).
The mixed layer containing 10% MHDA behaved similarly to 100% MHDA: the surface on the scraped zone appeared “compacted” with molecules that stayed on the surface while applying moderate force. Surprisingly, only 10% MHDA thus seems sufficient to toggle to a strongly bound protein layer. This result highlights the covalent binding that exists between the substrate and the protein, when MHDA molecules constitute the chemical interface.
On the section of
Figure 5D, corresponding to the 0% MHDA surface, we show the height of rolls due to the scraping. The considerable height (10–15 nm) is evidence of the material having been removed from the scraped zone. At the bottom of this 500 nm wide hole, we observed a very flat surface corresponding to the GaAs substrate, and we measured a protein layer thickness of 3.5 nm (see explanation below for strong scraping and
Figure 6).
The protein adsorption observed on the 0% MHDA layer is surprising because the hydroxyl tail group of MUDO is known to limit non-specific adsorption compared to other tail groups, and the OG washing should have completely removed the protein on the bare substrate. Recent articles [
18,
29,
38,
39] provide a possible explanation for this phenomenon. The length of the MUDO alkane chain, composed of 11 carbon atoms, is relatively short and it seems that a chain of 15 or 16 carbon atoms is the minimum chain length required to obtain a high degree of self-organization. This disorganization in the MUDO layer could then induce a sort of “porous” and loose chemical layer, in which aliphatic chains could interact with proteins through hydrophobic interactions. The addition of MHDA molecules (16 carbon atoms) in the functionalization process seems to facilitate the formation of a more densely packed protein layer, because no pulling-off at all was observed on mixed and 100% MHDA layers, as can be seen in
Figure 5B,C.
2.5. Thickness of the Combined Thiol/Protein Layer
Additional scraping experiments were performed in order to totally remove the grafted protein layer and the thiol chemical interface. Similar experiments as in the previous section were performed, on a square area of 1 µm wide using the stiffest tip, an NPS10-A (
k = 0.58 N/m). The force applied was considerably greater with this approach. The images and corresponding sections are presented in
Figure 6.
Figure 6.
AFM images after strong scraping applied to GaAs biofunctionalized surfaces. Images and corresponding sections: 0% MHDA (A,D); 100% MHDA (B,E); and 10% MHDA (C,F).
Figure 6.
AFM images after strong scraping applied to GaAs biofunctionalized surfaces. Images and corresponding sections: 0% MHDA (A,D); 100% MHDA (B,E); and 10% MHDA (C,F).
For each surface, the thiolate/protein layers were scratched and we observed a well-defined square of 1µm wide corresponding to the scraped zone. For bare substrate (not presented) and 0% MHDA (
Figure 6A), the images are identical to these obtained by the first medium-scraping test, supporting the idea that the protein layer is just adsorbed on the surface and is not strongly fixed. Applying a high force made it possible to remove materials from the surfaces composed of 100% MHDA (
Figure 6B) and mixed interfaces (3% MHDA (data not shown), 10% MHDA (
Figure 6C)). Large rolls were formed around the scraped zone, proving the displacement of proteins and probably of thiolate molecules. The volume of this roll makes it possible to establish a comparison of the quantity of scraped molecules. Cleaned bare substrate (not presented), 0% MHDA (
Figure 6A), 100% MHDA (
Figure 6B), 3% MHDA (not presented) and 10% MHDA (
Figure 6C) show, in this order, the smallest to largest roll of scratched molecules. The corresponding sections of these images are presented in
Figure 6D–F. In the scraping zone, we observe similar flat surfaces. In order to analyze the roughness of these flat surfaces, we performed cross-sections inside and outside the scraped zone. The corresponding RMS values are reported in
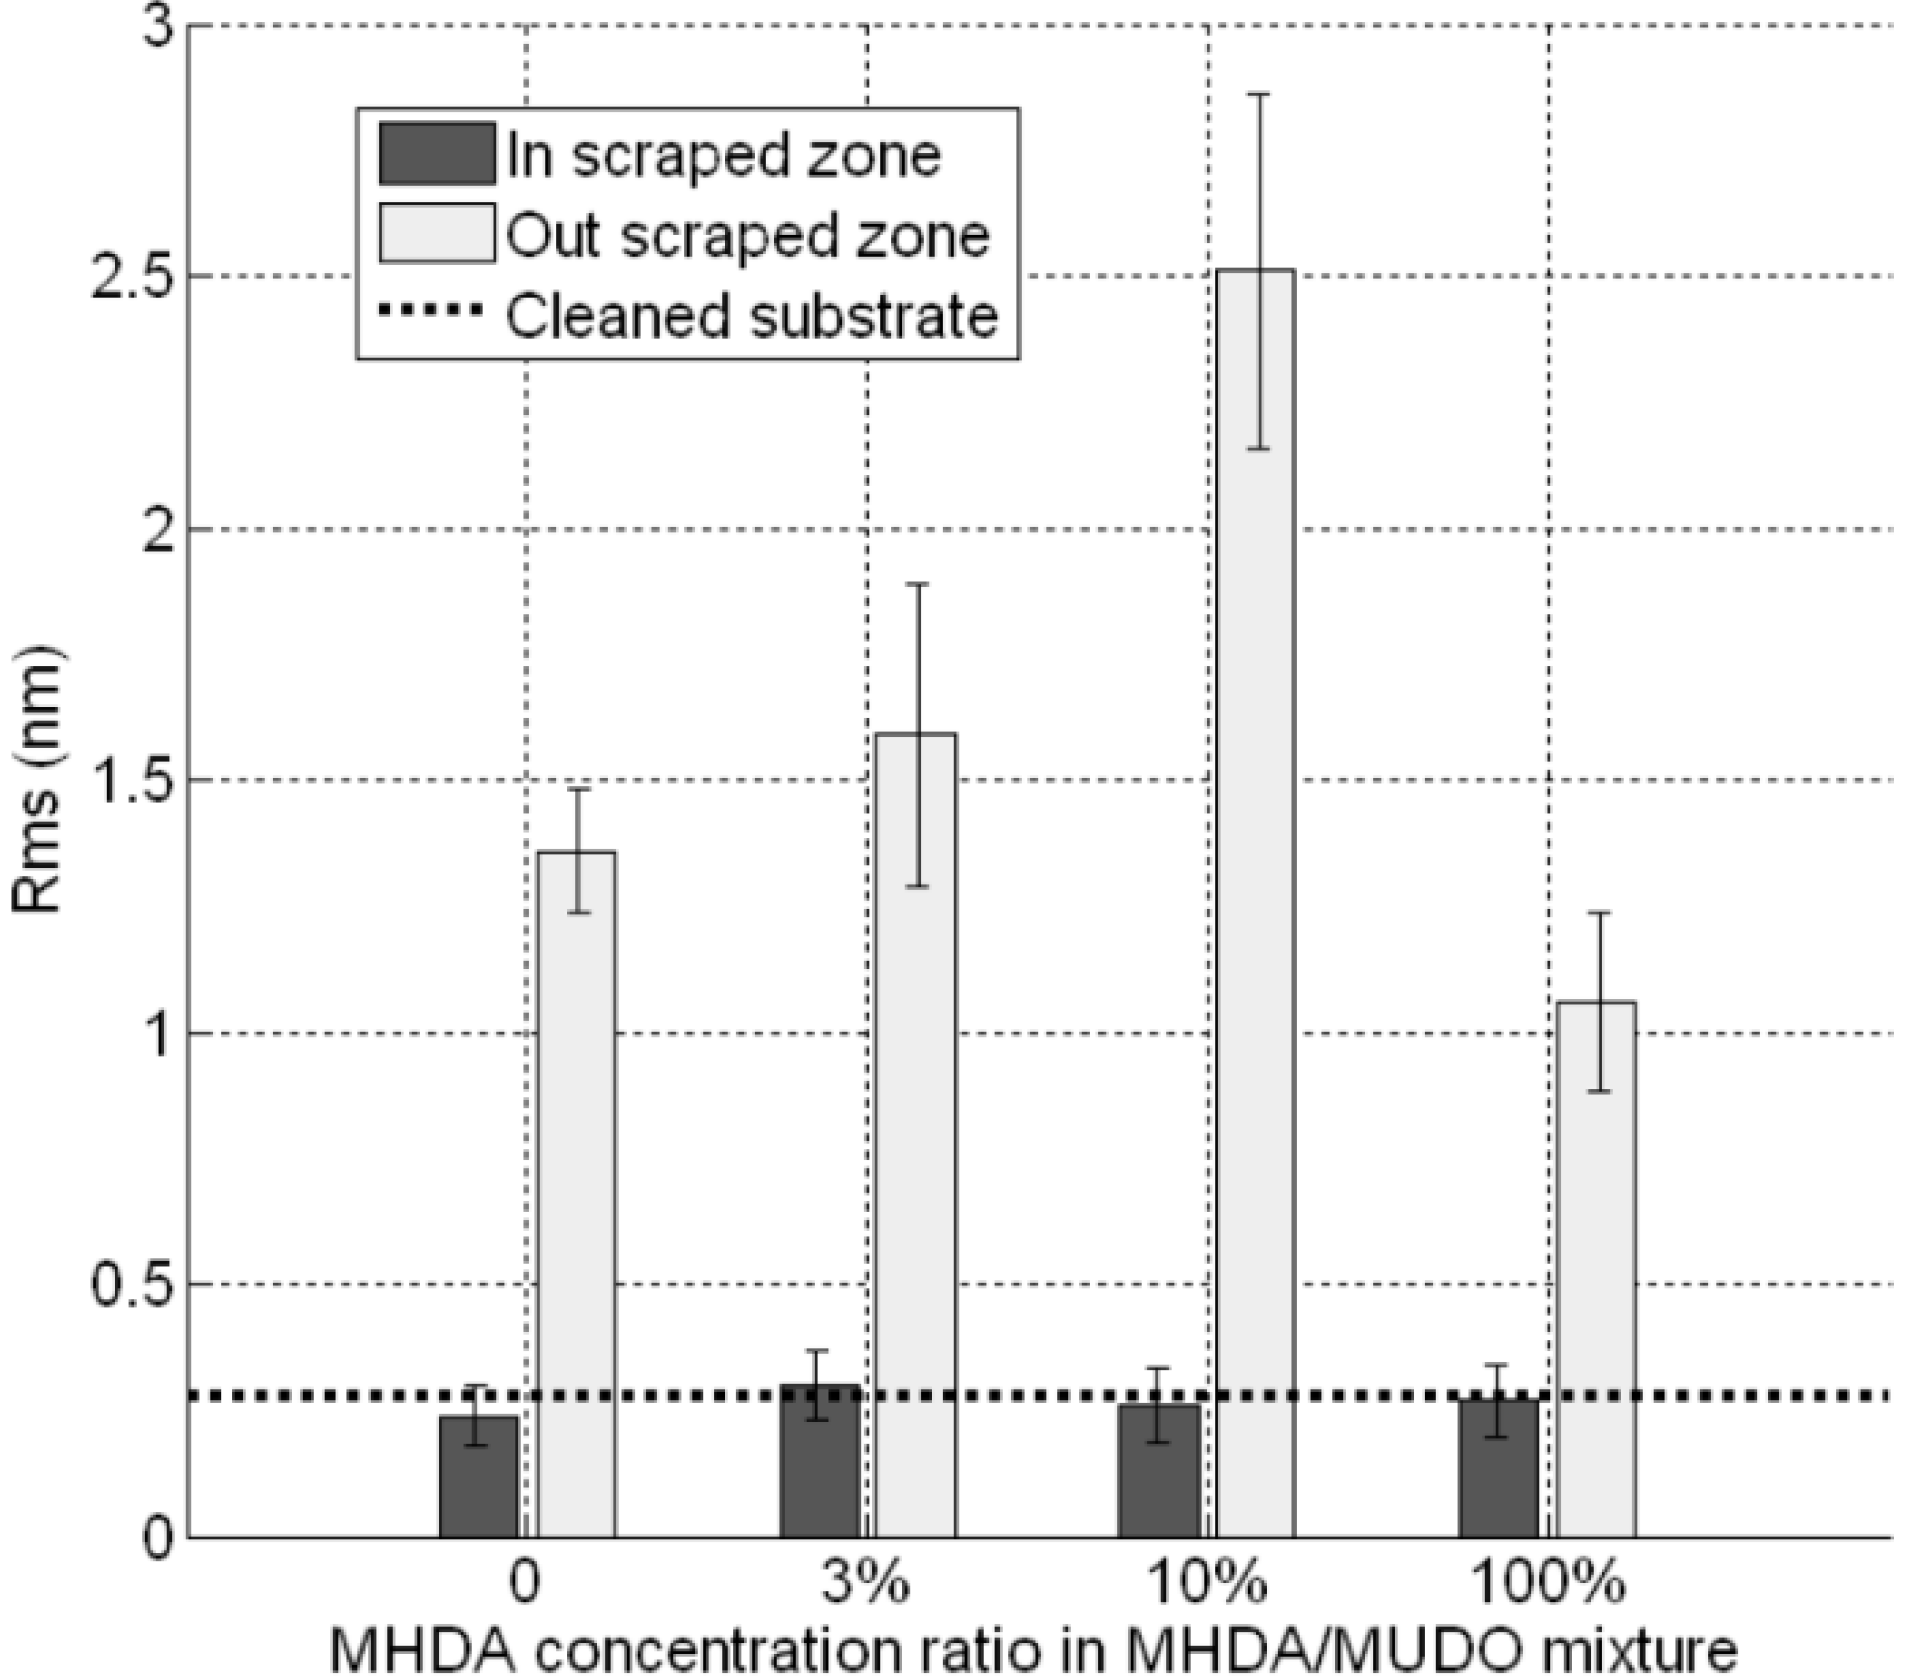
Figure 7.
Figure 7.
RMS values of protein modified GaAs surfaces, inside and outside the scraped zones, for each chemically modified GaAs interface.
Figure 7.
RMS values of protein modified GaAs surfaces, inside and outside the scraped zones, for each chemically modified GaAs interface.
As expected, outside the scraped zone, the RMS values are similar to these obtained in
Figure 4. This result demonstrates the reproducibility of our GaAs biofunctionalization process. In the scraped zones, RMS values are approximately equal to 0.3 nm, which corresponds to the initial roughness of unfunctionalized substrate (dotted line). This result would indicate that, with the high force applied here, we scratched both thiolate and protein layers. Similarly, we measured the thickness of the bio-interface (
Figure 8). The 0% MHDA profile (
Figure 6D) is similar to
Figure 5D and the average thickness of the layer is 3.5 nm (
Figure 6D). This again highlights the reproducibility of our surface biofunctionalization process. The 100% MHDA sample presents a thickness of 4.4 nm (
Figure 6E); mixed surfaces have a thickness of 4 nm and 5.8 nm for 3% MHDA and 10% MHDA (
Figure 6F) respectively.
These thickness values could correspond to the superposition of the two layers: a 1.5 nm thin thiol layer [
34] and the Rat Serum Albumin (RSA) protein layer [
35]. The highest value, obtained at 10% MHDA, is in agreement with previous experiments, because the protein molecules do not tend to flatten on the surface due to the proximity of other neighboring RSA proteins. These results are in line with previous observations, namely:
The 0% MHDA surface allows protein adsorption.
The 100% MHDA surface presents a number of docking sites in excess of those required to obtain a protein monolayer. Indeed, on highly dense MHDA covered surfaces, proteins could graft to the surface, by engaging multiple free primary amine groups. The consequence of this could be the flattening of the protein on the surface.
The 3% MHDA surface is certainly limited in terms of number of docking sites, thereby reducing the density of protein coverage on this surface.
The 10% MHDA surface appears to be the best candidate, since this surface allows grafting of a dense, homogeneous and stable layer of proteins, and the number of docking sites appears to be well adapted for a biosensor interface.
Figure 8.
Thickness of the combined thiolate and protein layer, measured for each chemical interface.
Figure 8.
Thickness of the combined thiolate and protein layer, measured for each chemical interface.
2.6. In Situ MALDI-TOF MS Analysis on GaAs Surfaces Modified by Proteins: Identification and Quantitative Distribution
In parallel to AFM characterization of protein modified GaAs surfaces, we performed mass spectrometry analysis, in order to analyze the potential of the proteins present on GaAs to be ionized and identified. To this end, we split each GaAs sample into two parts to perform, firstly, AFM characterization, and secondly, mass spectrometry analysis. With these measurements, we aimed to investigate the correlation between the density of motifs observed by AFM and the MS signal intensity of the protein. The MS results yielded qualitative information regarding the protein layer coverage on the different chemically modified GaAs surfaces. Moreover, thanks to automatic measurements at different places on the whole surface, we were able to perform quantitative comparisons between each sample. This AFM/MALDI-MS coupled analysis is truly original, since, without the need for labeling, it provides complementary qualitative information beyond that obtained by photoluminescence [
5,
40] or labeled techniques like fluorescence [
32,
37,
40].
The surface preparation, consisting of spraying TCEP, trypsin and HCCA matrix on the GaAs modified surfaces, was done on the whole surface, corresponding to a square area of 10 mm width. Afterwards, we screened the whole surface pitch by pitch with MS measurements to verify the homogeneity of protein coverage. Each pitch of this test is defined by a 120 µm wide square, composed of 2000 shots randomly distributed at steps of 20 µm. Among these measurements, we chose one position on each chip that showed the highest signal intensity. The protein generated trypsin fragments were matched to a database sequence. The protein having the closest peptide sequence was defined as the identified protein. A score, based on Mascot algorithm, was then attributed. This algorithm evaluates the probability that the identified protein is not a random match,
i.e. that the identified protein is unambiguously the right one. In the same way, a Mascot score was attributed for MS
2 analysis, to compare detected and theoretical fragmentations of a specific peptide (here the 1960 Da peptide).
Table 1 summarizes these results.
Table 1.
MS and MS2 results obtained on protein modified GaAs substrates.
Table 1.
MS and MS2 results obtained on protein modified GaAs substrates.
| MHDA concentration | MS | MS2 (peptide 1960 Da)
Mascot score |
| Identified protein | Matched peptides | Mascot score |
| Bare substrate | – | – | – | – |
| 0% | RSA | 8 | 85.8 | 16.42 |
| 3% | RSA | 8 | 66.9 | 21.78 |
| 10% | RSA | 9 | 87 | 59.92 |
| 100% | RSA | 10 | 101 | 17.68 |
The RSA protein was identified on each surface, except on bare GaAs substrate. The unfunctionalized sample spectra do not exhibit peaks, proving that RSA protein was not adsorbed on the bare GaAs surface. For other MHDA/MUDO surfaces, the mascot scores were significant for all GaAs substrates, which confirms that the motifs observed by AFM truly correspond to RSA proteins. Among eight peptides matched on 0% MHDA and 3% MHDA samples, only one peptide differed between samples. This could partly explain the lowest score of RSA identification on the 3% MHDA sample. For 10% MHDA, the sequence covered was the combination of the two spectra detected on the 0% MHDA and 3% MHDA samples, therefore increasing the score. The addition of the 983.6 Da matched peptide to this sequence resulted in the 100% MHDA surface having the highest score. The mascot score obtained and the number of matched peptides with GaAs substrates were close to the values obtained on a gold reference chip with the same biofunctionalization protocol.
The MS
2 measurements were performed on each functionalized chip. Mascot scores were calculated for the 1960 Da peptide, which is a specific peptide of RSA protein. A score of 60 was obtained on the 10% MHDA sample, but the score was around 20 for the other functionalized GaAs chips. The score obtained at 10% MHDA was the same as on the gold reference chip, providing unambiguous proof of the presence of the peptide 1960 Da on the surface, and highlighting that it is possible to investigate peptides
in situ on the GaAs surface. The MS
2 spectrum of this surface is presented in
Figure 9.
If the MS intensity of peak 1960 Da (
Figure 10) reflected the amount of this peptide present on the surface, we would get the highest MS
2 score for 0% MHDA, a medium MS
2 score for 10% MHDA, and low MS
2 scores for 3% and 100% MHDA. Our results (
Table 2, fifth column) seem to follow this pattern, except for the 0% MHDA surface, which gave the lowest score. This low value indicates that there are many species that are not attributed to this 1960 Da peak, giving us reason to think that this chemically modified surface induces perturbations in either protein fragmentation or peptide desorption, or even both.
Figure 9.
MS2 analysis of the 1960 Da peak on GaAs (100) functionalized with 10% MHDA after Rat Serum Albumin (RSA) grafting.
Figure 9.
MS2 analysis of the 1960 Da peak on GaAs (100) functionalized with 10% MHDA after Rat Serum Albumin (RSA) grafting.
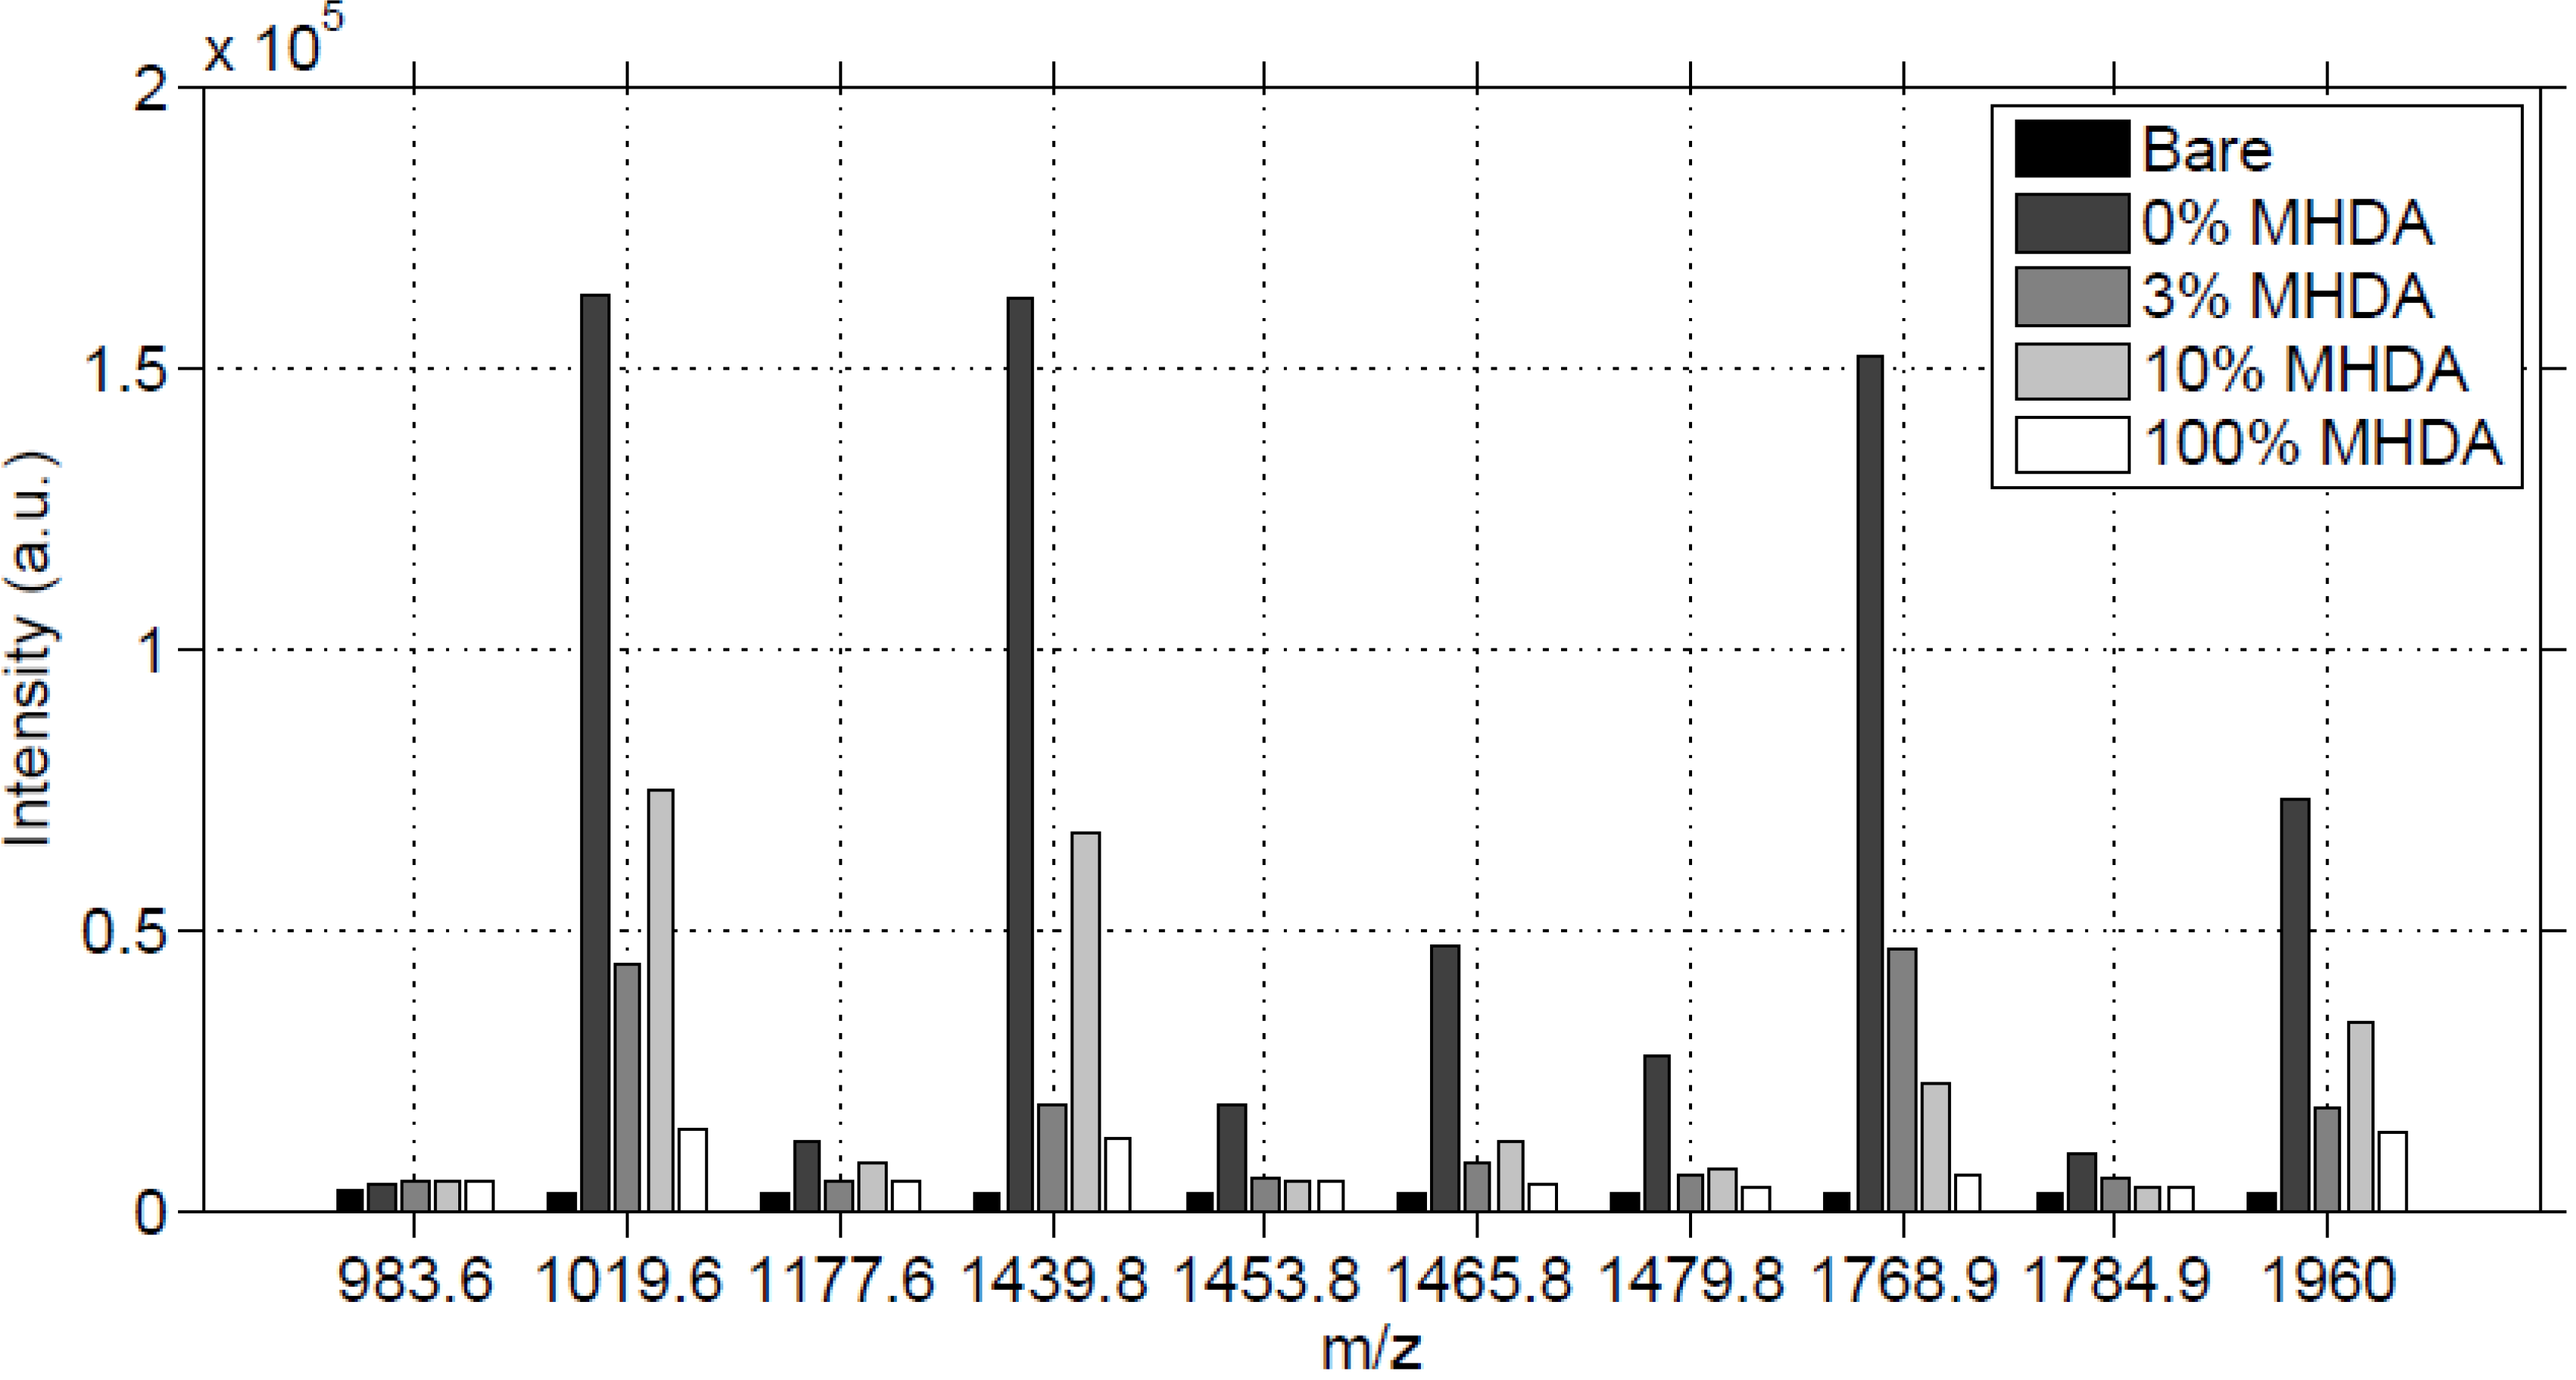
Using the same experimental conditions, on a 2 mm by 2 mm defined area, we obtained semi-quantitative characterization of the protein interface on the GaAs surface, through the comparison of the matched peptide intensities. On each protein-modified GaAs surface, we collected a matrix of 17 by 17 MS spectra with the previous shooting conditions, and we summed the intensities of each matched peptide peak. The result is reported in
Figure 10.
Figure 10.
Sum of MS intensities for each matched peak, obtained on 2mm by 2mm unmodified (bare) and functionalized GaAs surfaces, after incubation in the RSA solution.
Figure 10.
Sum of MS intensities for each matched peak, obtained on 2mm by 2mm unmodified (bare) and functionalized GaAs surfaces, after incubation in the RSA solution.
In
Figure 10, for most of the MS peaks, we observed a high intensity for 0% MHDA, a medium intensity for 10% MHDA and low intensities for 3% and 100% MHDA. The bare substrate gives a noise reference and the low intensities of its peaks show once again that no RSA protein was adsorbed, proving the efficiency of the washing protocol. The highest intensity of the 0% MHDA surface is very surprising, meaning that this MUDO interface would authorize albumin non-specific interactions. Even after the OG washing step on this MUDO surface, proteins remained stuck on it. Probably the presence of hydroxyl terminal groups on MUDO enables the establishment of weak but numerous interactions with proteins.
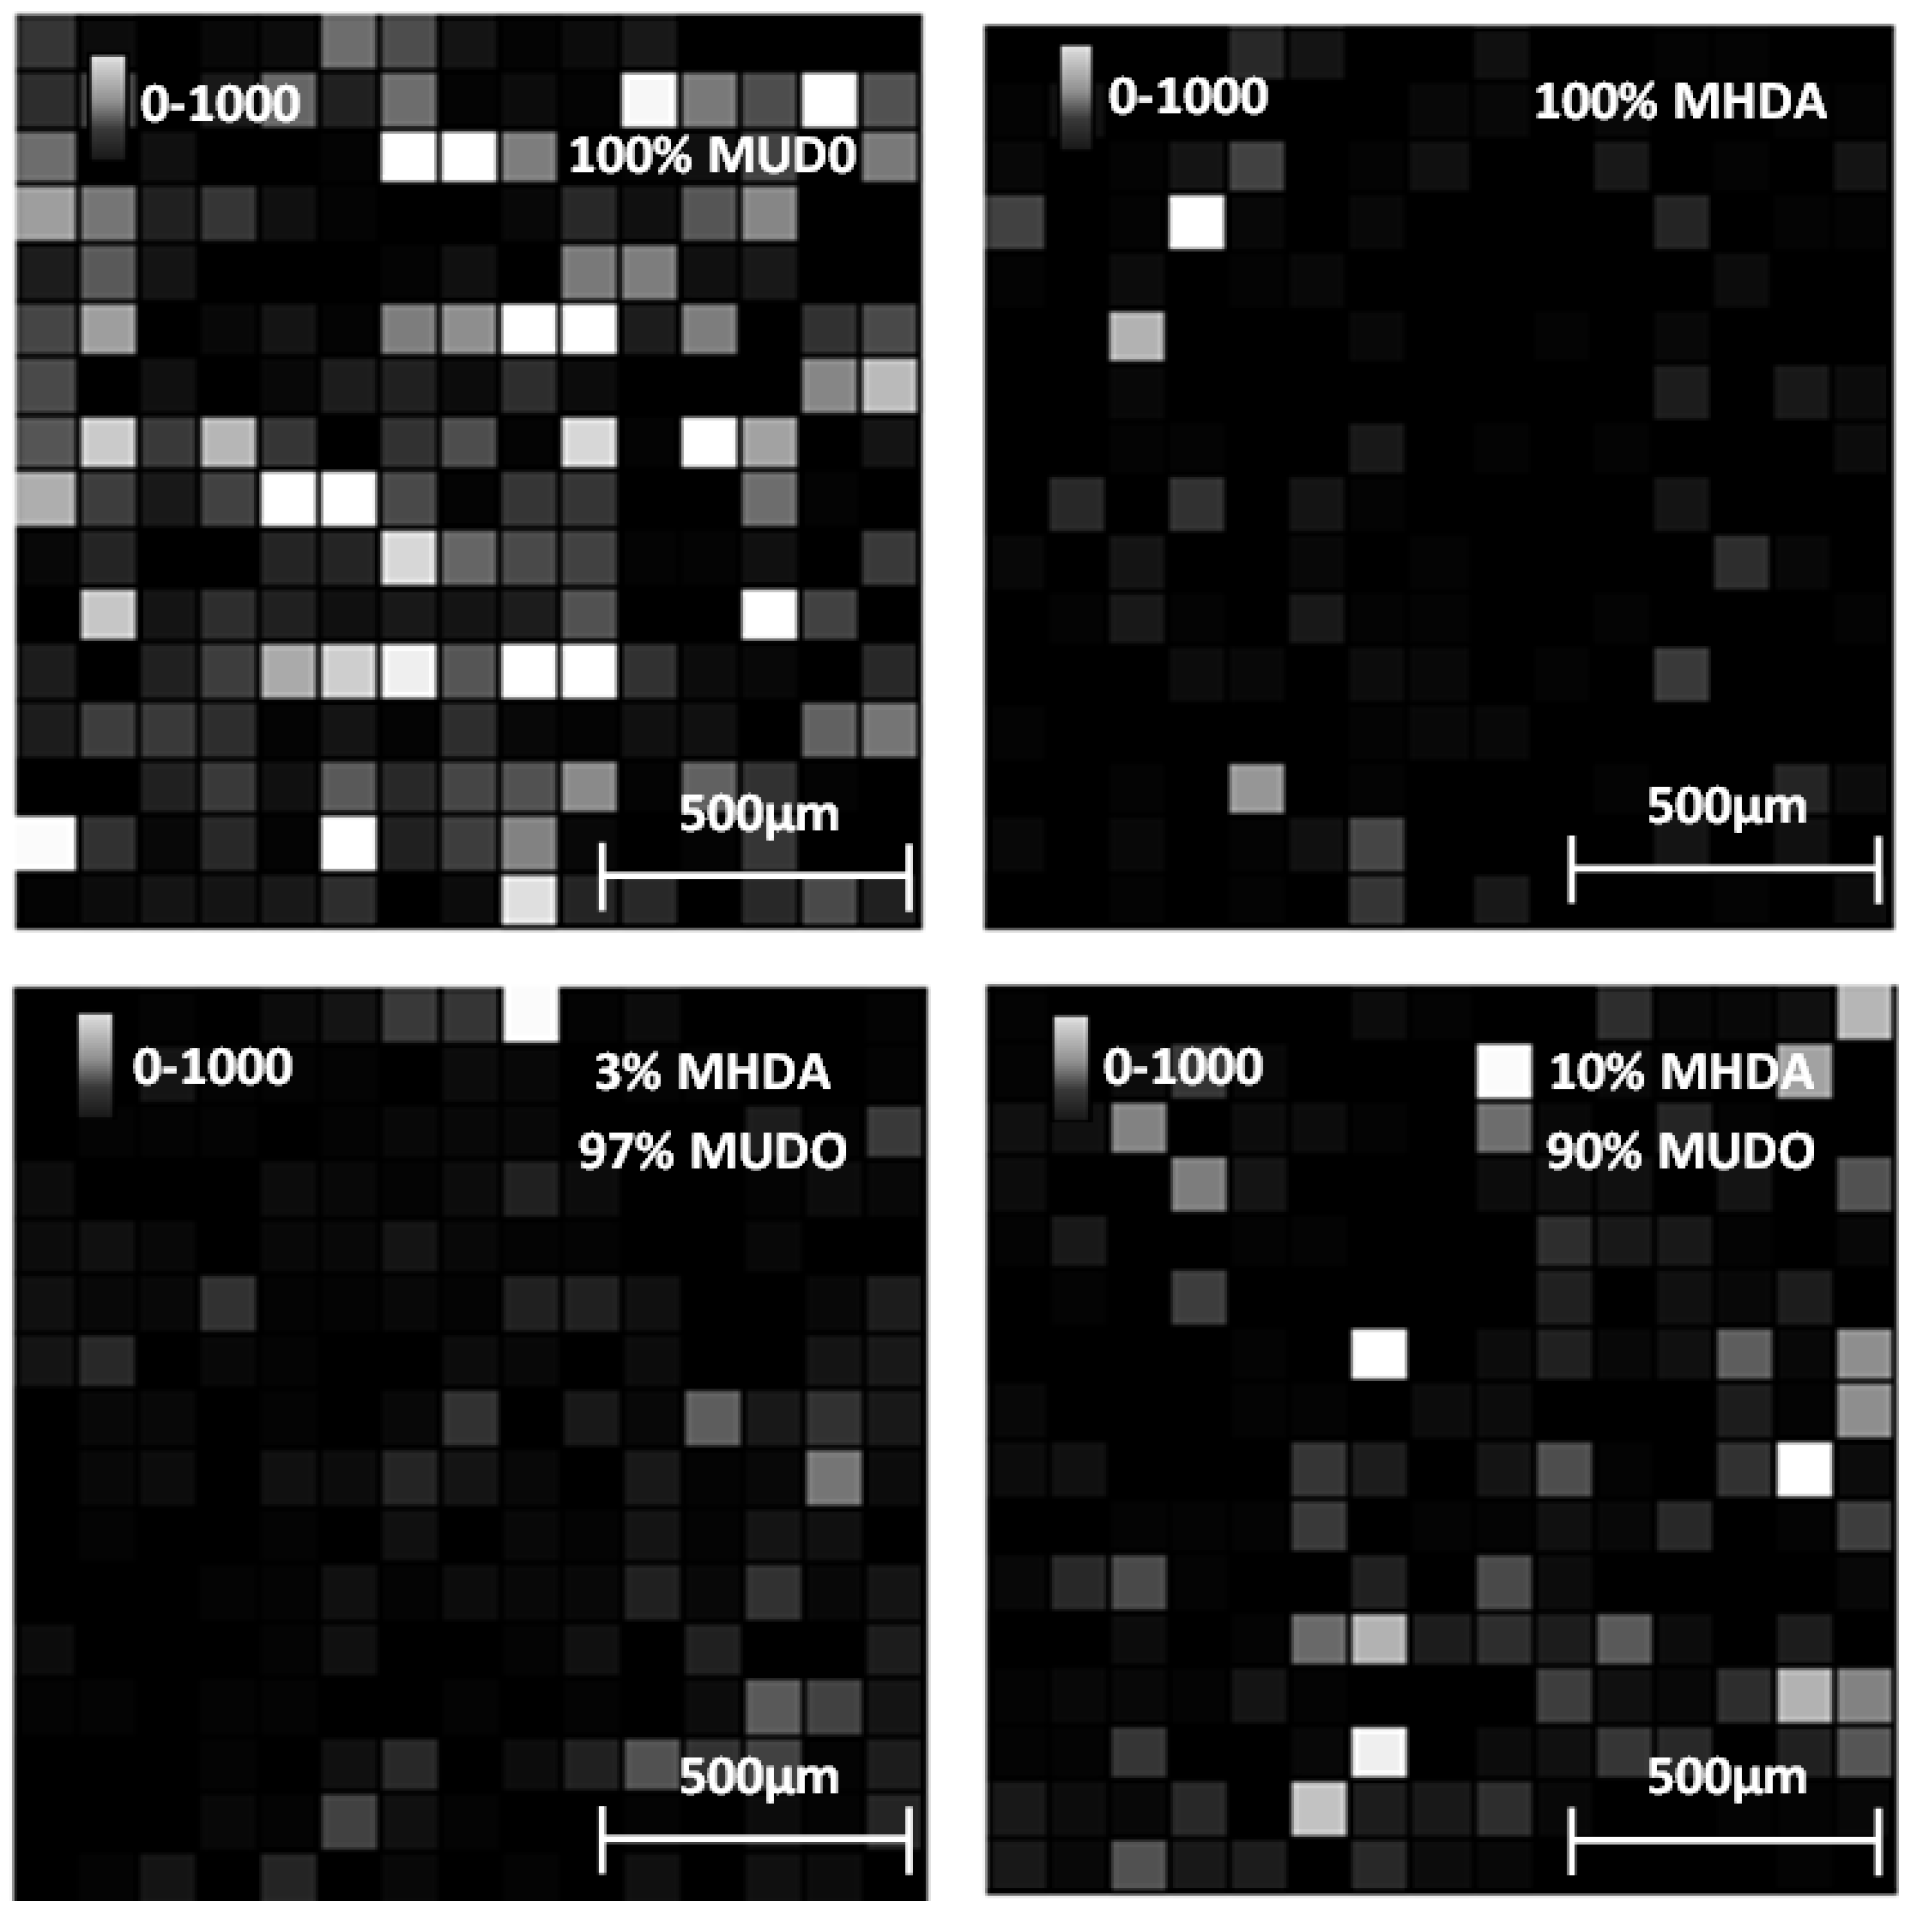
The intensities of surfaces covered with MHDA molecules show a gradation, from lowest to highest intensity, with MHDA concentrations of 100%, 3% and 10%. This gradation is expected, although it differs slightly from the AFM analysis. To illustrate these results, we report in
Figure 11 the intensity of the 1960 Da peak for each position on the 4 mm
2 tested surfaces.
Figure 11.
Intensity images (arbitrary unit) of the 1960 Da peak for each chemically functionalized GaAs surface after incubation in the RSA solution.
Figure 11.
Intensity images (arbitrary unit) of the 1960 Da peak for each chemically functionalized GaAs surface after incubation in the RSA solution.
We observe that the 0% MHDA surface (
Figure 11) apparently presents the highest amount of RSA proteins. This observation differs from the AFM images, showing small and scattered RSA motifs, in comparison with MHDA surfaces. How can this difference between AFM and MS results be explained? It could be purported that peptide ionization is easier on the 100% MUDO (0% MHDA) interface than on the MHDA surface, and that more protein molecules are desorbed by the laser from the 100% MUDO surface. Peptide desorption could be facilitated by the disorganized MUDO thiolate monolayer, and by the lower interactions existing between the RSA protein and the chemical interface. In fact, as was observed during AFM scraping measurements, the link between protein and chemical interface is weak for 100% MUDO and strong for MHDA interfaces. Griesser
et al. [
41] proved that peptide MALDI ion signals decrease as the surface-peptide binding affinity increases, and that peptide ionization is very sensitive to the nature of the chemical interaction between the surface and the peptide [
42]. This phenomenon is particularly true for whole protein detection. Although trypsin digestion strongly reduces this limitation, it may be possible that in our case, the different chemical interfaces play an important role during this process. The weak interaction between peptides and the alkane chain and the non-presence of carboxylic acids could facilitate molecule desorption, and generate a higher intensity of signal response.
This theory seems to be correct, in light of the results obtained on the 100% MHDA surface. The AFM images show that the protein layer is not significantly less dense than on 3% MHDA, but an over-abundance of docking sites that multi-bond RSA peptides could explain the low MS signal. For 3% and 10% mixed chemical interfaces, the MS results are less surprising, and are consistent with AFM observations: the more MHDA in the chemical layer, the more intense the MS signal. To determine the optimal number of docking sites necessary to obtain a well-organized and dense protein layer, we recently performed complementary analyses of surfaces containing percentages of MHDA molecules greater than 10 percent. These results are given in the following section.
2.7. Density of Carboxylic Docking Sites and Consequences on the Reconstituted RSA Protein Layer on (100) GaAs
In the previous results, we showed that, on the one hand, a concentration of less than 10% MHDA is not sufficient to graft a dense and homogeneous layer of proteins; and on the other hand, that a layer composed of 100% MHDA molecules induced multi-bonding of the proteins to the surface, which somehow flattened the proteins and reduced laser desorption of this protein layer. We investigated the behavior of the protein layer on chemical interfaces composed of more than 10% MHDA.
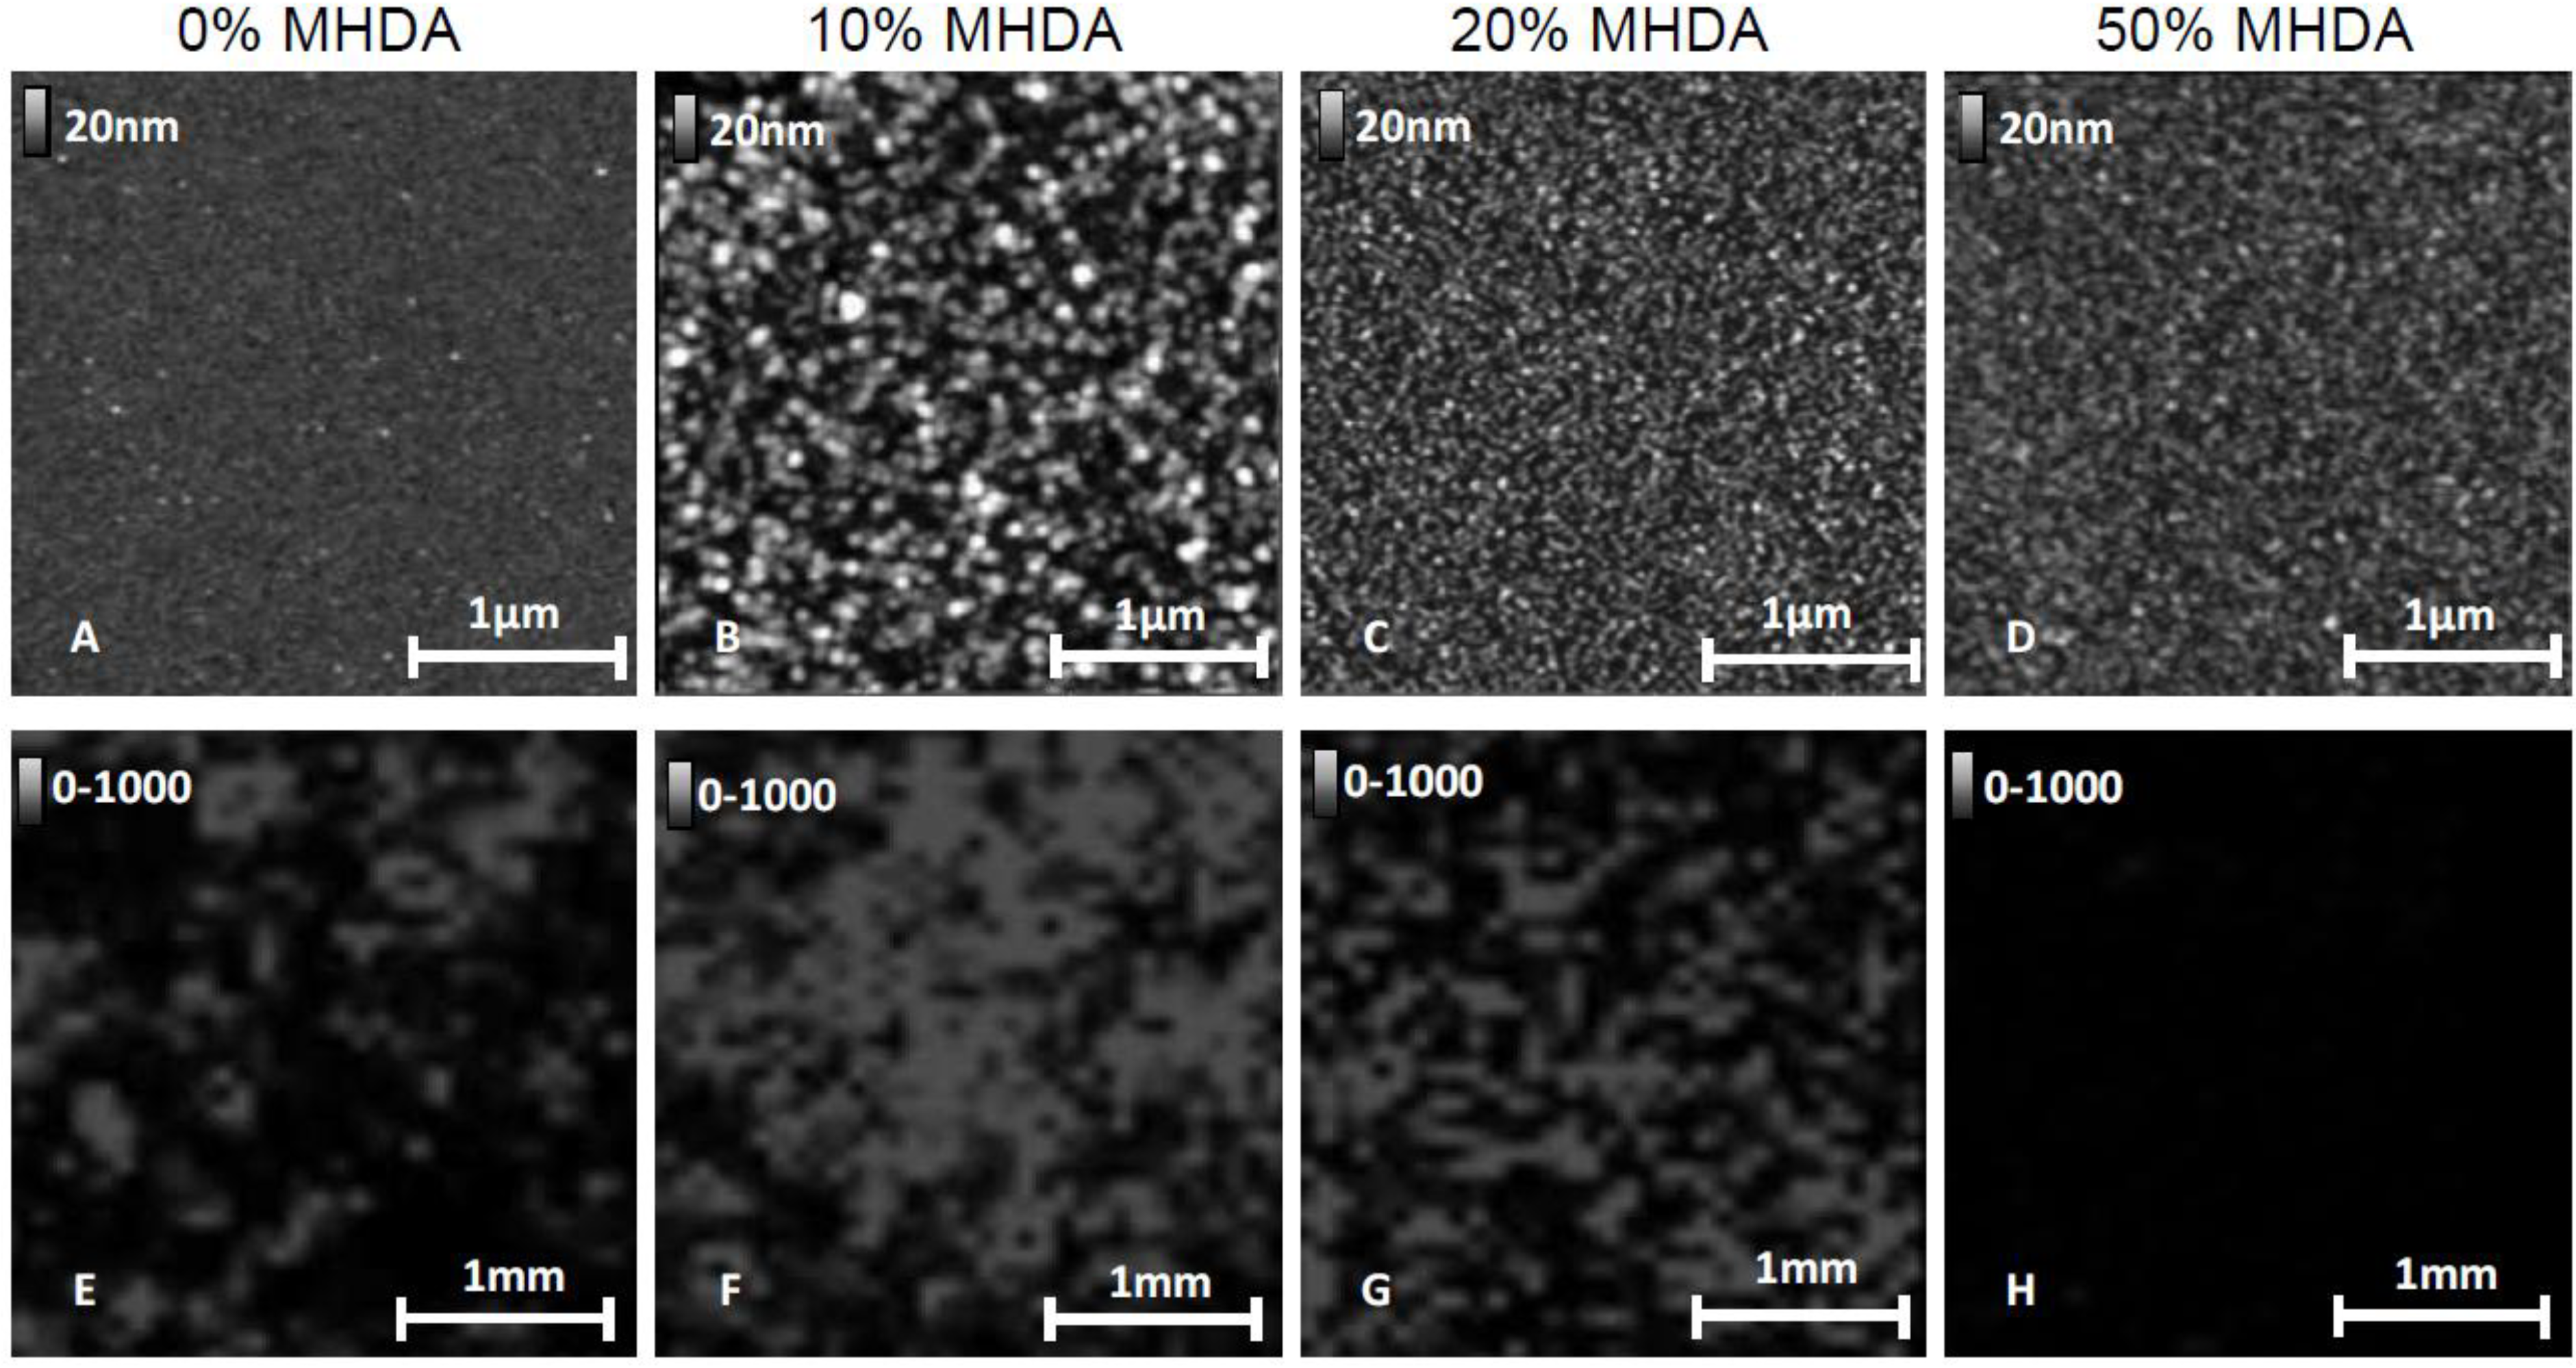
We applied the same AFM and MS characterization methods as previously described to chemical layers obtained from a solution containing respectively 20% and 50% MHDA molecules. The AFM and MS images are reported in
Figure 12.
Figure 12.
AFM images (A–D) and MS imaging results (E–H) for 0%–50% MHDA concentration: 0% MHDA (A,E); 10% MHDA (B,F); 20% MHDA (C,G); 50% MHDA (D,H).
Figure 12.
AFM images (A–D) and MS imaging results (E–H) for 0%–50% MHDA concentration: 0% MHDA (A,E); 10% MHDA (B,F); 20% MHDA (C,G); 50% MHDA (D,H).
Images A, B, E and F in
Figure 12 give the same results as those previously observed for 0% MHDA (A,E) and 10% MHDA surfaces (B,F). On the 0% MHDA surface, we observed sparse patterns corresponding to RSA protein, and only locally high MS signal intensity. The 10% MHDA surface shows the highest organized protein layer and a strong MS signal. For highest values of MHDA (C,D,G,H), we observe a drastic decrease in the pattern sizes. The AFM images of these surfaces show the lowest patterns, whereas the MS signal intensity dramatically dropped and was even absent for 20% and 50% MHDA respectively. These results are in accordance with the hypothesis of multi-bonded proteins on such highly MHDA-concentrated surfaces. This observation suggests that a concentration of 10% MHDA apparently offers an optimal number of docking sites to graft a protein monolayer homogeneously and correctly.
