Influence of Fracture Width on Sealability in High-Strength and Ultra-Low-Permeability Concrete in Seawater

Abstract
:1. Introduction
2. Sample Material

| Composition | Amount [kg/m3] |
|---|---|
| Pre-mixed powder | 2300 (Note) In case of following the recommendation proposed by Japan Society of Civil Engineers [23], Low-heat Portland cement: 744–1014 Silica fume: 158–496 Fillers: 225–541 Aggregates: 631–947 |
| Water-reducing admixture | 24 |
| Water | 180 |
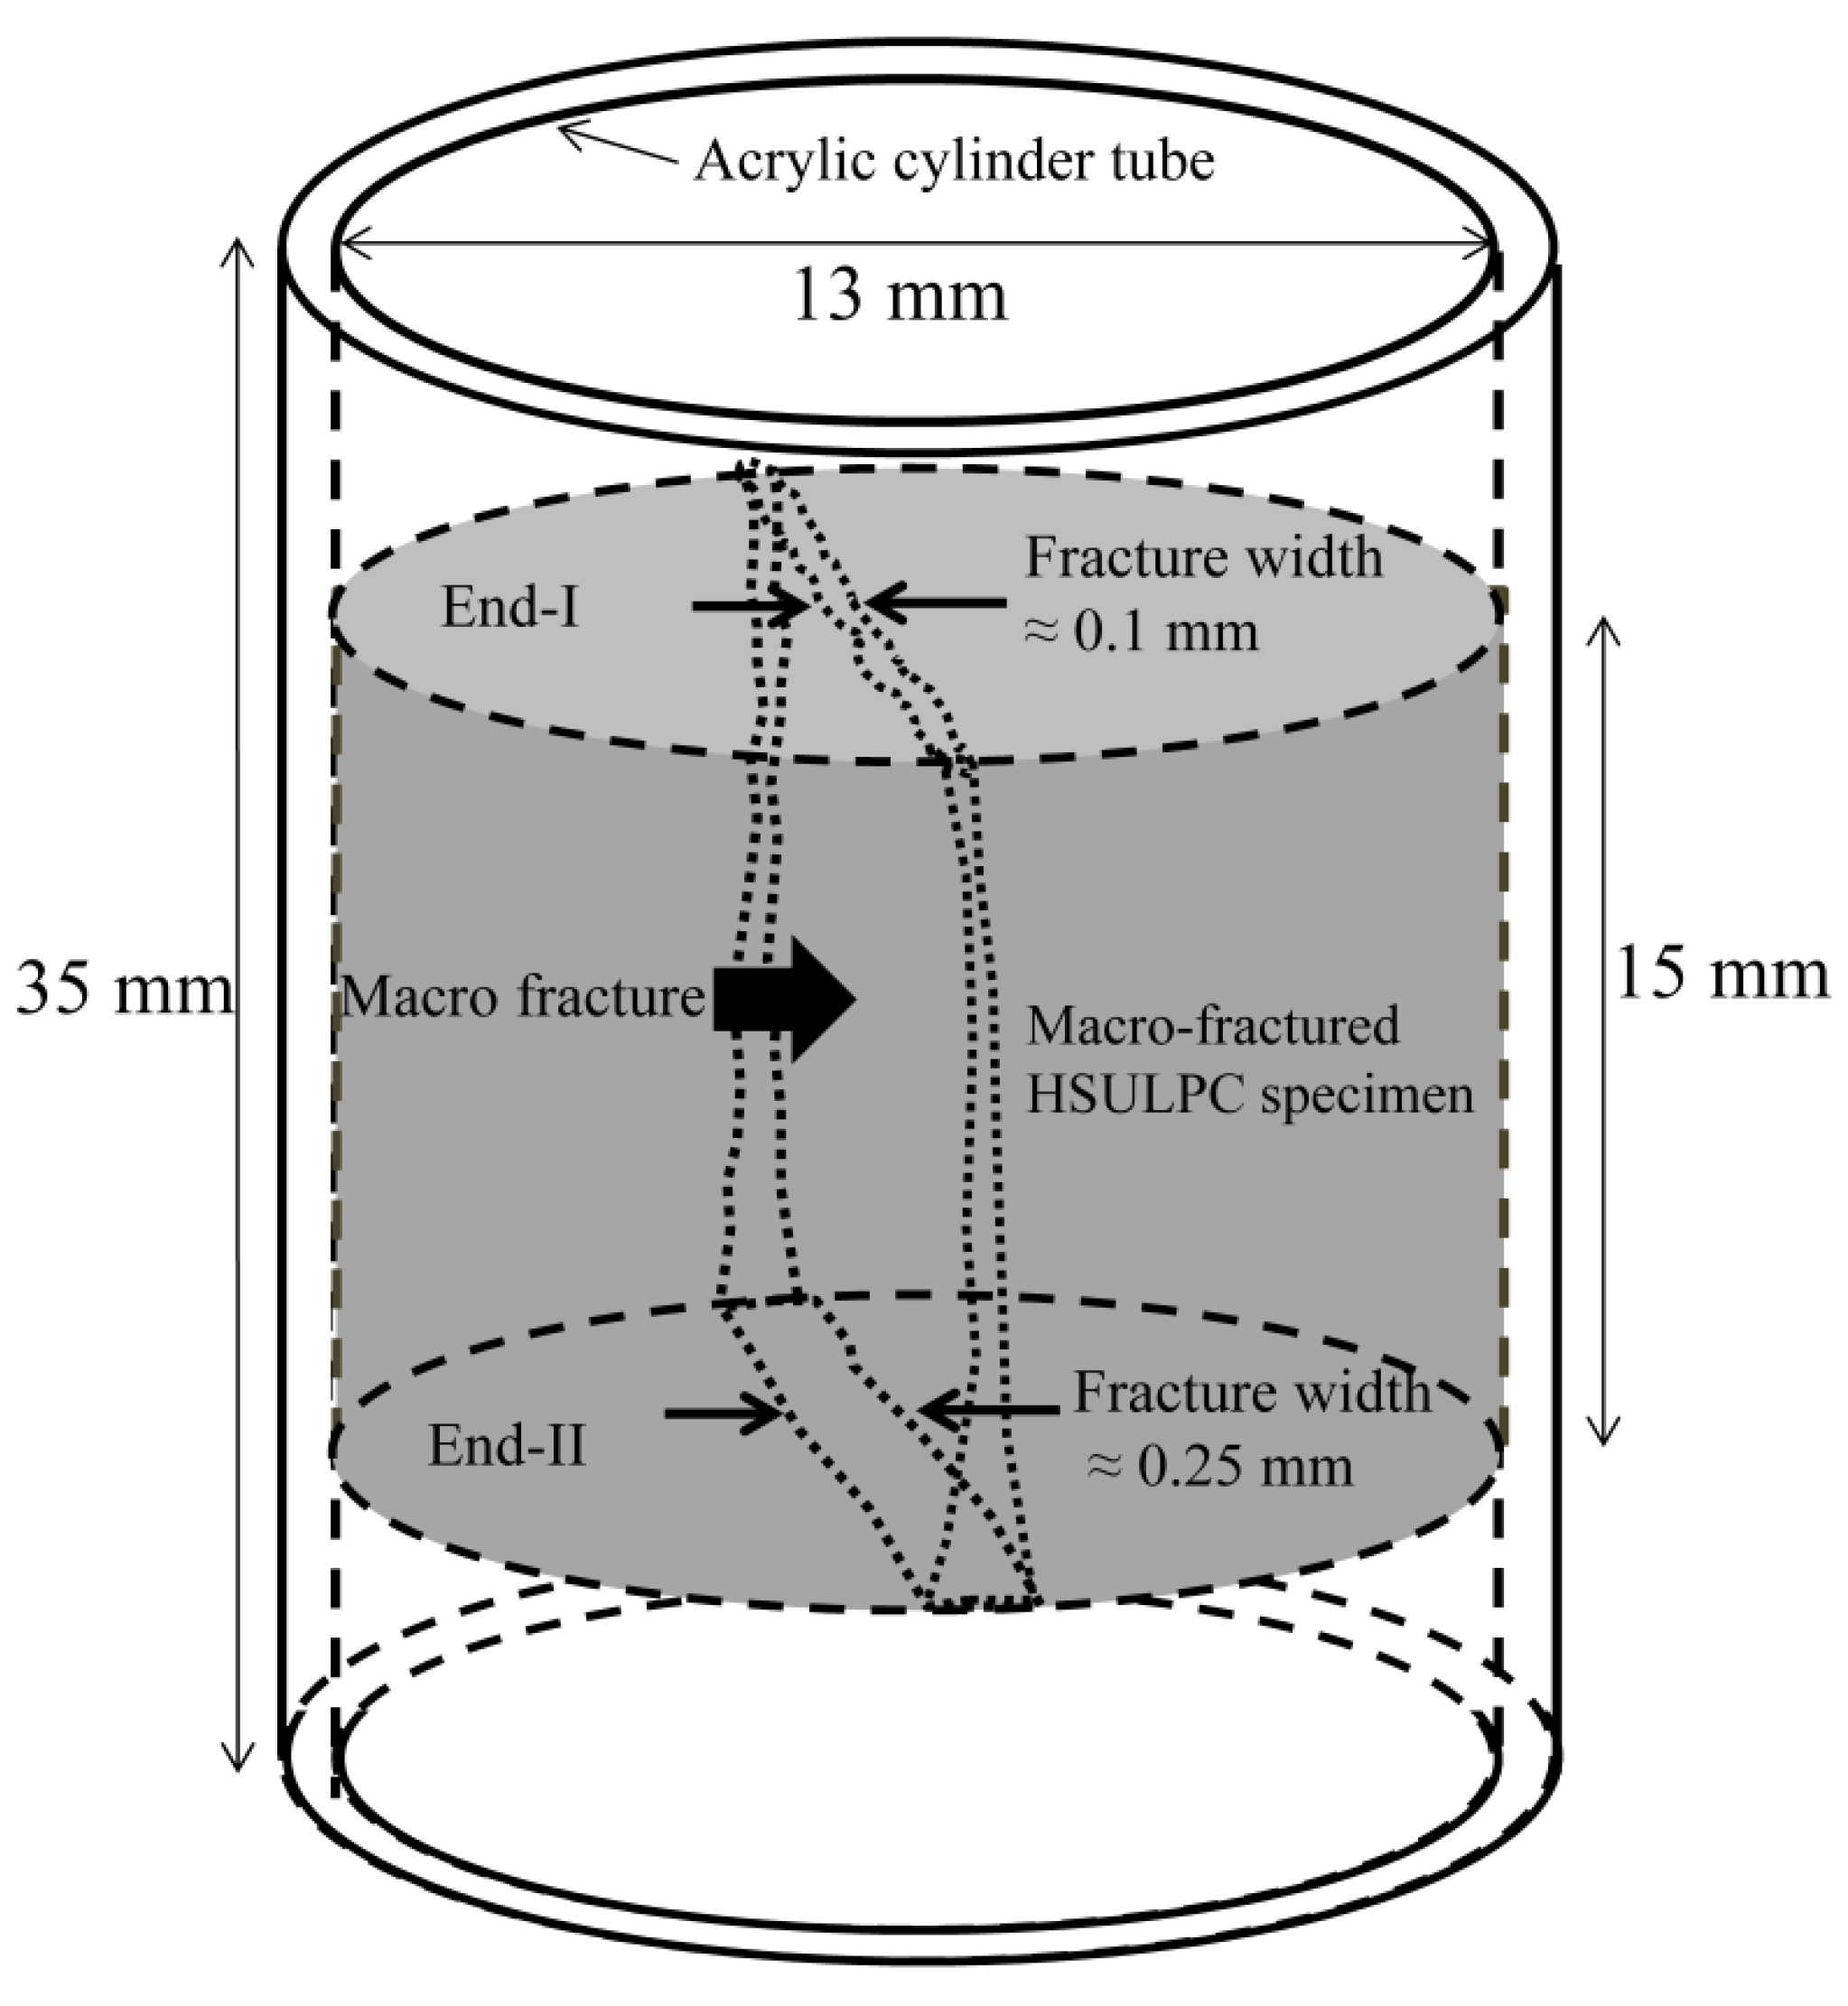
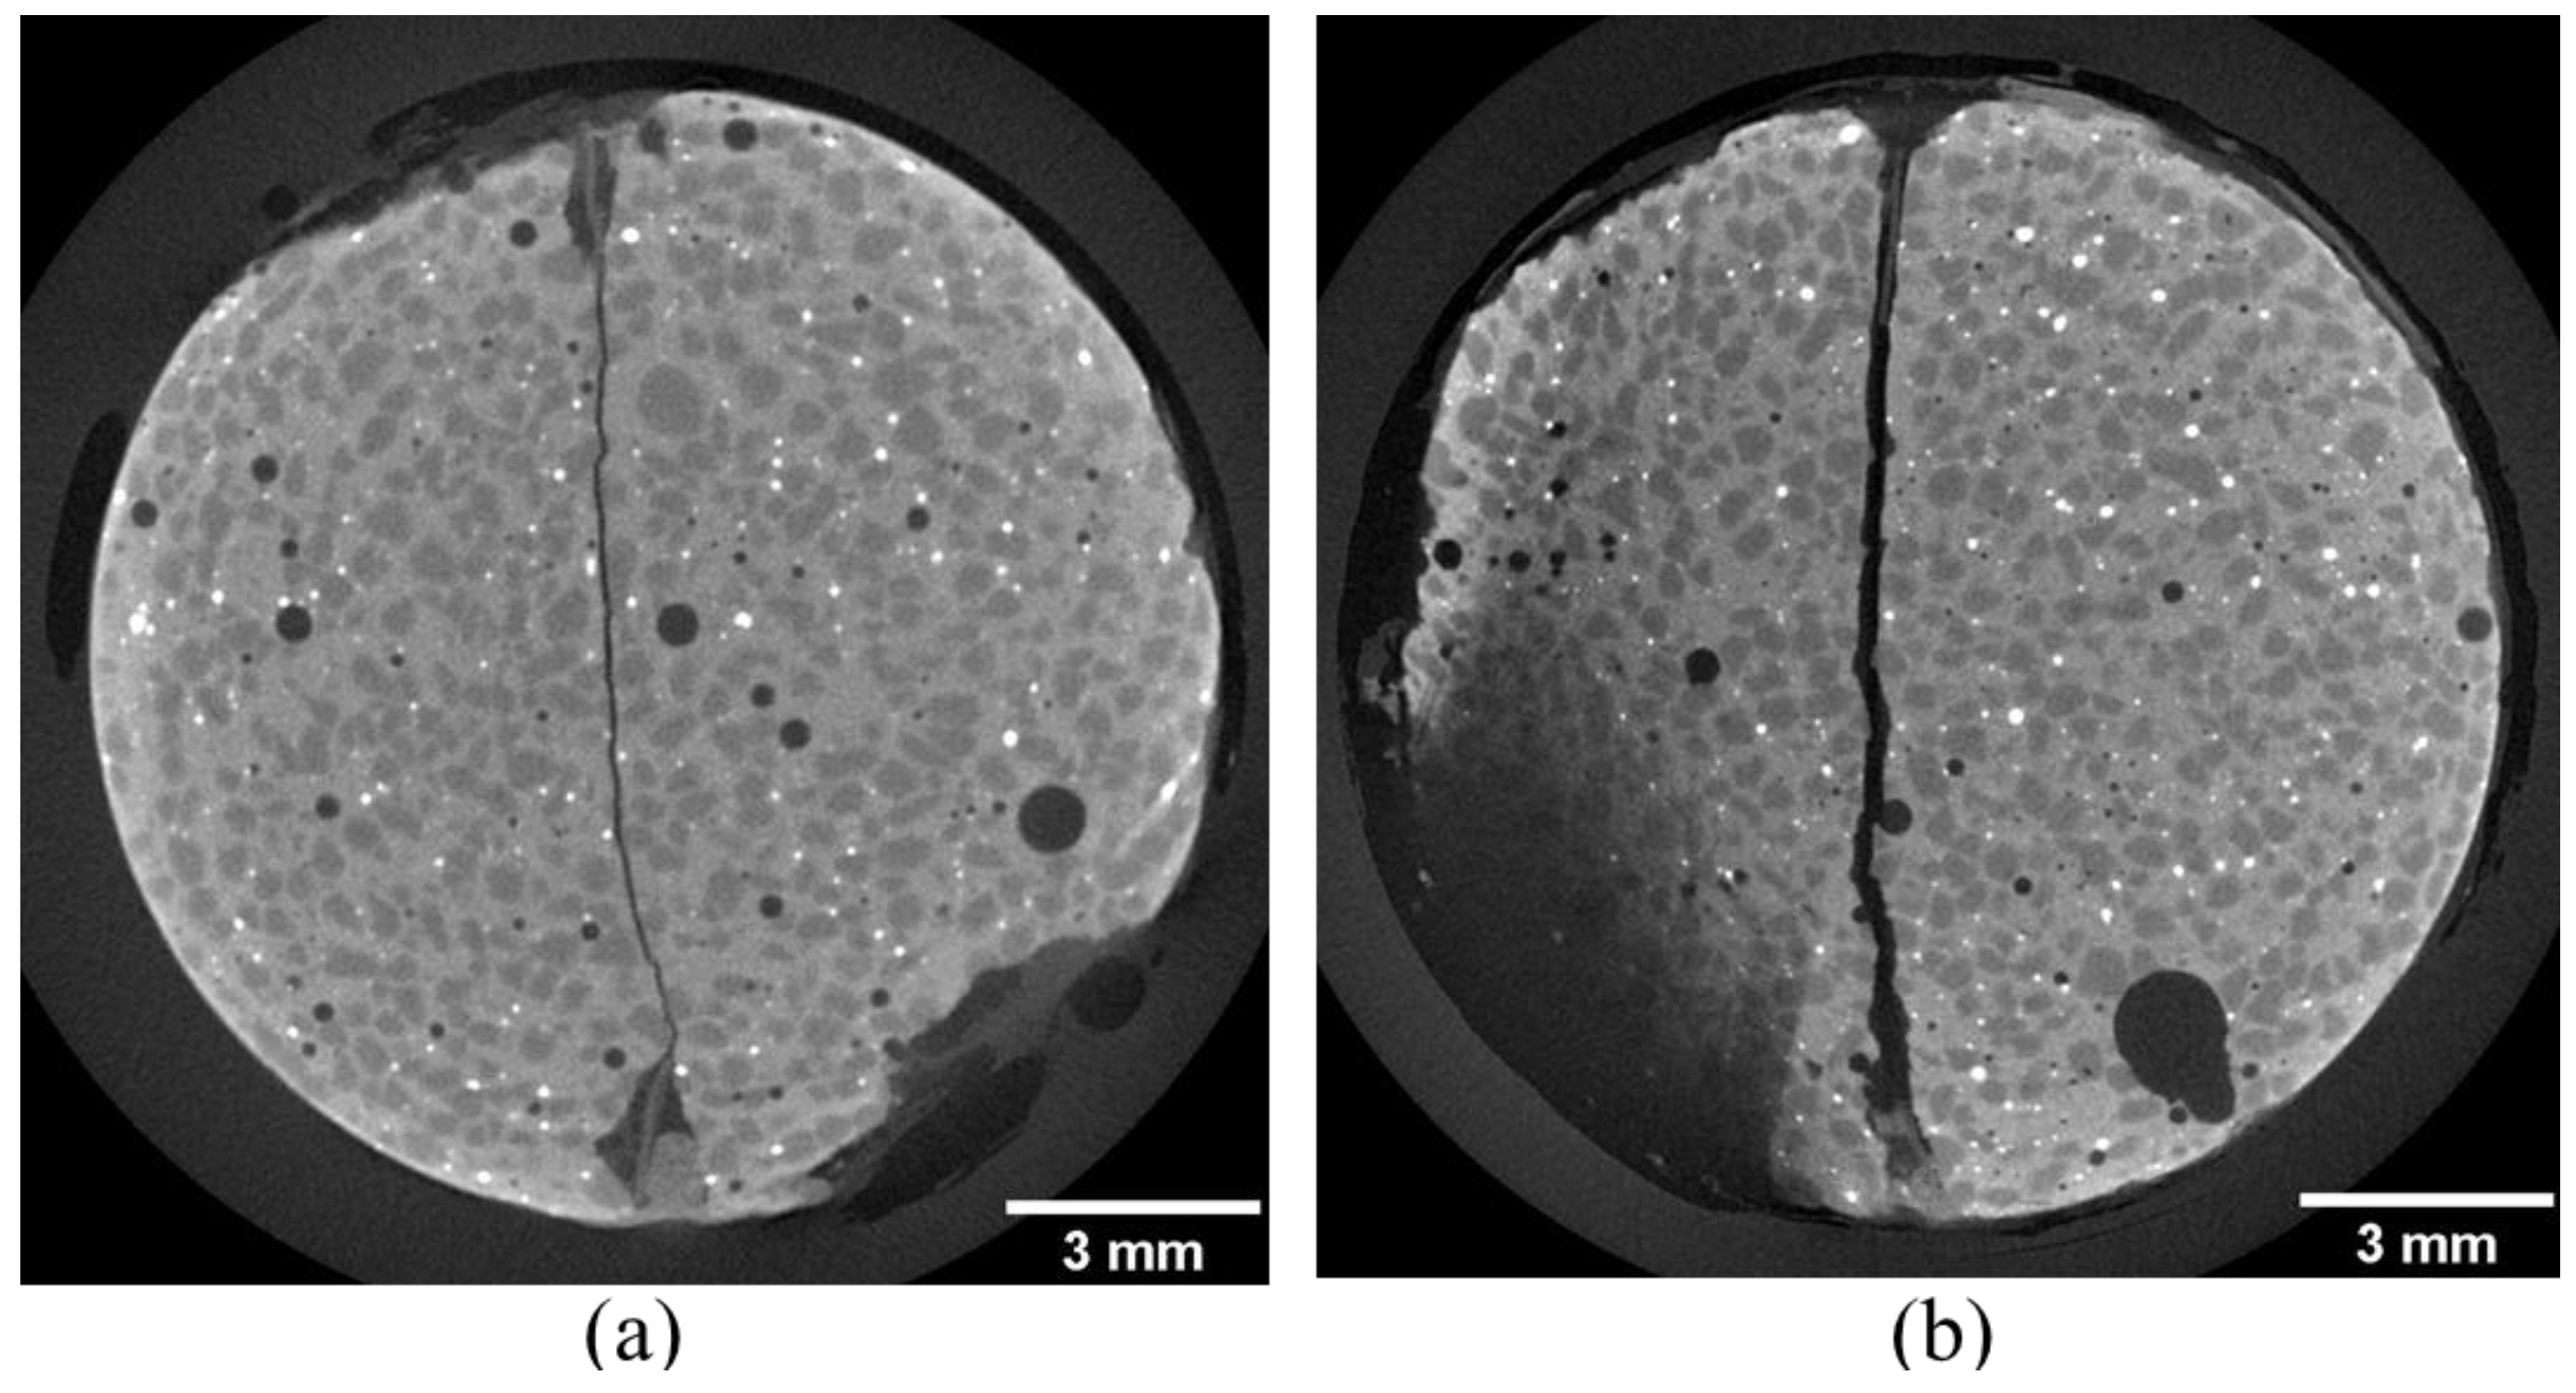
3. Observation by X-ray CT
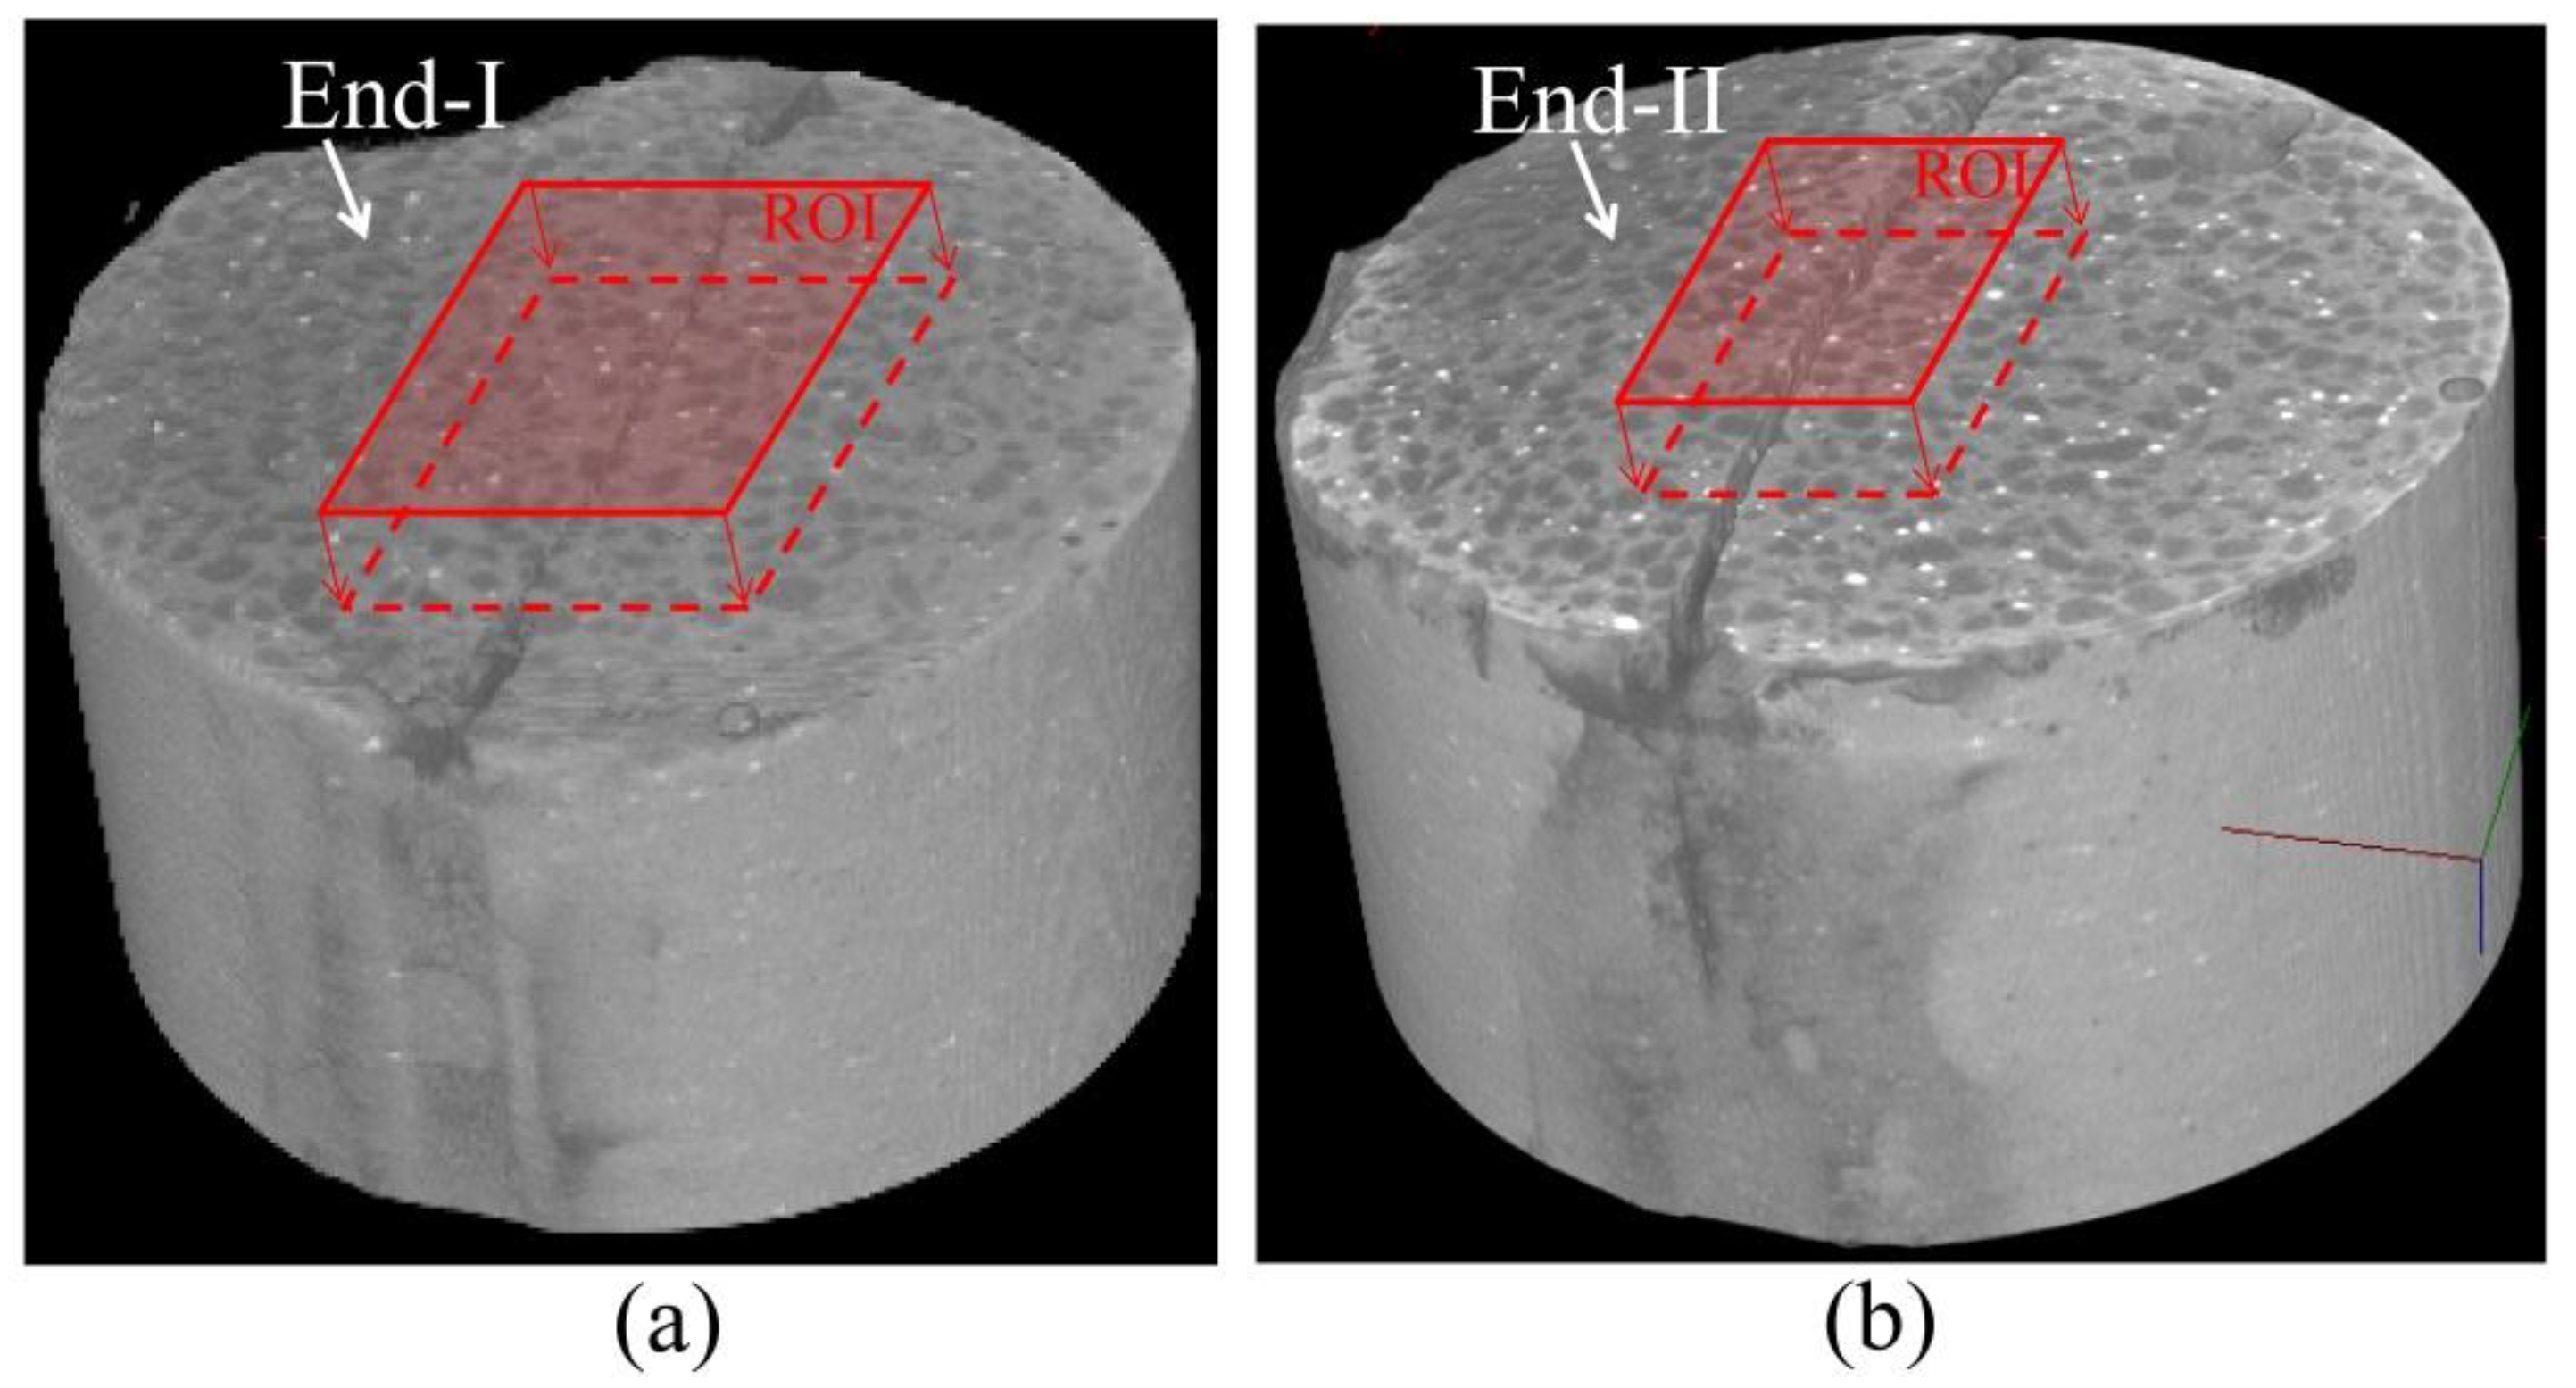
3.1. Observation Method
| Ca2+ | SO32− | Na+ | K+ | Cl− | Mg2+ | HCO3− |
|---|---|---|---|---|---|---|
| 10 × 10−3 | 29 × 10−3 | 45 × 10−2 | 19 × 10−3 | 56 × 10−2 | 55 × 10−3 | 24 × 10−4 |
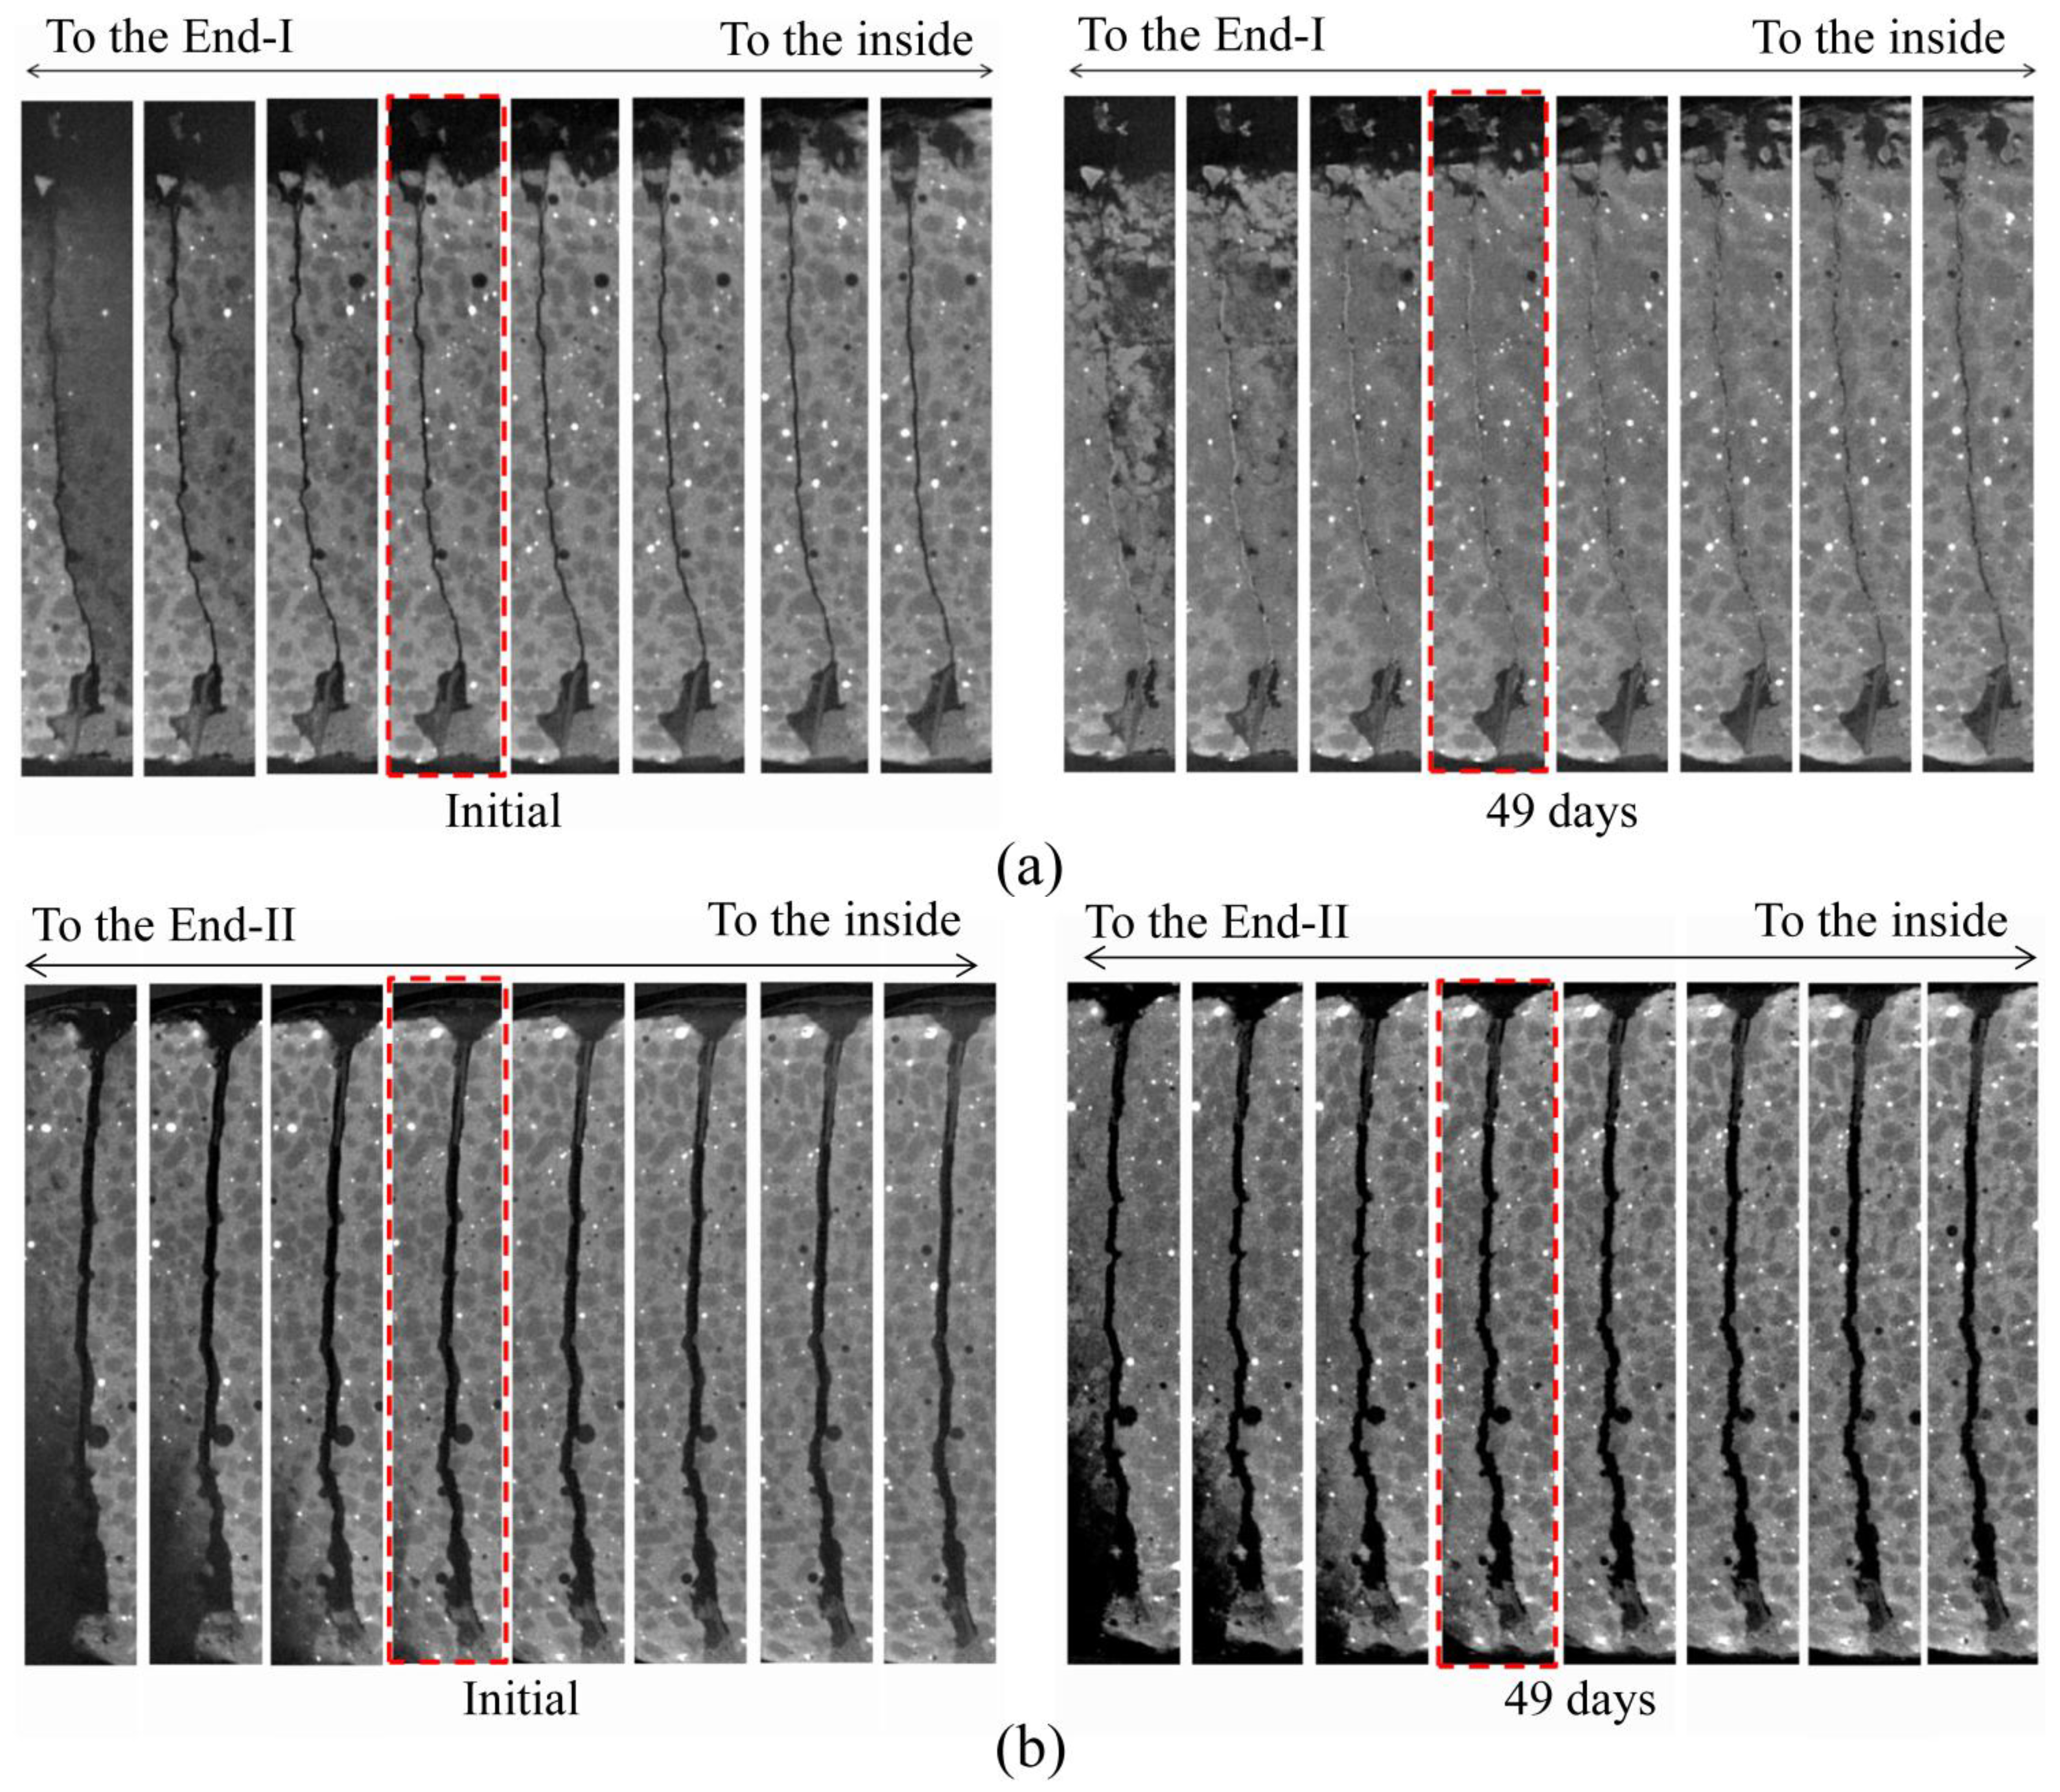
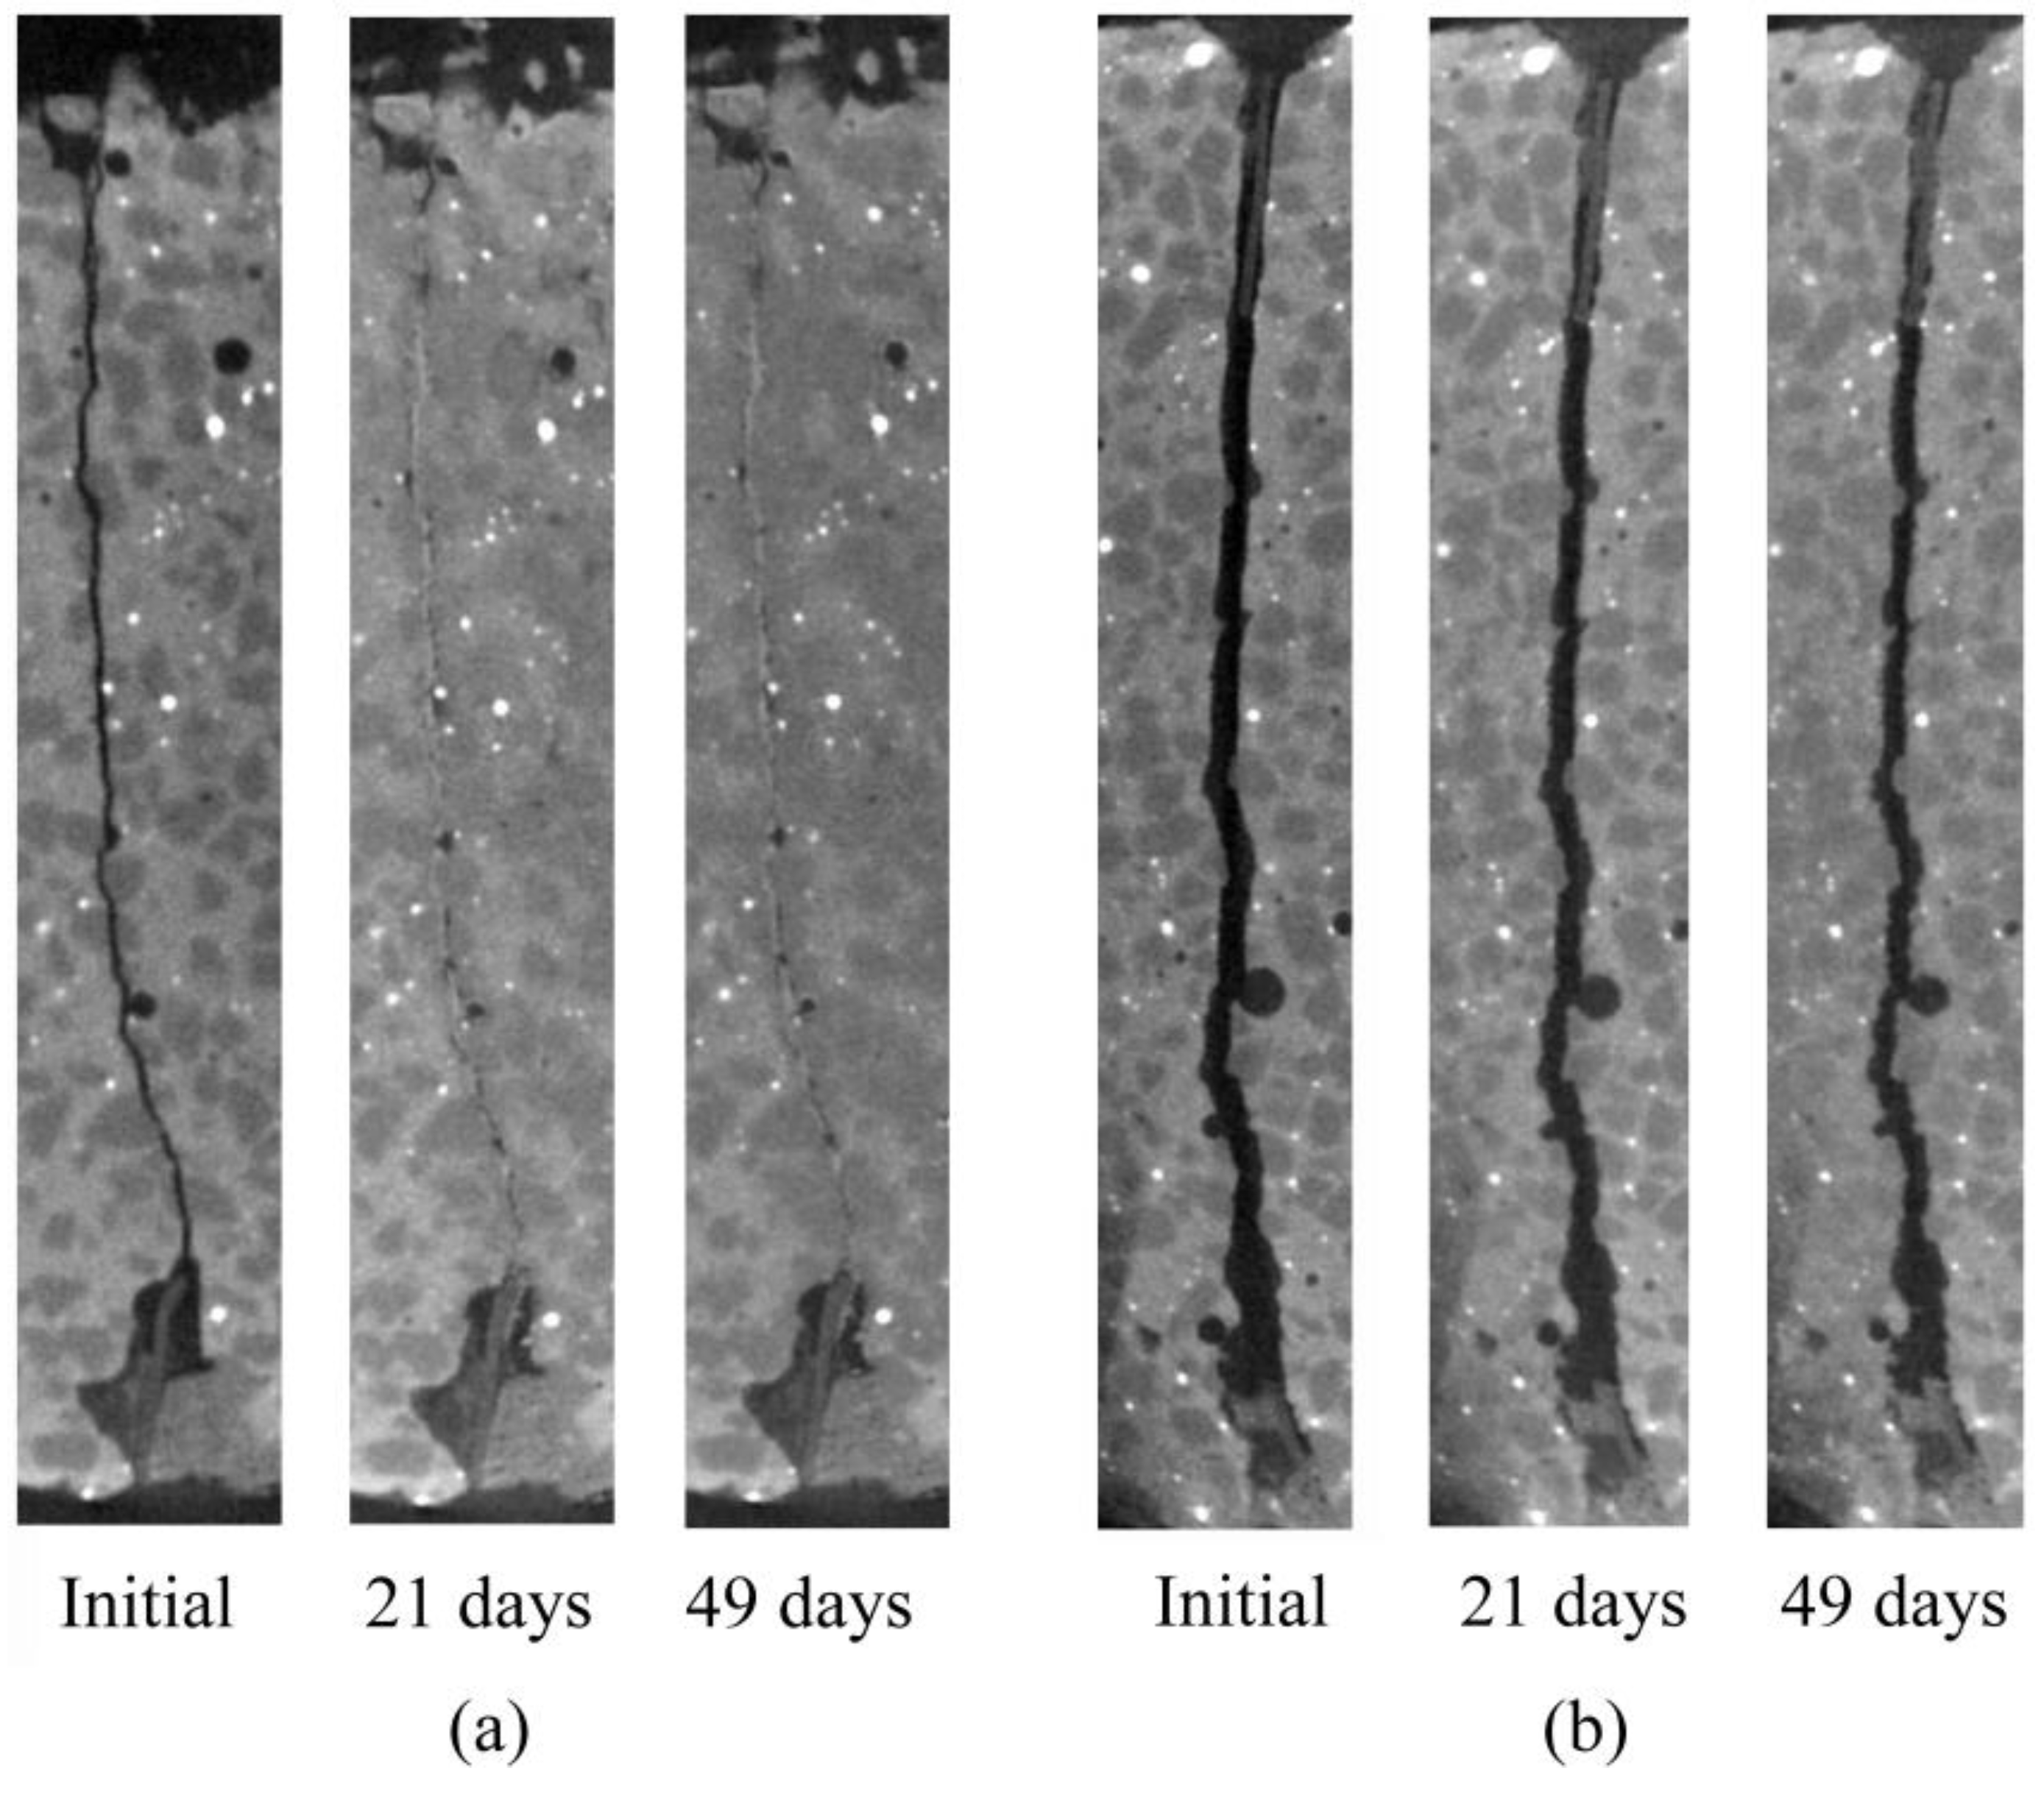
3.2. Results
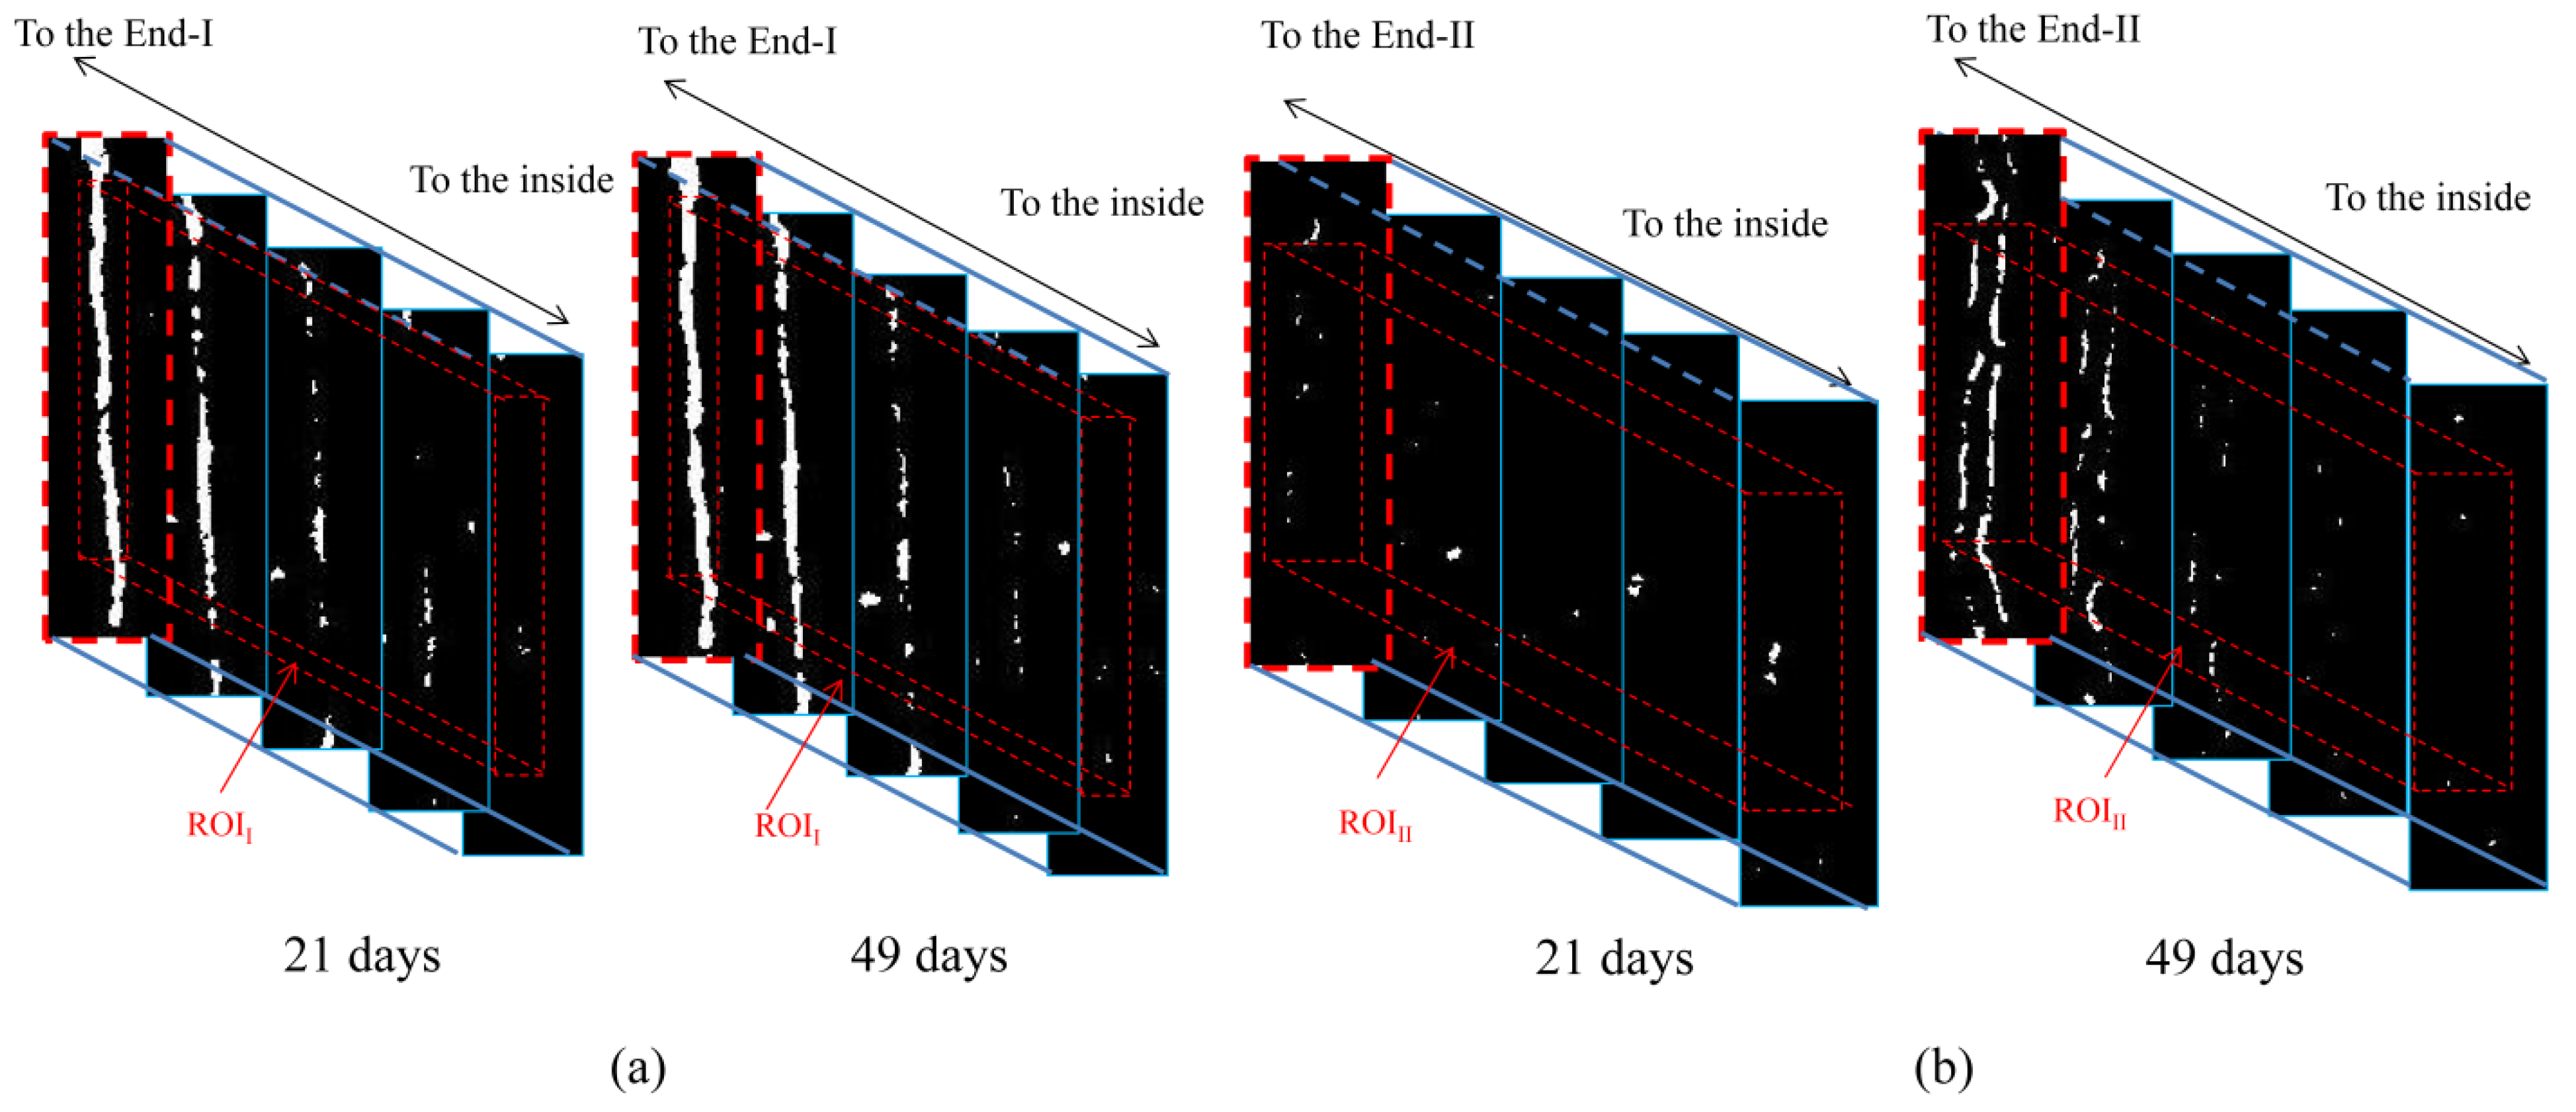
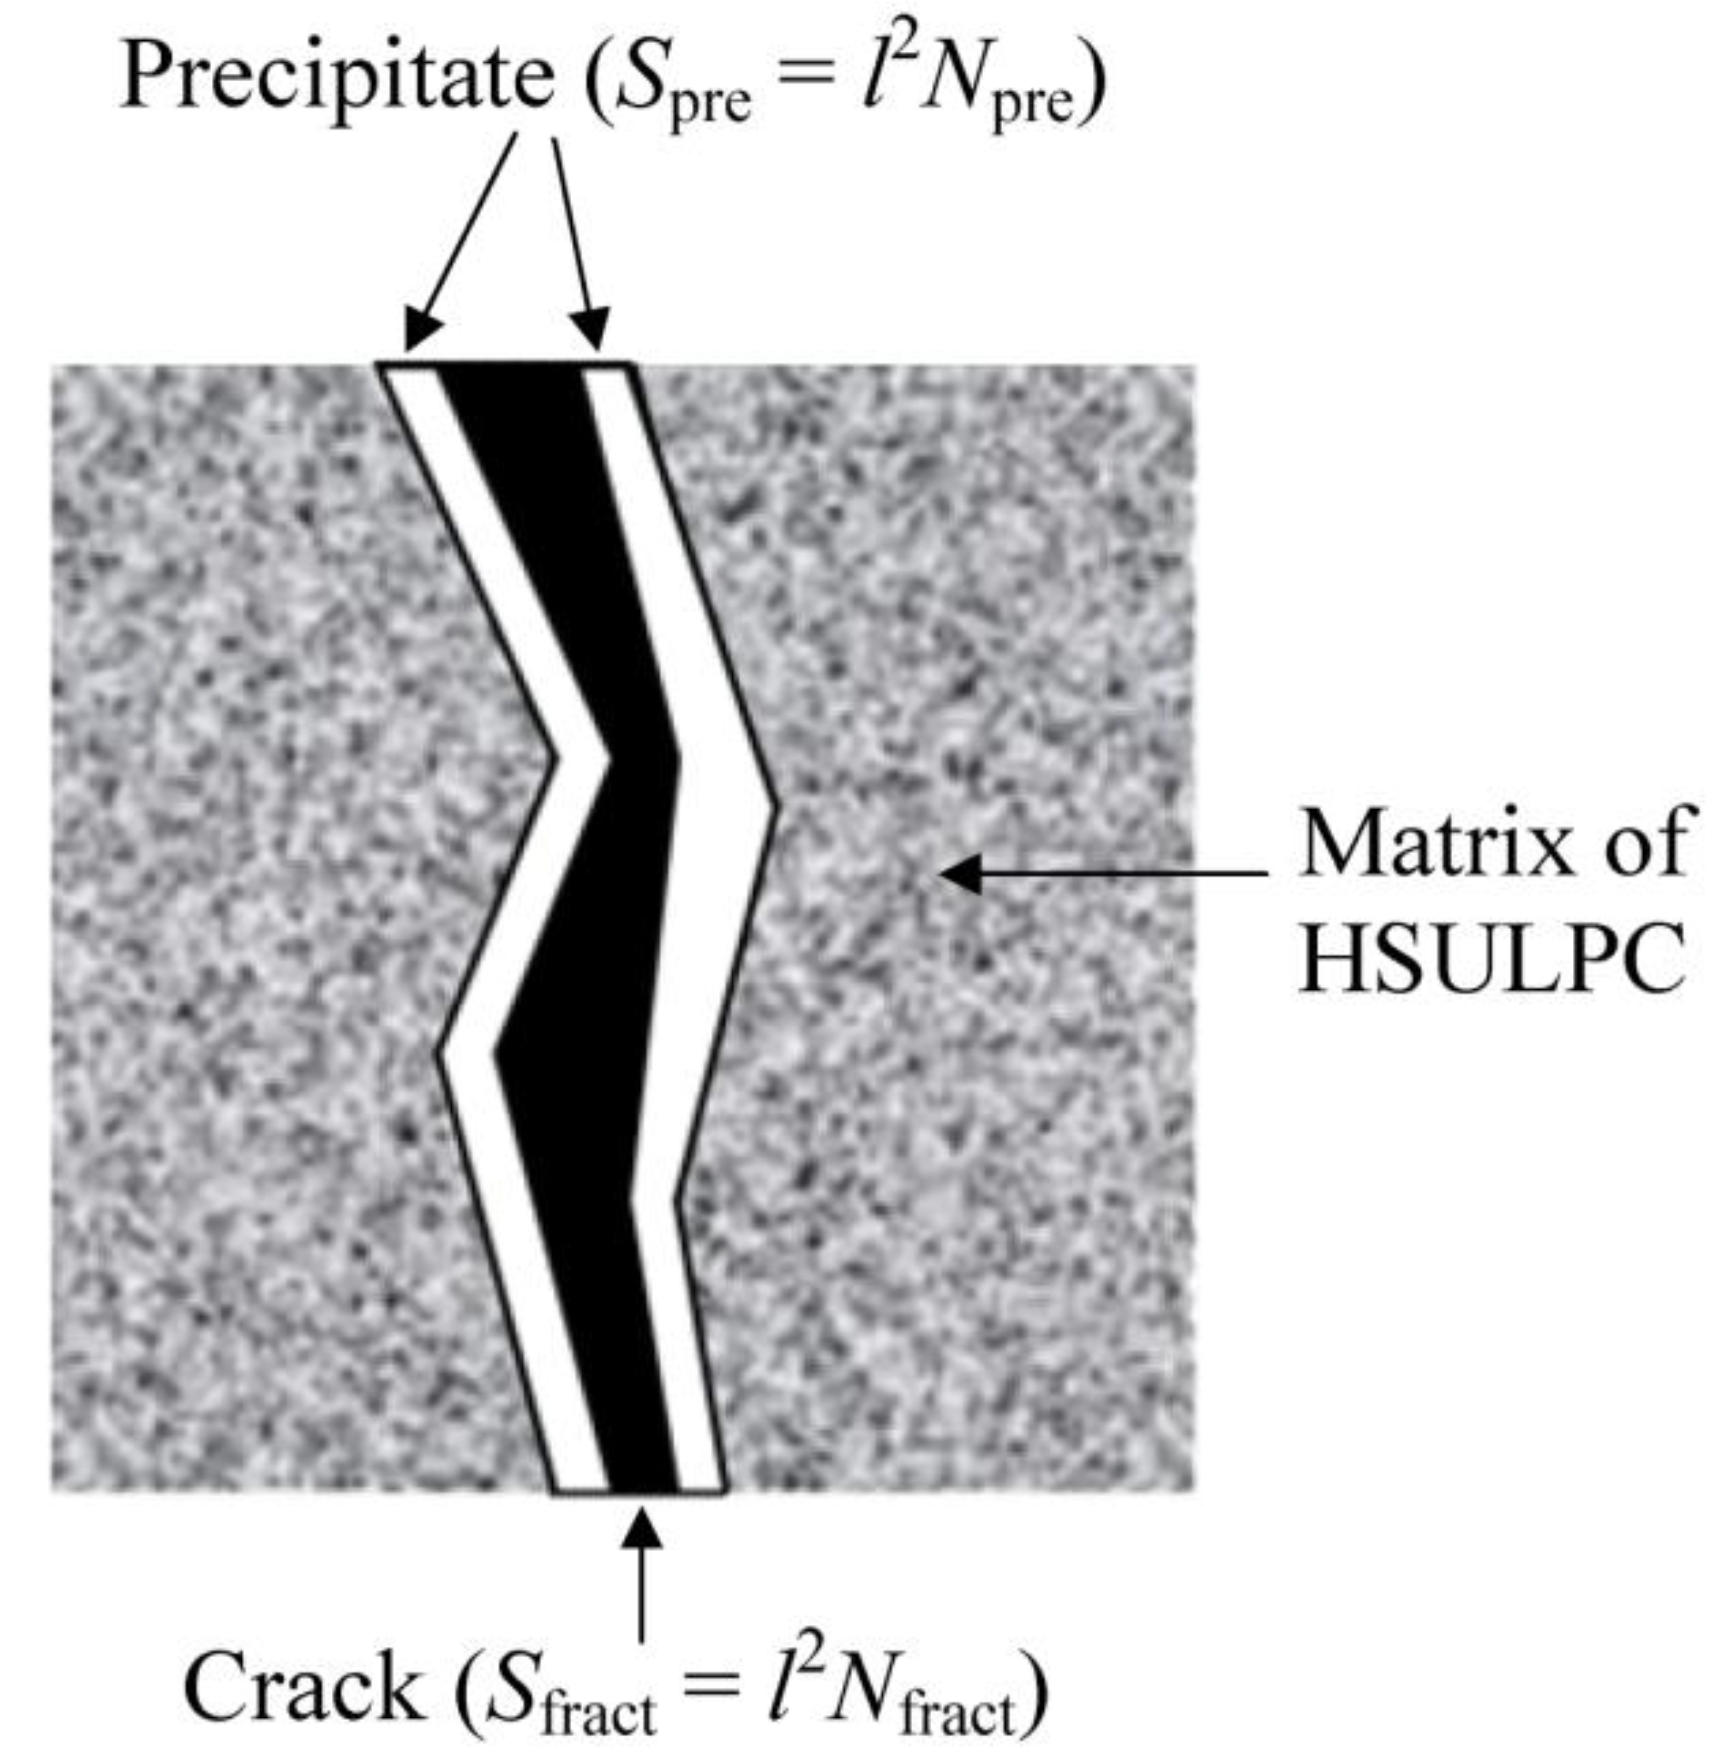
4. Image Analysis
4.1. Image Processing Method
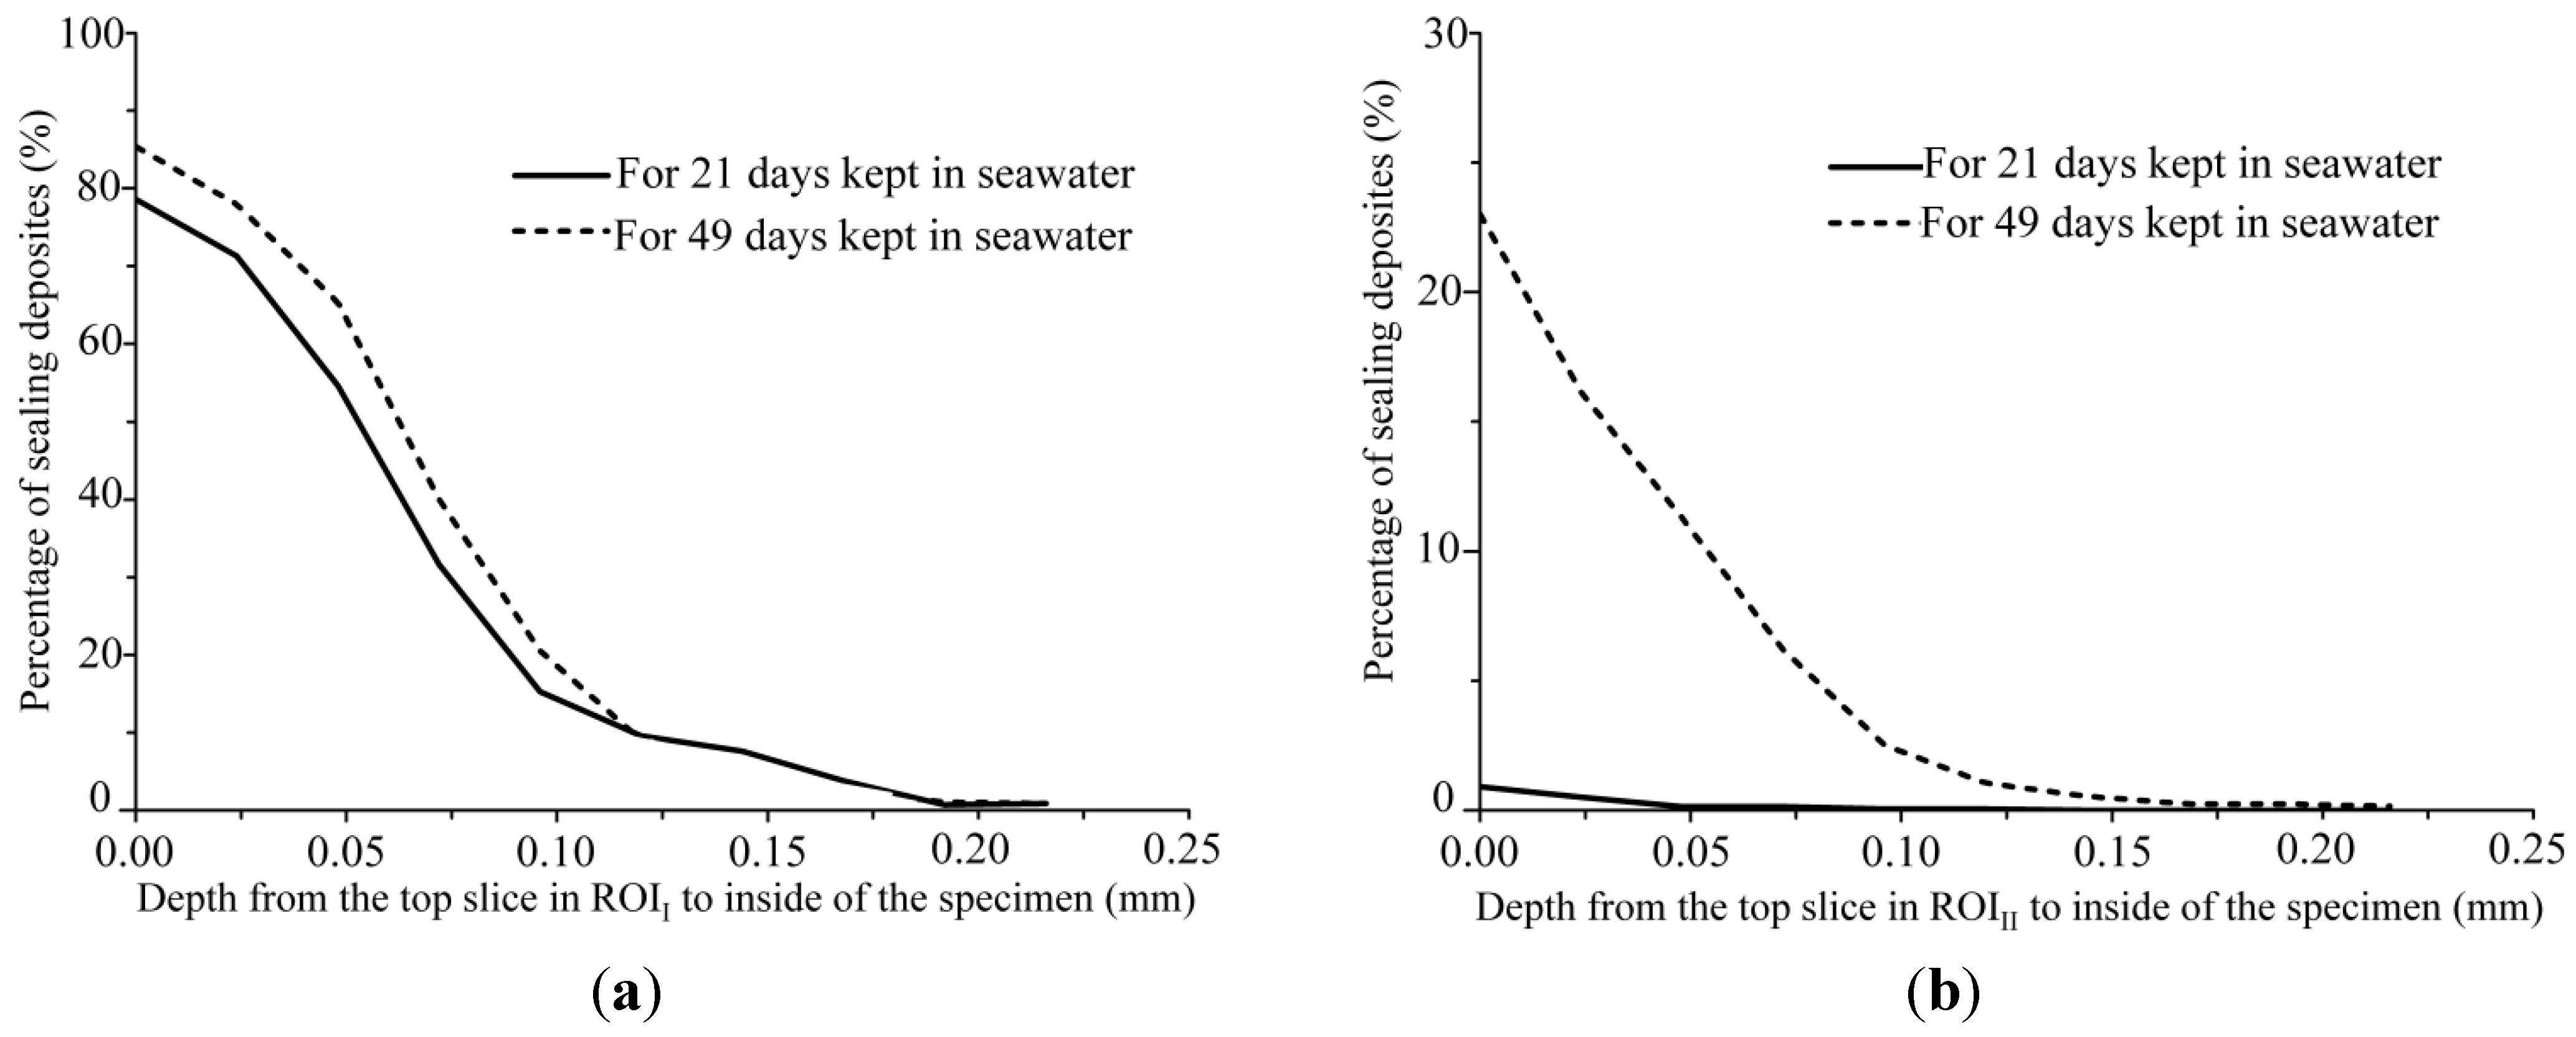
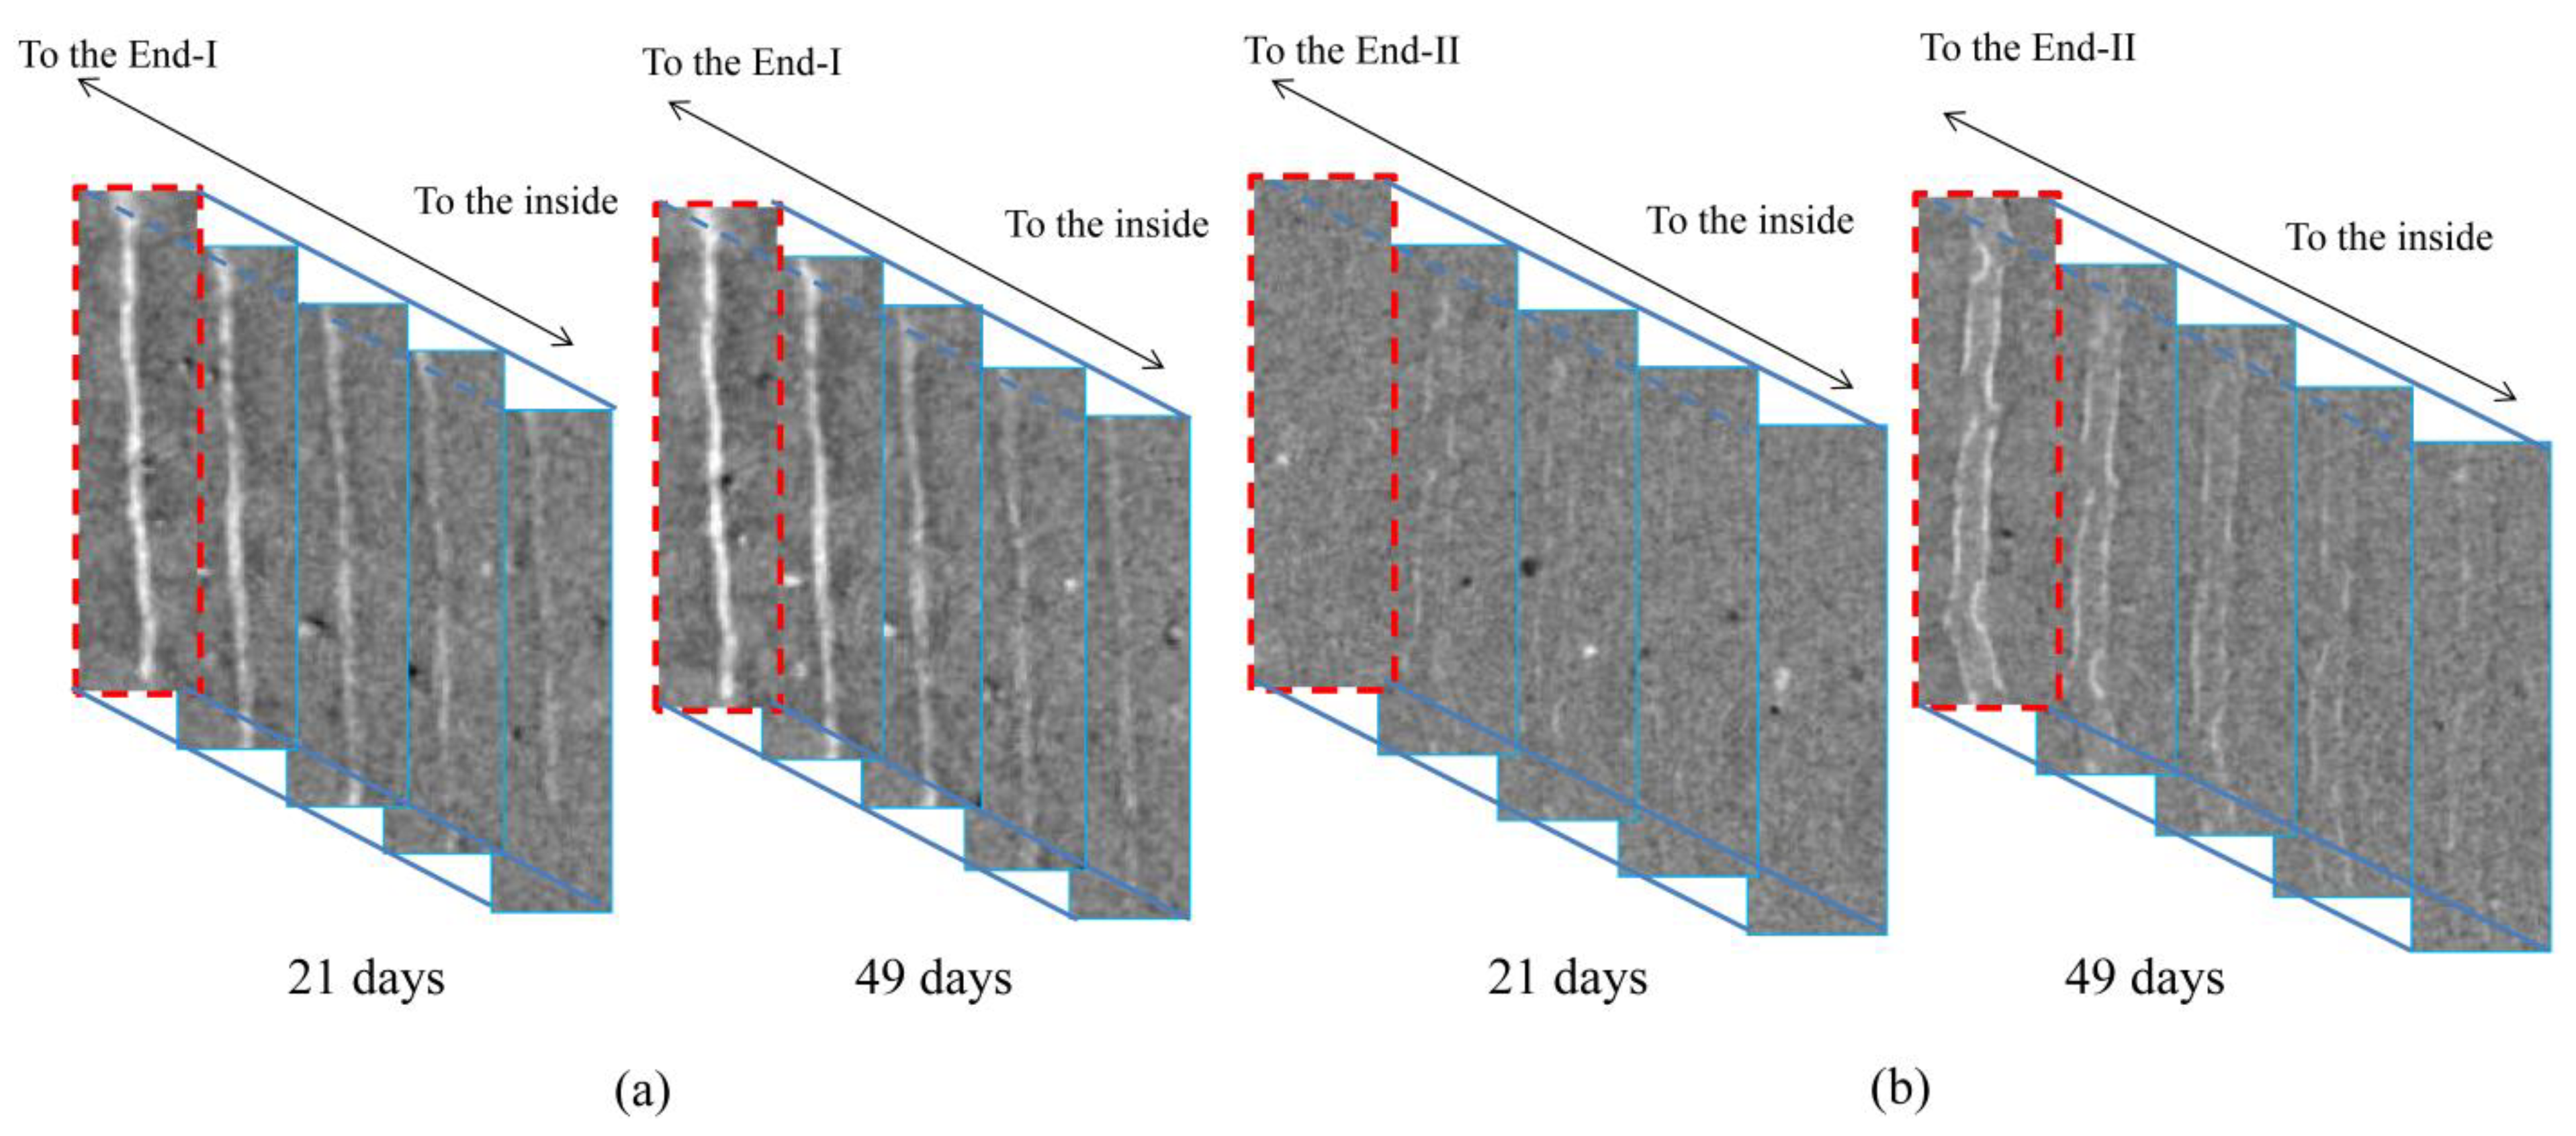
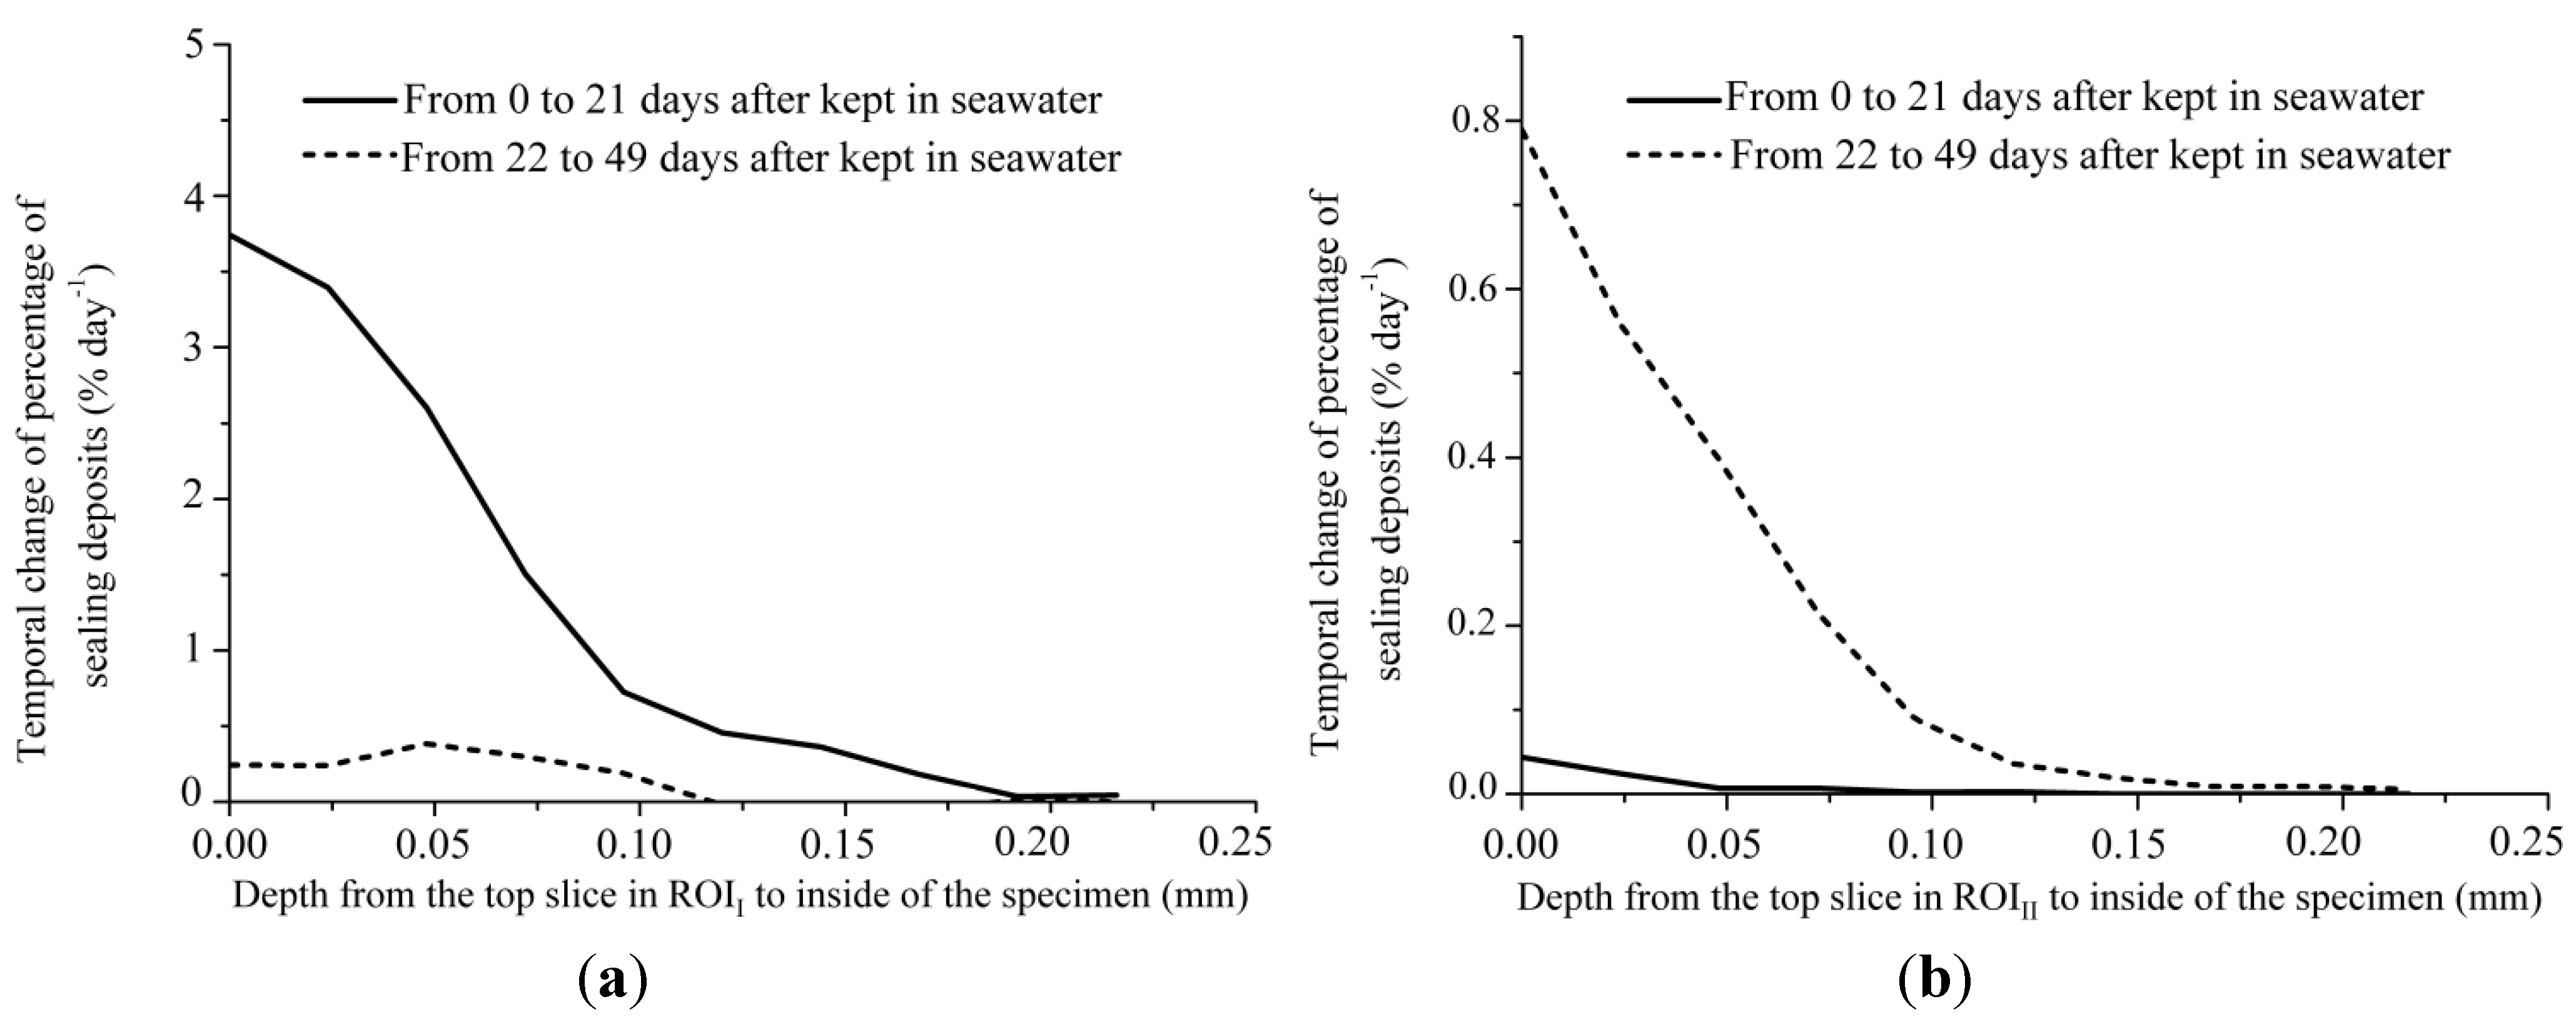
4.2. Results

5. Discussion

| Position | Pseal (%) | Mean fracture width, W (mm) | Fracture length, L (mm) | Area of precipitation calculated by Pseal × W × L (mm2) | |
|---|---|---|---|---|---|
| End I | Top in ROII | 85 | 0.08 | 1 | 0.068 |
| End II | Top in ROIII | 23 | 0.25 | 1 | 0.058 |
6. Conclusions
Acknowledgments
References
- Kawasaki, T.; Asano, H.; Owada, H.; Otsuki, A.; Yoshida, T.; Matsuo, T.; Shibuya, K.; Takei, A. Development of Waste Package for TRU-disposal (4)—Evaluation of Confinement Performance of TRU Waste Package Made of High-strength and Ultra Low-permeability Concrete. In Proceedings of GLOBAL 2005, Tsukuba, Japan, 9–13 October 2005; p. 254.
- Owada, H.; Otsuki, A.; Asano, H. Development of Waste Package for TRU-disposal (1)—Concepts and Performances. In Proceedings of GLOBAL 2005, Tsukuba, Japan, 9–13 October 2005; p. 351.
- Shibuya, K.; Asano, H.; Owada, H.; Otsuki, A.; Kawasaki, T.; Yoshida, T.; Matsuo, T.; Takei, A. Development of Waste Package for TRU-disposal (3)—Examination of Manufacturing Technique of TRU Waste Package Made of High-strength and Ultra Low-permeability Concrete. In Proceedings of GLOBAL 2005, Tsukuba, Japan, 9–13 October 2005; p. 256.
- Wu, M.; Johannesson, B.; Geiker, M. Review: Self-healing in Cementitious Materials and Engineered Cementitious Composite as A Self-healing Material. Constr. Build. Mater. 2012, 28, 571–583. [Google Scholar] [CrossRef]
- Edvardsen, C. Water permeability and autogenous healing of cracks in concrete. ACI Mater. J. 1999, 96, 448–455. [Google Scholar]
- Van der Zwaag, S. Self-healing Materials: An Alternative Approach to 20 Centuries of Material Science, 1st ed.; Springer: New York, NY, USA, 2007; pp. 1–204. [Google Scholar]
- Homma, D; Mihashi, H; Nishiwaki, T. Self-healing Capability of Fibre Reinforced Cementitious Composites. J. Adv. Concr. Technol. 2009, 7, 217–228. [Google Scholar]
- Qian, S.; Zhou, J.; de Rooij, M.R.; Schlangen, E.; Ye, G.; van Breugel, K. Self-healing Behavior of Strain Hardening Cementitious Composites Incorporating Local Waste Materials. Cem. Concr. Compos. 2009, 31, 613–621. [Google Scholar] [CrossRef]
- Yang, Y.; Lepech, M.D.; Yang, E.H.; Li, V.C. Autogenous healing of engineered cementitious composites under wet-dry cycles. Cem. Concr. Res. 2009, 39, 382–390. [Google Scholar] [CrossRef]
- Jacobsen, S.; Sellevold, E.J. Self healing of high strength concrete after deterioration by freeze/thaw. Cem. Concr. Res. 1996, 26, 55–62. [Google Scholar] [CrossRef]
- Hearn, N.; Morley, C.T. Self-sealing Property of Concrete—Experimental Evidence. Mater. Struct. 1997, 30, 404–411. [Google Scholar] [CrossRef]
- Hearn, N. Self-sealing, autogenous healing and continued hydration: What is the difference? Mater. Struct. 1997, 31, 563–567. [Google Scholar] [CrossRef]
- Reinhardt, H.; Jooss, M. Permeability and self-healing of cracked concrete as a function of temperature and crack width. Cem. Concr. Res. 2003, 33, 981–985. [Google Scholar] [CrossRef]
- Granger, S.; Loukili, A.; Pijaudier-Cabot, G.; Chanvillard, G. Experimental characterization of the self-healing of cracks in an ultra high performance cementitious material: Mechanical tests and acoustic emission analysis. Cem. Concr. Res. 2007, 37, 519–527. [Google Scholar] [CrossRef]
- Ahn, T.H.; Kishi, T. Crack Self-healing behavior of cementitious composites incorporating various mineral admixtures. J. Adv. Concr. Technol. 2010, 8, 171–186. [Google Scholar] [CrossRef]
- Heap, M.J.; Lavallée, Y.; Laumann, A.; Hess, K.U.; Meredith, P.G.; Dingwell, D.B.; Huismann, S.; Weise, F. The influence of thermal-stressing (up to 1000 °C) on the physical, mechanical, and chemical properties of siliceous-aggregate, high-strength concrete. Constr. Build. Mater. 2013, 42, 248–265. [Google Scholar] [CrossRef]
- Fukuda, D.; Nara, Y.; Kobayashi, Y.; Maruyama, M.; Koketsu, M.; Hayashi, D.; Ogawa, H.; Kaneko, K. Investigation of self-sealing in high-strength and ultra-low-permeability concrete in water using micro-focus X-ray CT. Cem. Concr. Res. 2012, 42, 1494–1500. [Google Scholar] [CrossRef] [Green Version]
- Gratier, J.P.; Chen, T.; Hellmann, R. Pressure Solution as a Mechanism for Crack Sealing around Faults; SGS Open-file Report 94-228. In Proceedings of Workshop LXIII on the Mechanical Involvement of Fluids in Faulting, Menlo Park, CA, USA, 6–10 June 1994; pp. 279–300.
- Evans, J.P.; Chester, F.M. Fluid–rock interaction in faults of the San Andreas system: Inferences form San Gabriel fault rock geochemistry and microstructures. J. Geophys. Res. 1995, 100, 13007–13020. [Google Scholar] [CrossRef]
- Fisher, D.M.; Brantley, S.L. Models of quartz overgrowth and vein formation: Deformation and episodic fluid flow in an ancient subduction zone. J. Geophys. Res. 1992, 97, 20043–20061. [Google Scholar]
- Tsang, C.-F.; Bernier, F.; Davies, C. Geohydromechanical processes in the excavation damaged zone in crystalline rock, rock salt, and indurated and plastic clays—In the context of radioactive waste disposal. Int. J. Rock Mech. Min. Sci. 2005, 42, 109–125. [Google Scholar] [CrossRef]
- Graef, B.D.; Cnudde, V.; Dick, J.; Belie, N.D.; Jacobs, P.; Verstraete, W. A sensitivity study for the visualisation of bacterial weathering of concrete and stone with computerised X-ray microtomography. Sci. Total. Environ. 2005, 341, 173–183. [Google Scholar]
- Japan Society of Civil Engineers. Recommendations for Design and Construction of Ultra High Strength Fiber Reinforced Concrete Structures—Draft [in Japanese]; Japan Society of Civil Engineers: Tokyo, Japan, 2004; Concrete Library 113; pp. 56–62. [Google Scholar]
- Nara, Y.; Takada, M.; Mori, D.; Owada, H.; Yoneda, T.; Kaneko, K. Subcritical crack growth and long-term strength in rock and cementitious material. Int. J. Fract. 2010, 164, 57–71. [Google Scholar] [CrossRef]
- Hondros, G. The Evaluation of poisson’s ratio and the modulus of materials of a low tensile resistance by the brazilian (indirect tensile) test with particular reference to concrete. Aust. J. Appl. Sci. 1959, 10, 243–268. [Google Scholar]
- International Society for Rock Mechanics; Commission on Standardization of Laboratory and Field Tests. Suggested Methods for Determining Tensile Strength of Rock Materials. Int. J. Rock Mech. Min. Sci. Geomech. Abstr. 1978, 15, 99–103. [Google Scholar]
- Mizukami, M.; Sakai, H.; Matsubaya, O. Na-Ca-Cl-SO4-type submarine formation waters at the seikan undersea tunnel, Japan. chemical and isotopic documentation and its interpretation. Geochim. Cosmochim. Acta 1977, 41, 1201–1212. [Google Scholar] [CrossRef]
- Iwatsuki, T.; Furue, R.; Mie, H.; Ioka, S.; Mizuno, T. Hydrochemical baseline condition of groundwater at the Mizunami Underground Research Laboratory (MIU). Appl. Geochem. 2005, 20, 2283–2302. [Google Scholar] [CrossRef]
- Hama, K.; Kunimaru, T.; Metcalfe, R.; Martin, A.J. The hydrogeochemistry of argillaceous rock formations at the horonobe URL site, Japan. Phys. Chem. Earth 2007, 32, 170–180. [Google Scholar] [CrossRef]
- Kawaragi, C.; Yoneda, T.; Sato, T.; Kaneko, K. Microstructure of saturated bentonites characterized by X-ray CT observations. Eng. Geol. 2009, 106, 51–57. [Google Scholar] [CrossRef]
- Nara, Y.; Meredith, P.G.; Yoneda, T.; Kaneko, K. Influence of Macro-fractures and Micro-fractures on permeability and elastic wave velocities in basalt at elevated pressure. Tectonophysics 2011, 503, 52–59. [Google Scholar] [CrossRef]
- Ketcham, R.A.; Carlson, W.D. Acquisition, optimization, and interpretation of X-ray computed tomographic imagery: Applications to the geosciences. Comput. Geosci. 2001, 27, 381–400. [Google Scholar] [CrossRef]
- Kitamoto, A. A maximum likelihood thresholding methods considering the effect of mixels [in Japanese with English abstract]. Tech. Rep. IEICE 1999, PRMU99-166, 7–14. [Google Scholar]
- Kitamoto, A.; Takagi, M. Image classification using probabilistic models that reflect the internal structure of mixels. Pattern Anal. Appl. 1999, 2, 31–43. [Google Scholar] [CrossRef]
- Choi, H.S.; Haynor, D.R.; Kim, Y. Partial volume tissue classification of multichannel magnetic resonance images—A mixel model. IEEE Trans. Med. Imag. 1991, 10, 395–407. [Google Scholar] [CrossRef]
- Radioactive Waste Management Funding and Research Center. Research and Development of Processing and Disposal Technique for TRU Waste Containing I-129 and C-14 [in Japanese]; Radioactive Waste Management Funding and Research Center: Tokyo, Japan, 2009; Volume 2. [Google Scholar]
- Maruyama, M.; Fukuda, D.; Nakabayashi, R.; Kaneko, K.; Nara, Y.; Ogawa, H. Observation of Sealing Behavior of Fracture in Cementitious Materials by X-ray CT and SEM-EDX. In Proceedings of Mini-Symposium “X-ray CT Application in Geotechnical Engineering” in the 2012 International Conference on Geomechanics & Engineering, Seoul, Korea, 26–29 August 2012; pp. 229–241.
- Gueguen, Y.; Dienes, J. Transport properties of rocks from statistics and percolation. Math. Geol. 1989, 21, 1–13. [Google Scholar] [CrossRef]
© 2013 by the authors; licensee MDPI, Basel, Switzerland. This article is an open access article distributed under the terms and conditions of the Creative Commons Attribution license (http://creativecommons.org/licenses/by/3.0/).
Share and Cite
Fukuda, D.; Nara, Y.; Hayashi, D.; Ogawa, H.; Kaneko, K. Influence of Fracture Width on Sealability in High-Strength and Ultra-Low-Permeability Concrete in Seawater. Materials 2013, 6, 2578-2594. https://doi.org/10.3390/ma6072578
Fukuda D, Nara Y, Hayashi D, Ogawa H, Kaneko K. Influence of Fracture Width on Sealability in High-Strength and Ultra-Low-Permeability Concrete in Seawater. Materials. 2013; 6(7):2578-2594. https://doi.org/10.3390/ma6072578
Chicago/Turabian StyleFukuda, Daisuke, Yoshitaka Nara, Daisuke Hayashi, Hideo Ogawa, and Katsuhiko Kaneko. 2013. "Influence of Fracture Width on Sealability in High-Strength and Ultra-Low-Permeability Concrete in Seawater" Materials 6, no. 7: 2578-2594. https://doi.org/10.3390/ma6072578
APA StyleFukuda, D., Nara, Y., Hayashi, D., Ogawa, H., & Kaneko, K. (2013). Influence of Fracture Width on Sealability in High-Strength and Ultra-Low-Permeability Concrete in Seawater. Materials, 6(7), 2578-2594. https://doi.org/10.3390/ma6072578