Fluorescence Sensing of the Interaction between Biomembranes with Different Lipid Composition and Endocrine Disrupting Chemicals

Abstract
: Fluorescence sensing of the interaction between biomembranes with different lipid composition and endocrine disrupting chemicals (EDCs) was carried out by using a liposome-encapsulating fluorescence dye (carboxyfluorescein (CF)-liposome). We detected a significant increase in fluorescence intensity in CF-liposome solutions due to the leakage of fluorescence caused by the interaction of EDCs with the biomembranes of liposomes. The temporal increases in fluorescent were significantly different among the lipid compositions of CF-liposome and the EDCs. Results were considered by summarizing the interactions in radar charts and by showing the pattern of interaction of each EDC. Each chart showed a dissimilar pattern reflecting the complexity of the biomembrane-EDC interaction. The results indicate that this fluorescence sensing could be useful to evaluate the interaction.1. Introduction
Endocrine disrupting chemicals (EDCs) are organic chemicals that interfere with the endocrine system [1]. Recently, some reports based on in vivo and in vitro experiments have suggested that exposure to EDCs may cause adverse effects on sexually-dimorphic behaviors, reproduction, and neurodevelopment [2,3]. To assess harmful potential of EDCs on wildlife and human, it is important to evaluate the interaction between EDCs and biomembrane as the interaction and then passive distribution is one of transport route of EDCs from environment to an organism. Some EDCs, such as bisphenol A, have multi-pathway mediated transporters and receptors on the surface of cell membranes [4–8], and some EDCs are transported through active transport [9]. Electrostatic properties of some environmental chemicals are related to such transportation [10]. In addition, some EDCs are transported passively through biomembrane, by interaction between EDCs and the membrane. We have been investigating the interaction and related properties of EDCs have been examined, such as hydrophobic property and polarizability, to date [11]. In this study, we consider that the EDCs-biomembrane interactions should not be overlooked for a better understanding of the behavior of EDCs.
Langmuir-Blodgett film, the bilayer lipid membrane, and liposomes, are useful biomembrane models that have been used to evaluate the permeability of cell membranes to environmental organic pollutants, including structurally diverse EDCs [12–14]. Liposomes, bilayers of lipid vesicles, are an excellent model of biological membranes. They are convenient sensing materials due to their simple preparation, varied functionalization, and easy to handle.
Kwon et al. [15,16] showed that 20 structurally diverse EDCs permeated into the membrane of liposomes and evaluated the EDC’s permeability as liposome/water partition coefficient by using large unilamellar liposomes with dipalmitoylphosphatidylcholine (DPPC).
We have examined the penetration of EDCs into biomembrane models in order to detect EDCs by using a liposome-based membrane model [17–19]. In our previous work, we used liposome-encapsulating self-quenching carboxyfluoresceine (CF-liposome) and demonstrated that it could detect EDCs as there was an increase in fluorescence intensity caused by the induced release of the encapsulated carboxyfluorescein from the inside to the outside of the liposomes [11].
In this work, we applied the sensing principle to evaluate the interaction between EDCs and the biomembranes with different lipid composition, and to fulfill pattern analysis of EDCs by using CF-liposomes as the lipid compositions of biomembranes differ widely in biological species and organs [20]. Pattern analysis is useful to consider the complex analysis of groups, such as food, drinks, drugs, and environmental pollutants. Toko et al. [21,22] reported the interaction between various compositions of artificial lipid membranes and substances with different tastes (e.g., salty, sour, sweet, etc.), and its application to multichannel taste sensors. These sensors are as because they could quantify a basic taste without multivariate analysis. A similar method for the analysis of the interaction between a cell membrane model and environmental pollutants has never been reported.
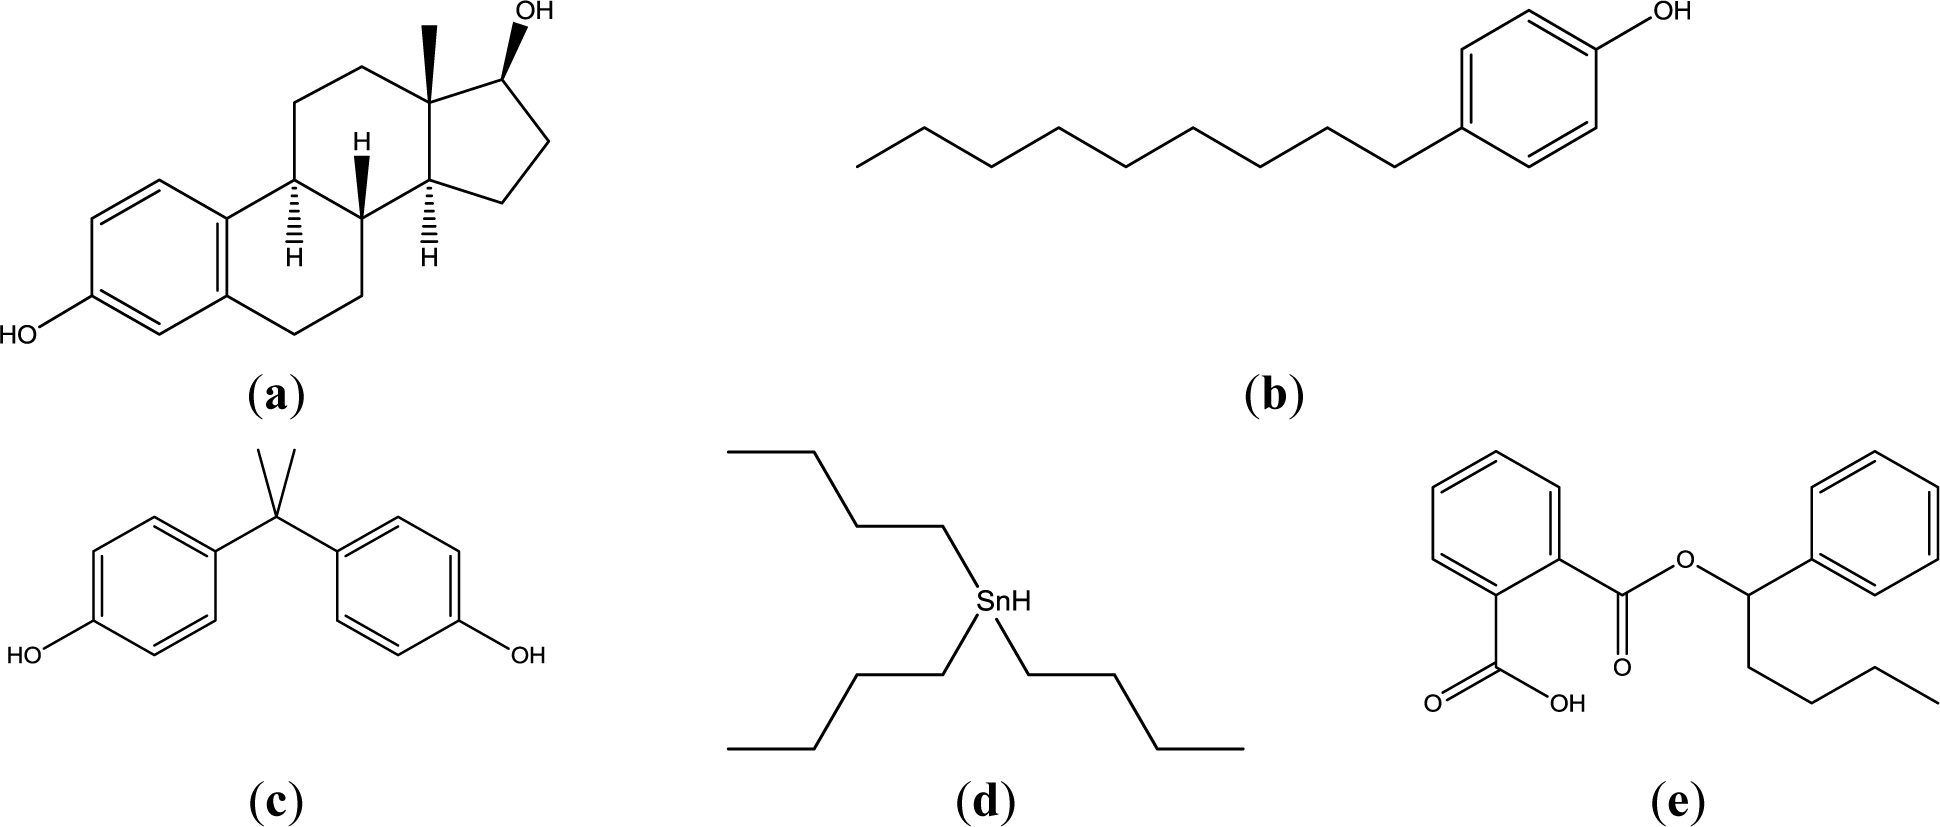
Actual mammalian cell membrane is constituted of glycerophospholipids, sphingophospholipids, cholesterol, and so on. In these lipids, glycerophospholipids (mainly phosphatidylcholine and phosphatidylethanolamine), which are not a single molecular species, are main components. In this study, phosphatidyldholine and phosphatidlethanolamine was substituted by 1,2-dipalmitoyl-sn-glycero-3-phosphocholine (DPPC), and 1,2-dioleoyl-sn-glycero-3-phosphoethanolamine (DOPE) to understand the interaction simply. This lipid and cholesterol were examined as liposomes with four lipid compositions. Four EDCs, namely nonylphenol (NPh), bisphenol A (BPA), buthylbenzylphthalate (BBP), and tributyltin (TBT), were examined as they are widespread around the world in water and food chains, and because their chemical structures are not similar (Figure 1).
2. Results and Discussion
2.1. Fluorescence Changes of the CF-Liposomes
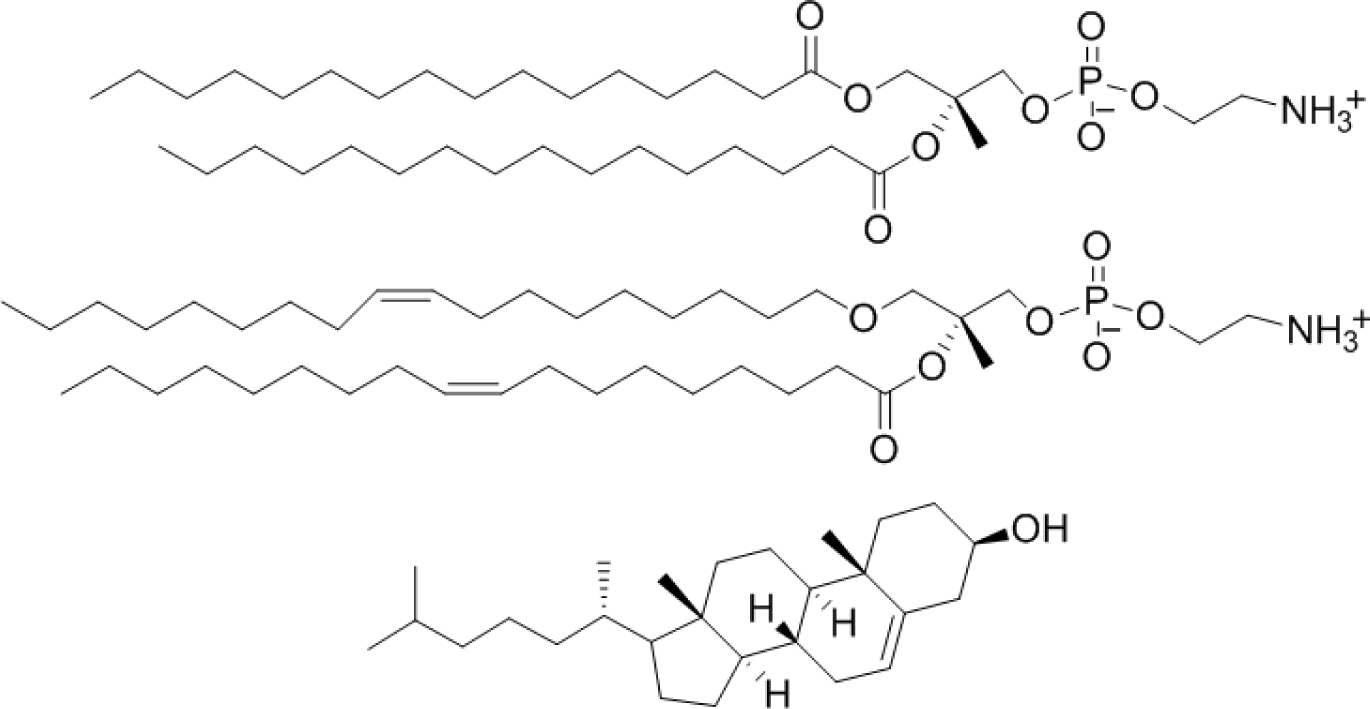
Liposomes with four different lipids compositions were prepared; DPPC = 100% (DPPC-CF-liposome), DPPC:cholesterol = 80:20 mol% (PCch-CF-liposome), DPPC:DOPE = 50:50 mol% (PCPE-CF-liposome), and DPPC:DOPE:cholesterol = 40:40:20 mol% (PCPEch-CF-liposome) were prepared. The chemical structures of the lipids, DPPC, DOPE, and cholesterol are shown in Figure 2.
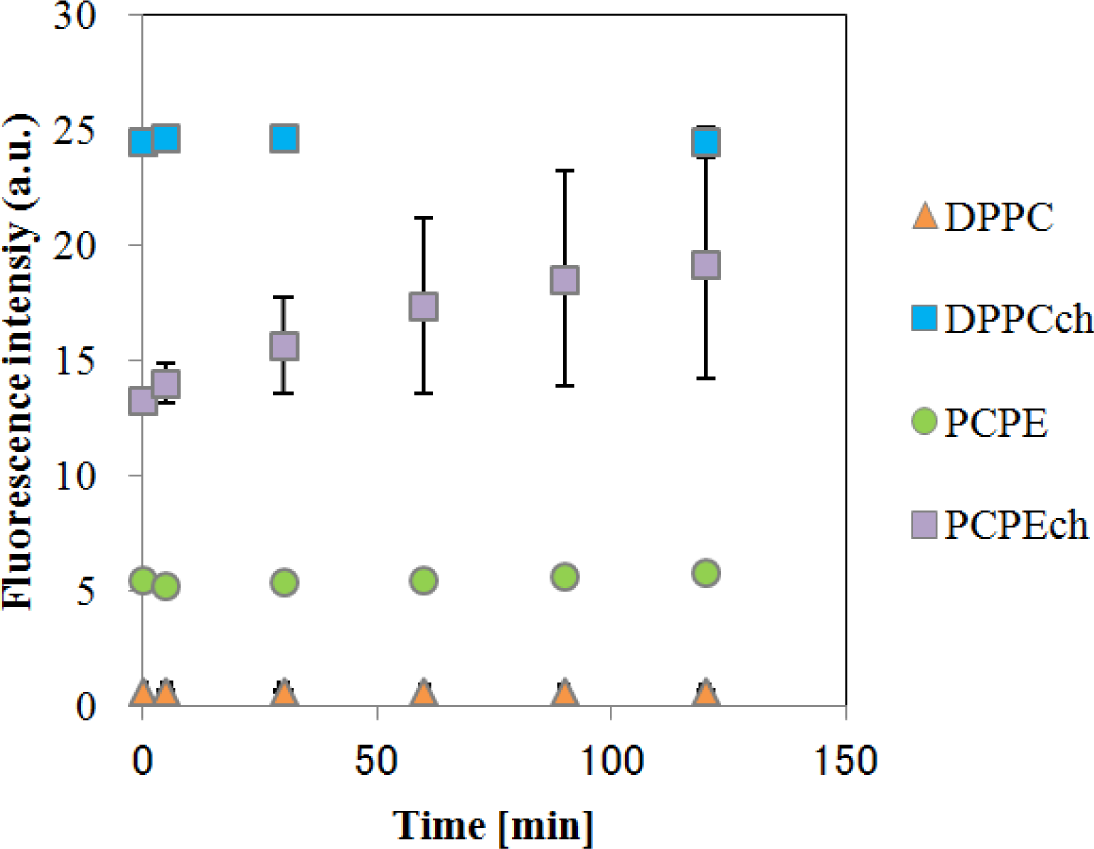
The temporal changes in fluorescence of CF-liposomes are shown in Figure 3. All liposomes, except for DPPC-CF-liposome, showed a slight increase in fluorescence intensity caused by natural leakage of fluorescence dye. As the increases were gradual, these natural leakages were corrected to consider the effect of EDCs on the liposome membrane. For the correction, fluorescence during the interaction between EDCs and liposomes (Fi) were divided by the fluorescence of natural leakage (Fn) and Fi/Fn was defined as F. The fluorescence intensity of CF-liposomes ruptured forcibly by 0.1% (v/v) Triton-X 100 was used as the standard (FT) for normalization as each measurement for the CF-liposomes with each lipid composition was carried out on an individual microplate.
2.2. Interactions of EDCs or the Natural Hormone to Biomembrane
The interaction of EDCs or the natural hormone to biomembrane (IF), measured by fluorescence, was calculated according to Equation (1):
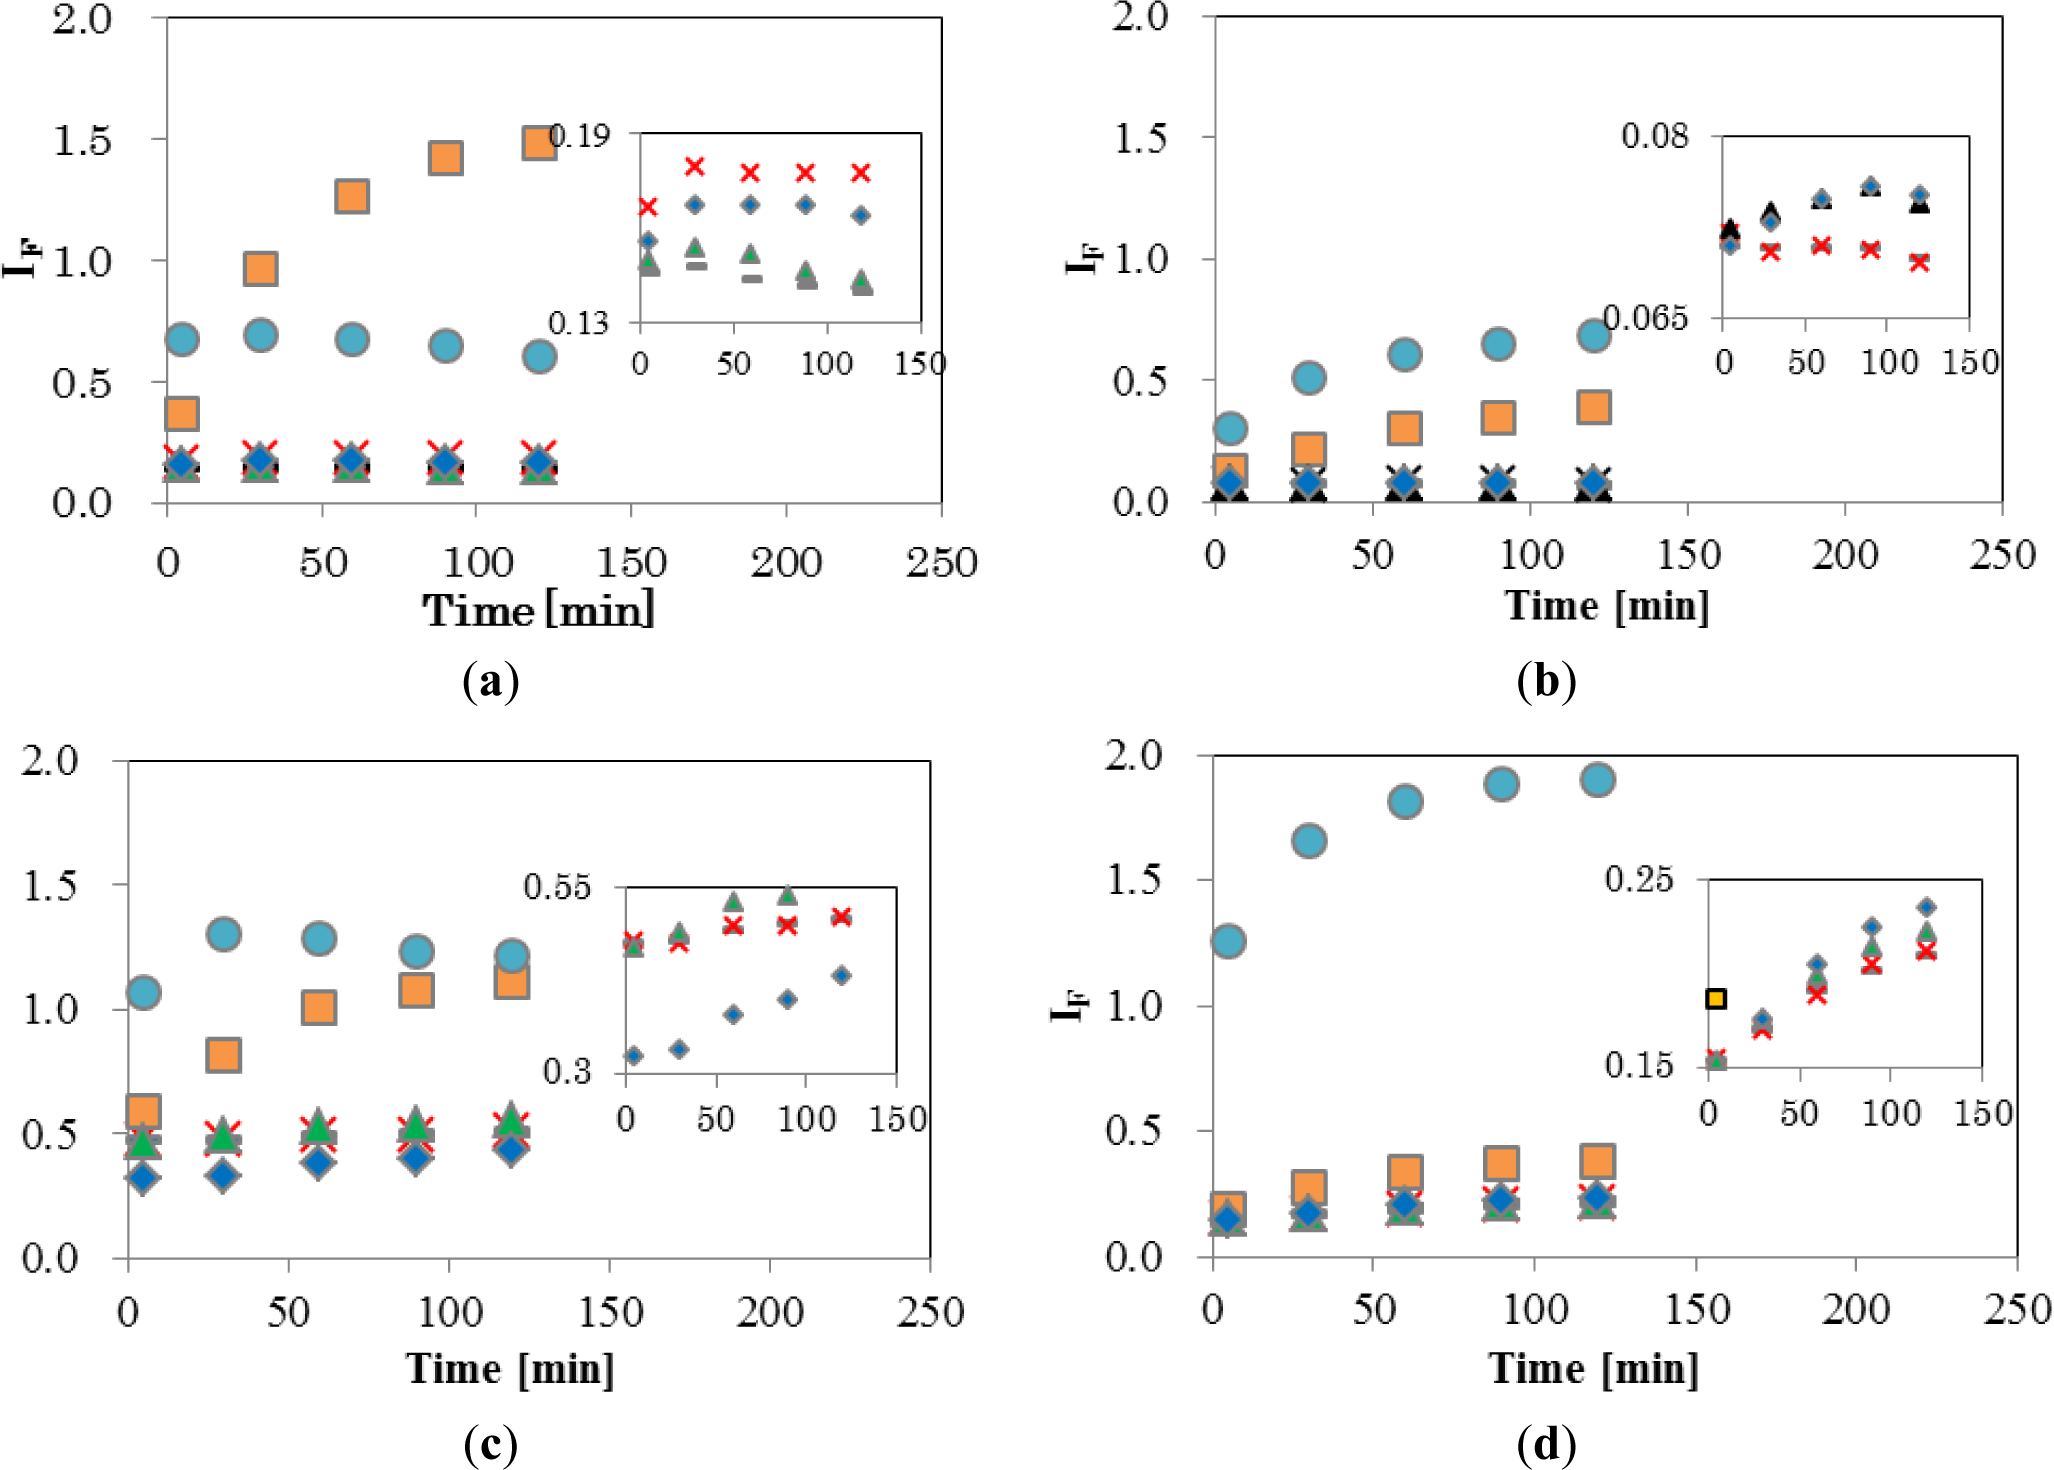
Figure 4 shows the temporal changes in IF of the four EDCs and natural hormone (β-estradiol; E2), while the inset shows an enlargement of the range of low IF. The final concentrations of EDCs and E2 were 5 ppm (mg/L). As shown in Figure 4a, DPPC-CF-liposome, IF of NPh, and TBT, increased significantly. A gradual increase of IF by NPh was observed during 120 min, finally reaching 1.48. On the other hand, the IF of TBT increased quickly and reached a plateau after 5 min of interaction with TBT. These different patterns of increase between NPh and TBT indicate that these molecules behave differently in the membrane. A comparison of the chemical structure between NPh and TBT supports the differences in increasing patterns. As the NPh molecule has a polar group, an alkyl chain and has a rod-like shape, it might penetrate into the DPPC membrane by a hydrophobic interaction between the membrane and the alkyl chain of NPh, and wander among the lipid molecules in the membrane, thus, bringing about an increase in membrane fluidity. The gradual release of CF from liposomes continued over 120 min. On the other hand, the TBT molecule has three non-polar butyl groups and has a plane-like shape. Thus, it was considered that TBT molecules penetrate into the DPPC membrane rapidly with a leakage of CF and then fix to the surrounding lipid molecules by a hydrophobic interaction.
E2, BPA, and BBP showed low IF of DPPC-CF-liposome (Figure 4a inset). These chemicals were reported to undergo the pathway, mediated with transporters and receptors on the surface of cell membrane.
Figure 4b shows a plot of the DPPCch-CF-liposome. All values of IF, except for NPh, were lower than IF values of DPPC-CF-liposome. Cholesterol in the CF-liposome may have stabilized the membrane and the stable membrane may, in turn, have prevented the leakage of dye from liposomes after interacting with EDCs.
Figure 4c shows the IF of PCPE-CF-liposome. Compared to DPPC-CF-liposome (Figure 4a), all values of IF, except for NPh, were higher. The increase in IF might be occurred by phase effect and an increase in membrane fluidity. As the phase transition temperature (Tc) of DPPC and DOPE are 41 °C and −18 °C, respectively, the membrane of PCPE-CF-liposome were mixture of gel phase DPPC lipids and liquid crystalline phase (Lc) DOPC lipids. The addition of the Lc phase lipids in the membrane make the membrane more fluidic than that of DPPC-CF-liposome.
Figure 4d shows the plot of PCPEch-CF-liposome. The values of IF, except for TBT, were lower than that of PCPE-CF-liposome (Figure 4c), but higher than that of DPPCch-CF-liposome (Figure 4b). The effect of cholesterol to the interaction between liposome and EDCs was consistent in PCPE membrane and DPPC membrane.
These results indicate that changes in membrane fluidity, including the phase effect after the interaction with EDCs, is one of the most effective properties of IF. However, there are likely to be unknown properties of IF as NPh and TBT behaved differently to other EDCs. The chemical structure of TBT is significantly different from the structure of other EDCs. TBT is hydrophobic and has three flexible alkyl chains, the latter supposedly being easier to penetrate into the inside of the bilayer lipid membrane of liposomes than other EDCs, and change the fluidic properties of the membrane through their hydrophobic interaction with surrounding lipid molecules. Thus, IF reflects the complex interaction through a combination of the property of lipid, the lipid composition, and the chemical property of EDCs. Although it is important to elucidate the factors and mechanisms causing the change in IF, the method used to evaluate for this complex interaction is also important.
As the lowest EDCs concentration of the appearance of biological effect in human breast cancer and trophoblast cells was 1 μM [23–26], it was reasonable that the interaction in the present study occurred at 5 ppm (NPh; 22 μM, BPA; 22 μM, BBP; 16 μM, TBT and 17 μM). As a large increase of IF was observed in NPh and TBT, this sensing method would have the potential to detect the interaction at the lower concentration of EDCs.
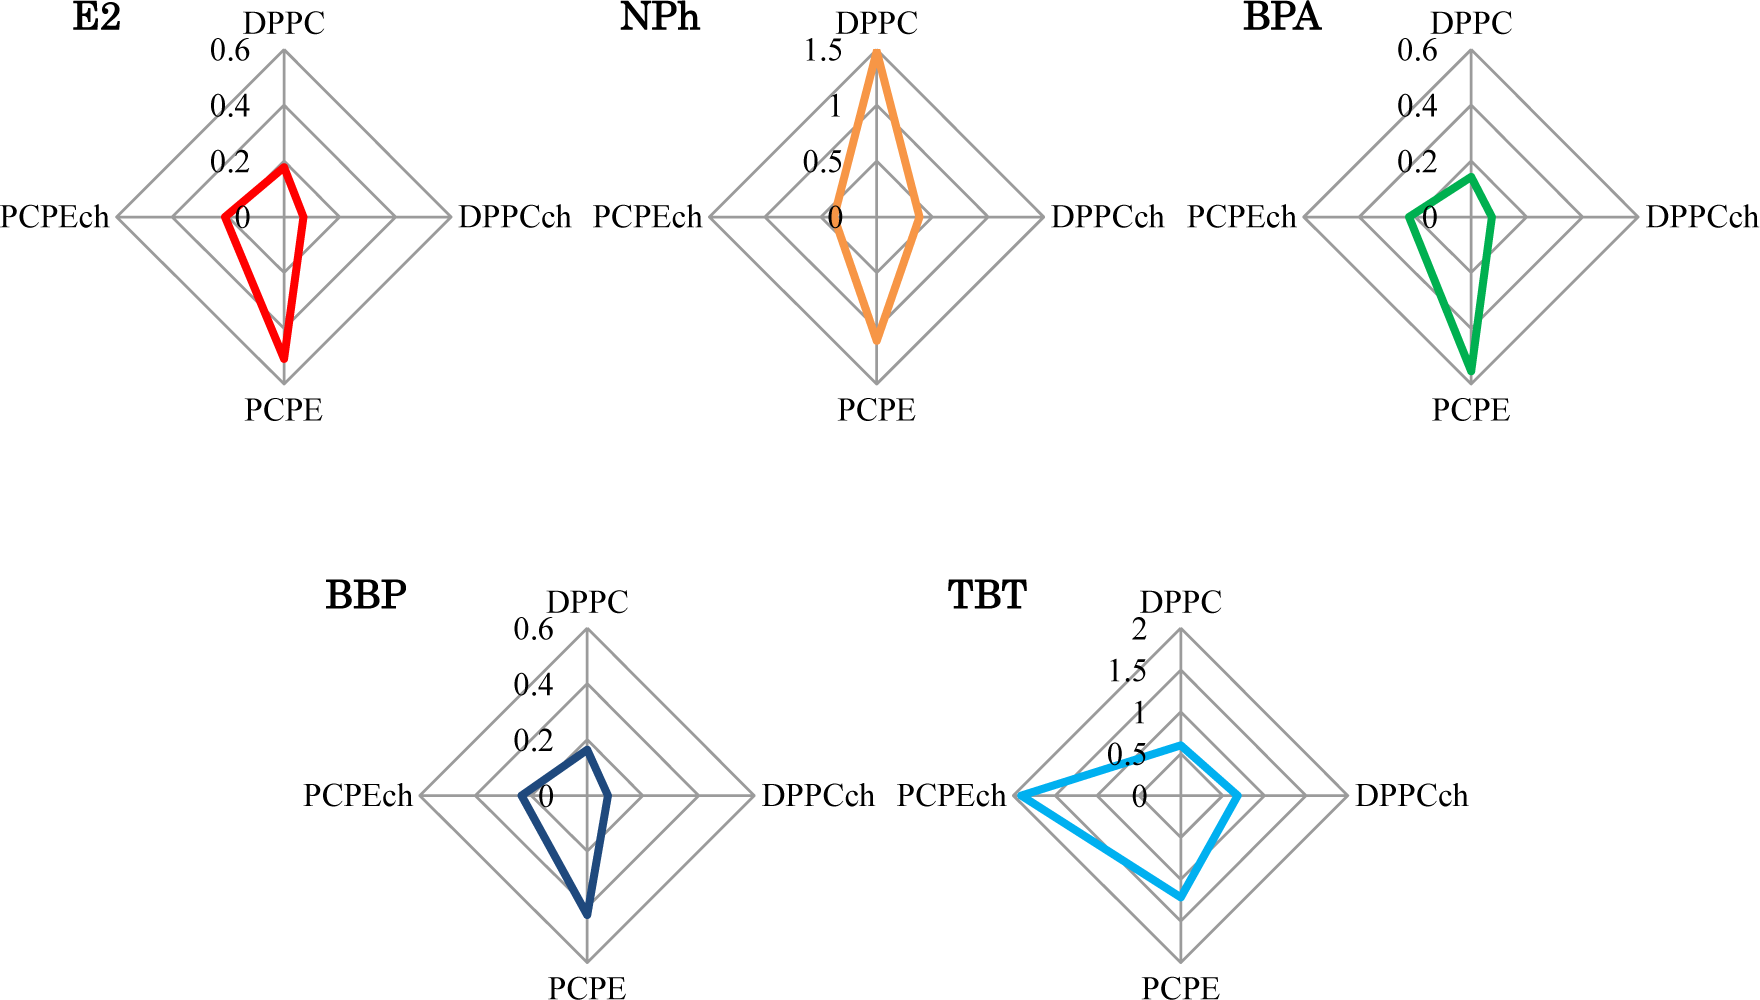
2.3. Pattern Analysis of EDCs with CF-Liposomes
The liposomes with different lipid composition showed varying interactions after exposure to four EDCs. To consider these complex interactions, the IF values after 120 min were summarized in radar charts (Figure 5). Interestingly, no EDC showed the same result. Although the charts of the chemicals (E2, BPA, and BBP), which have the pathways different from the interaction with lipid membrane in cell membrane, were similar, they were not identical. These dissimilar patterns imply the presence of effective factors caused by the chemical properties of each EDCs and/or the interaction between EDCs and membranes. These complex interactions are likely to be an obstacle in our understanding of EDCs. In general, different animal species, such as fish or mammals, and their organs, such as brain or liver, are composed of different lipids. This differentiation indicated the importance of the evaluation of the interaction between the membrane composed with various lipid and EDCs. Although in the human body, temperature and pH are maintained constant by homeostasis, the interaction also might be affected by the environmental physico-chemical condition, such as temperature and pH. Temperature change causes lipids phase transition and pH change shift the chemical property of EDCs, such as solubility of water [27] and liposome-water distribution ratio [28]. Our results in the chart suggest the necessary of the global evaluation of membrane-EDCs interaction.
3. Experimental Section
3.1. Materials
DPPC, cholesterol and 5(6)-carboxyfluorescein (CF) was obtained from Sigma-Aldrich Co. Ltd., Tokyo, Japan. DOPE was purchased from Avanti Polar Lipid, Inc. NPh and BPA were purchased from Kanto Chemical Co., Inc. BBP was obtained from Wako Pure Chemical Industries, Ltd., Osaka, Japan. NPh, BPA, BBP, and TBT were of laboratory grade and were used without further purification.
Water used in this study was purified to 18.3 MΩ by a Mill Q SP system.
3.2. Liposome Preparation
Liposomes were prepared according our previous report [11]. The lipids were dissolved in a glass vial by 1.5 mL organic solvent (chloroform:methanol = 90%:10%, v/v). The final concentration of total lipids, including cholesterol, was 26.7 mM. The solvent was removed by nitrogen gas, and completely evaporated in a desiccator overnight. Calboxyfluorescein (CF) solution (1.5 mL of 0.15 M CF in 10 mM phosphate buffer) was added to hydrate the lipid films by incubating at the above Tc overnight. Then the solution was sonicated with a microchip sonicator for 10 min. Immediately after sonication, the liposome suspension was filtered several times through a polycarbonate nucleopore membrane with a 0.4 μm pore size and then re-filtrated twice through the same type of membrane with a 0.2 μm pore size. The prepared liposomes were smaller than 0.2 μm in a diameter. The liposomes encapsulating CF were separated from free CF by centrifugation at 30,000 rpm, 4 °C, for 30 min after dilution of the external solution with water. The precipitated liposomes were resuspended in 2 mL of 10 mM phosphate buffer solution (PB) at pH 7.0. The suspension was stored at 4 °C.
3.3. Fluorometric Analysis
The CF-liposome suspensions were prepared in 1 mL of PB. The prepared suspension was diluted to 33.4 μM in a final lipid concentration with PB. As the high concentration of the encapsulated dye led to self-quenching, the resulting fluorescence intensity of the liposome suspension was very weak. To evaluate the interaction of each chemical to liposomes, 200 μL of each liposome was mixed with 5 ppm (5 mg/L) of EDCs in a 96-well micro plate (Corning) and kept at 25 °C for 120 min. Fluorescence intensity was measured with a microfluorometer (Fluoreskan Ascent, Thermo Fisher Scientific K.K., Yokohama, Japan) at an exciting wavelength of 490 nm and emission wavelength of 515 nm, 5 min after mixing with EDCs and then at 30, 60, 90, and 120 min.
4. Conclusions
We prepared four types of lipid composition liposomes to investigate the interaction between biomembranes with these different lipid compositions and EDCs with dissimilar chemical structures. All the prepared liposomes that encapsulated self-quenching fluorescence dye showed an increase in fluorescence intensity after exposure to the EDCs. Differences of the temporal increase indicated that the interaction between biomembrane and the chemical nature of EDCs depend on not only the membrane fluidity of lipids but also other potential factors. We summarized the differentiation of the interactions in radar charts. Each chart showed dissimilar pattern considered due to the complexity biomembrane-EDCs interaction occurred by preceding multi-factors. This is the first report of fluorescence-based sensing of the different interaction between the different lipid composition biomembranes and EDCs. Owing to their easy preparation and handling, liposomes are friendly biomaterials to combine high-throughput analysis systems, such as a micro electro mechanical systems technique. Thus, this fluorescence sensing, by using CF-liposomes, is expected to apply the global pattern analysis for the interaction between various lipid composition biomembrane.
Acknowledgments
This research was supported by MEXT KAKENHI Grant Number 23710150 and in part by funding from MEXT, the Matching Fund for Private Universities, S1001013, 2010–2015.
Conflicts of Interest
The authors declare no conflict of interest.
References
- Colborn, T.; Saal, F.S.V.; Soto, A.M. Developmental effects of endocrine-disrupting chemicals in wildlife and humans. Environ. Health Persp 1993, 101, 378–384. [Google Scholar]
- Frye, C.A.; Bo, E.; Calamandrei, G.; Calza, L.; Dessi-Fulgheri, F.; Fernandez, M.; Fusani, L.; Kah, O.; Kajta, M.; Le Page, Y.; et al. Endocrine disrupters: A review of some sources, effects, and mechanisms of actions on behaviour and neuroendocrine systems. J. Neuroendocrinol 2012, 24, 144–159. [Google Scholar]
- Wetherill, Y.B.; Akingbemi, B.T.; Kanno, J.; McLachlan, J.A.; Nadal, A.; Sonnenscheing, C.; Watson, C.S.; Zoeller, R.T.; Belcher, S.M. In vitro molecular mechanisms of bisphenol a action. Reprod. Toxicol 2007, 24, 178–198. [Google Scholar]
- Alonso-Magdalena, P.; Laribi, O.; Ropero, A.B.; Fuentes, E.; Ripoll, C.; Soria, B.; Nadal, A. Low doses of bisphenol a and diethylstilbestrol impair Ca2+ signals in pancreatic alpha-cells through a nonclassical membrane estrogen receptor within intact islets of langerhans. Environ. Health Persp 2005, 113, 969–977. [Google Scholar]
- Alonso-Magdalena, P.; Ropero, A.B.; Carrera, M.P.; Cederroth, C.R.; Baquie, M.; Gauthier, B.R.; Nef, S.; Stefani, E.; Nadal, A. Pancreatic insulin content regulation by the estrogen receptor ER alpha. PLos One 2008, 3, e2069. [Google Scholar]
- Rubin, B.S.; Bisphenol, A. An endocrine disruptor with widespread exposure and multiple effects. J. Steroid Biochem. Mol. Biol 2011, 127, 27–34. [Google Scholar]
- Watson, C.S.; Bulayeva, N.N.; Wozniak, A.L.; Finnerty, C.C. Signaling from the membrane via membrane estrogen receptor-alpha: Estrogens, xenoestrogens, and phytoestrogens. Steroids 2005, 70, 364–371. [Google Scholar]
- Hsieh, T.H.; Tsai, C.F.; Hsu, C.Y.; Kuo, P.L.; Lee, J.N.; Chai, C.Y.; Wang, S.C.; Tsai, E.M. Phthalates induce proliferation and invasiveness of estrogen receptor-negative breast cancer through the ahr/hdac6/c-myc signaling pathway. FASEB J 2012, 26, 778–787. [Google Scholar]
- Agretti, P.; Dimida, A.; de Marco, G.; Ferrarini, E.; Gonzalez, J.C.R.; Santini, F.; Vitti, P.; Pinchera, A.; Tonacchera, M. Study of potential inhibitors of thyroid iodide uptake by using CHO cells stably expressing the human sodium/iodide symporter (hNIS) protein. J. Endocrinol. Invest 2011, 34, 170–174. [Google Scholar]
- Waller, C.L.; Oprea, T.I.; Chae, K.; Park, H.K.; Korach, K.S.; Laws, S.C.; Wiese, T.E.; Kelce, W.R.; Gray, L.E. Ligand-based identification of environmental estrogens. Chem. Res. Toxicol 1996, 9, 1240–1248. [Google Scholar]
- Nakane, Y.; Ito, M.M.; Kubo, I. Novel detection method of endocrine disrupting chemicals utilizing liposomes as cell membrane model. Anal. Lett 2008, 41, 2923–2932. [Google Scholar]
- Gobas, F.; Lahittete, J.M.; Garofalo, G.; Wan, Y.S.; Mackay, D. A novel method for measuring membrane-water partition-coefficients of hydrophobic organic-chemicals-comparison with 1-octanol-water partitioning. J. Pharm. Sci 1988, 77, 265–272. [Google Scholar]
- Escher, B.I.; Schwarzenbach, R.P.; Westall, J.C. Evaluation of liposome-water partitioning of organic acids and bases. 1. Development of a sorption model. Environ. Sci. Technol 2000, 34, 3954–3961. [Google Scholar]
- Yamamoto, H.; Liljestrand, H.M. Partitioning of selected estrogenic compounds between synthetic membrane vesicles and water: Effects of lipid components. Environ. Sci. Technol 2004, 38, 1139–1147. [Google Scholar]
- Kwon, J.H.; Liljestrand, H.M.; Katz, L.E. Partitioning of moderately hydrophobic endocrine disruptors between water and synthetic membrane vesicles. Environ. Toxicol. Chem 2006, 25, 1984–1992. [Google Scholar]
- Kwon, J.H.; Liljestran, H.M.; Katz, L.E.; Yamamoto, H. Partitioning thermodynamics of selected endocrine disruptors between water and synthetic membrane vesicles: Effects of membrane compositions. Environ. Sci. Technol 2007, 41, 4011–4018. [Google Scholar]
- Nakane, Y.; Kubo, I. Degradation of liposome cluster caused by the interaction with endocrine disrupting chemicals (EDCs). Colloids Surf. B Biointerfaces 2008, 66, 60–64. [Google Scholar]
- Nakane, Y.; Kubo, I. Biosensor for the detection of endocrine disrupting chemicals based on the degradation of cell membrane model immobilized on qcm and its application to the detection of nonylphenol. Electrochemistry 2008, 76, 535–537. [Google Scholar]
- Nakane, Y.; Kubo, I. Layer-by-layer of liposomes and membrane protein as a recognition element of biosensor. Thin Solid Films 2009, 518, 678–681. [Google Scholar]
- Alberts, B.; Johnson, A.; Lewis, J.; Raff, M.; Roberts, K.; Walter, P. Molecular Biology of the Cell, 5th ed; Garland Science: New York, NY, USA, 2008. [Google Scholar]
- Toko, K. Taste sensor. Sens. Actuat. B Chem 2000, 64, 205–215. [Google Scholar]
- Kobayashi, Y.; Habara, M.; Ikezazki, H.; Chen, R.; Naito, Y.; Toko, K. Advanced taste sensors based on artificial lipids with global selectivity to basic taste qualities and high correlation to sensory scores. Sensors 2010, 10, 3411–3443. [Google Scholar]
- Bechi, N.; Sorda, G.; Spagnoletti, A.; Bhattacharjee, J.; Ferro, E.A.V.; Barbosa, B.D.; Frosini, M.; Valoti, M.; Sgaragli, G.; Paulesu, L.; et al. Toxicity assessment on trophoblast cells for some environment polluting chemicals and 17 beta-estradiol. Toxicol. Vitro 2013, 27, 995–1000. [Google Scholar]
- Morck, T.J.; Sorda, G.; Bechi, N.; Rasmussen, B.S.; Nielsen, J.B.; Ietta, F.; Rytting, E.; Mathiesen, L.; Paulesu, L.; Knudsen, L.E. Placental transport and in vitro effects of Bisphenol A. Reprod. Toxicol 2010, 30, 131–137. [Google Scholar]
- Blom, A.; Ekman, E.; Johannisson, A.; Norrgren, L.; Pesonen, M. Effects of xenoestrogenic environmental pollutants on the proliferation of a human breast cancer cell line (MCF-7). Arch. Environ. Contam. Toxicol 1998, 34, 306–310. [Google Scholar]
- Mankidy, R.; Wiseman, S.; Ma, H.; Giesy, J.P. Biological impact of phthalates. Toxicol. Lett 2013, 217, 50–58. [Google Scholar]
- Larry, T.; Brooke, G.T. Ambient Aquatic Life Water Quality Criteria; US Environmental Protection Agency: Washington, DC, USA, 2005. [Google Scholar]
- Hunziker, R.W.; Escher, B.I.; Schwarzenbach, R.P. pH dependence of the partitioning of triphenyltin and tributyltin between phosphatidylcholine liposomes and water. Environ. Sci. Technol 2001, 35, 3899–3904. [Google Scholar]

© 2014 by the authors; licensee MDPI, Basel, Switzerland This article is an open access article distributed under the terms and conditions of the Creative Commons Attribution license (http://creativecommons.org/licenses/by/3.0/).
Share and Cite
Nakane, Y.; Kubo, I. Fluorescence Sensing of the Interaction between Biomembranes with Different Lipid Composition and Endocrine Disrupting Chemicals. Materials 2014, 7, 170-179. https://doi.org/10.3390/ma7010170
Nakane Y, Kubo I. Fluorescence Sensing of the Interaction between Biomembranes with Different Lipid Composition and Endocrine Disrupting Chemicals. Materials. 2014; 7(1):170-179. https://doi.org/10.3390/ma7010170
Chicago/Turabian StyleNakane, Yuko, and Izumi Kubo. 2014. "Fluorescence Sensing of the Interaction between Biomembranes with Different Lipid Composition and Endocrine Disrupting Chemicals" Materials 7, no. 1: 170-179. https://doi.org/10.3390/ma7010170