An Optimal Cure Process to Minimize Residual Void and Optical Birefringence for a LED Silicone Encapsulant

Abstract
:1. Introduction
2. Experimental Observation
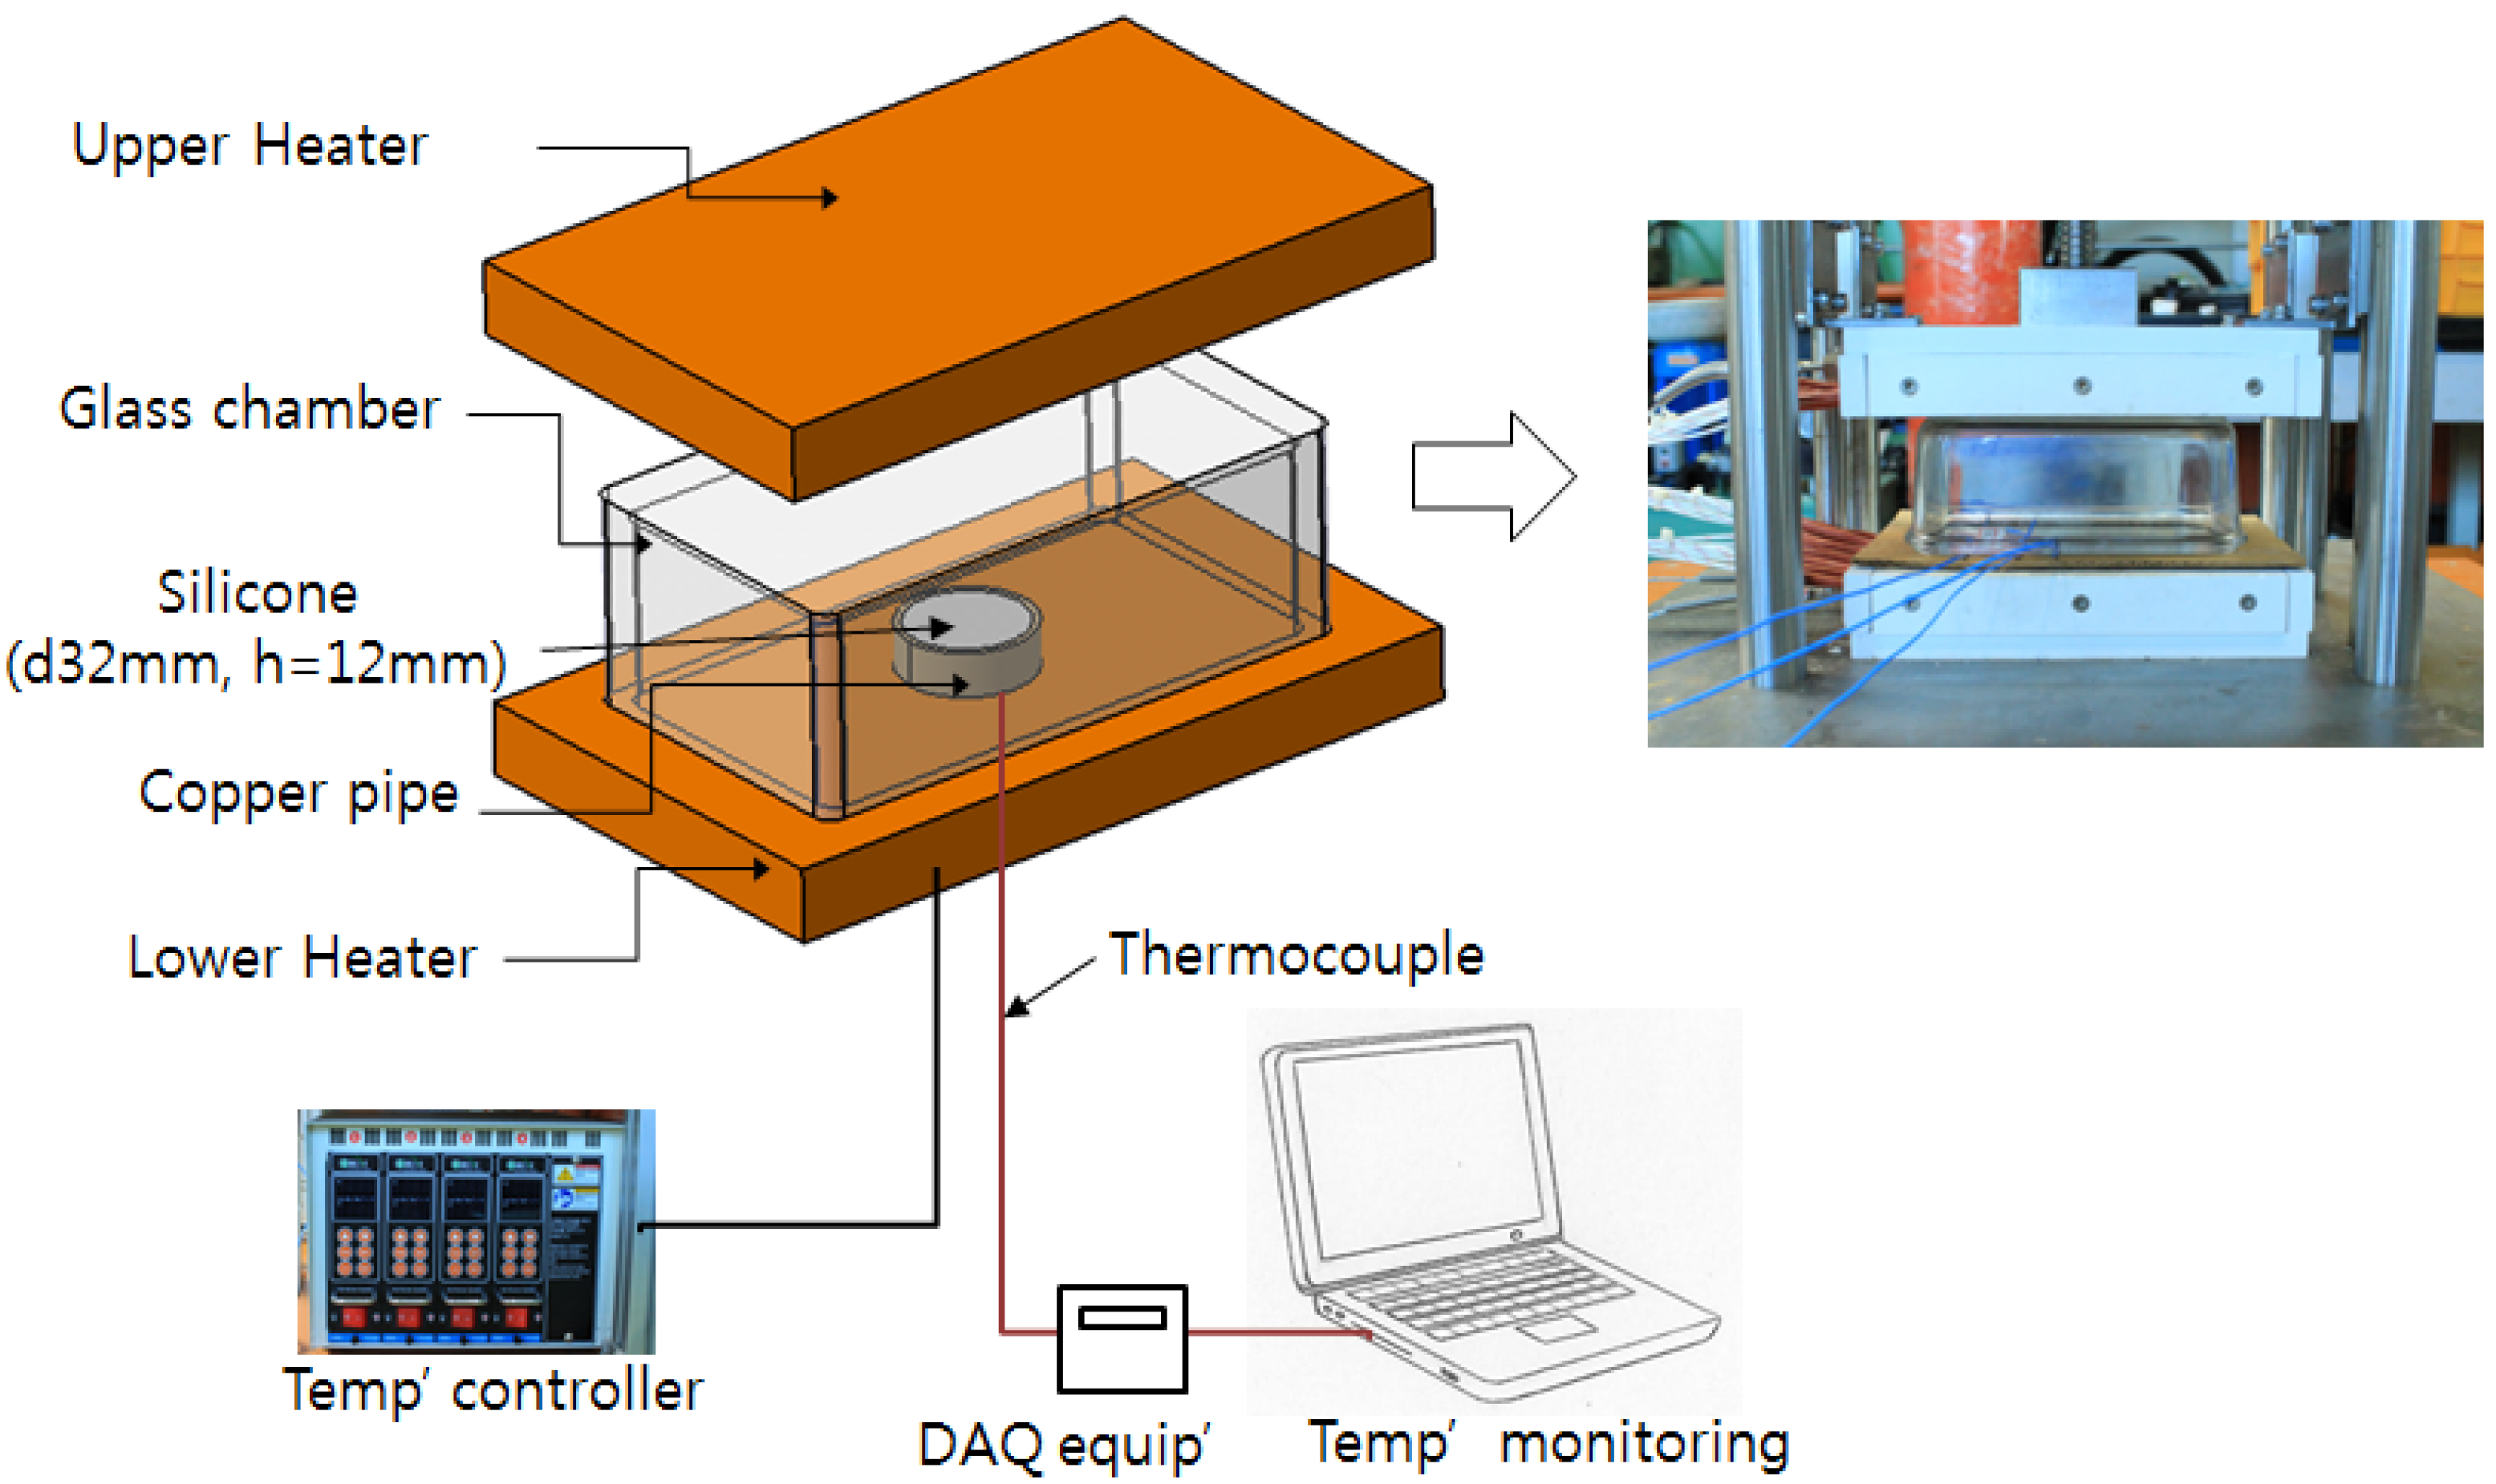
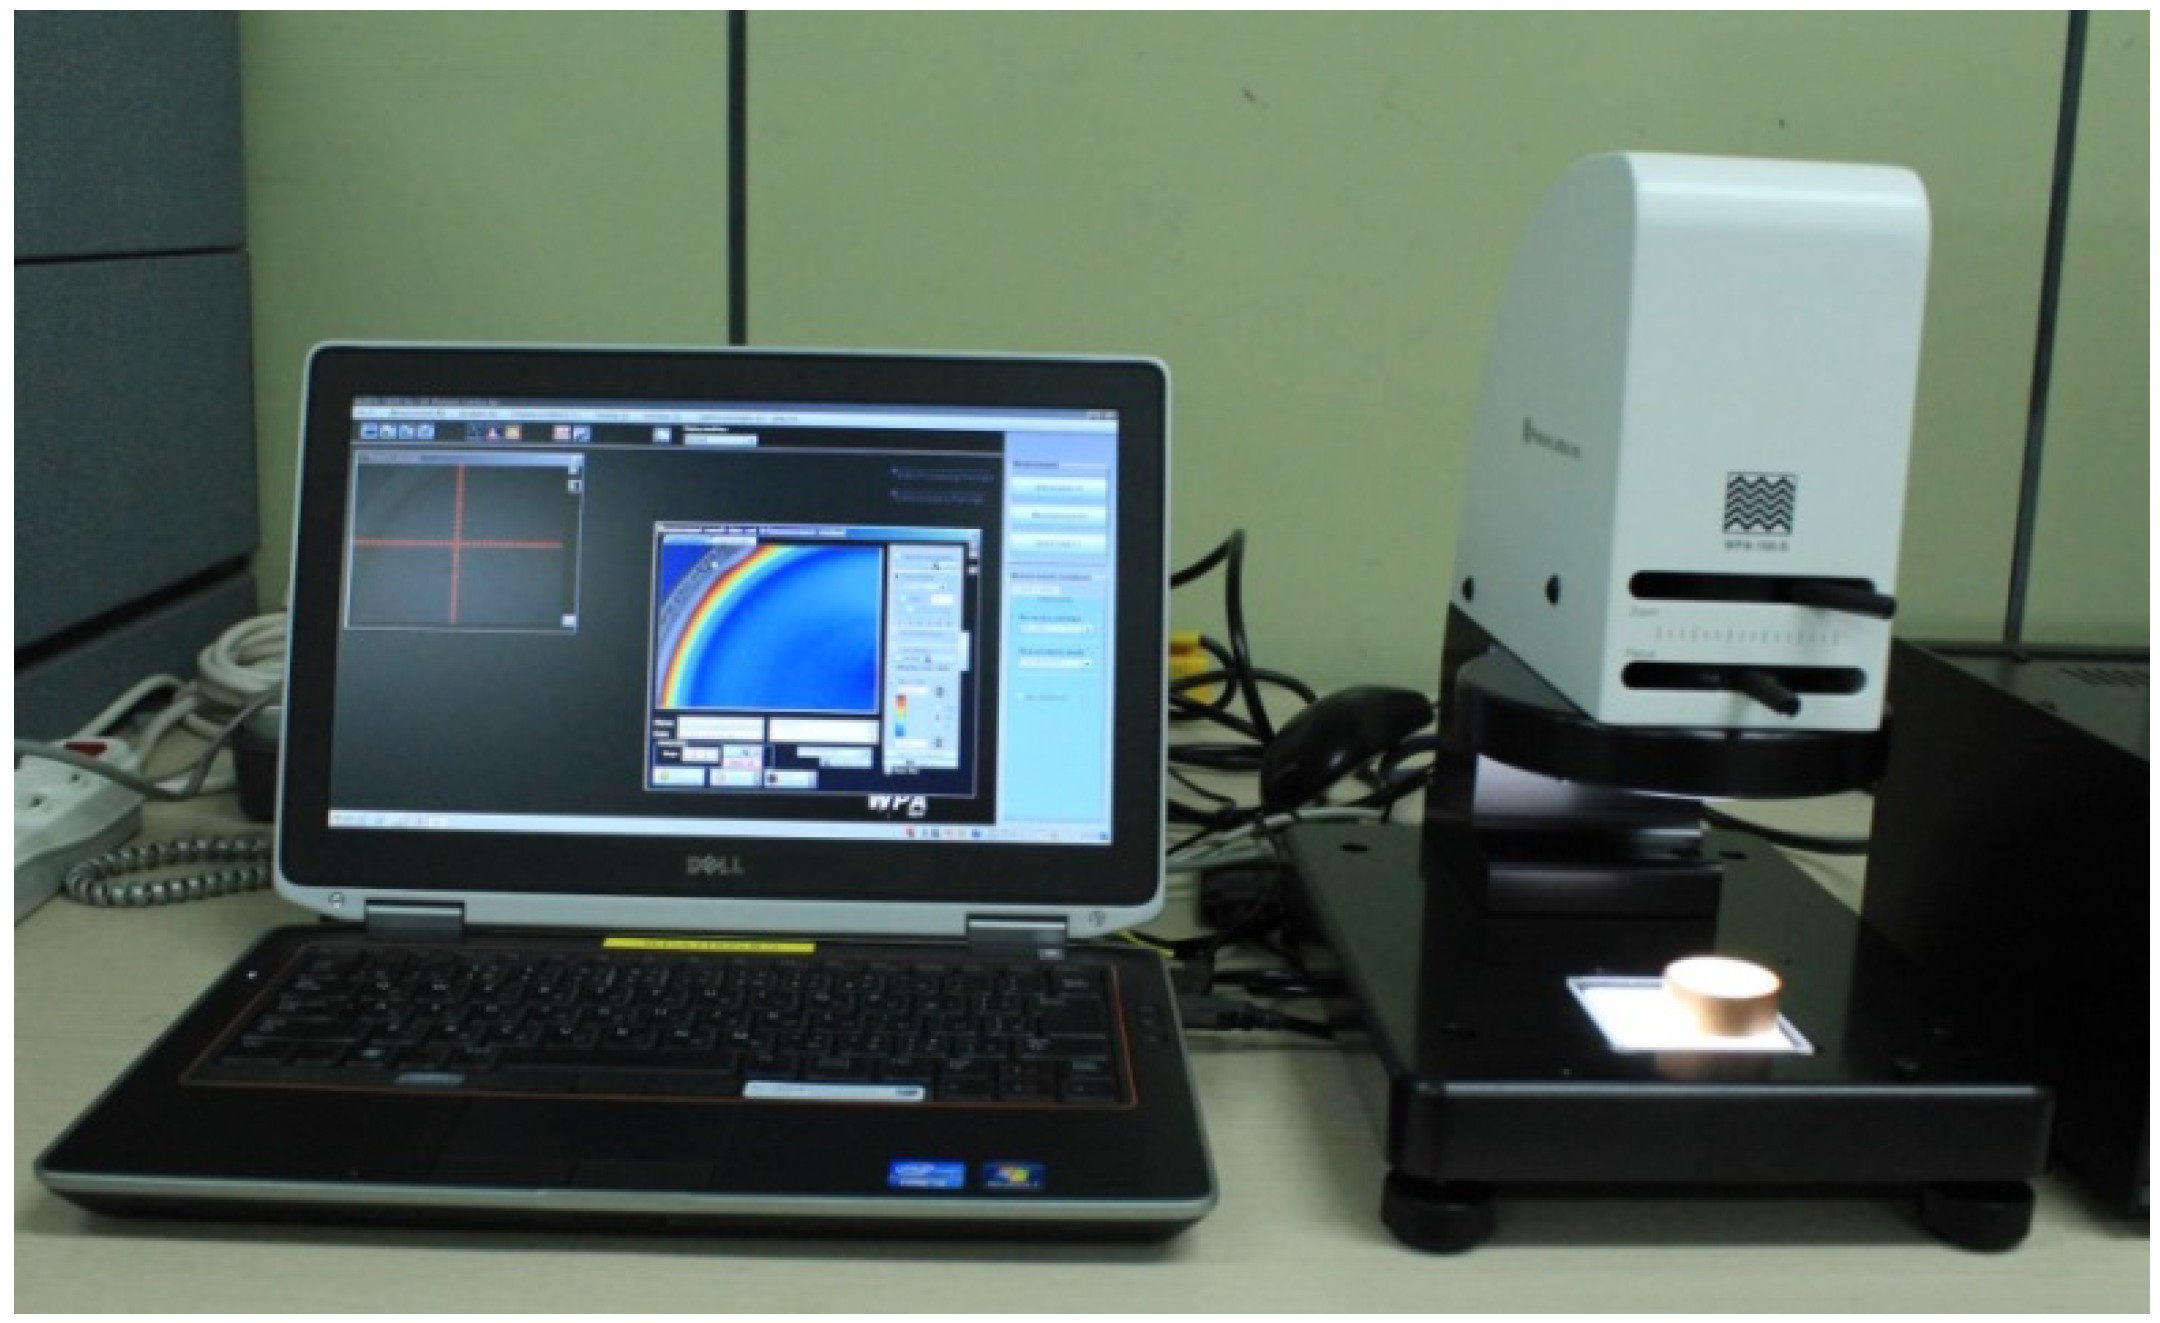
2.1. Experiment Apparatus

2.2. Step Cure Process Design

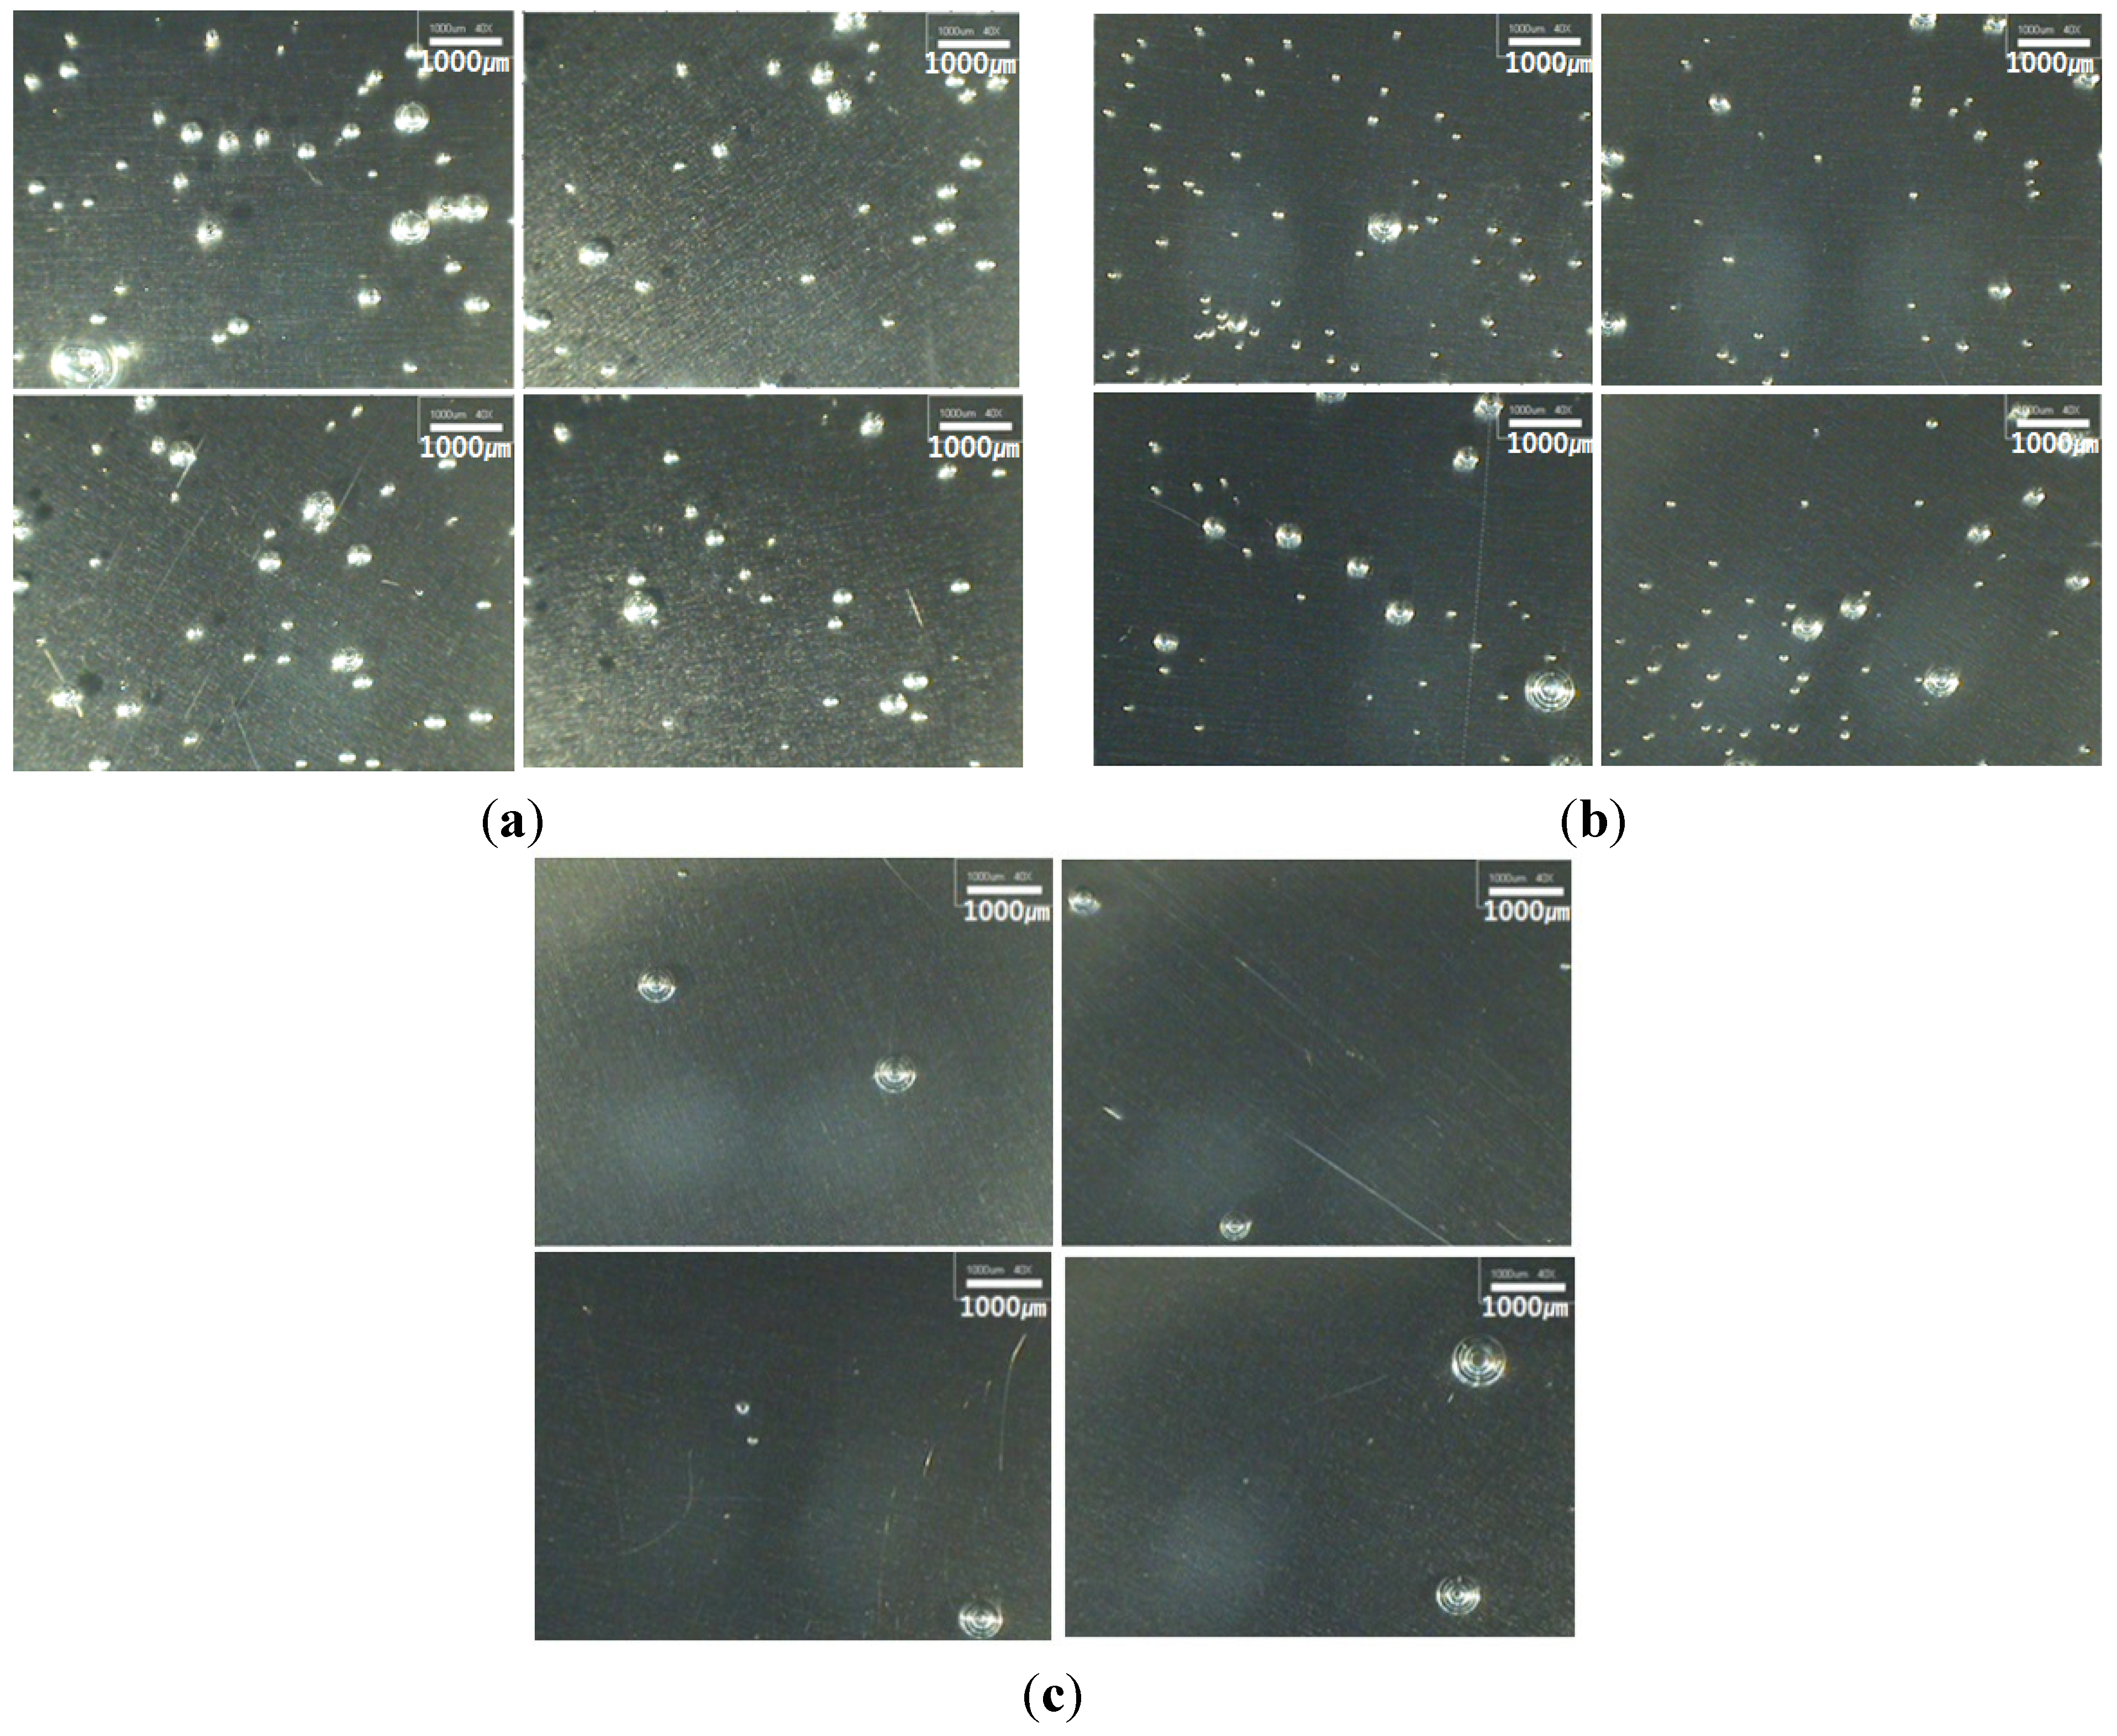
2.3. Residual Voids
3. Finite Element Analysis of Silicone Curing for Step Cure Process Analysis
3.1. Governing Equation and Cure Kinetics

| Constant | Cure temperature (°C) | |||
|---|---|---|---|---|
| 60 | 70 | 80 | 90 | |
| k (×10−3) | 1.736 | 3.839 | 9.739 | 21.58 |
| A (S−1) | 4.007 × 10¹⁰ | |||
| E (KJ/mol) | 85.293 | |||
| m | 0.62 | |||
| n | 1.39 | |||
| R (J/mol·K) | 8.31 | |||
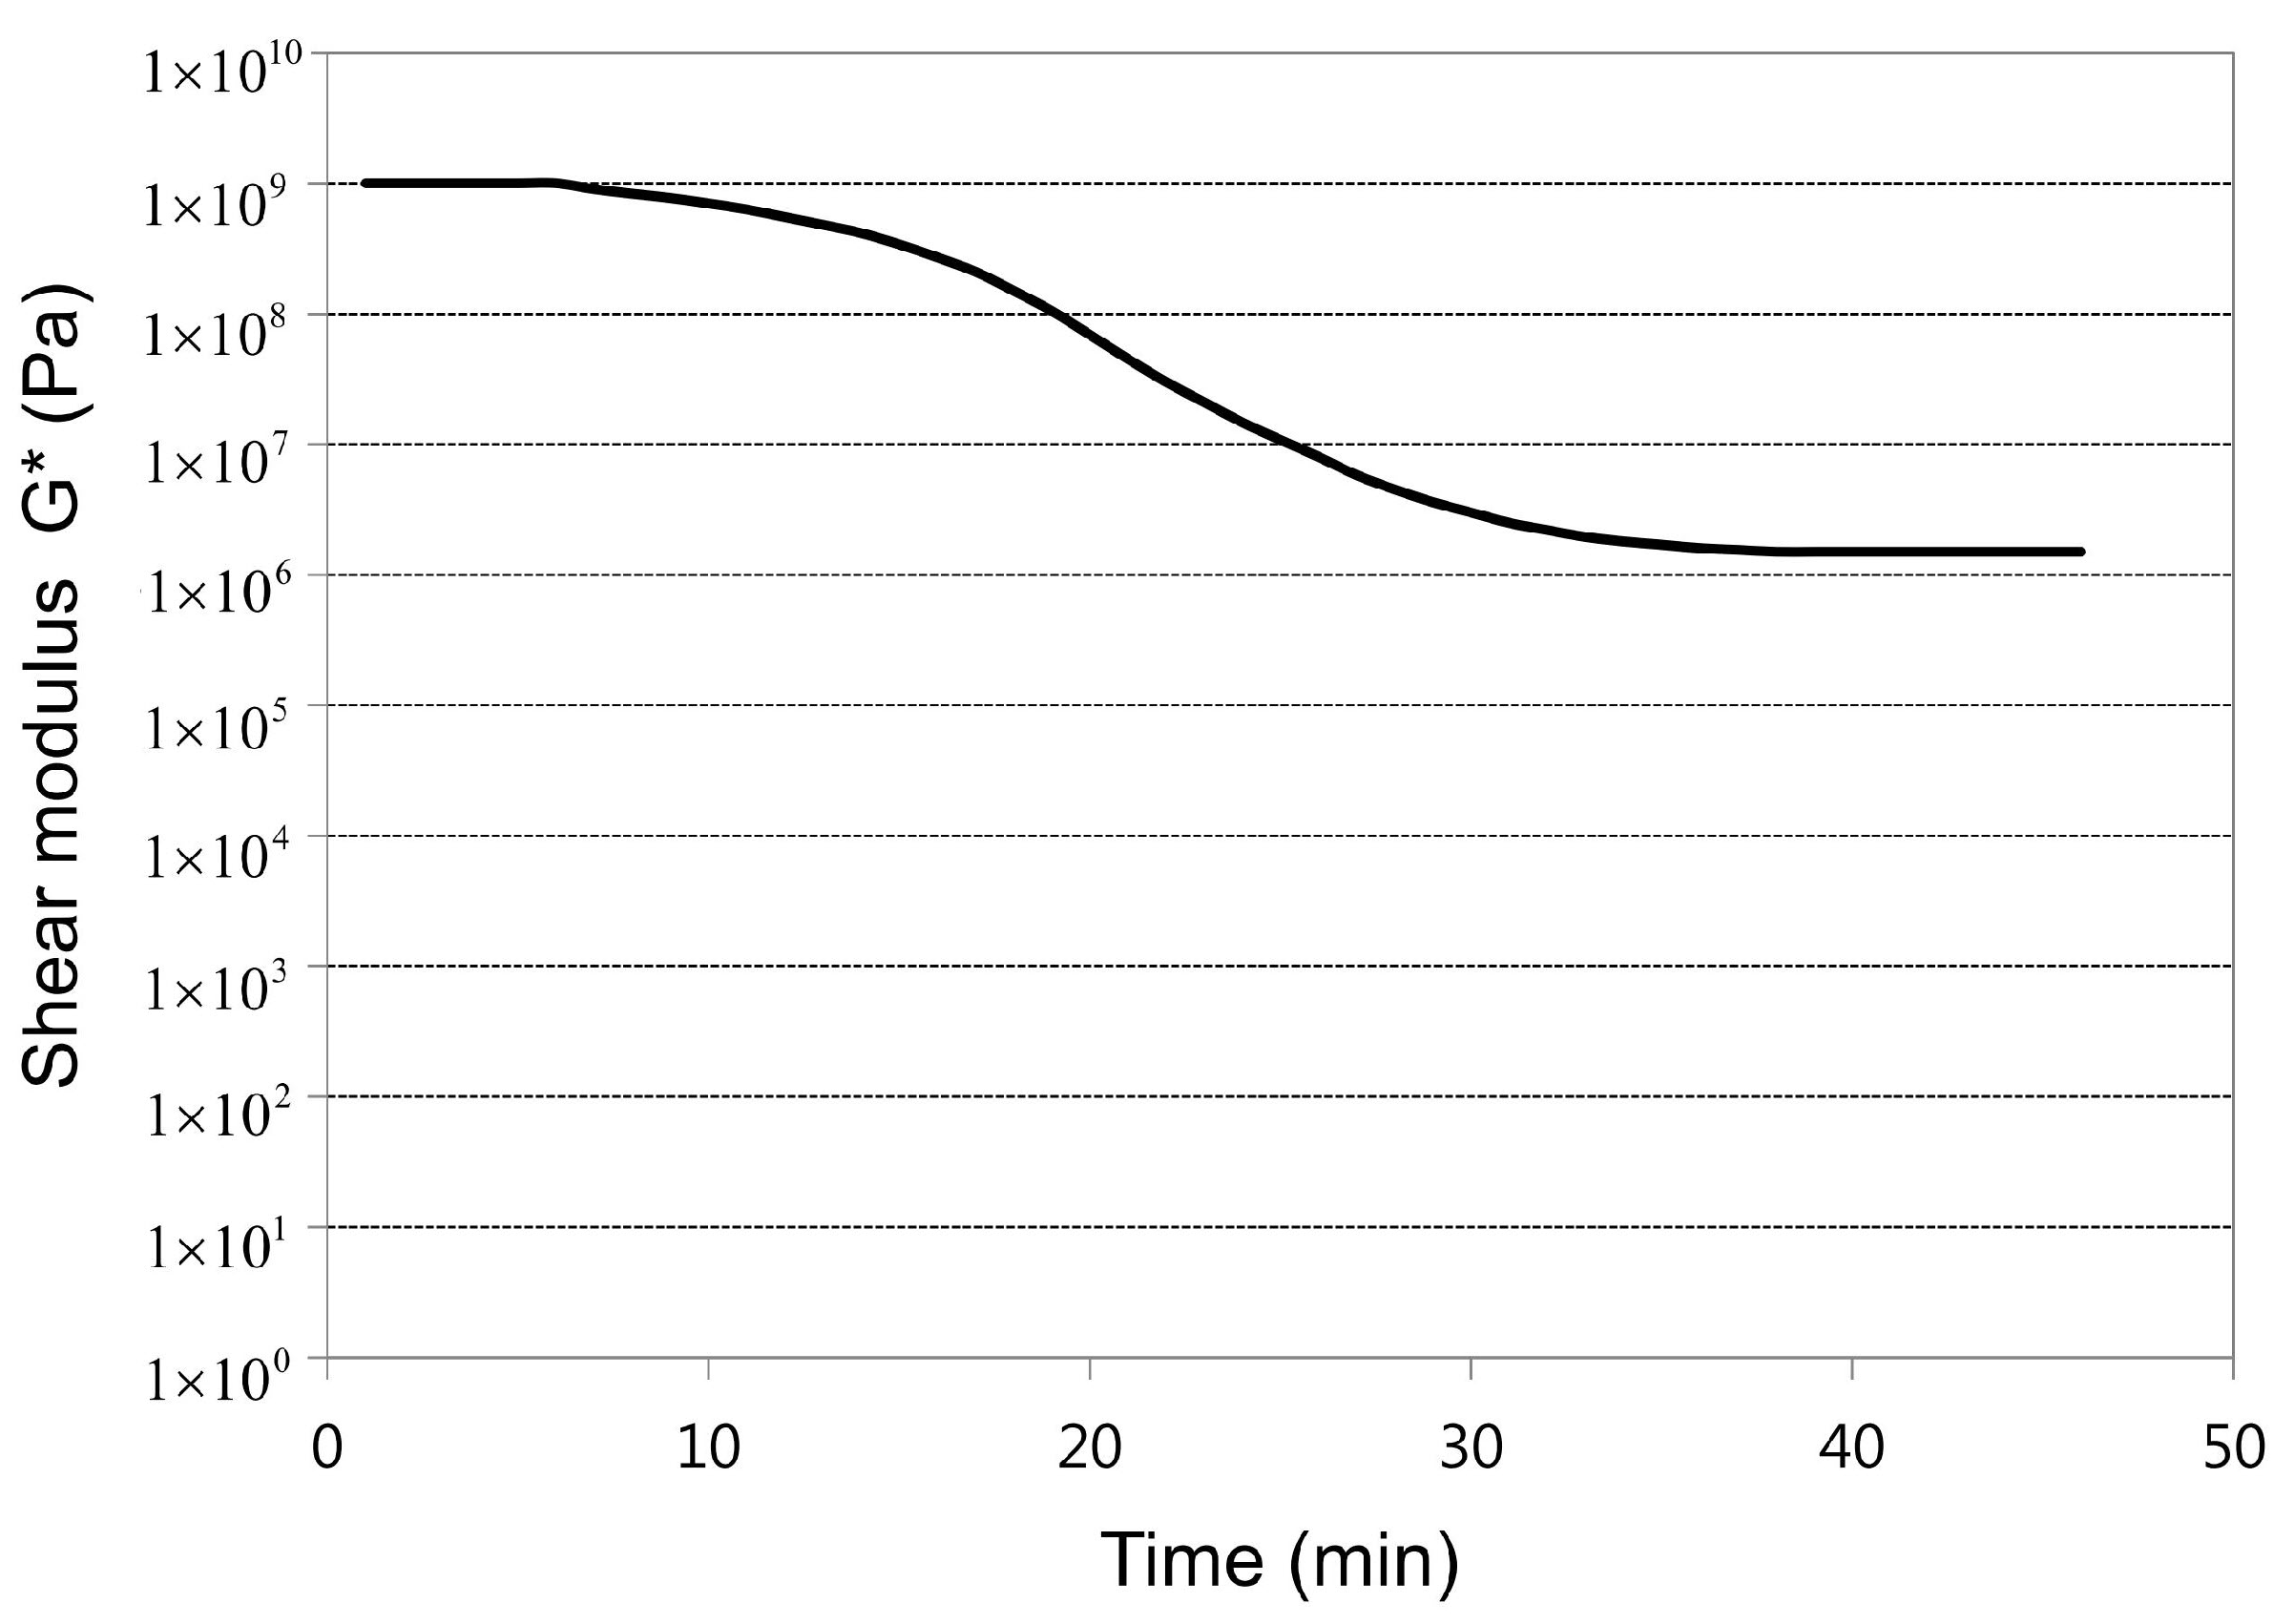
3.2. Assumption of Elastic Modulus and Cure Shrinkage

3.3. Thermal Properties
| Thermal properties | Value |
|---|---|
| Density (kg/m3) | 1168 |
| Thermal conductivity (W/m·°C−1) | 0.148 |
| Specific heat (J/kg·°C−1) | 1424 |
4. Analysis and Experiment Results on the Step Cure Process
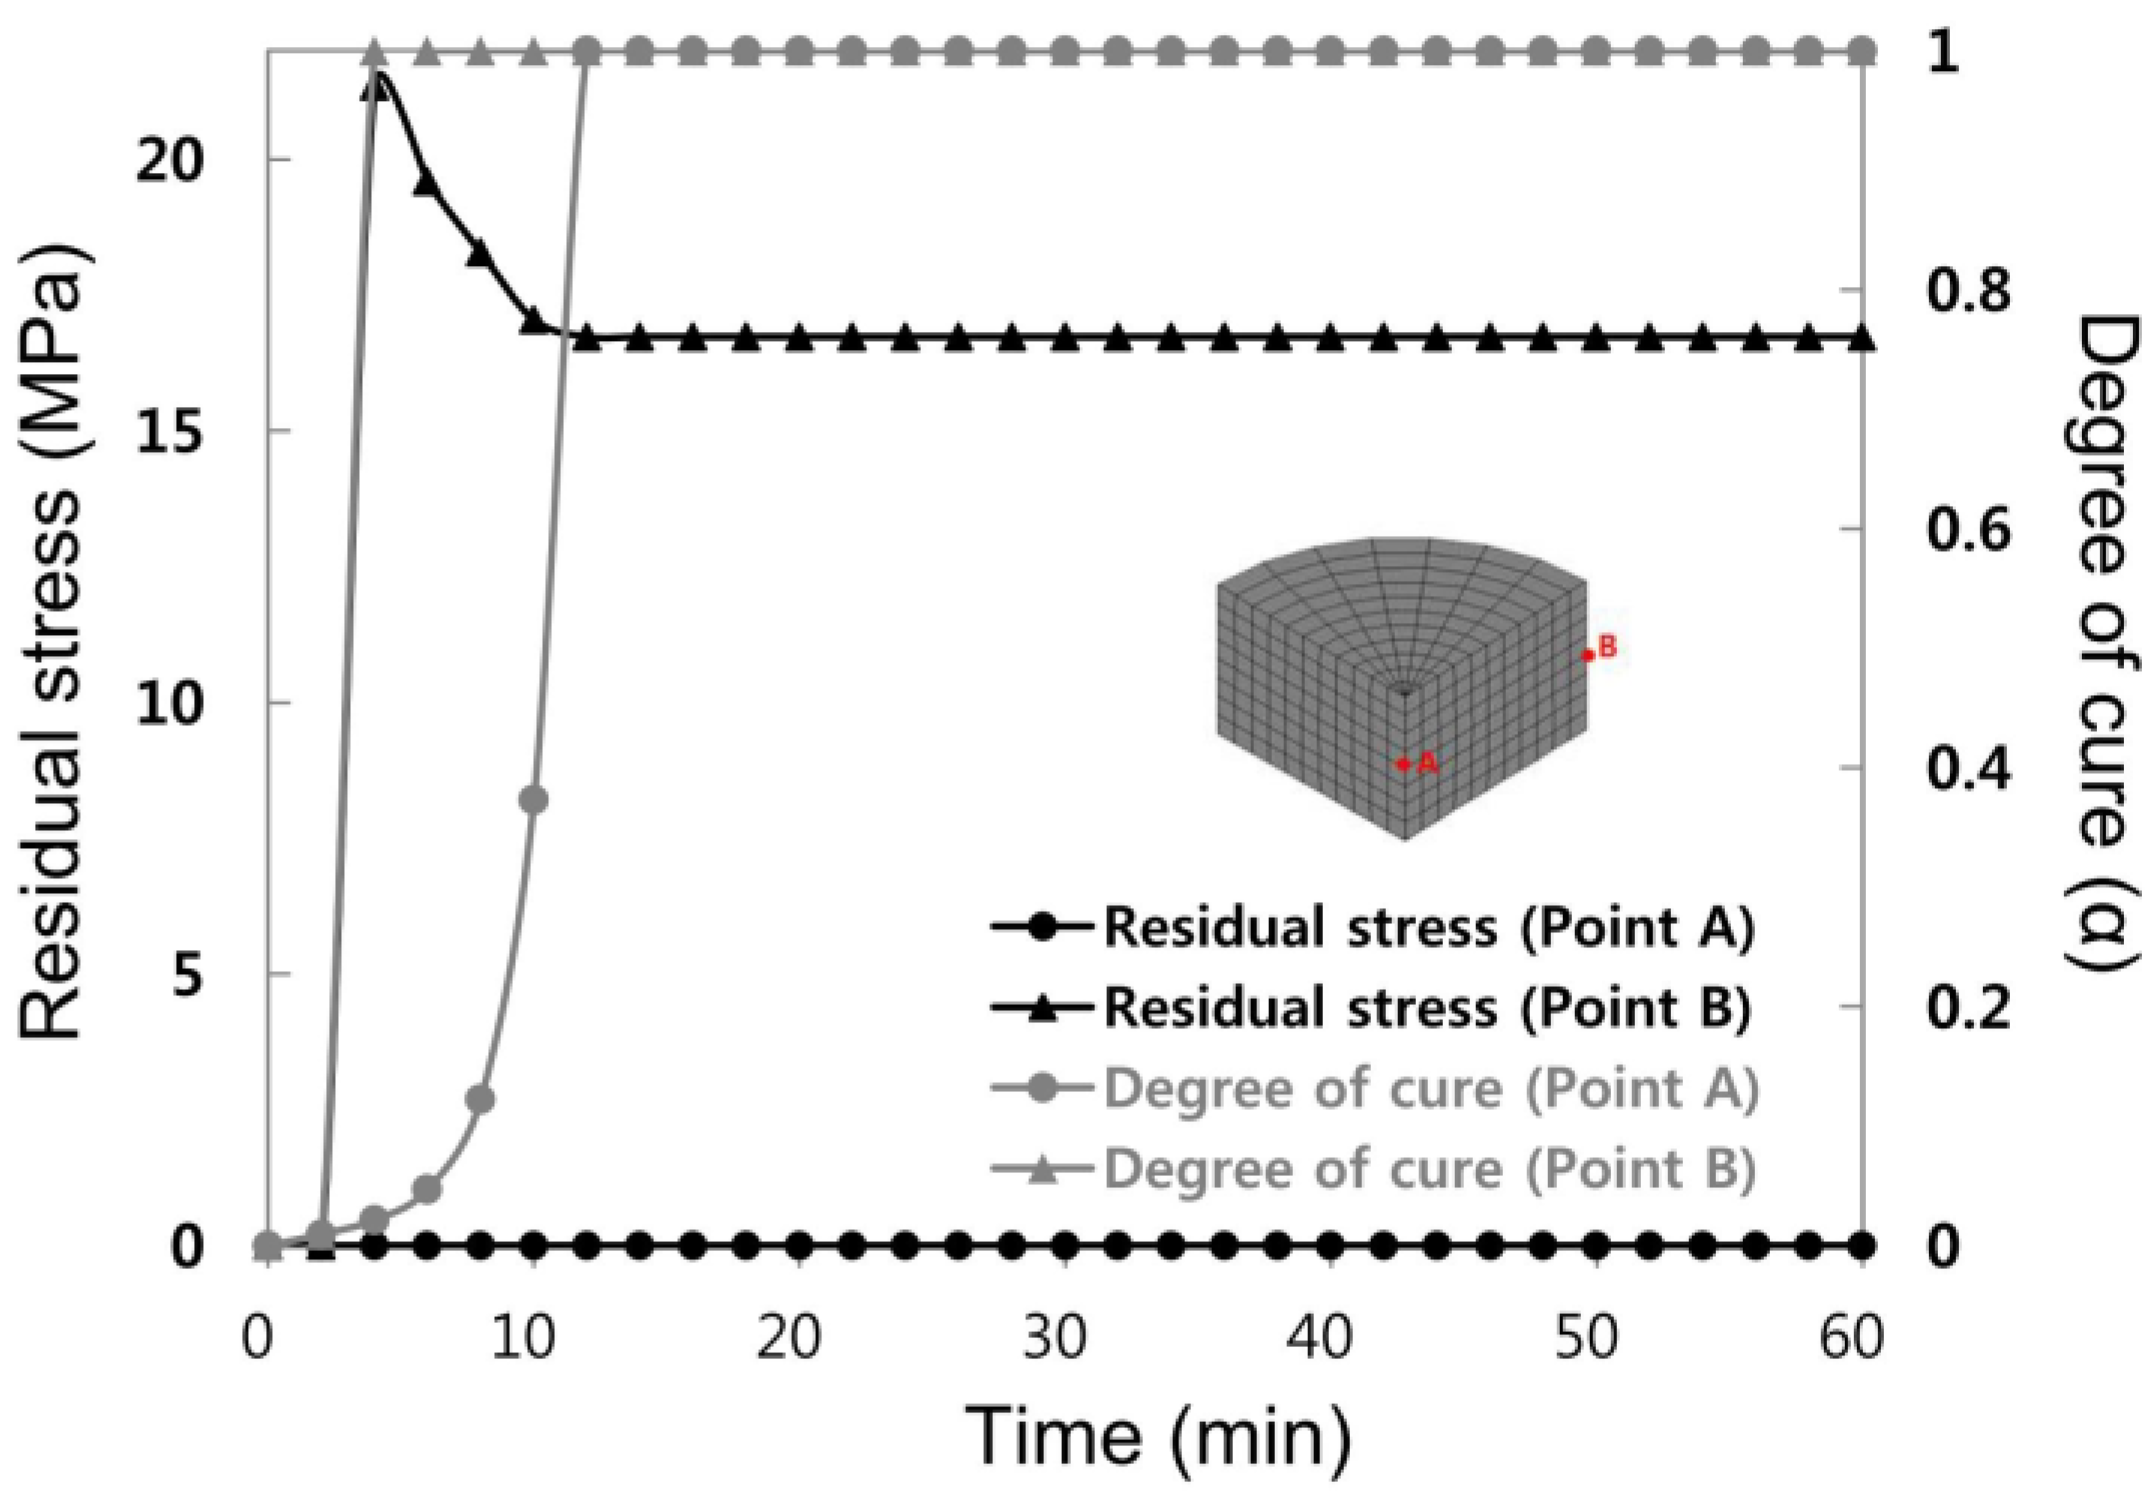
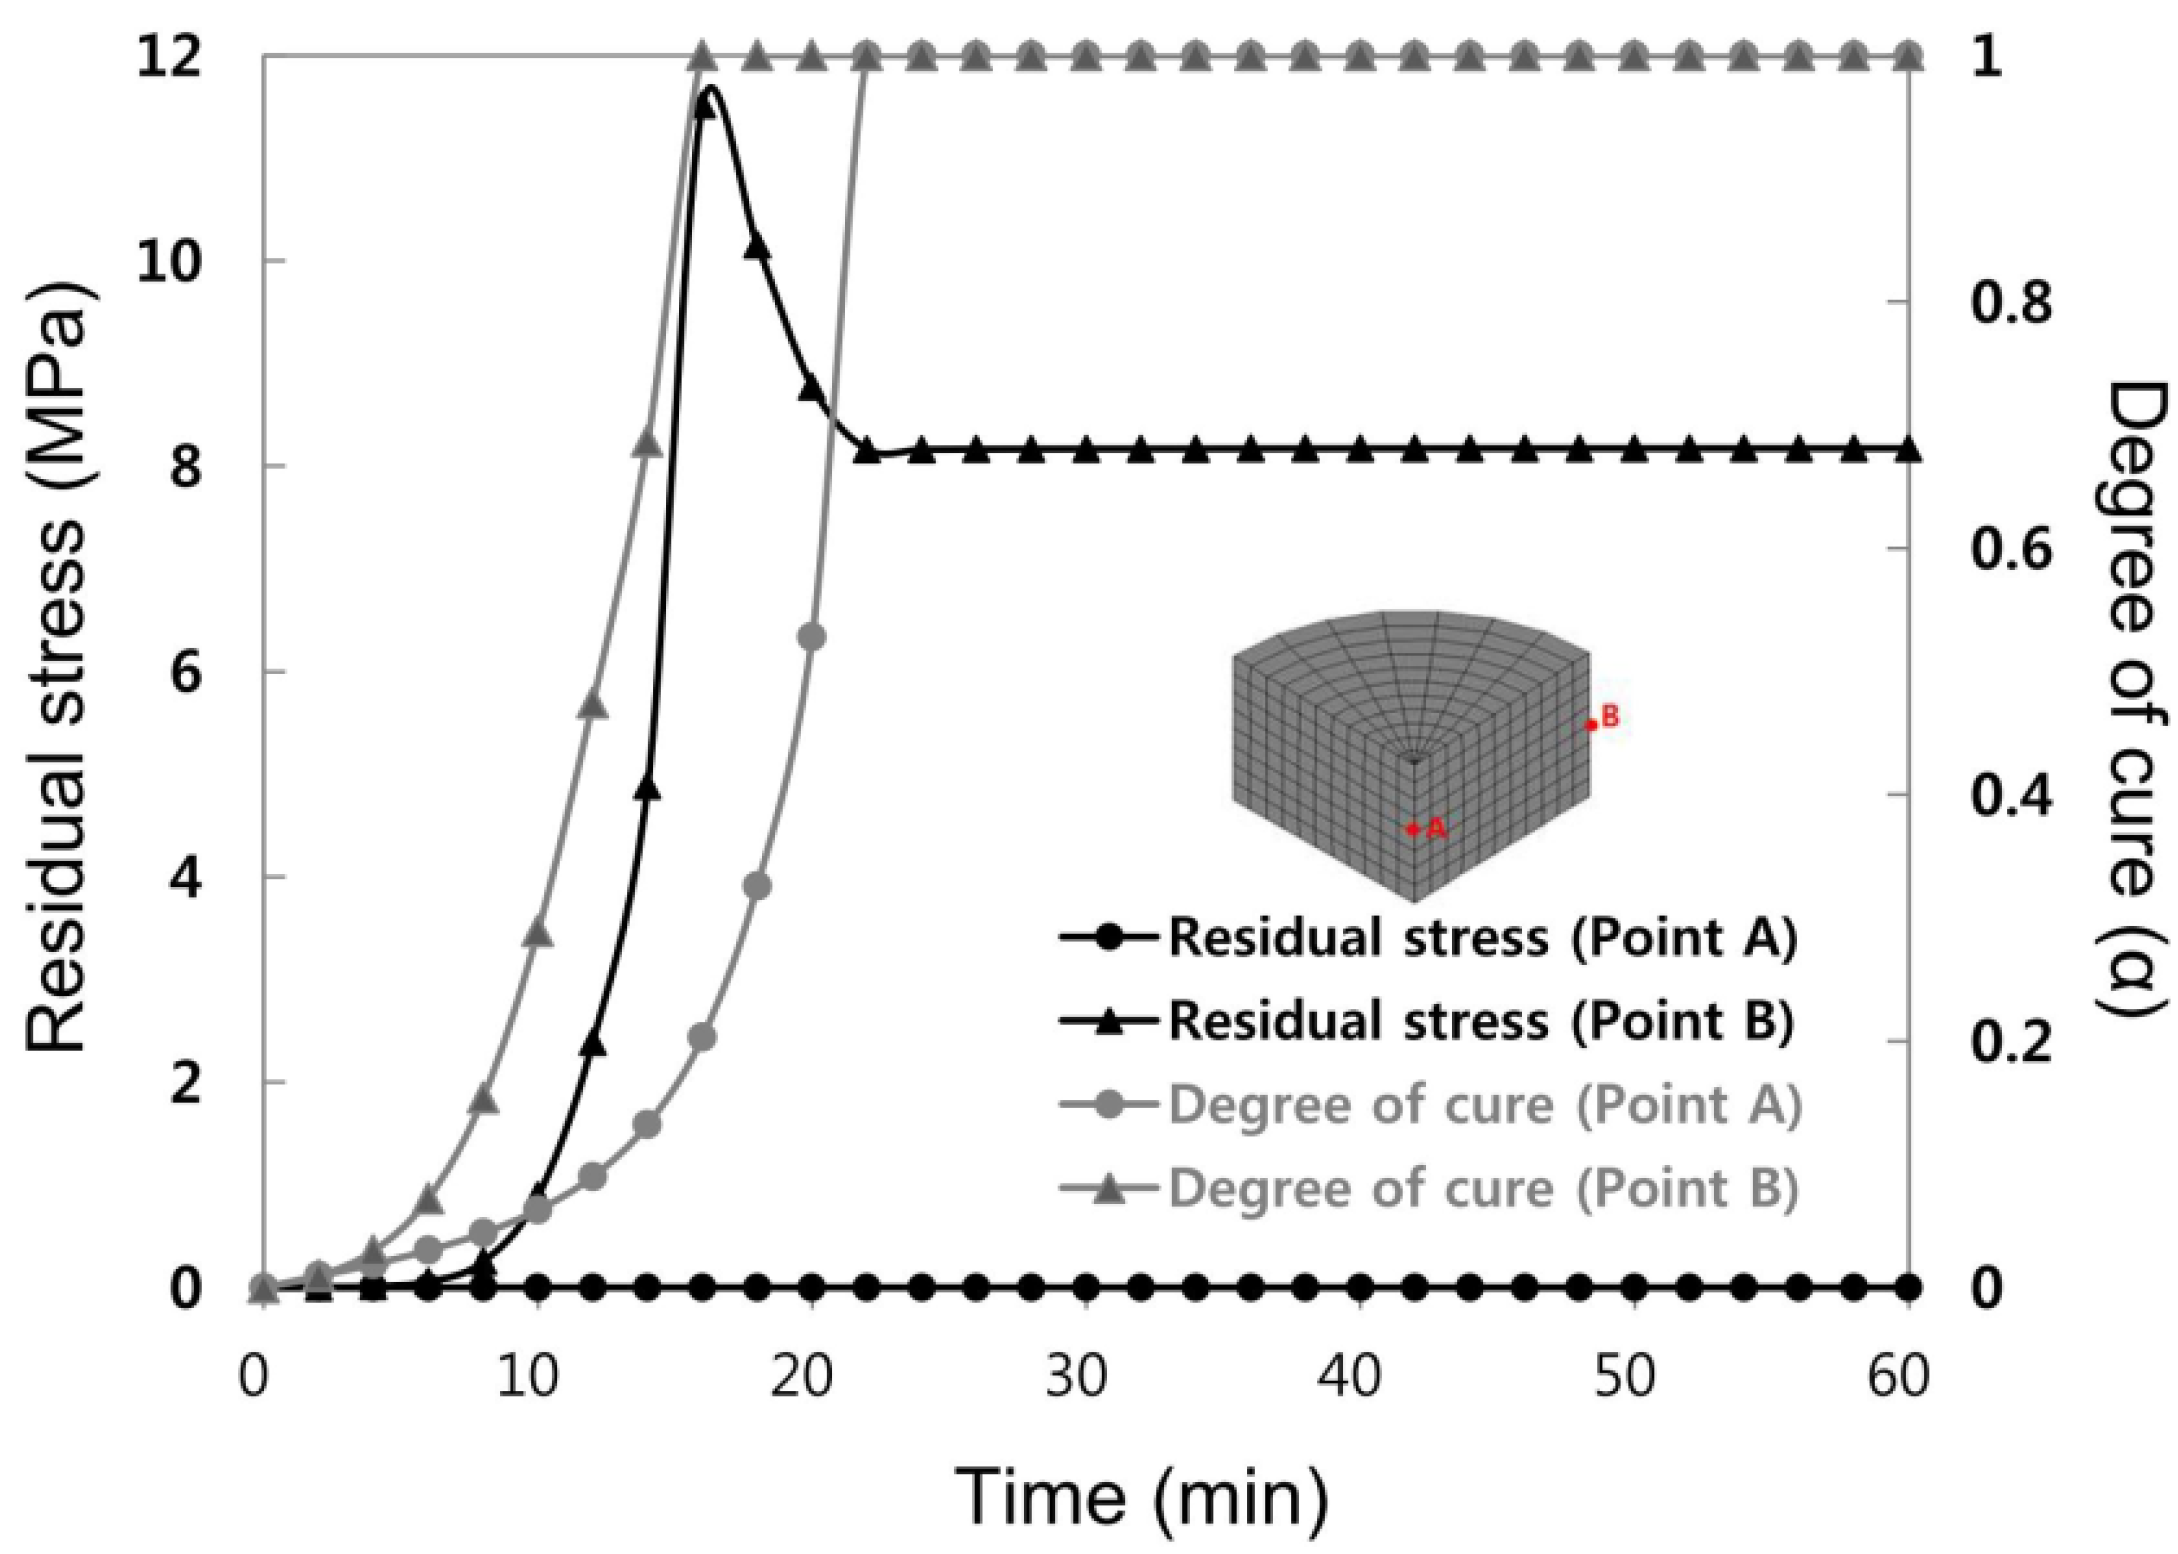
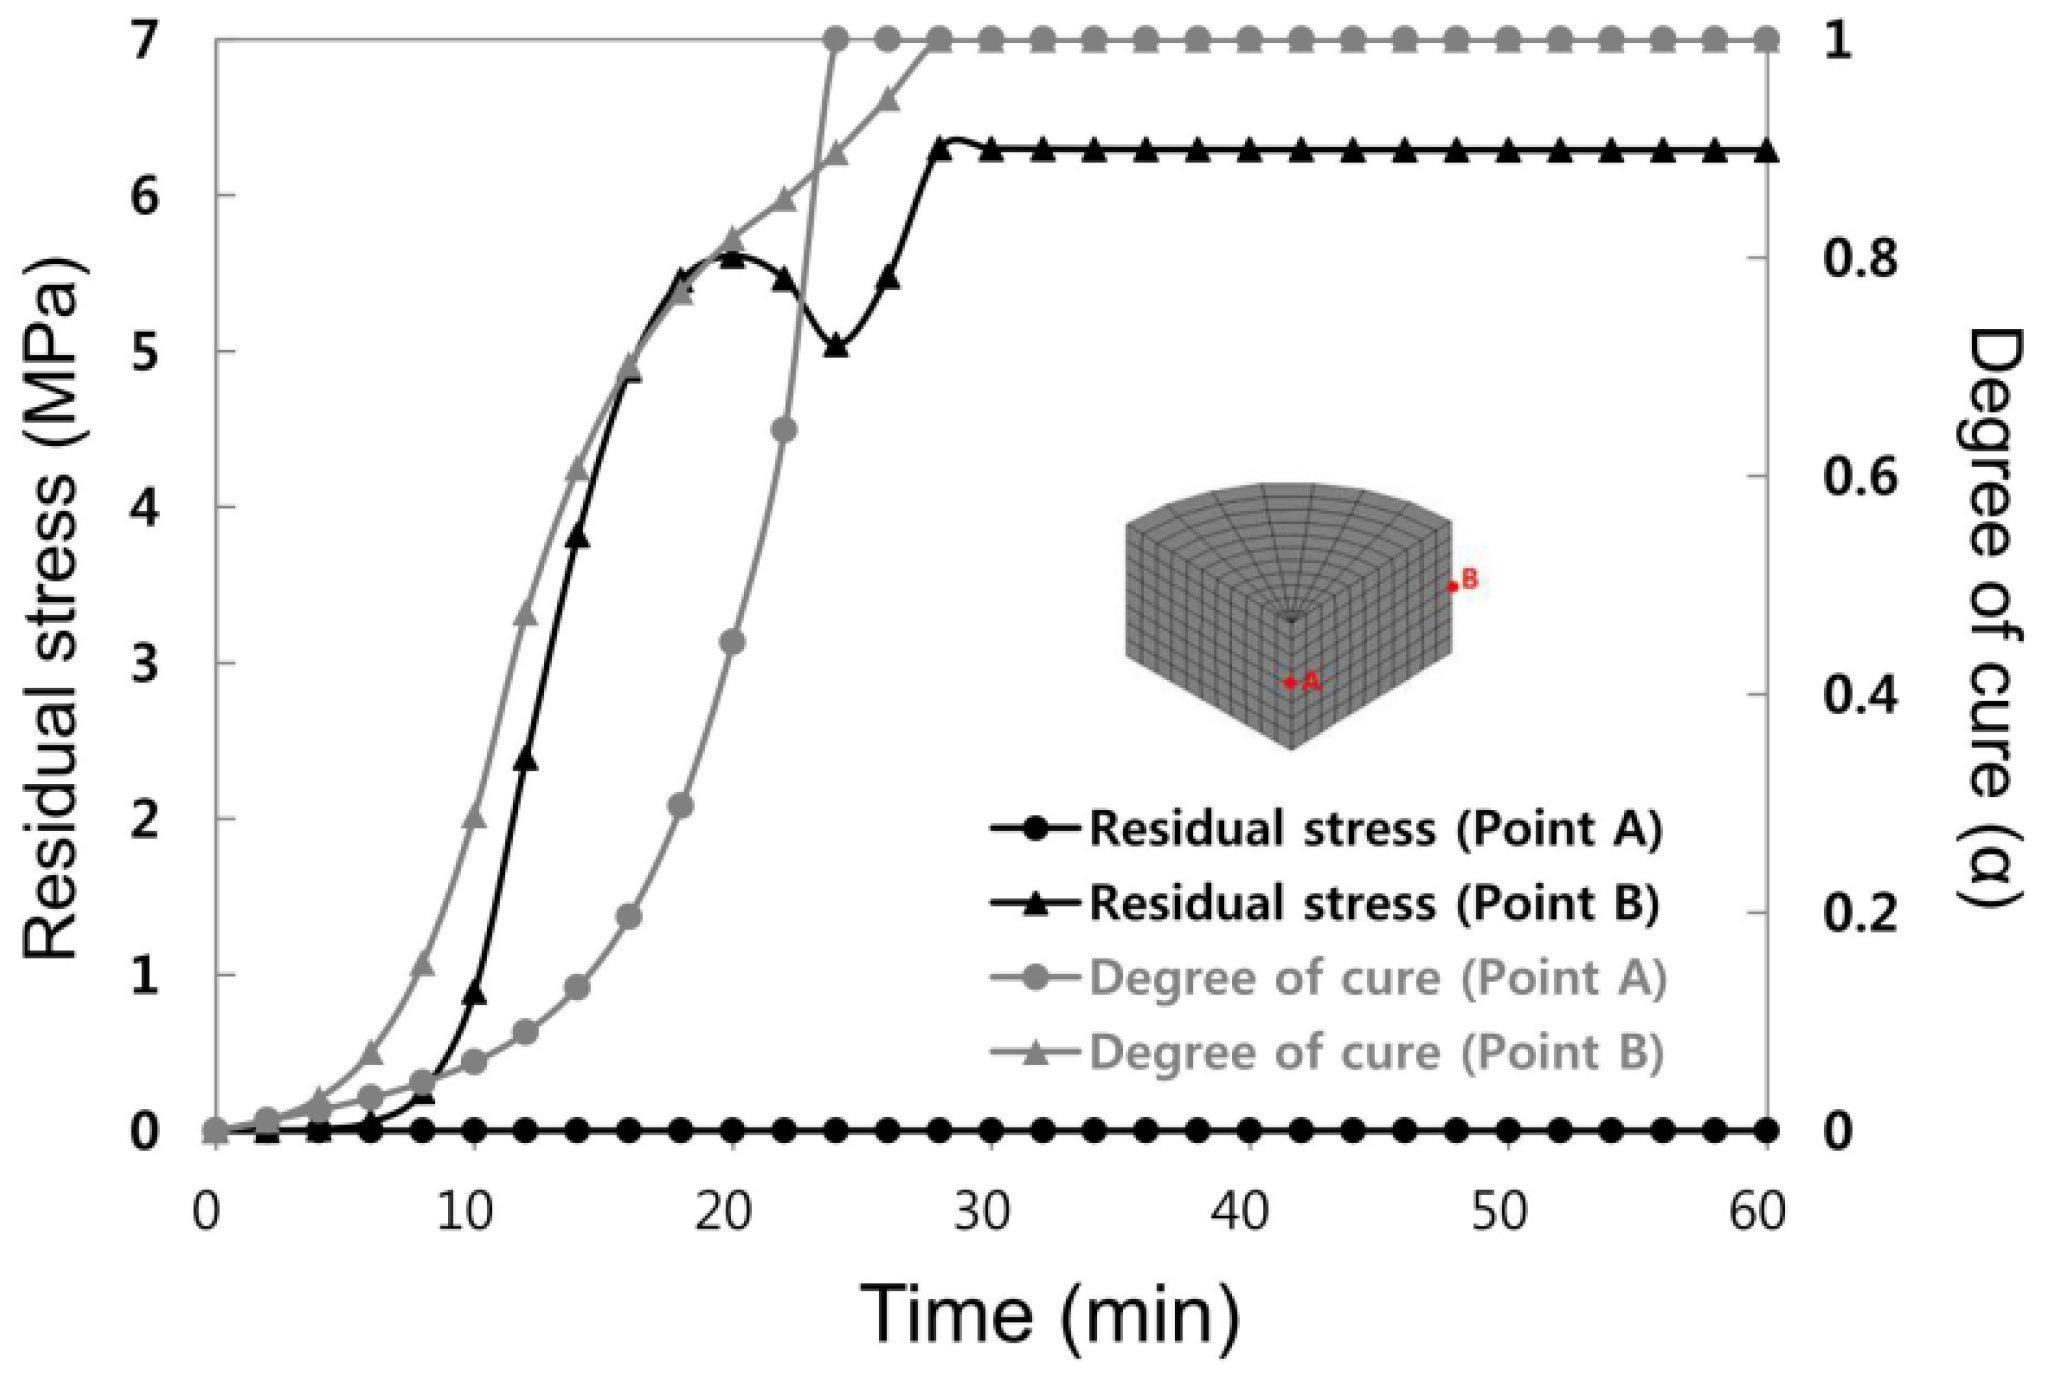
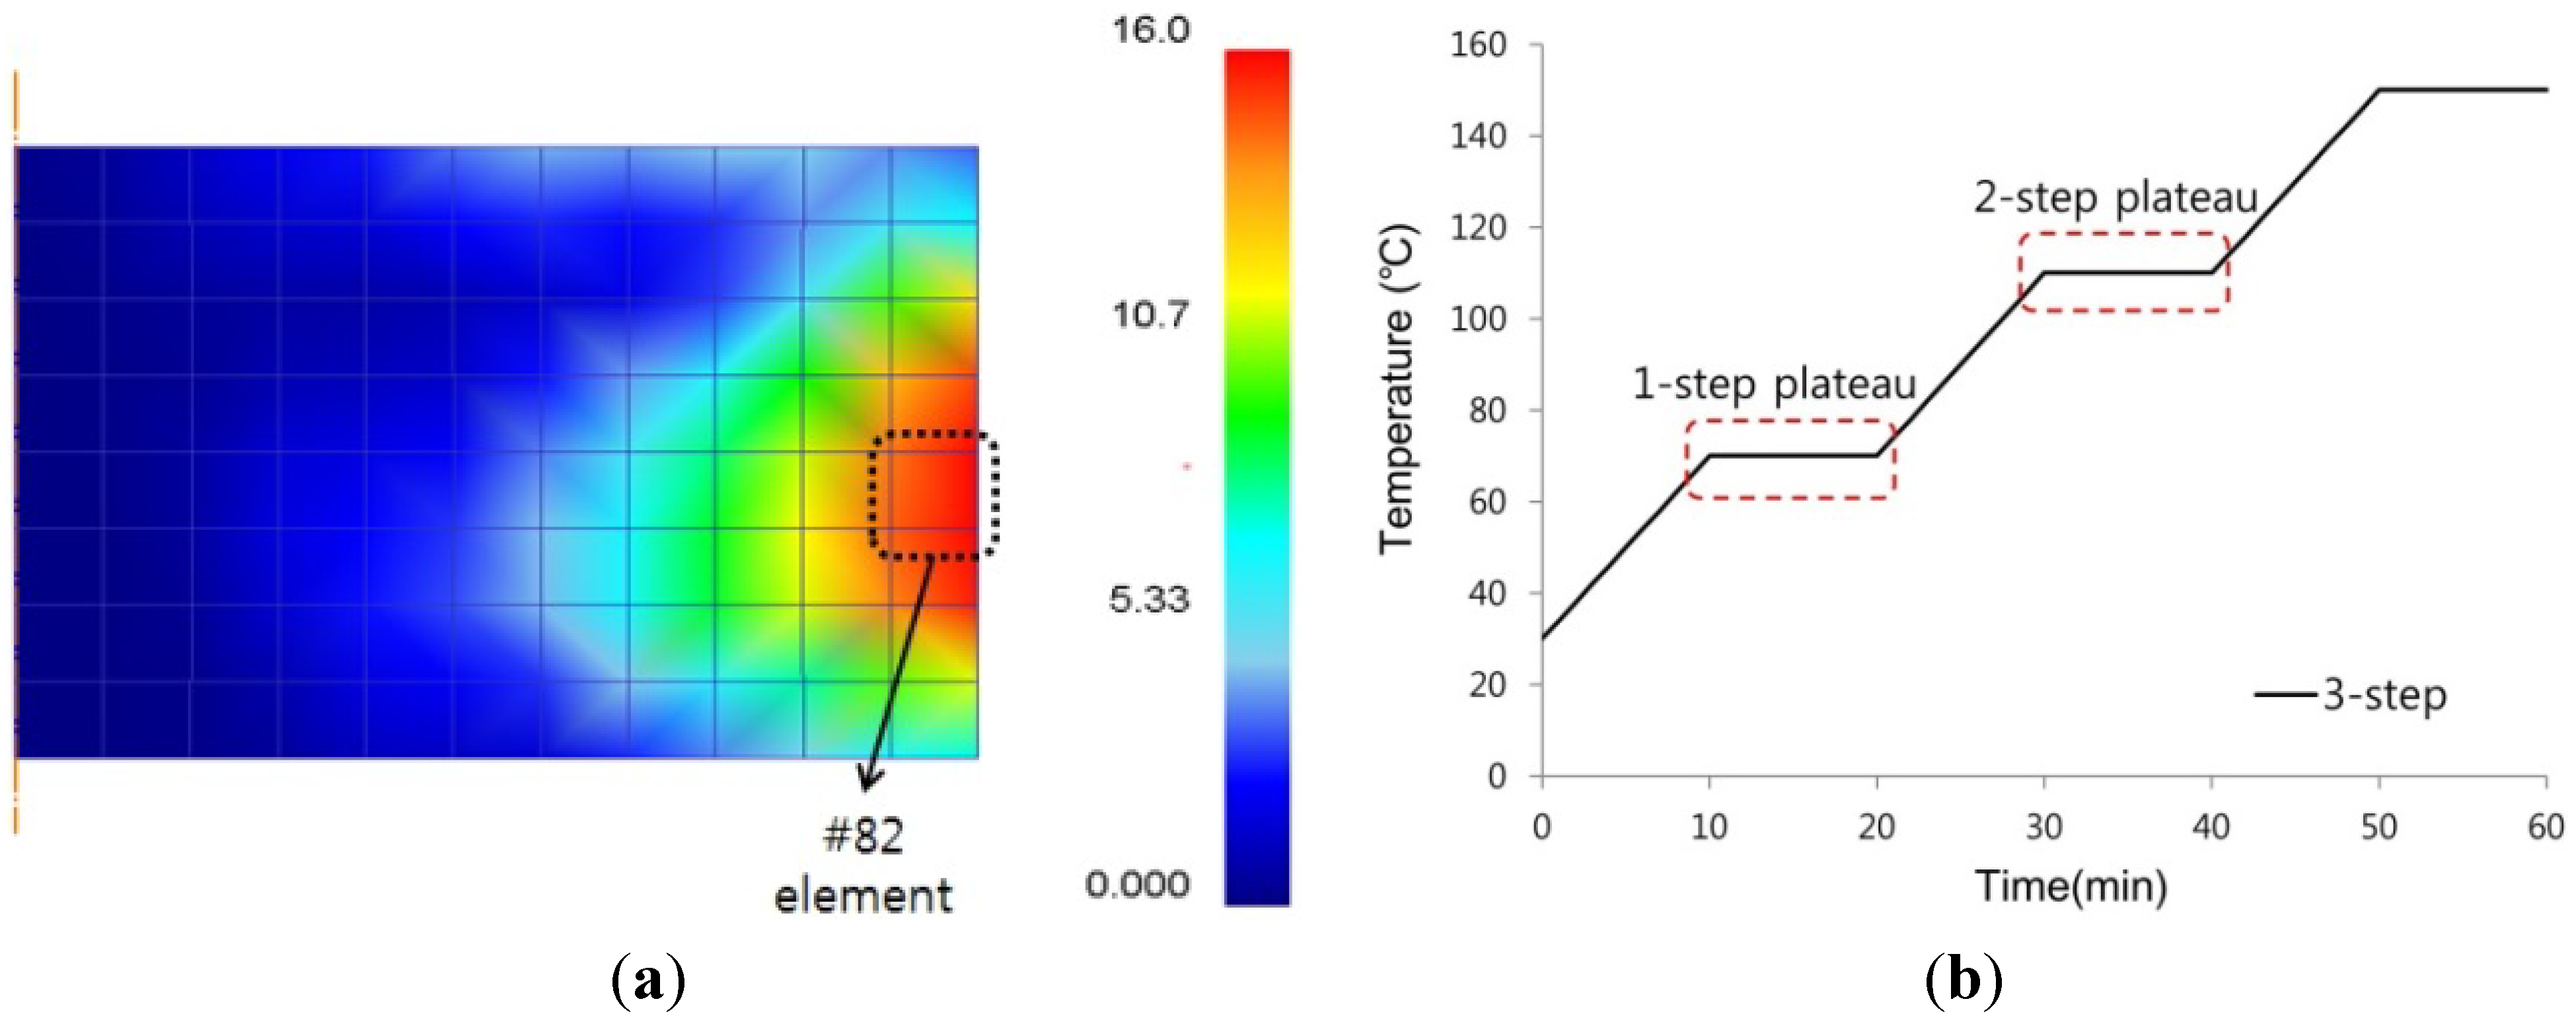
4.1. Finite Element Analysis for Step Cure


| Measuring point | Step cure | Final Residual Stress | Difference |
|---|---|---|---|
| Point A | 1 step | 0 MPa | No residual stress generated in the center |
| 2 step | 0 MPa | ||
| 3 step | 0 MPa | ||
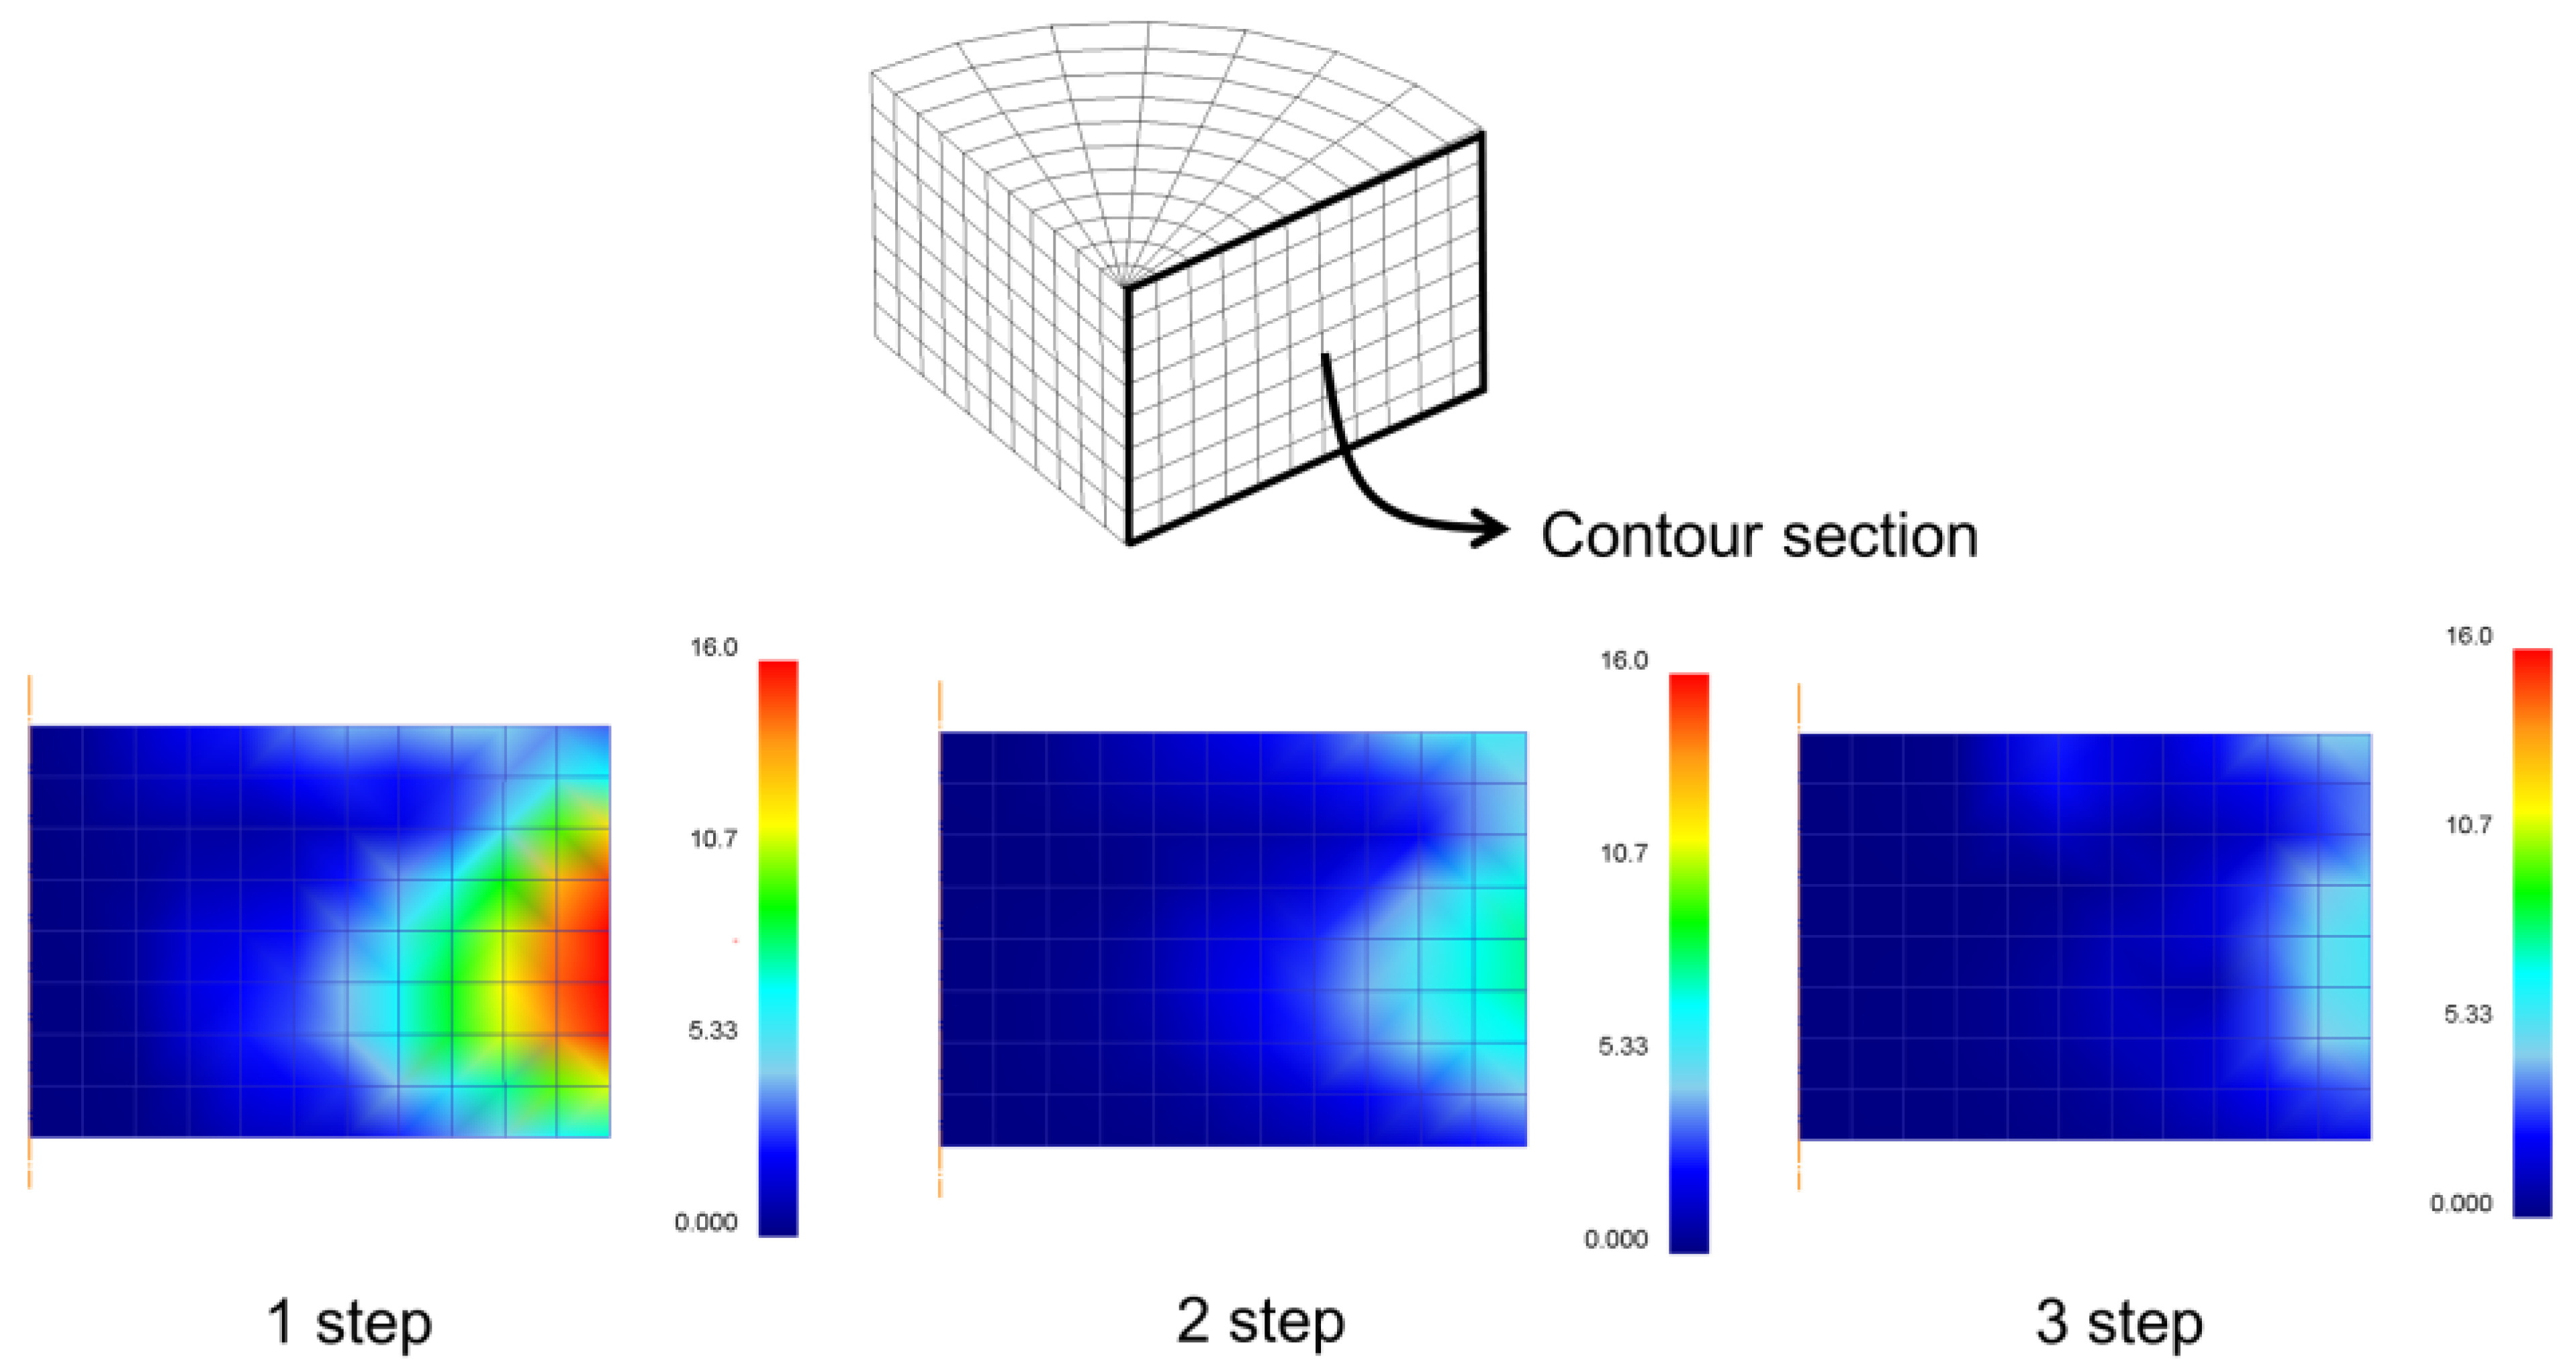
| Point B | 1 step | 16.73 MPa | – |
| 2 step | 8.17 MPa | 49% of 1-step | |
| 3 step | 6.29 MPa | 38% of 1-step |
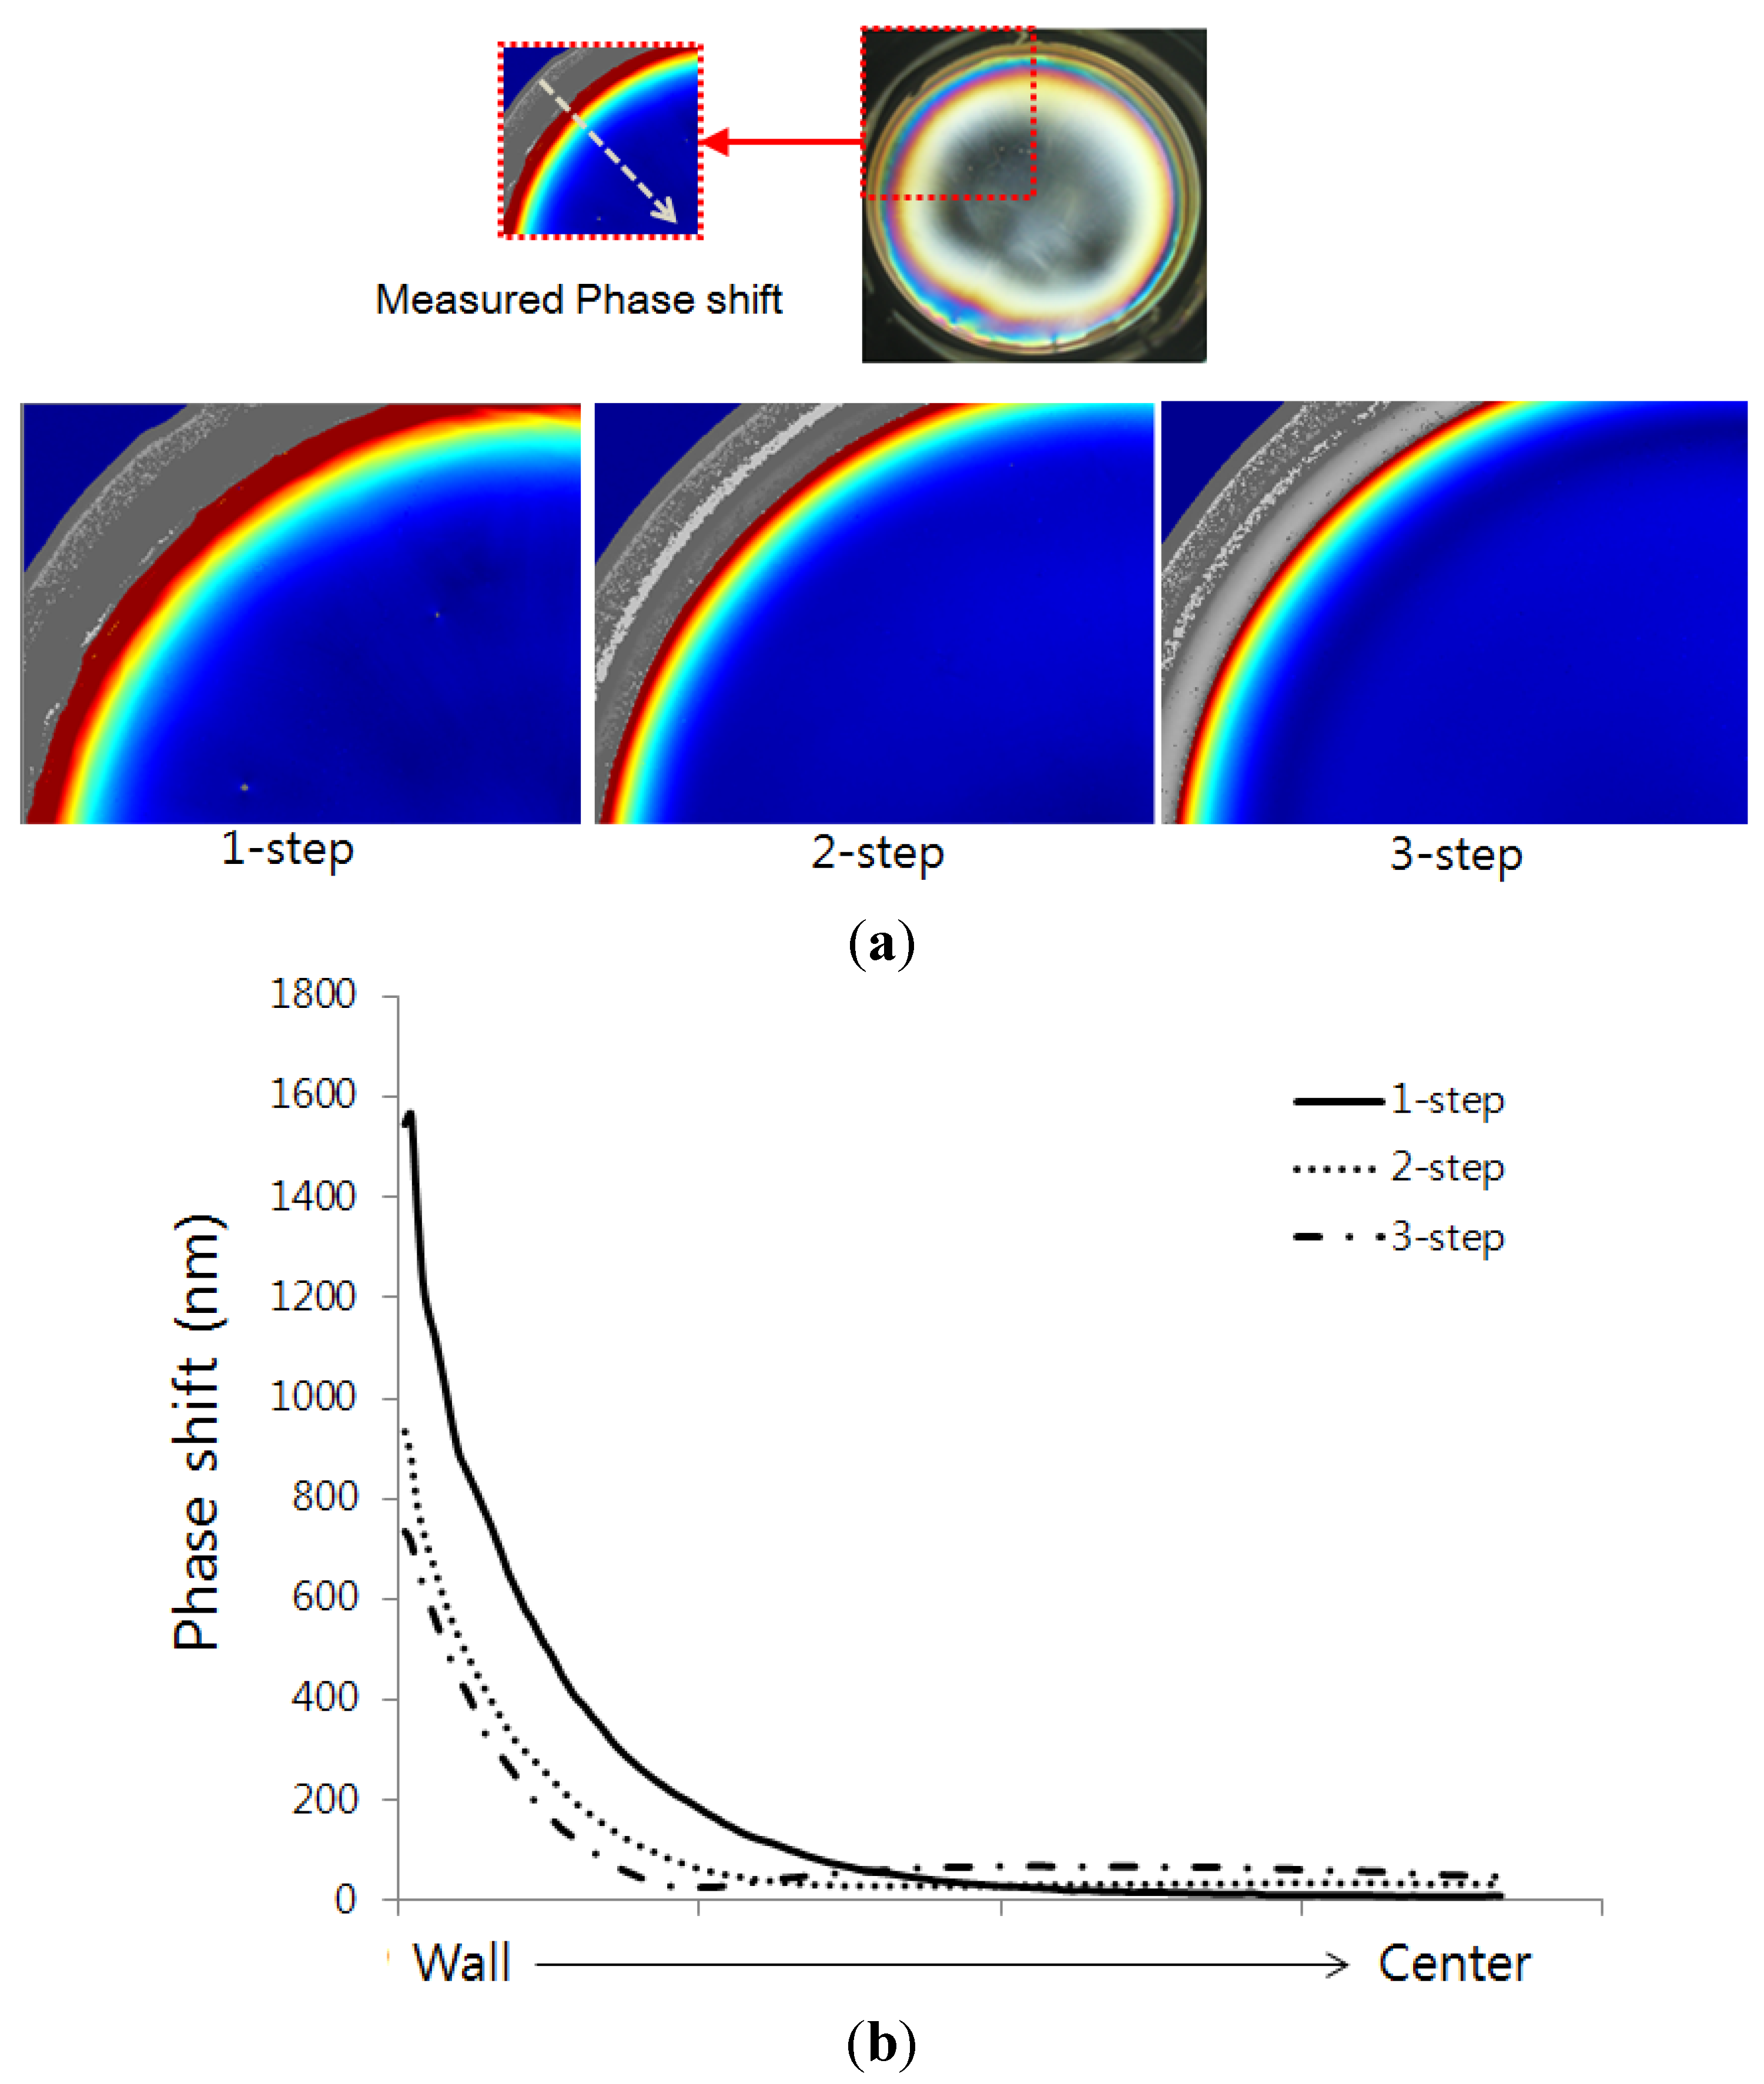
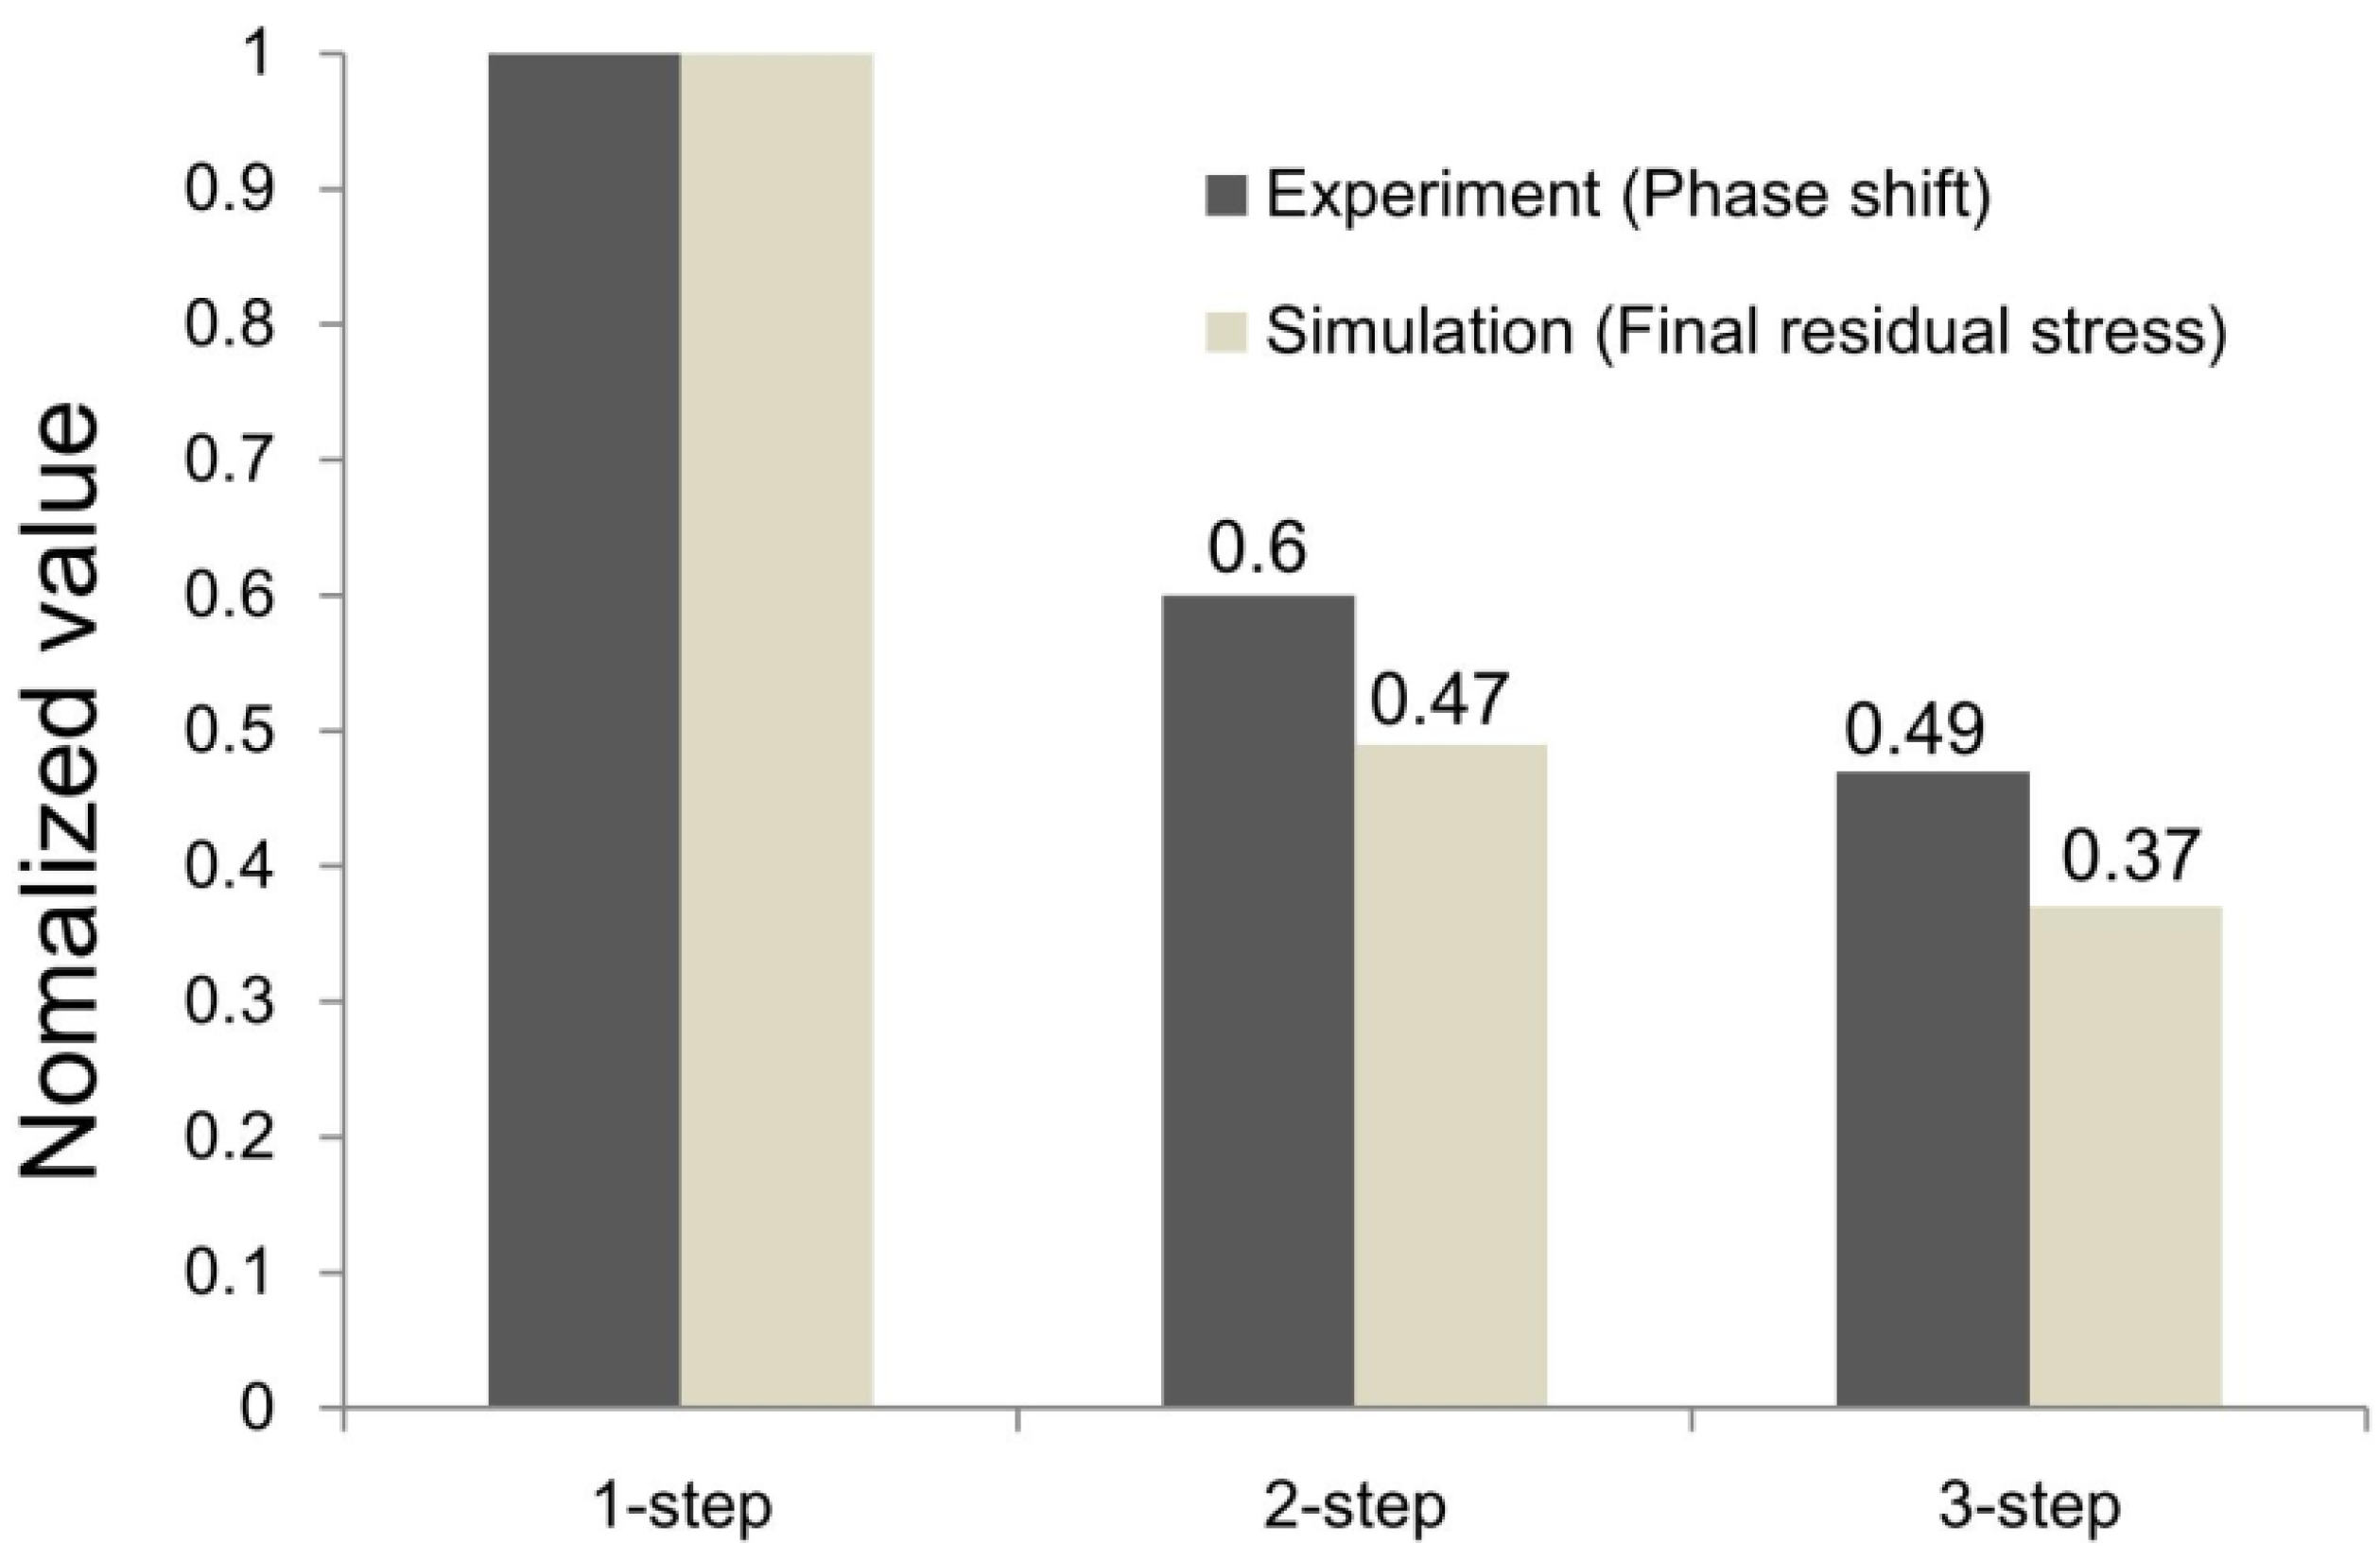
4.2. Results Comparison for Birefringence Distribution and Analysis


5. Three-Step Cure Optimization
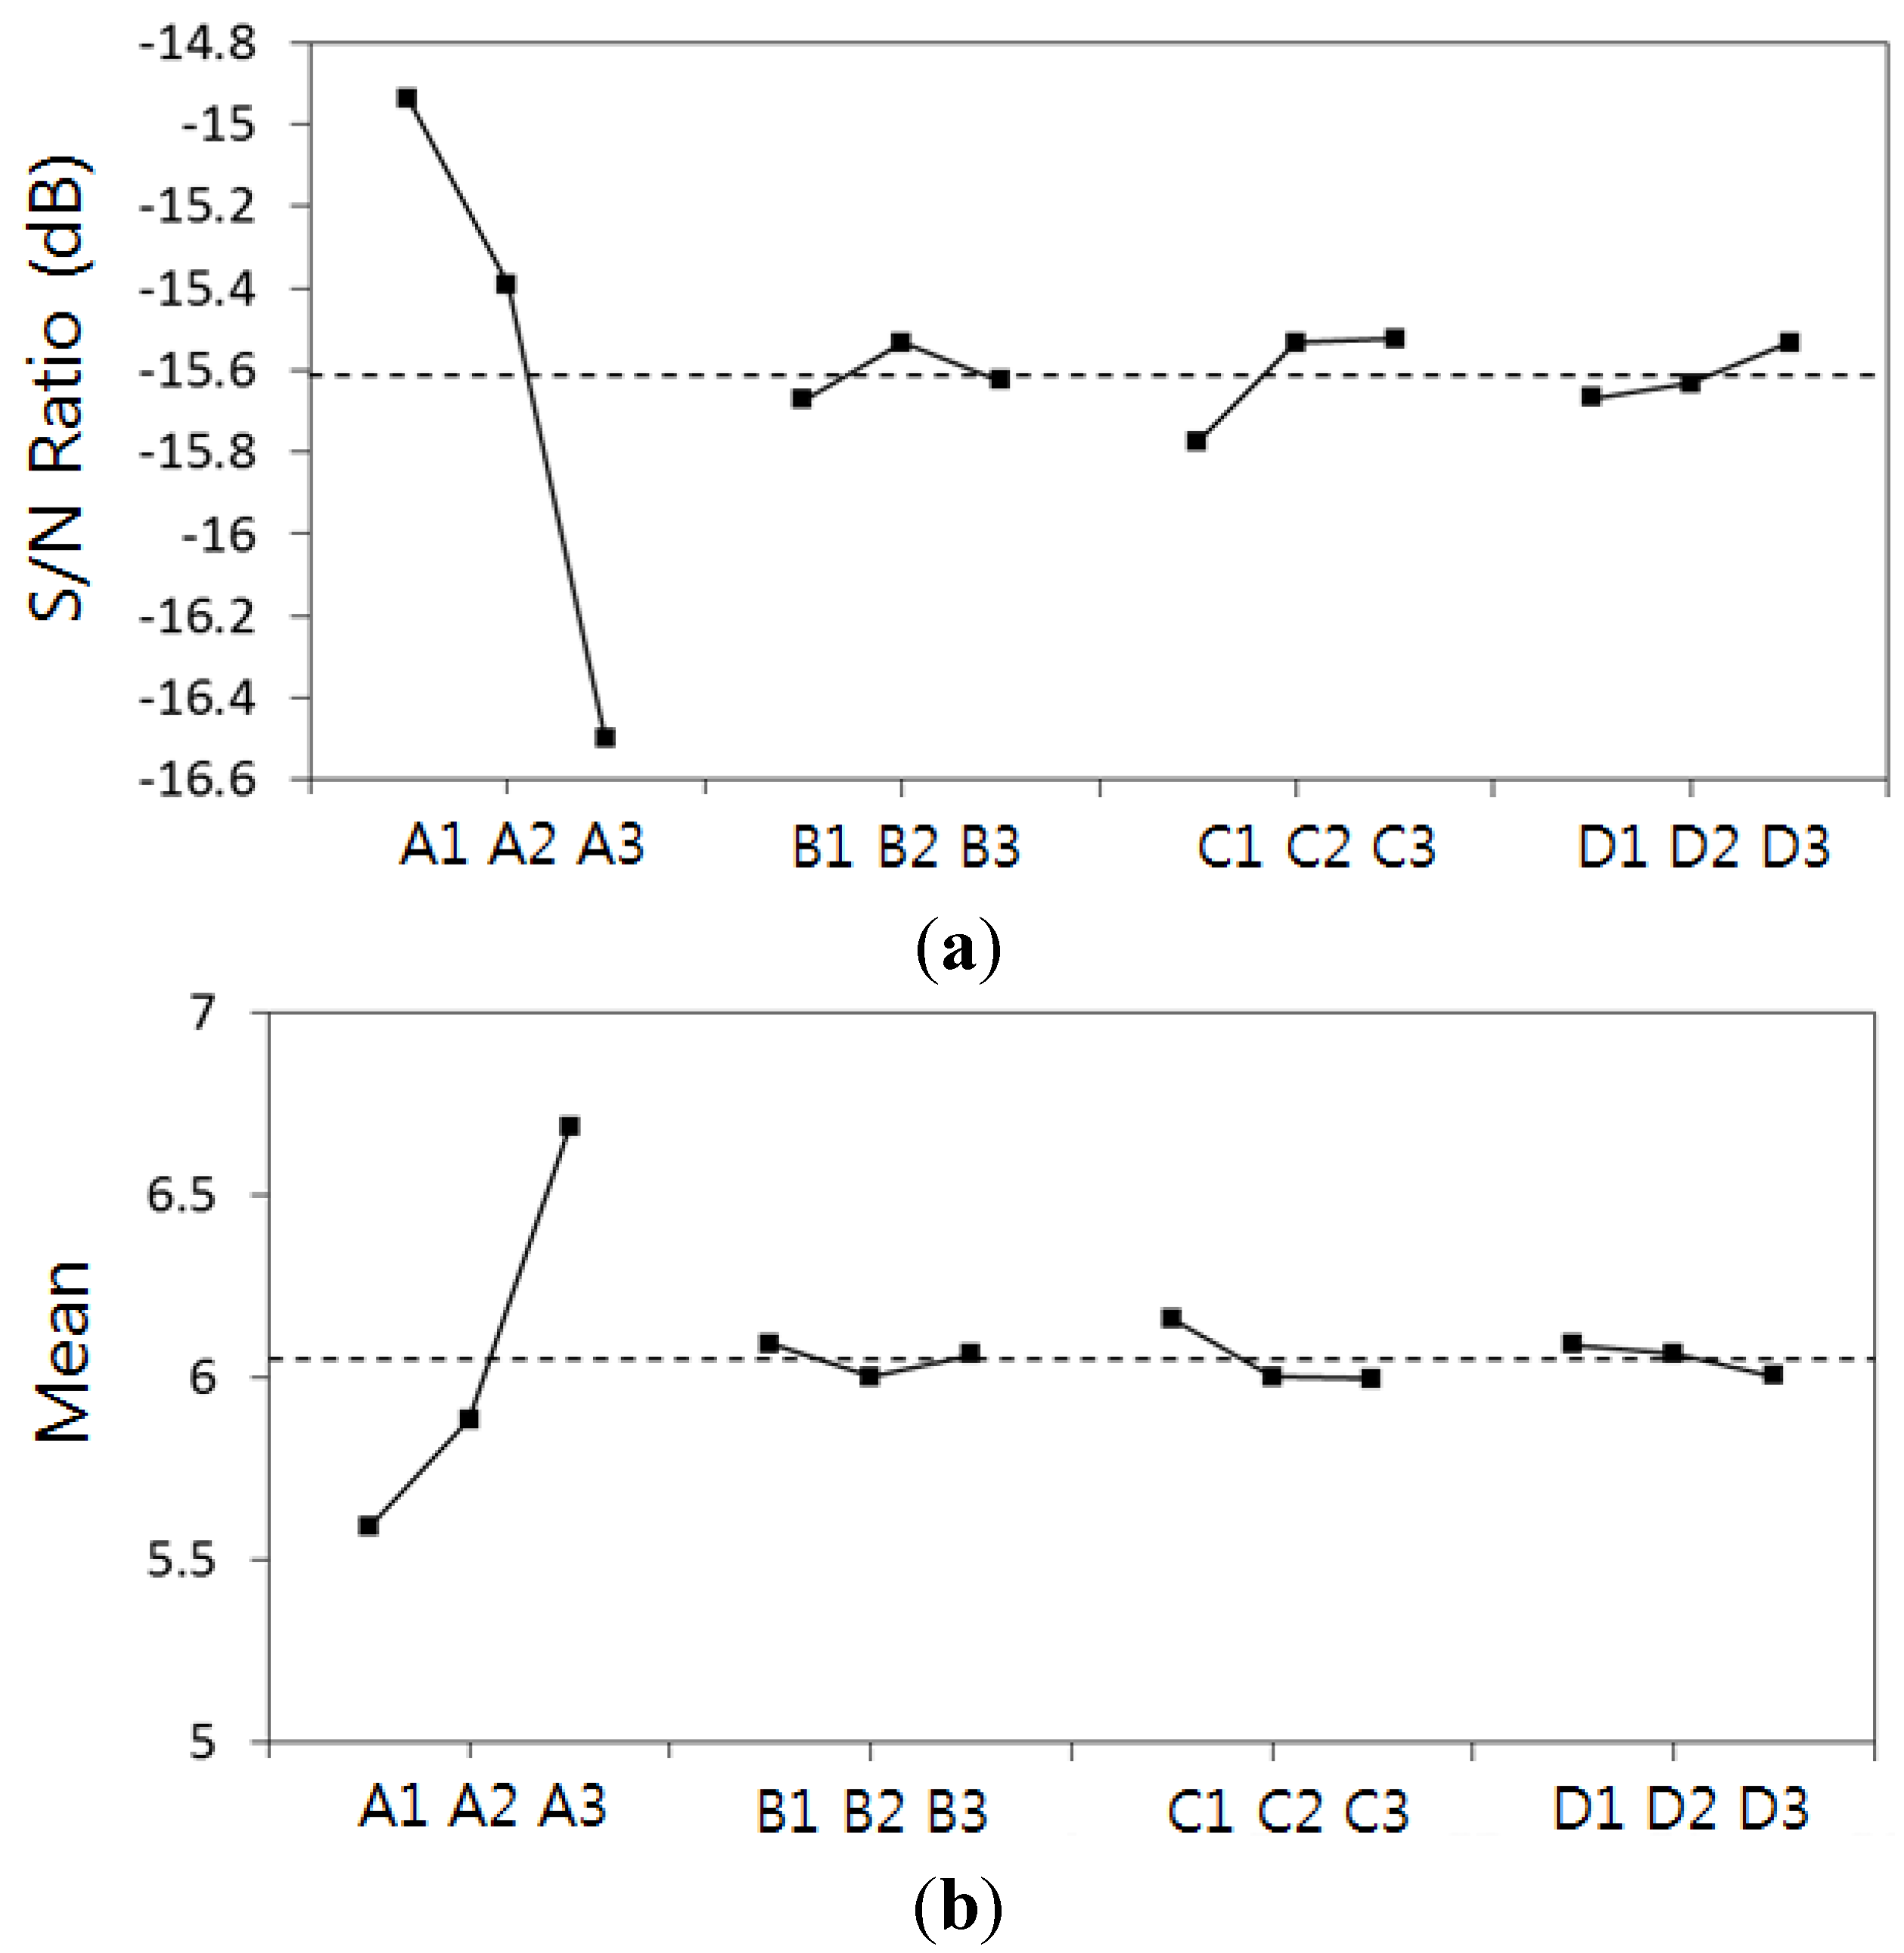
5.1. Finite Element Analysis for Step Cure

| Design parameters | Level | |||
|---|---|---|---|---|
| 1 | 2 | 3 | ||
| A | First step temperature | 60 °C | 70 °C | 80 °C |
| B | Second step temperature | 100 °C | 110 °C | 120 °C |
| C | First step time | 5 min | 10 min | 15 min |
| D | Second step time | 5 min | 10 min | 15 min |
| No. | Design parameters | S/N Ratio (dB) | Final residual stress (MPa) | |||
|---|---|---|---|---|---|---|
| First step temperature (°C) | Second step temperature (°C) | First step time (min) | Second step time (min) | |||
| 1 | 60 | 100 | 5 | 5 | −15.22 | 5.77 |
| 2 | 60 | 110 | 10 | 10 | −14.81 | 5.50 |
| 3 | 60 | 120 | 15 | 15 | −14.79 | 5.49 |
| 4 | 70 | 100 | 10 | 15 | −15.30 | 5.82 |
| 5 | 70 | 110 | 15 | 5 | −15.28 | 5.81 |
| 6 | 70 | 120 | 5 | 10 | −15.59 | 6.02 |
| 7 | 80 | 100 | 15 | 10 | −16.49 | 6.68 |
| 8 | 80 | 110 | 5 | 15 | −16.51 | 6.69 |
| 9 | 80 | 120 | 10 | 5 | −16.49 | 6.68 |

6. Conclusions
Acknowledgments
Author Contributions
Conflicts of Interest
References
- Zhang, J.; Xu, Y.C.; Huang, P. Effect of cure cycle on curing process and hardness for epoxy resin. eXPRESS Polym. Lett. 2009, 3, 534–541. [Google Scholar] [CrossRef]
- White, S.R.; Hahn, H.T. Process modeling of composite materials: Residual stress development during cure. Part I. Model formulation. J. Compos. Mater. 1992, 26, 2402–2422. [Google Scholar] [CrossRef]
- White, S.R.; Hahn, H.T. Process modeling of composite materials: Residual stress development during cure. Part II. Experimental Validation. J. Compos. Mater. 1992, 26, 2423–2453. [Google Scholar] [CrossRef]
- Kim, K.S.; Hahn, H.T. Residual stress development during processing of graphite/epoxy composite. Compos. Sci. Technol. 1989, 36, 121–132. [Google Scholar] [CrossRef]
- Bogetti, T.A.; Gillespie, J.W., Jr. Process induced stress and deformation in thick-section thermoset composite laminates. J. Compos. Mater. 1992, 26, 626–660. [Google Scholar]
- Zhu, Q.; Geubelle, P.H.; Li, M.; Tucker, C.L. Dimensional accuracy of thermoset composites: Simulation of process-induced residual stresses. J. Compos. Mater. 2001, 35, 2171–2205. [Google Scholar] [CrossRef]
- Yi, S.; Hilton, H.H.; Ahmad, M.F. A finite element approach for cure simulation of thermosetting matrix composites. Comput. Struct. 1997, 64, 383–388. [Google Scholar] [CrossRef]
- Ciriscioli, P.R.; Wang, Q.; Springer, G.S. Autoclave curing-Comparisons of model and test results. J. Compos. Mater. 1992, 26, 90–102. [Google Scholar] [CrossRef]
- Song, M.J.; Kim, K.H.; Yoon, G.S.; Kim, H.K. Multi-step Cure Process for Void-free Silicone Resin Encapsulant. Adv. Sci. Lett. 2012, 13, 126–131. [Google Scholar] [CrossRef]
- Song, M.J.; Kim, K.H.; Yoon, G.S.; Kim, H.K. A Multi-step Cure Process to Prevent Residual Bubbles in LED Encapsulation Silicone Resin. Trans. Mater. Process. 2012, 21, 101–106. [Google Scholar]
- Loos, A.C.; Springer, G.S. Curing of epoxy matrix composites. J. Compos. Mater. 1983, 17, 135–169. [Google Scholar] [CrossRef]
- Teplinsky, S.; Gutman, E.M. Computer simulation of process induced stress and strain development during cure of thick-section thermosetting composites. Comput. Mater. Sci. 1996, 6, 71–76. [Google Scholar] [CrossRef]
- Kamal, M.R.; Sourour, S. Kinetics and thermal characterization of thermoset cure. Polym. Eng. Sci. 1973, 13, 59–64. [Google Scholar] [CrossRef]
- Tsygankov, S.A.; Gol’dman, A.Y. Changes in the elastic modulus of thermosetting polymers during curing. Polym. Sci. U.S.S.R. 1979, 21, 321–326. [Google Scholar] [CrossRef]
- Hu, G.; Chew, S.; Singh, B. Cure shrinkage analysis of green epoxy molding compound with application to warpage analysis in a plastic IC package. In Proceedings of the 8th International Conference on Electronic Packaging Technology, Shanghai, China, 14–17 August 2007.
- Saraswat, M.K.; Jansen, K.M.B.; Ernst, L.J. Cure shrinkage and bulk modulus determination for molding compounds. In Proceedings of the Electronics System Integration Technology Conference, Dresden, Germany, 5–7 September 2006.
- Weng, C.; Lee, W.B.; To, S. Birefringence techniques for the characterization of residual stresses in injection-moulded micro-lens arrays. Polym. Test. 2009, 28, 709–714. [Google Scholar] [CrossRef]
- Na, J.W.; Rhim, S.H.; Oh, S.I. Prediction of birefringence distribution for optical glass lens. J. Mater. Process. Technol. 2007, 187–188, 407–411. [Google Scholar]
- Lu, X.; Khim, L.S. A statistical experimental study of the injection molding of optical lenses. J. Mater. Process. Technol. 2001, 113, 189–195. [Google Scholar] [CrossRef]
- Lai, E.H.; Wang, P.J. Study of process parameters on optical qualities for injection-molded plastic lenses. Appl. Opt. 2008, 47, 2017–2027. [Google Scholar] [CrossRef] [PubMed]
- Janeschitz-Kriegel, H.; Meissner, J. Polymer Melt Rheology and Flow Briefringence; Springer-Verlag: Berlin, Germany, 1983. [Google Scholar]
- Sato, T.; Miura, K.; Ishino, N.; Ohtera, Y.; Tamamura, T. Photonic crystals for the visible range fabricated by autocloning technique and their application. Opt. Quantum Electron. Appl. Opt. 2002, 34, 63–70. [Google Scholar] [CrossRef]
© 2014 by the authors; licensee MDPI, Basel, Switzerland. This article is an open access article distributed under the terms and conditions of the Creative Commons Attribution license (http://creativecommons.org/licenses/by/3.0/).
Share and Cite
Song, M.-J.; Kim, K.-H.; Yoon, G.-S.; Park, H.-P.; Kim, H.-K. An Optimal Cure Process to Minimize Residual Void and Optical Birefringence for a LED Silicone Encapsulant. Materials 2014, 7, 4088-4104. https://doi.org/10.3390/ma7064088
Song M-J, Kim K-H, Yoon G-S, Park H-P, Kim H-K. An Optimal Cure Process to Minimize Residual Void and Optical Birefringence for a LED Silicone Encapsulant. Materials. 2014; 7(6):4088-4104. https://doi.org/10.3390/ma7064088
Chicago/Turabian StyleSong, Min-Jae, Kwon-Hee Kim, Gil-Sang Yoon, Hyung-Pil Park, and Heung-Kyu Kim. 2014. "An Optimal Cure Process to Minimize Residual Void and Optical Birefringence for a LED Silicone Encapsulant" Materials 7, no. 6: 4088-4104. https://doi.org/10.3390/ma7064088