1. Introduction
High strength/mass ratio mechanical or aeronautical components that work in an aggressive environment need the employment of light alloys or composite materials. Combined with their low density and intermediate to high strength, Titanium alloys offer clear advantages for naval-structures, aero and marine power, off-shore, biomedical and chemical processing applications [
1].
Data for smooth and notched (with low stress concentration factors) Ti-6Al-4V samples, fatigue tested in laboratory air or aggressive environment, are available in the literature [
2,
3,
4,
5,
6,
7,
8,
9,
10,
11], while only in a few references can the results at high stress concentration factors and in a very aggressive environment be found [
12,
13,
14,
15,
16,
17,
18].
In [
2], Morrissey and Nicholas tested cylindrical dogbone samples under fully reversed loading (
R = −1) with an upper limit of 10
9 load cycles. The material mechanical properties were:
UTS = 968 MPa and
YS = 930 MPa. The tests were carried out at 60 and 20 kHz. After around 200,000 load cycles, the fatigue limit of the Titanium alloy is approximately constant regardless of the test frequency. In [
3], Bellows
et al. used a step loading procedure to carry out axial fatigue tests at 10
7 cycles on smooth cylindrical Ti-6Al-4V samples. The specimens were formed from fan blade forgings with their axis parallel to the longest direction in the forging. The material
UTS and
YS were 978 and 930 MPa, respectively.
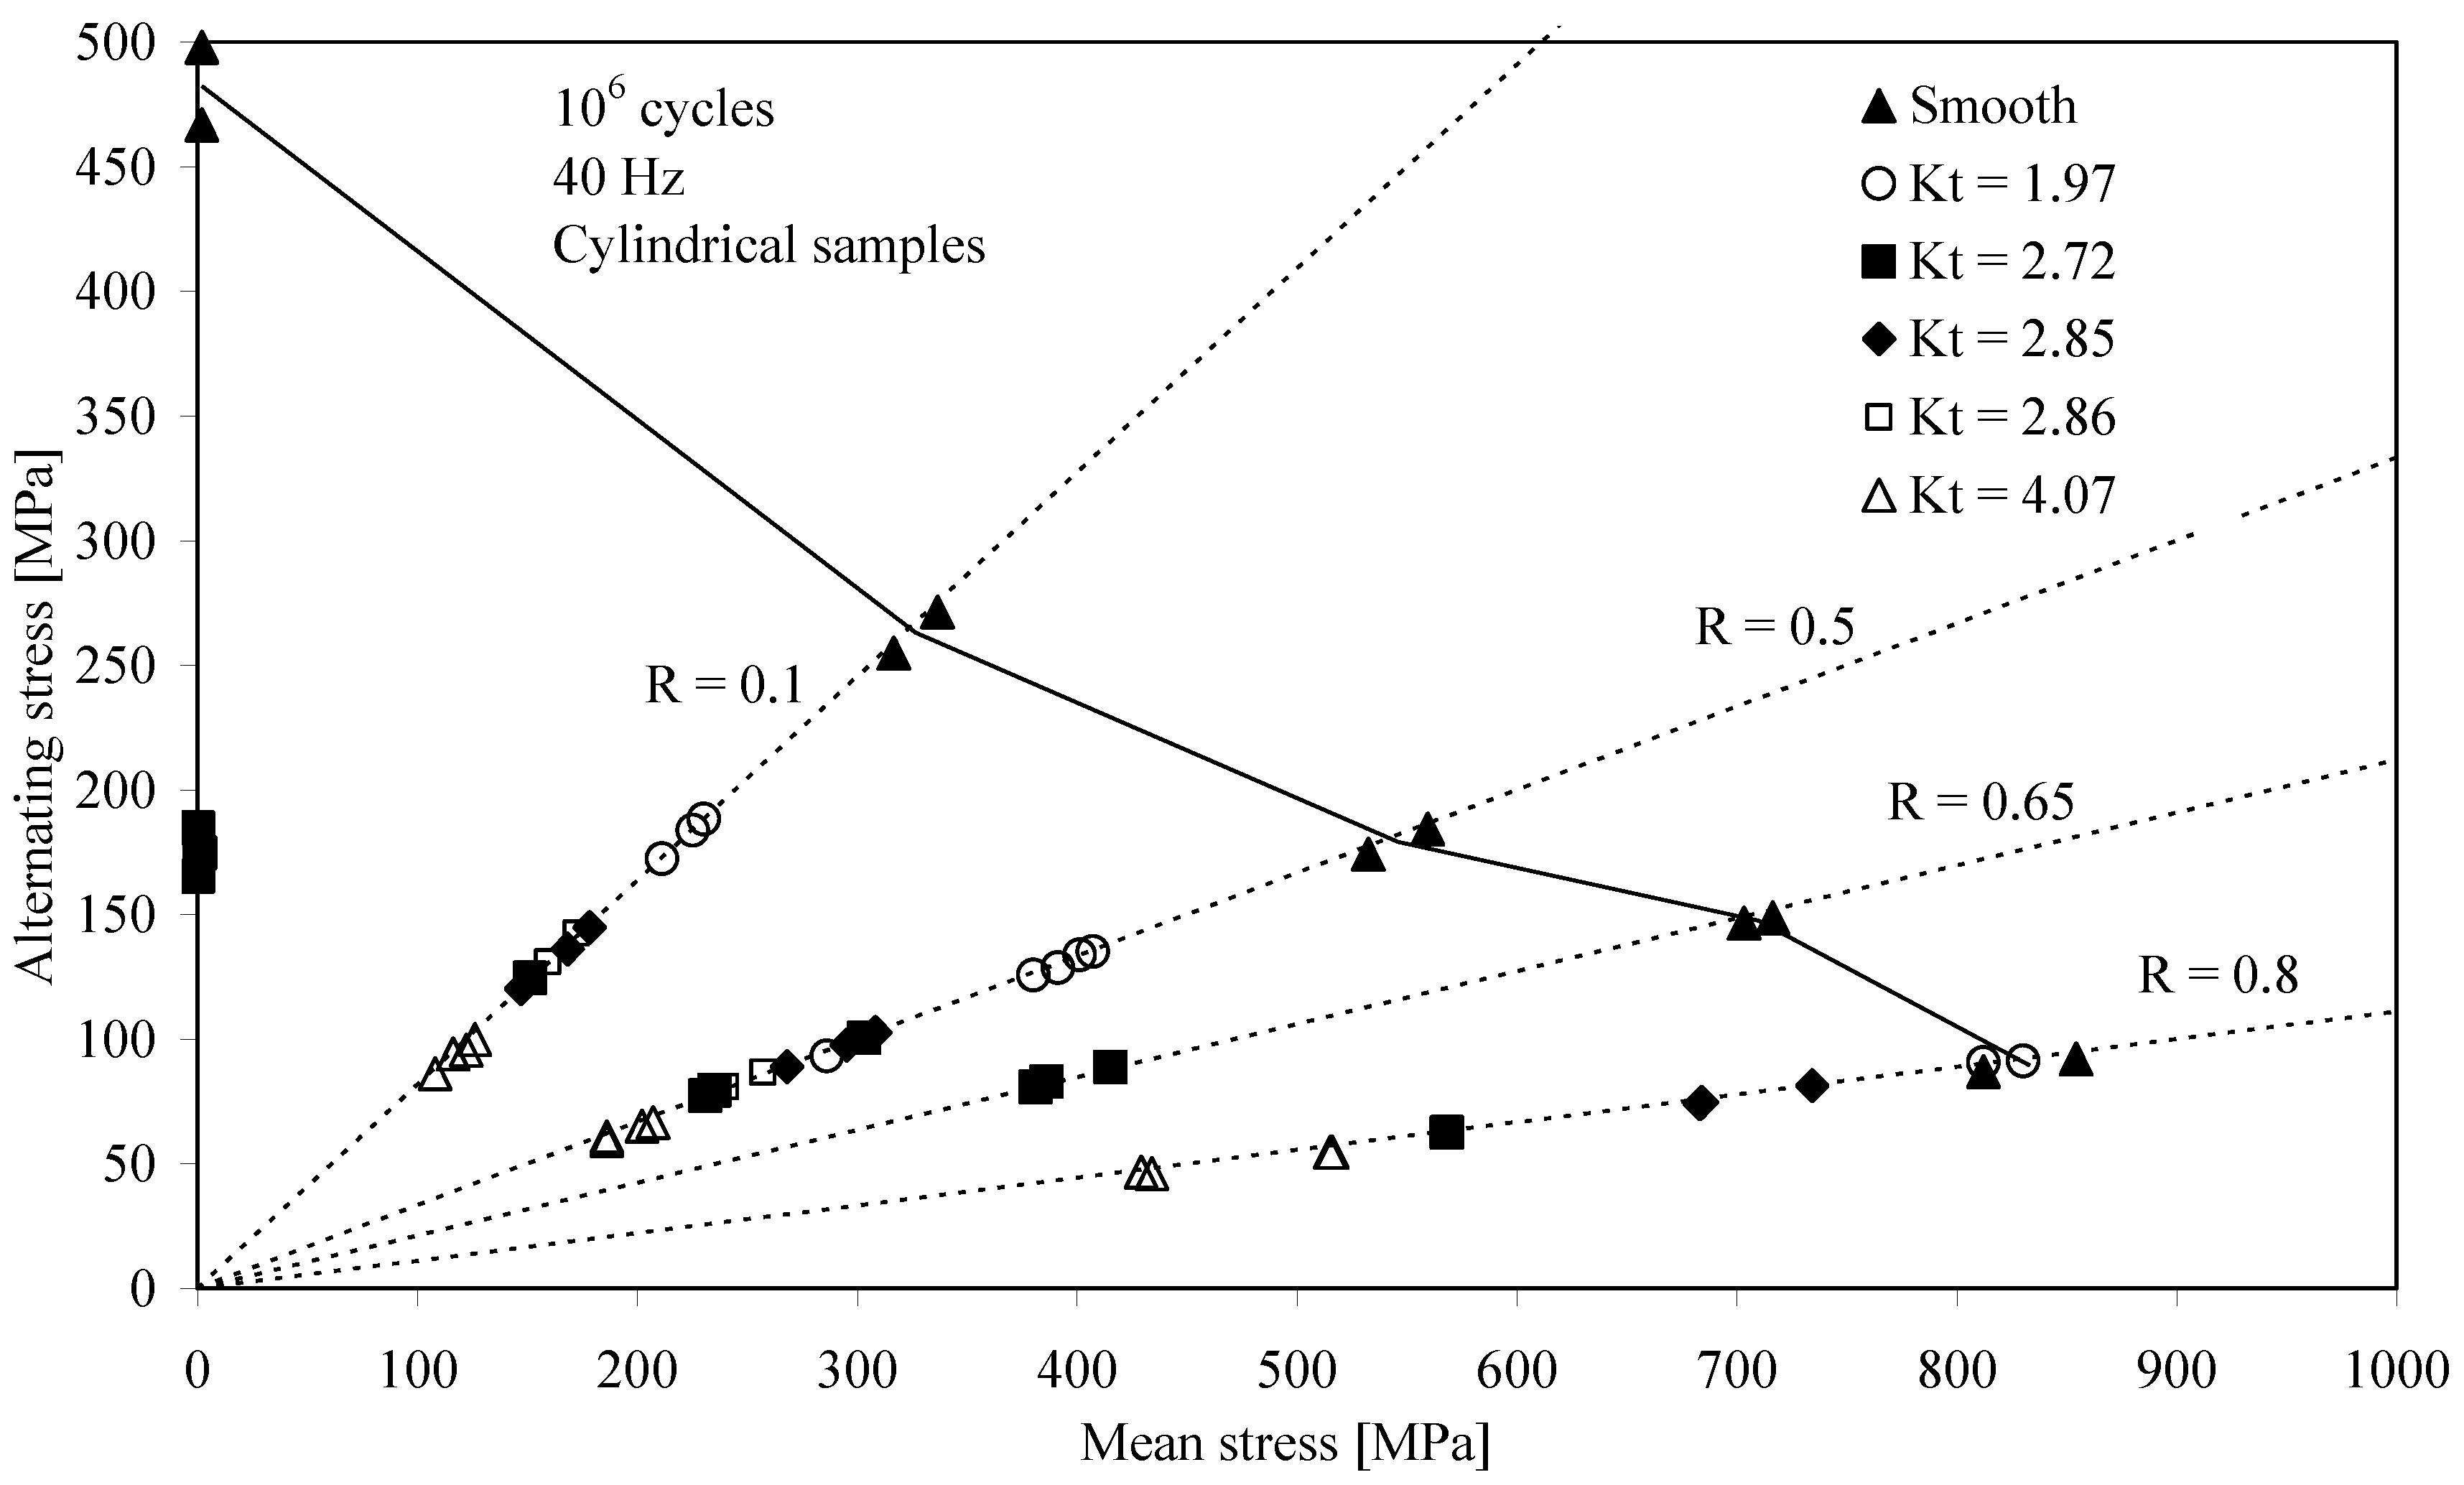
R-ratios equal to −1, 0.1, 0.5 and 0.8 were investigated and the test frequency was 60 Hz. Room temperature endurance limits and constant-life Haigh (modified-Goodman) diagrams for smooth Ti-6Al-4V specimens generated by both the step method and conventional method (using
S-N curves) were analyzed and statistically compared. The conclusion is that step testing yields results that are within the statistical limits of conventional S-N curve results and therefore is a valid method for generating endurance limits and therefore Haigh diagrams for Ti-6Al-4V specimens.
In [
4], D.B. Lanning
et al. tested cylindrical samples machined from forged Ti-6Al-4V plate along the longitudinal direction. The mechanical properties in this direction were:
UTS = 978 MPa and
YS = 930 MPa. Both smooth and V-notched (
Kt = 2.0, 2.7 and 4.1) cylindrical samples were tested under axial fatigue with
R-ratios = −1, 0.1, 0.5, 0.65 and 0.8. The samples were all stress relieved after the machining operations. The fatigue limit at 10
6 cycles was estimated using the step loading method [
3] at a test frequency of 50 Hz. Finite element solutions were generated to provide stress distributions for the notched gage sections. The stress distributions were used in the search for a critical distance over which the quantities of mean stress, stress range, or elastic strain energy may contribute to the fatigue process and can be correlated to similar quantities from smooth, unnotched specimens.
In [
5], D.B. Lanning
et al. tested notched cylindrical samples machined from a Ti-6Al-4V forged plate in STOA condition under axial fatigue (40 Hz) at 10
6 cycles. The material mechanical properties in the longitudinal direction were:
UTS = 978 MPa and
YS = 930 MPa. The samples were all stress relieved after the machining operations. Stress concentration factors of 1.97, 2.72, 2.85, 2.86, 4.07 were obtained and
R-ratios = −1, 0.1, 0.5, 0.65 and 0.8 were investigated. A step loading procedure with a stress level increment of 5% of the previous step was implemented for generating points on a Haigh diagram. The experimental data were used in combination with finite element solutions for all specimen geometries to determine a “critical distance” parameter, determined from the stress distribution surrounding the notch in combination with fatigue limit stress data from unnotched specimens, that allows fatigue resistance evaluation.
In [
11], experimental data on fatigue tests on smooth cylindrical samples are reported. The tests were carried out on smooth hourglass samples machined from a bar. The Titanium alloy considered was a bimodal Ti-6Al-4V alloy with
UTS = 965 MPa and
YS = 915 MPa. The test results are collected in the diagram of
Figure 2, where the limiting stress at 2 × 10
5 cycles for
R = −1 and 0.1, respectively, are also indicated. The data collected for
R= −1 are in good agreement with the literature references mentioned in previous reports [
2]. The results also show that after around 100,000 load cycles the fatigue limit of the Titanium alloy is approximately constant regardless of the number of cycles. In Bellows
et al. [
3], the fatigue limits were also approximately constant with the number of cycles for a loading ratio
R = 0.1.
Figure 1.
Haigh diagram for a constant life of 10
6 cycles; smooth and notched Ti-6Al-4V samples [
4,
5].
Figure 1.
Haigh diagram for a constant life of 10
6 cycles; smooth and notched Ti-6Al-4V samples [
4,
5].
Figure 2.
S-N data for Ti-6Al-4V alloy plotted in terms of σ
max vs. the number of cycles to fail for various constant
R-ratios [
11].
Figure 2.
S-N data for Ti-6Al-4V alloy plotted in terms of σ
max vs. the number of cycles to fail for various constant
R-ratios [
11].
The effect of a very aggressive environment, such as a methanol solution, has not been accurately tested yet, notwithstanding its relatively great importance in practical applications. Johnston
et al. [
15] made an analysis of the failures occurred in pressurized aerospace methanol tanks. Test results indicated that the alloy is highly notch-sensitive in methanol. Stress-corrosion cracking in the alloy when exposed to methanol was also observed.
Although Titanium is a highly reactive material, Titanium alloys typically exhibit a high resistance to corrosive environments, due to the presence of a layer of Titanium oxide (TiO
2) which tends to passivate the action of the external environment [
16]. However, the influence of a mechanical action or abrasive can remove this surface layer, generating a direct interaction between the Titanium alloy and the external environment, leading to the appearance of relevant phenomena of stress corrosion cracking in an aqueous environment [
17]. This interaction is also generated by the presence of surface discontinuities, such as cracks, damage and notches, which break the continuity of the passivating layer of oxide, generating in this case also the susceptibility to stress corrosion cracking in water [
13,
14].
This trend was also found in environments other than water, highlighting in particular the high sensitivity of Titanium alloys to stress corrosion cracking in pure methanol if there are efforts made and there is the presence of cracks or notches, as observed in the failure of tanks of methanol used in the aerospace field [
15]. The addition of water in solution with methanol, however, seems to inhibit these effects, allowing the new formation of oxides that protect the surface against the corrosive effect of methanol on this and other Titanium alloys, as has been observed on the alloy Ti-6Al-4V [
16,
17].
Recent experiments on the fatigue behavior of slightly notched (
Kt = 1.18) Ti-6Al-4V specimens immersed in solution at various concentrations of methanol, however, have shown that, in the presence of dynamic loads applied (
R = 0.1), the effect of corrosion appears to be significant, even for very high amounts of water in solution [
18]. There is also an obvious correlation between the concentration of methanol and the breaking stress. This marked sensitivity of Titanium alloys exposed to mixtures of water and methanol can give rise to safety problems in the aeronautical field, since the injection of such mixtures in the compression stage of the turbine engine is used to retrieve the performance under conditions low density outside air [
19]. These problems can be extended to other structural elements made of Titanium alloy, whereas the majority of aircraft components is constantly fatigue loaded, for the heavy and repeated dynamic loads to which aircraft are typically subjected. The few experimental results related to the study of Titanium alloys in a solution of water, NaCl solution and methanol environment, presented in [
10,
15,
16,
18], and related to different geometries of the specimens, do not allow to quantify, at the project level, the actual margin of safety for the design of components in Ti-6Al-4V.
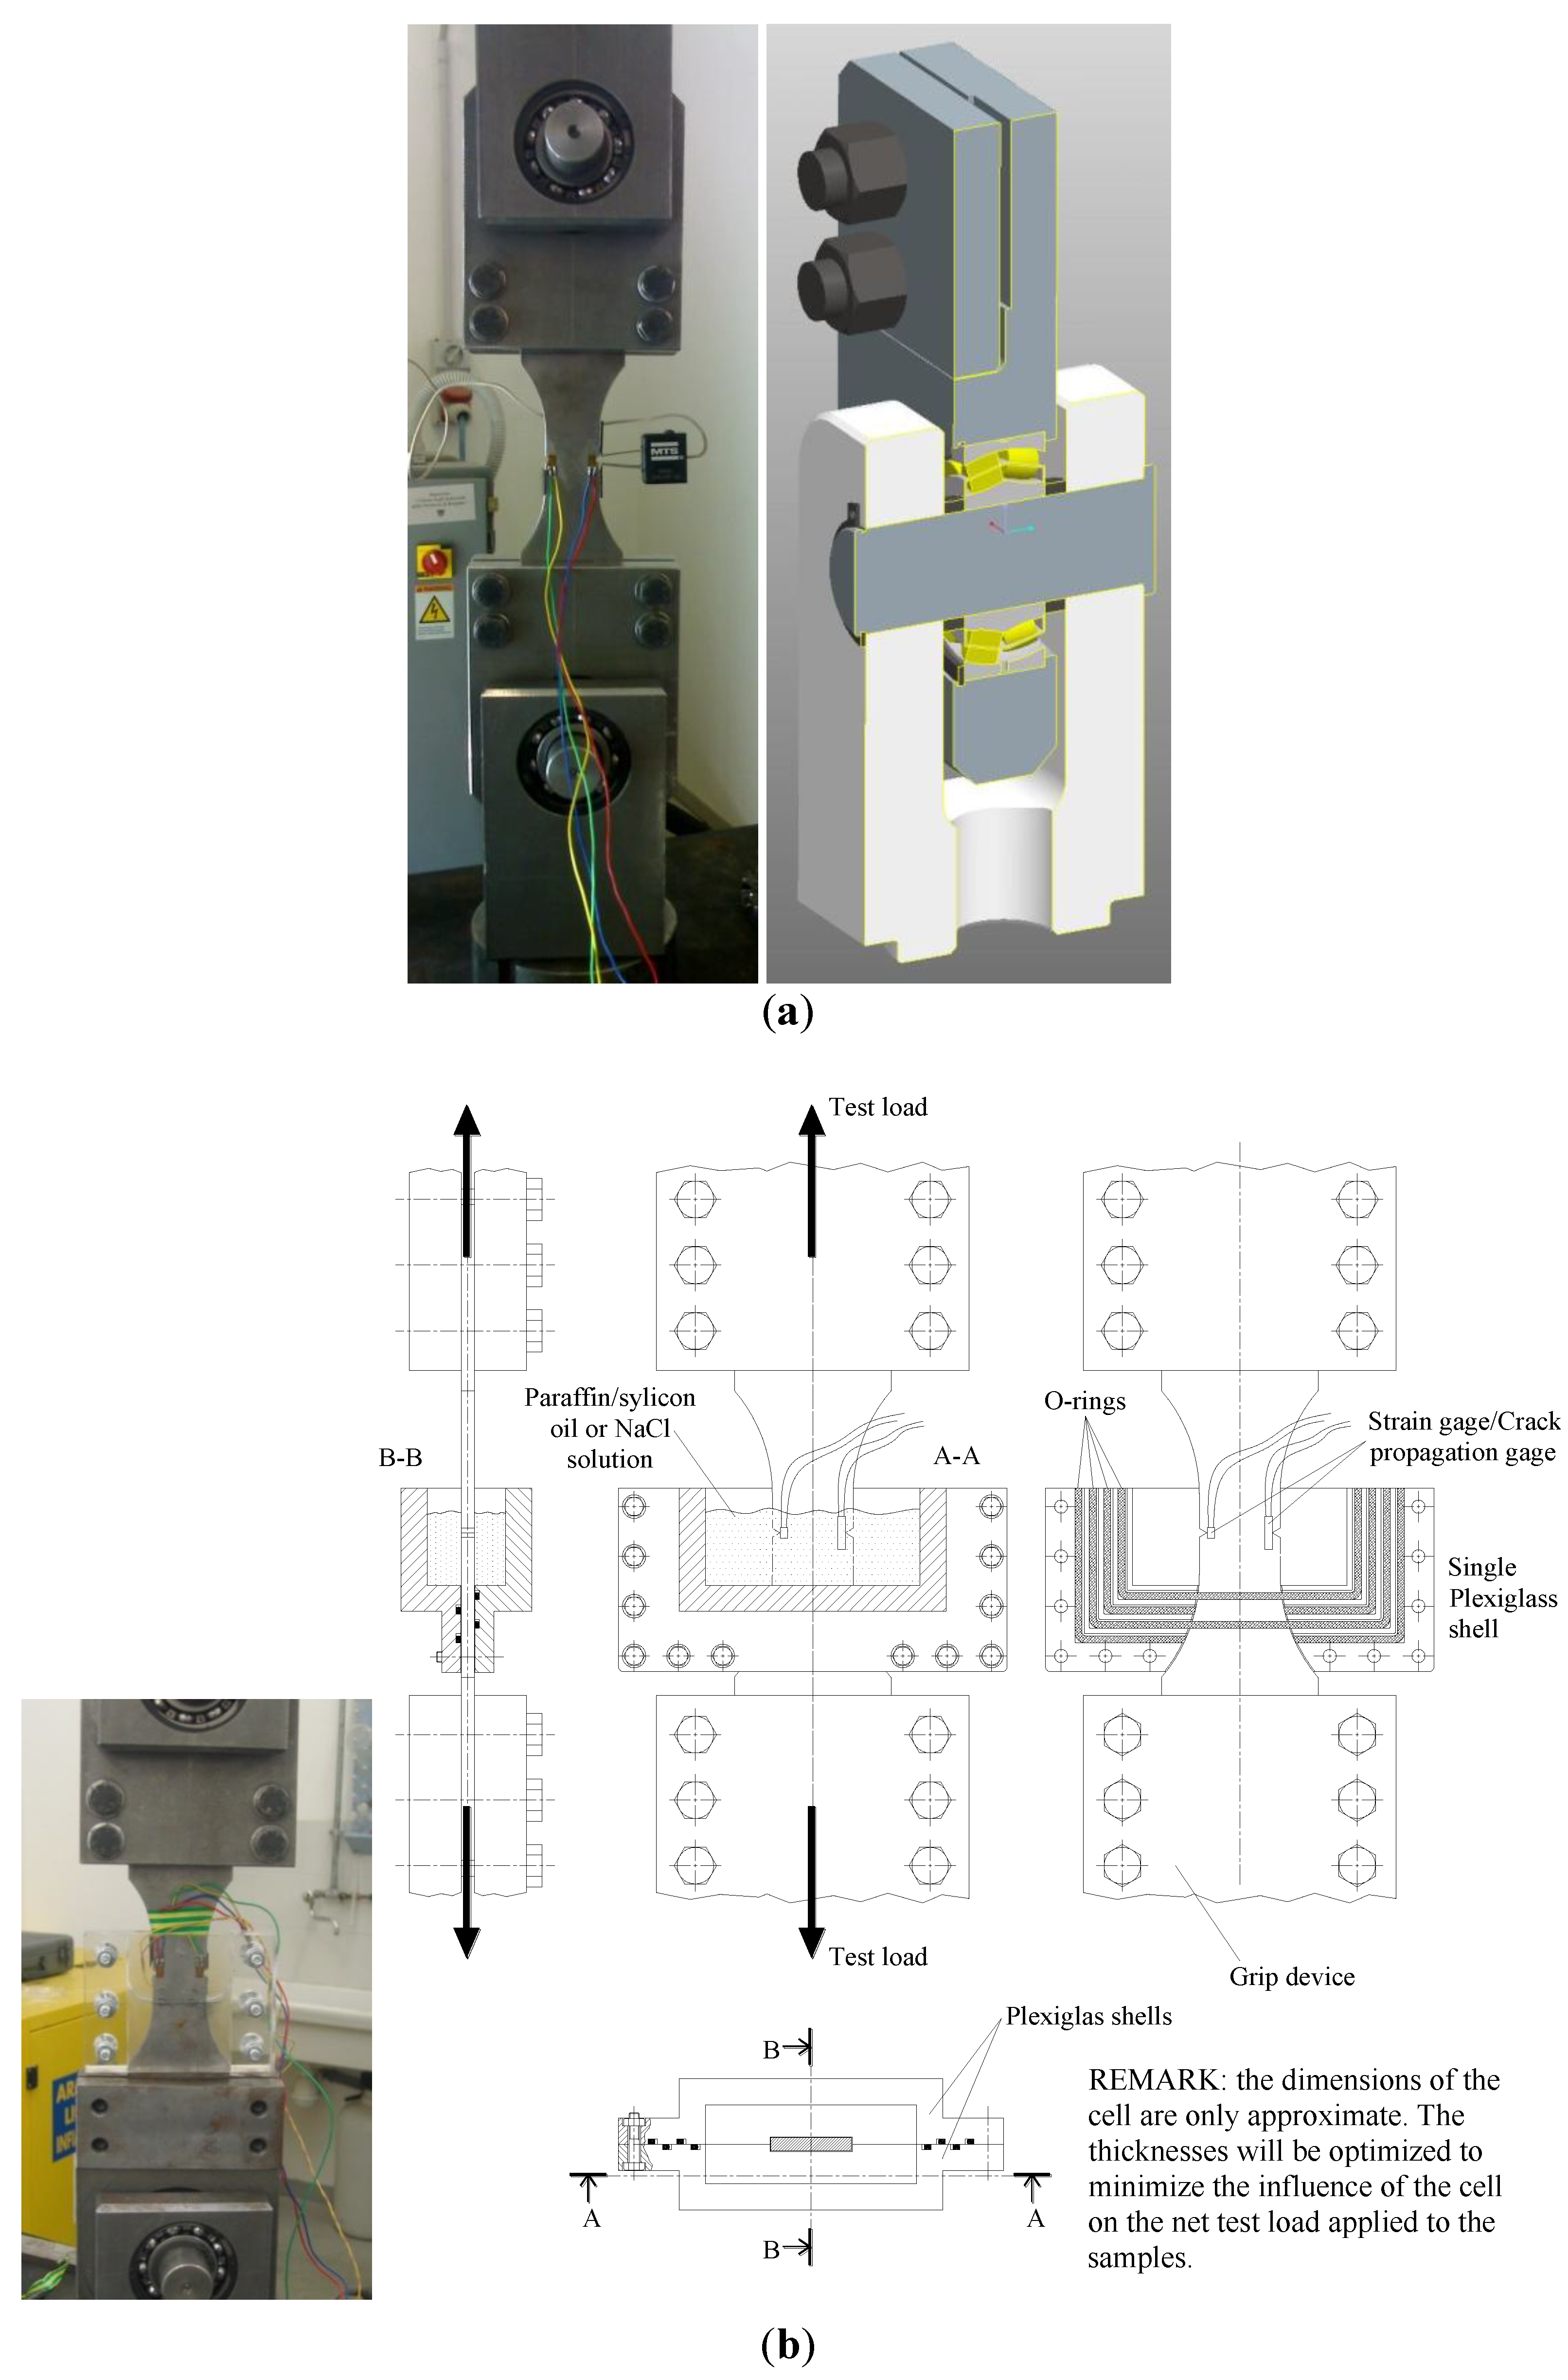
The aim of this paper is to evaluate the environmentally assisted crack growth in a single Titanium alloy, Ti-6Al-4V alloy widely used in naval-structures and aero-engine communities, whilst gaining a fundamental understanding of corrosion mechanisms that should be applicable to other Titanium alloys of this class. In this respect, the outcomes of the project will have direct relevance to industrial service operations. The study included the effect of the stress concentration factor for very high values of
Kt and the role of inert or corrosive environment. The Titanium alloy was tested in several environmental conditions in order to study the fatigue crack initiation/growth mechanisms under: (1) recirculated 3.5% NaCl solution; (2) inert environments like laboratory air, paraffin oil, laboratory air + beeswax coating. The samples were machined with a sharp notch having a stress concentration factor
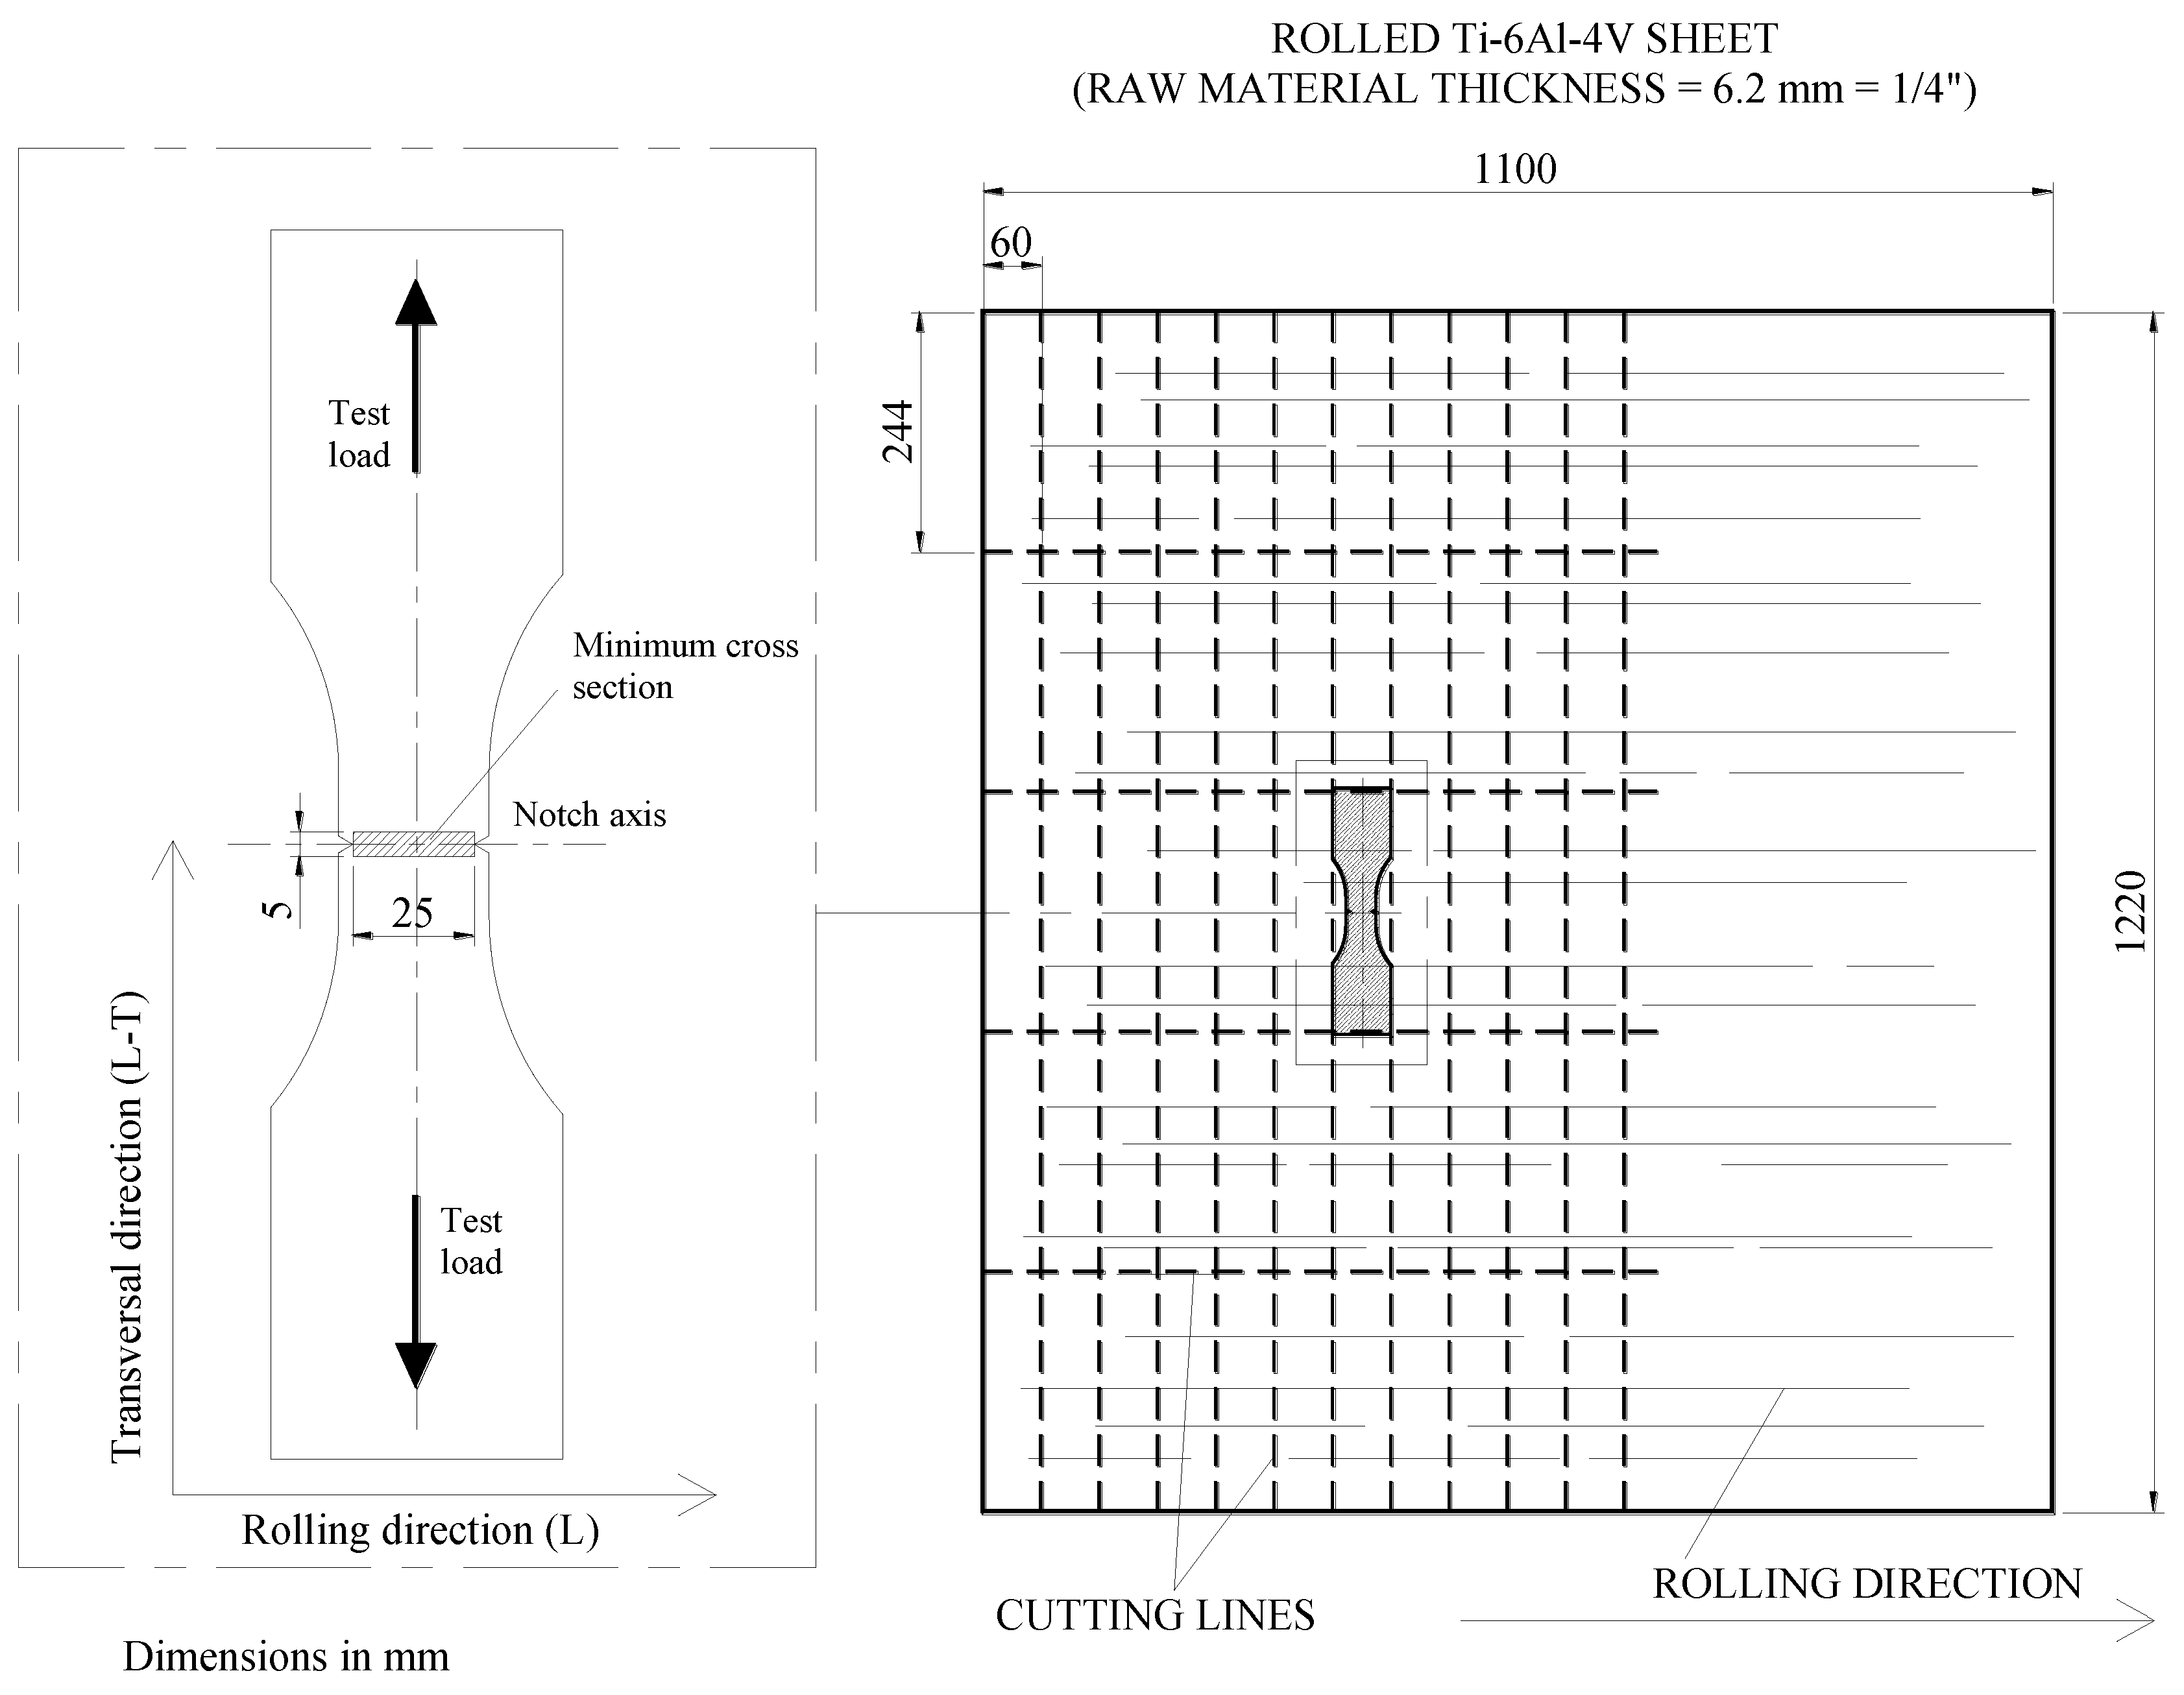
Kt ranging from 1.16 to 18.65. Such tests would allow to decouple the environmental and stress effects and understand the corrosion fatigue mechanism in terms of chemical and mechanical driving forces. More than 50 flat smooth and V-notched specimens (
Kt = 1.16–18.65) made of Ti-6Al-4V (ASTM B265-99 [
20]; STOA treatment;
UTS = 990 MPa;
YS = 945 MPa) were tested. The test time for each sample was about 1 week for a total testing time of 70 weeks (very long time experiments).
3. Results and Discussion
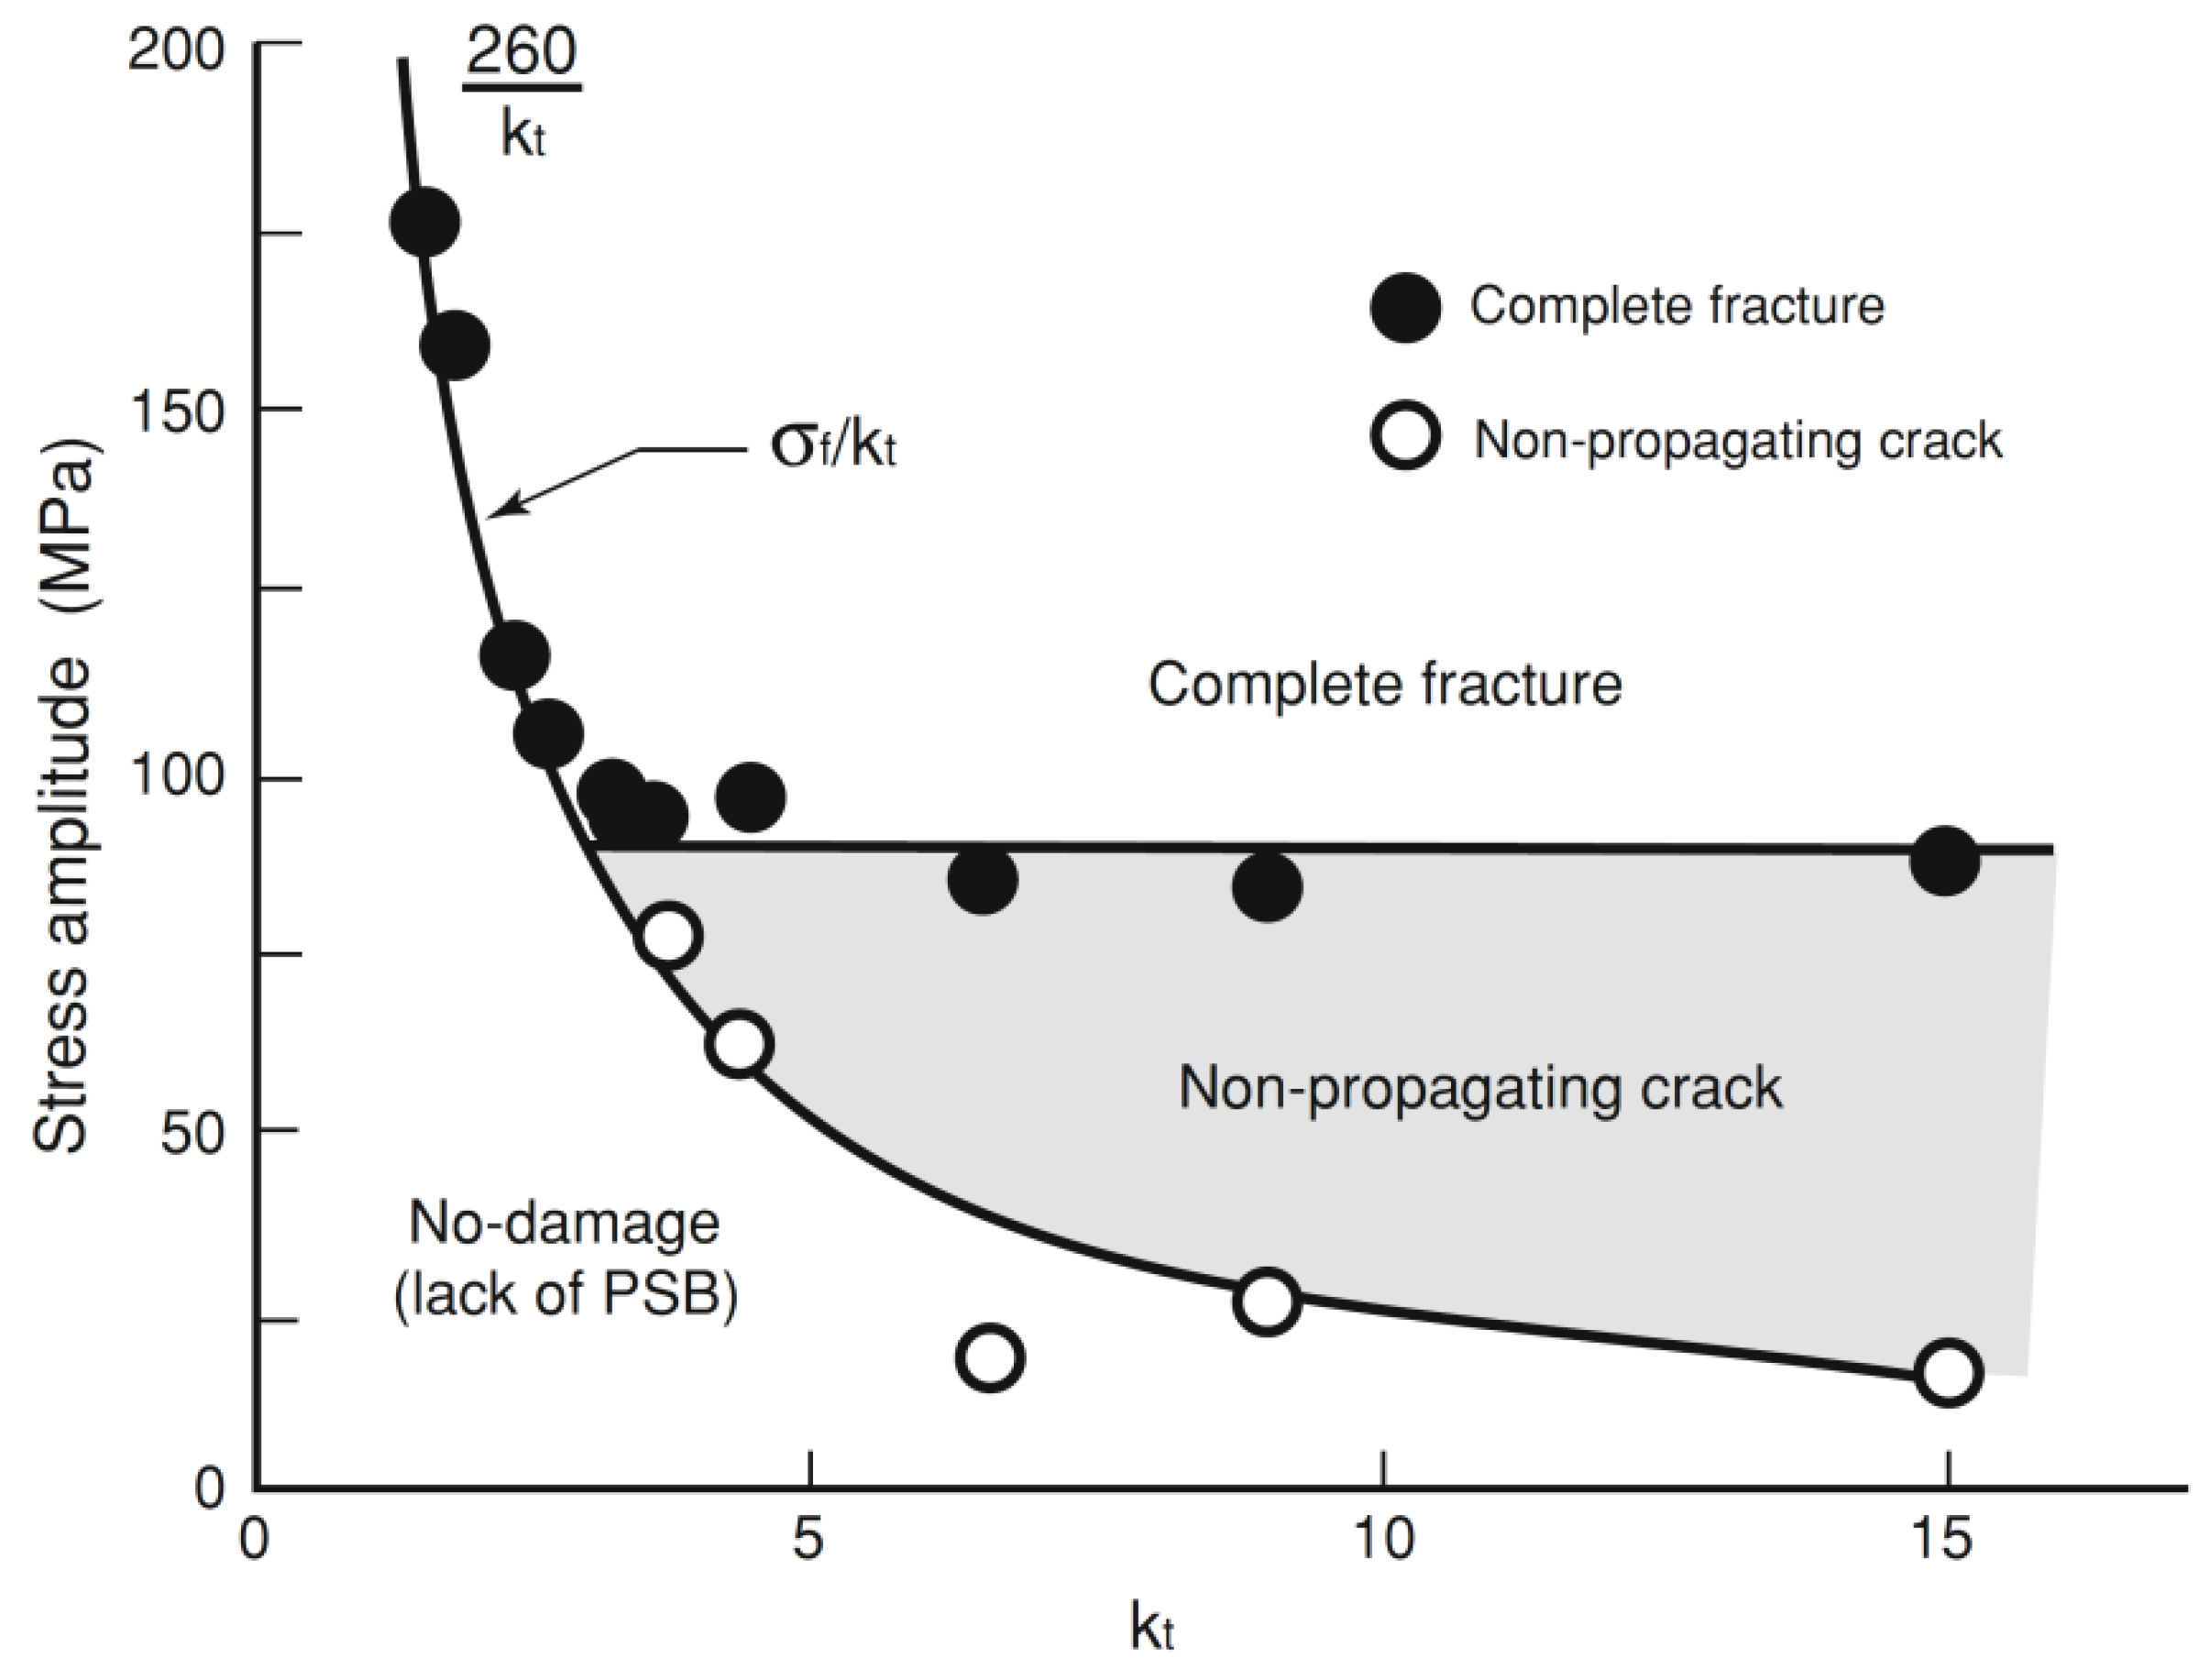
The experimental results were collected and converted into data points on a Frost and Dugdale-like diagram [
7,
21] obtained for mild steel at
R = −1 (
Figure 10), which shows the fatigue limit alternating stress at nucleation and complete fracture
versus Kt. With
Kt ranging from 1 to 15, Frost and Dugdale [
7,
21] found that a critical threshold stress concentration factor, approximately equal to three, is present for mild steel. After such value of
Kt the complete fracture line and the non-propagating cracks line bifurcate, giving evidence of a lower effect of the stress concentration factor on the fatigue resistance after such threshold. The critical stress concentration factors in different environments, given by the intersection between the complete fracture lines and the initiation curves, in this papers were estimated for the Titanium alloy.
The main results for the tests in air, paraffin oil, used to simulate an inert environment, and 3.5 wt% NaCl solution, are summarized in
Figure 11,
Figure 12 and
Figure 13 where the Log-limiting maximum stress (
R = 0.1) at initiation and failure
vs. Log-
Kt diagram at a constant life of 200,000 cycles for the samples tested in air, Paraffin oil and 3.5% NaCl solution are shown respectively.
Figure 10.
Nominal alternating stress
vs. Kt [
7,
21].
Figure 10.
Nominal alternating stress
vs. Kt [
7,
21].
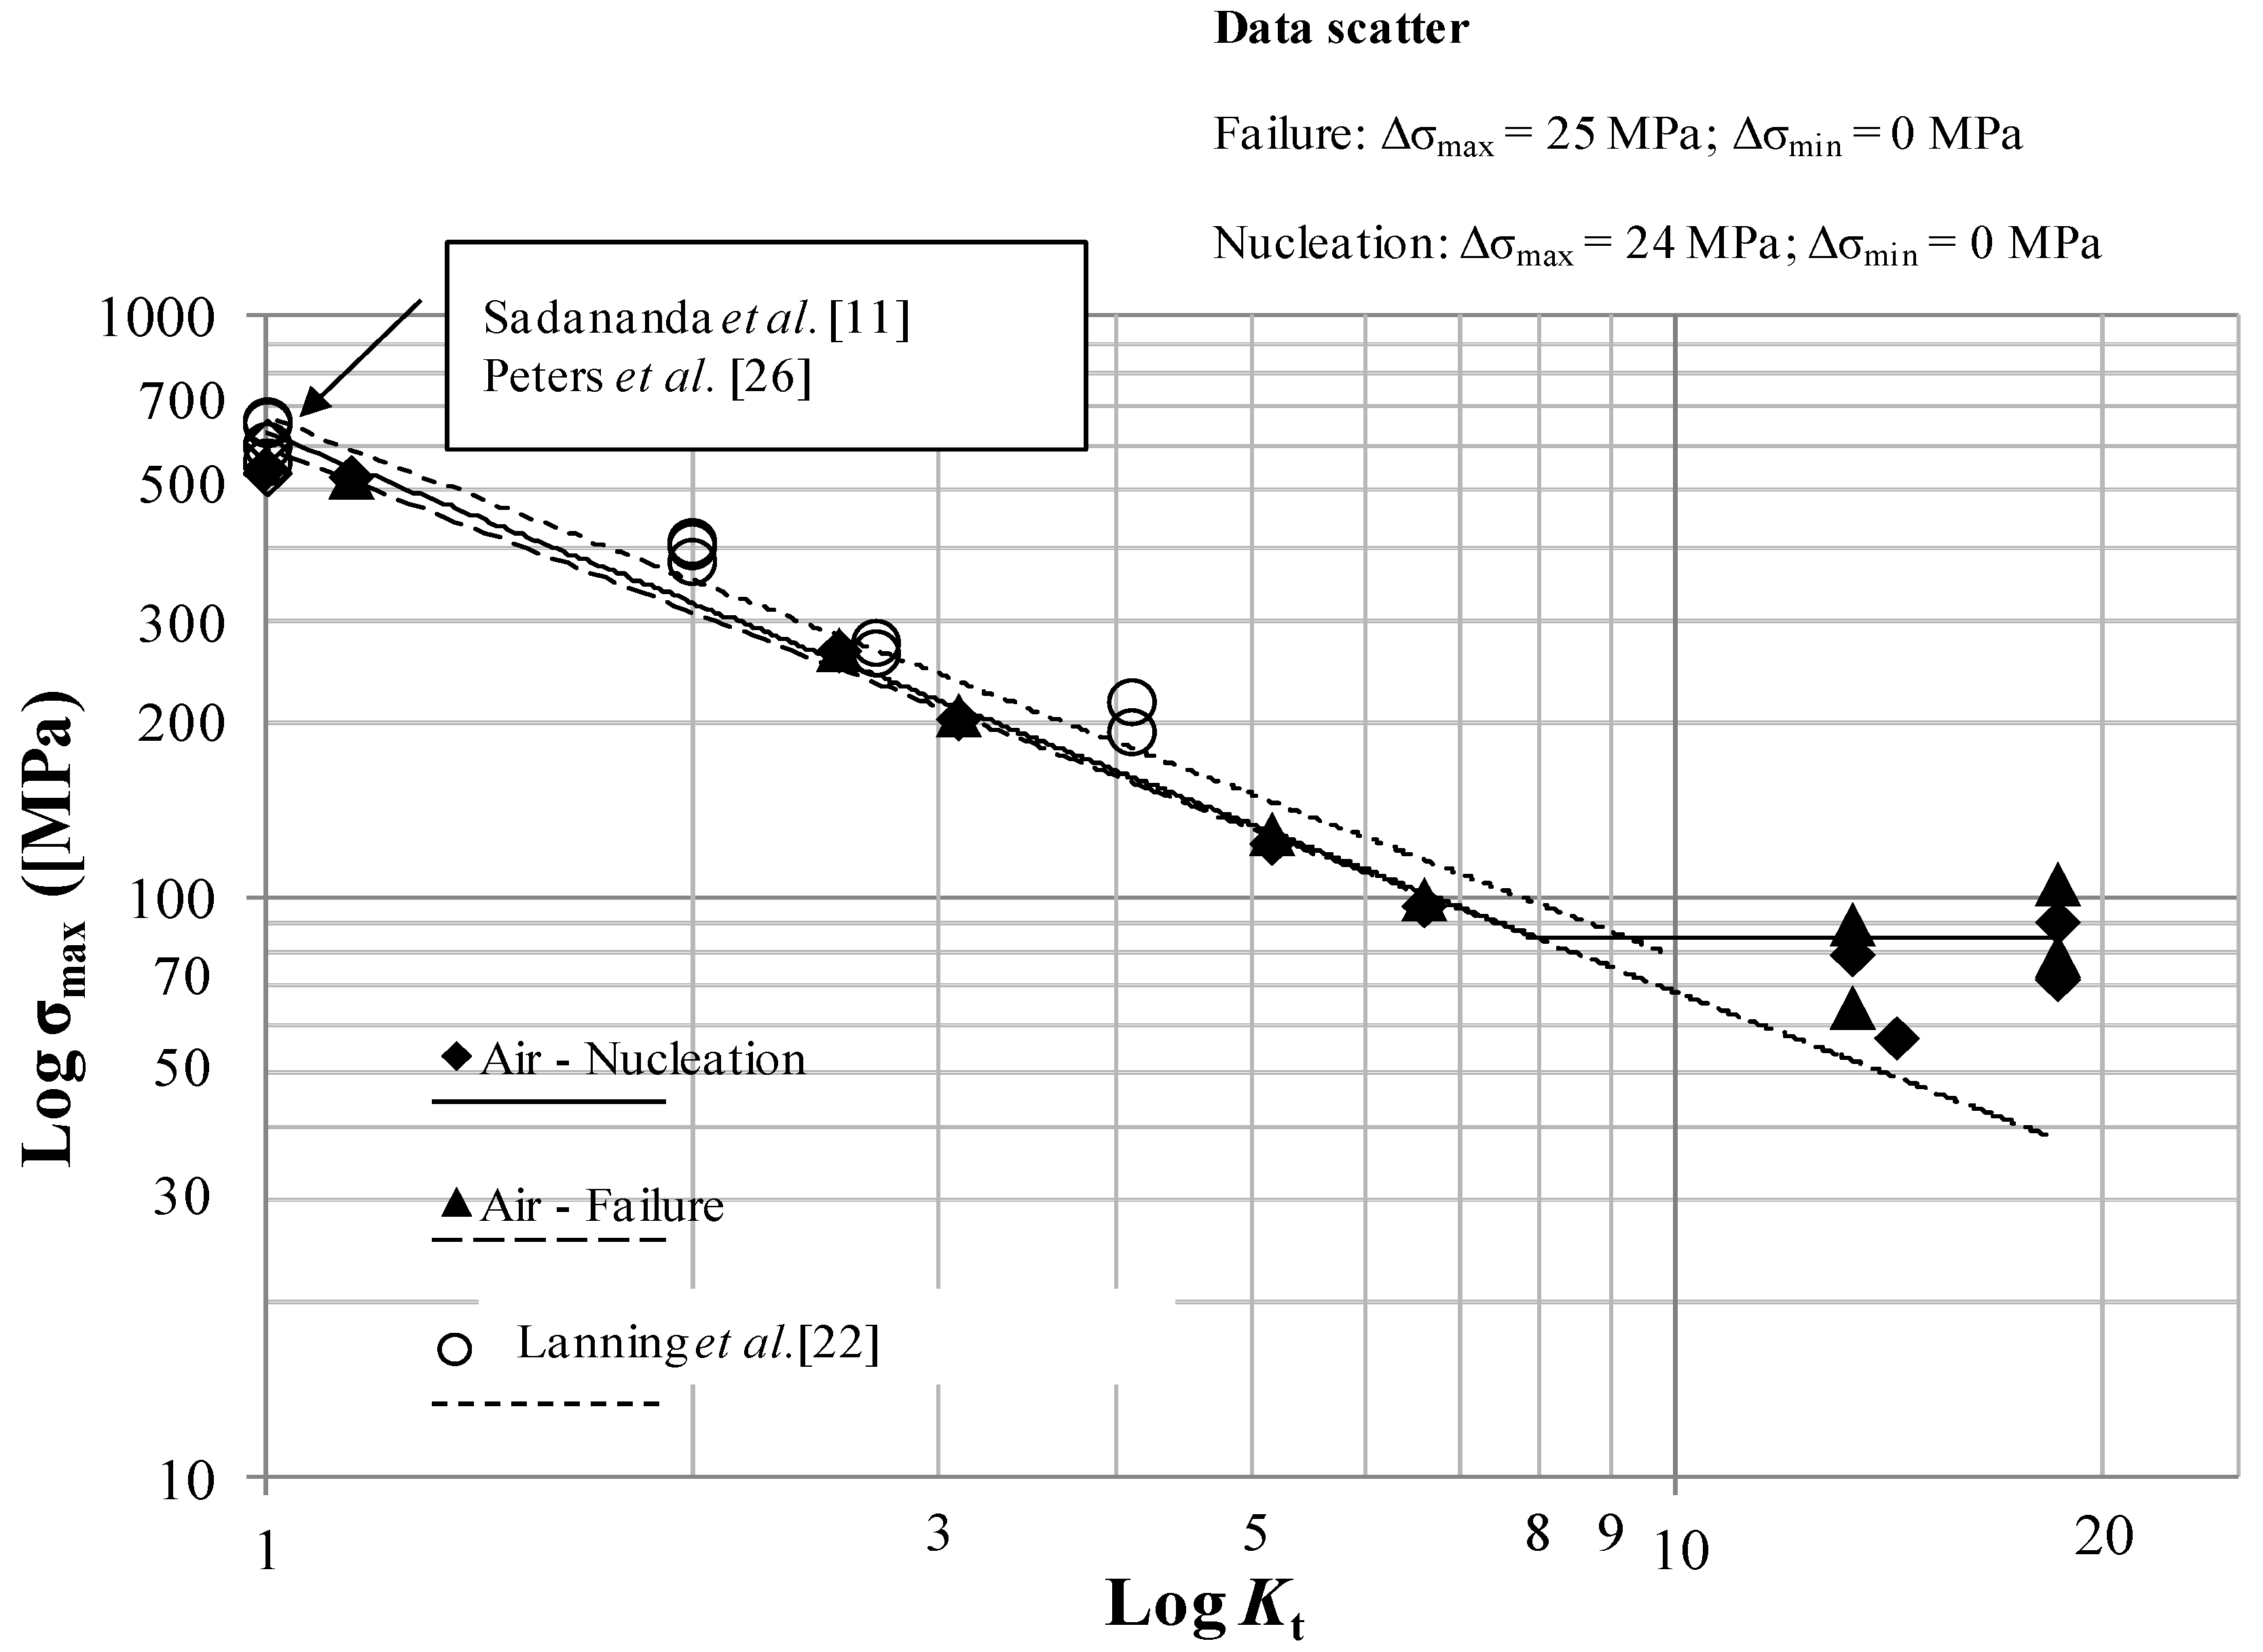
The interpolating lines in
Figure 11 (tests in air) have the following equations:
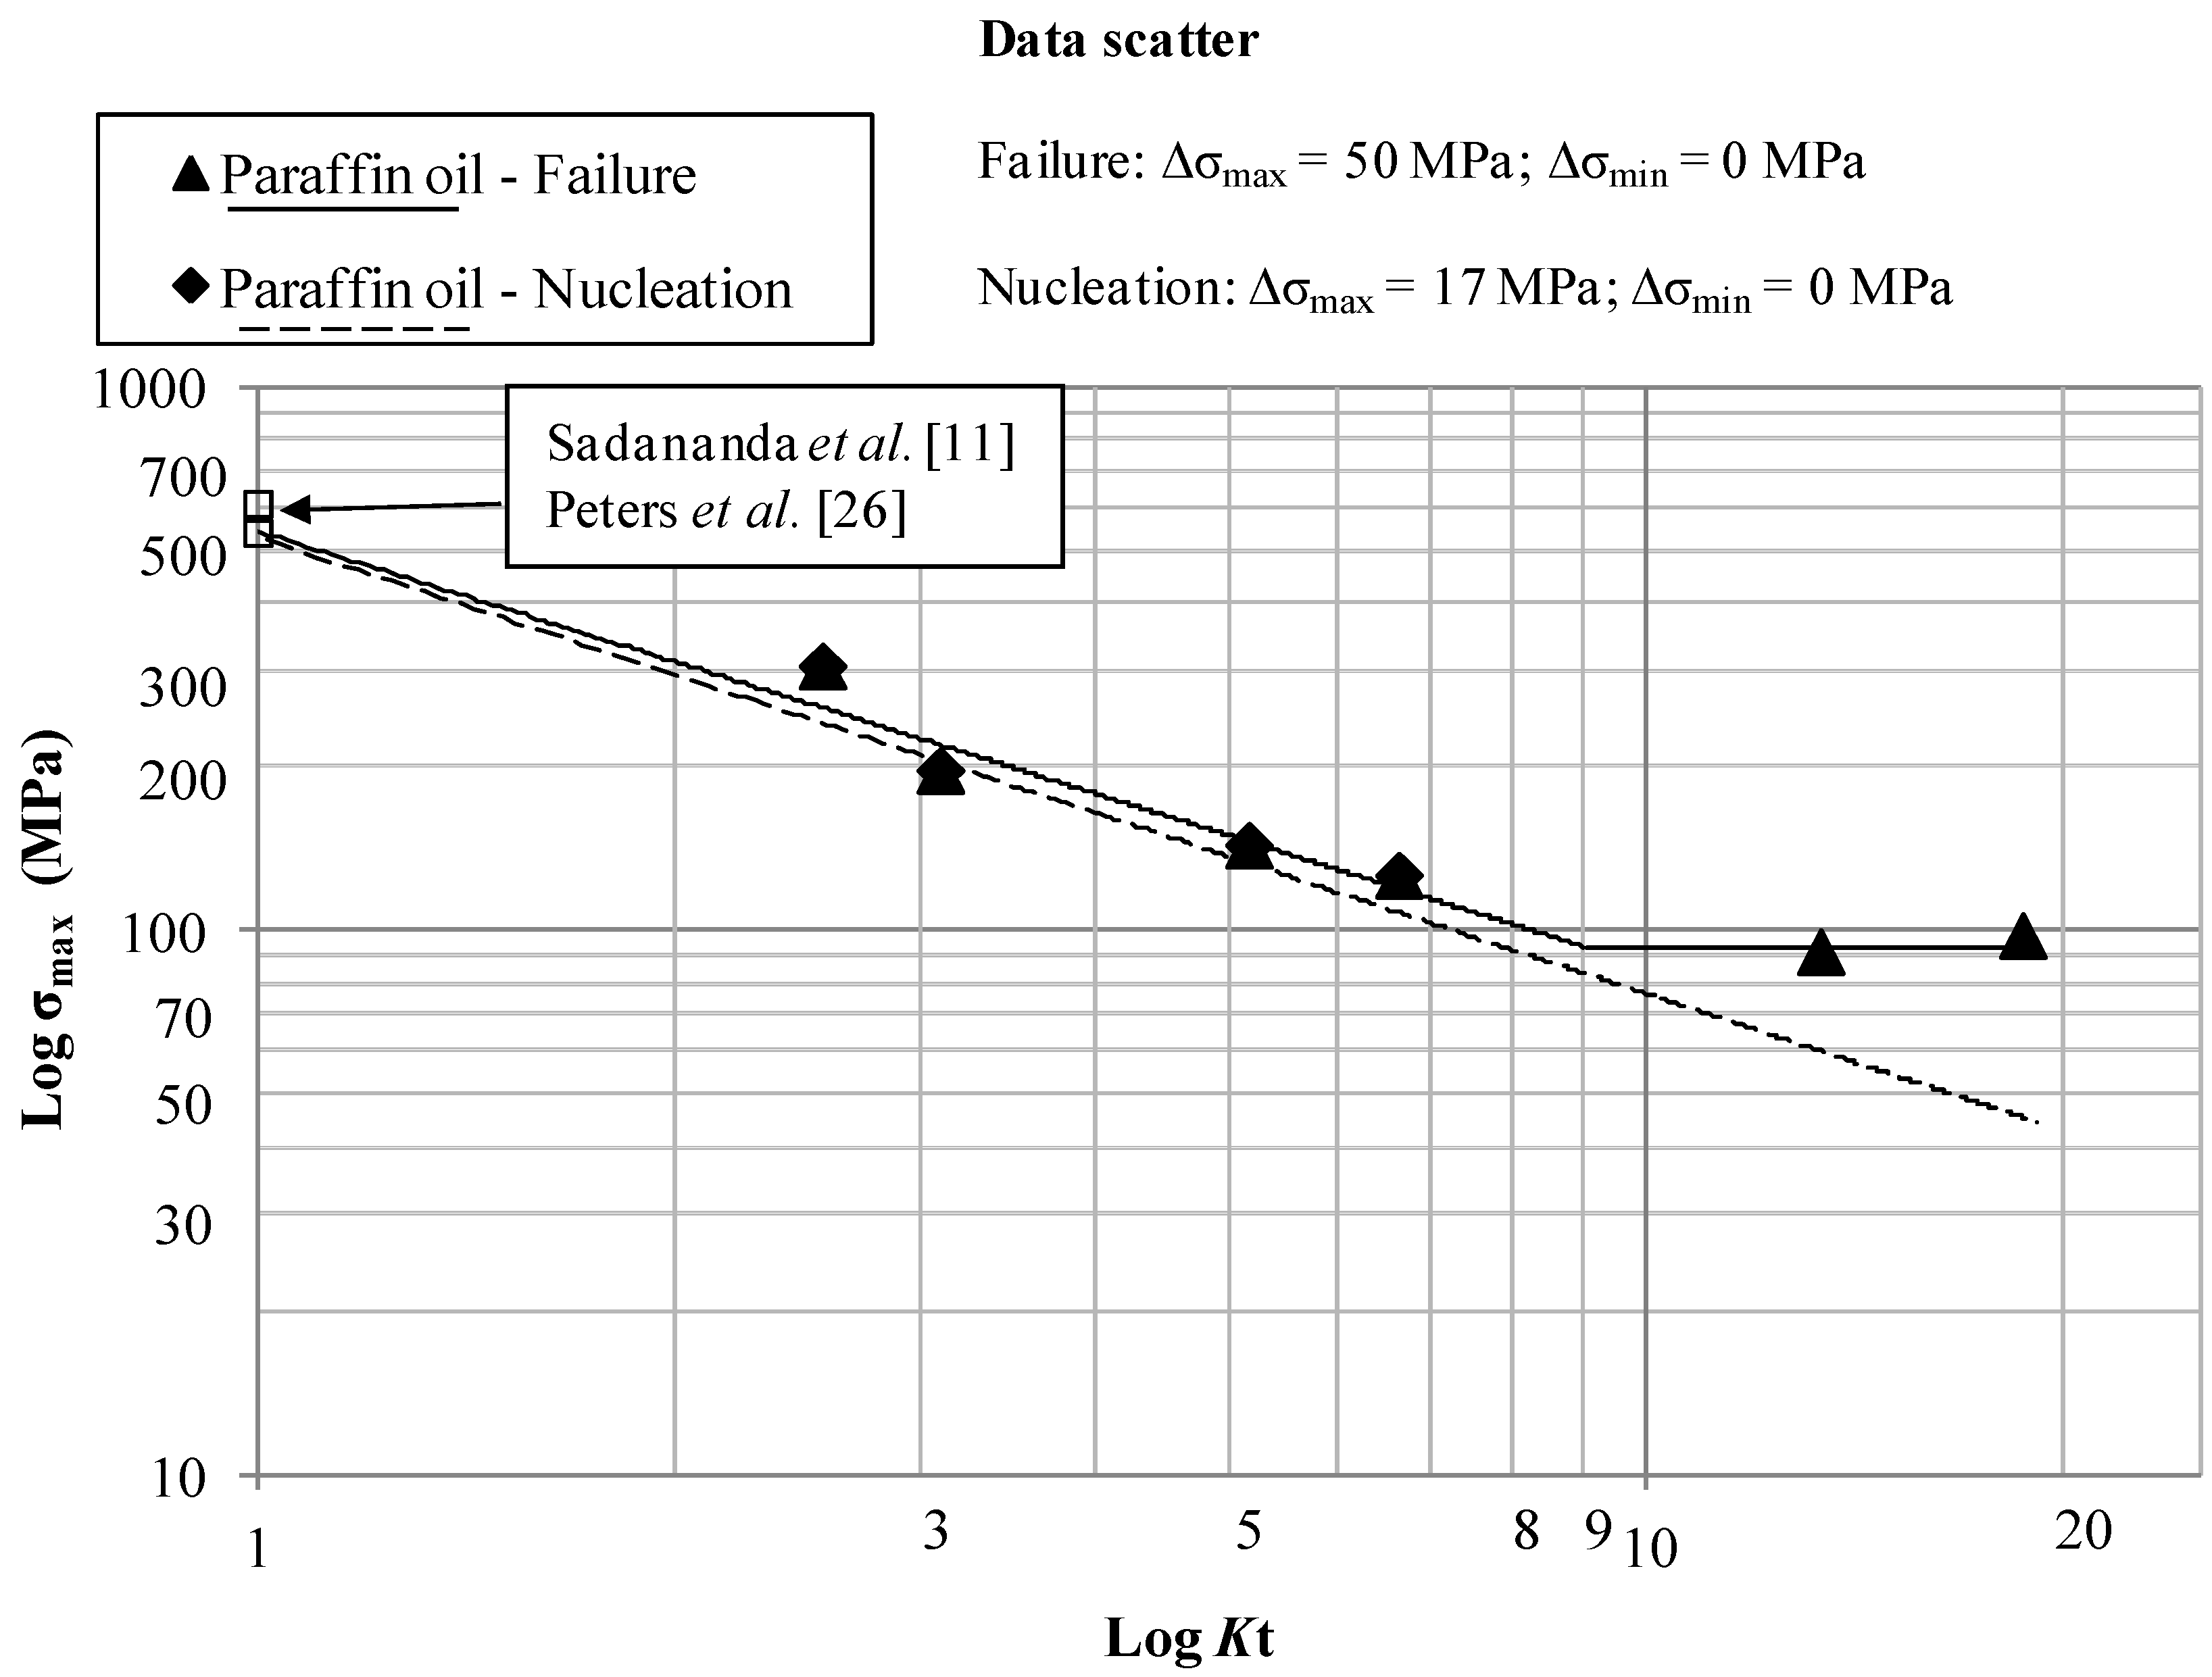
The interpolating lines in
Figure 12 (tests in Paraffin oil) have the following equations:
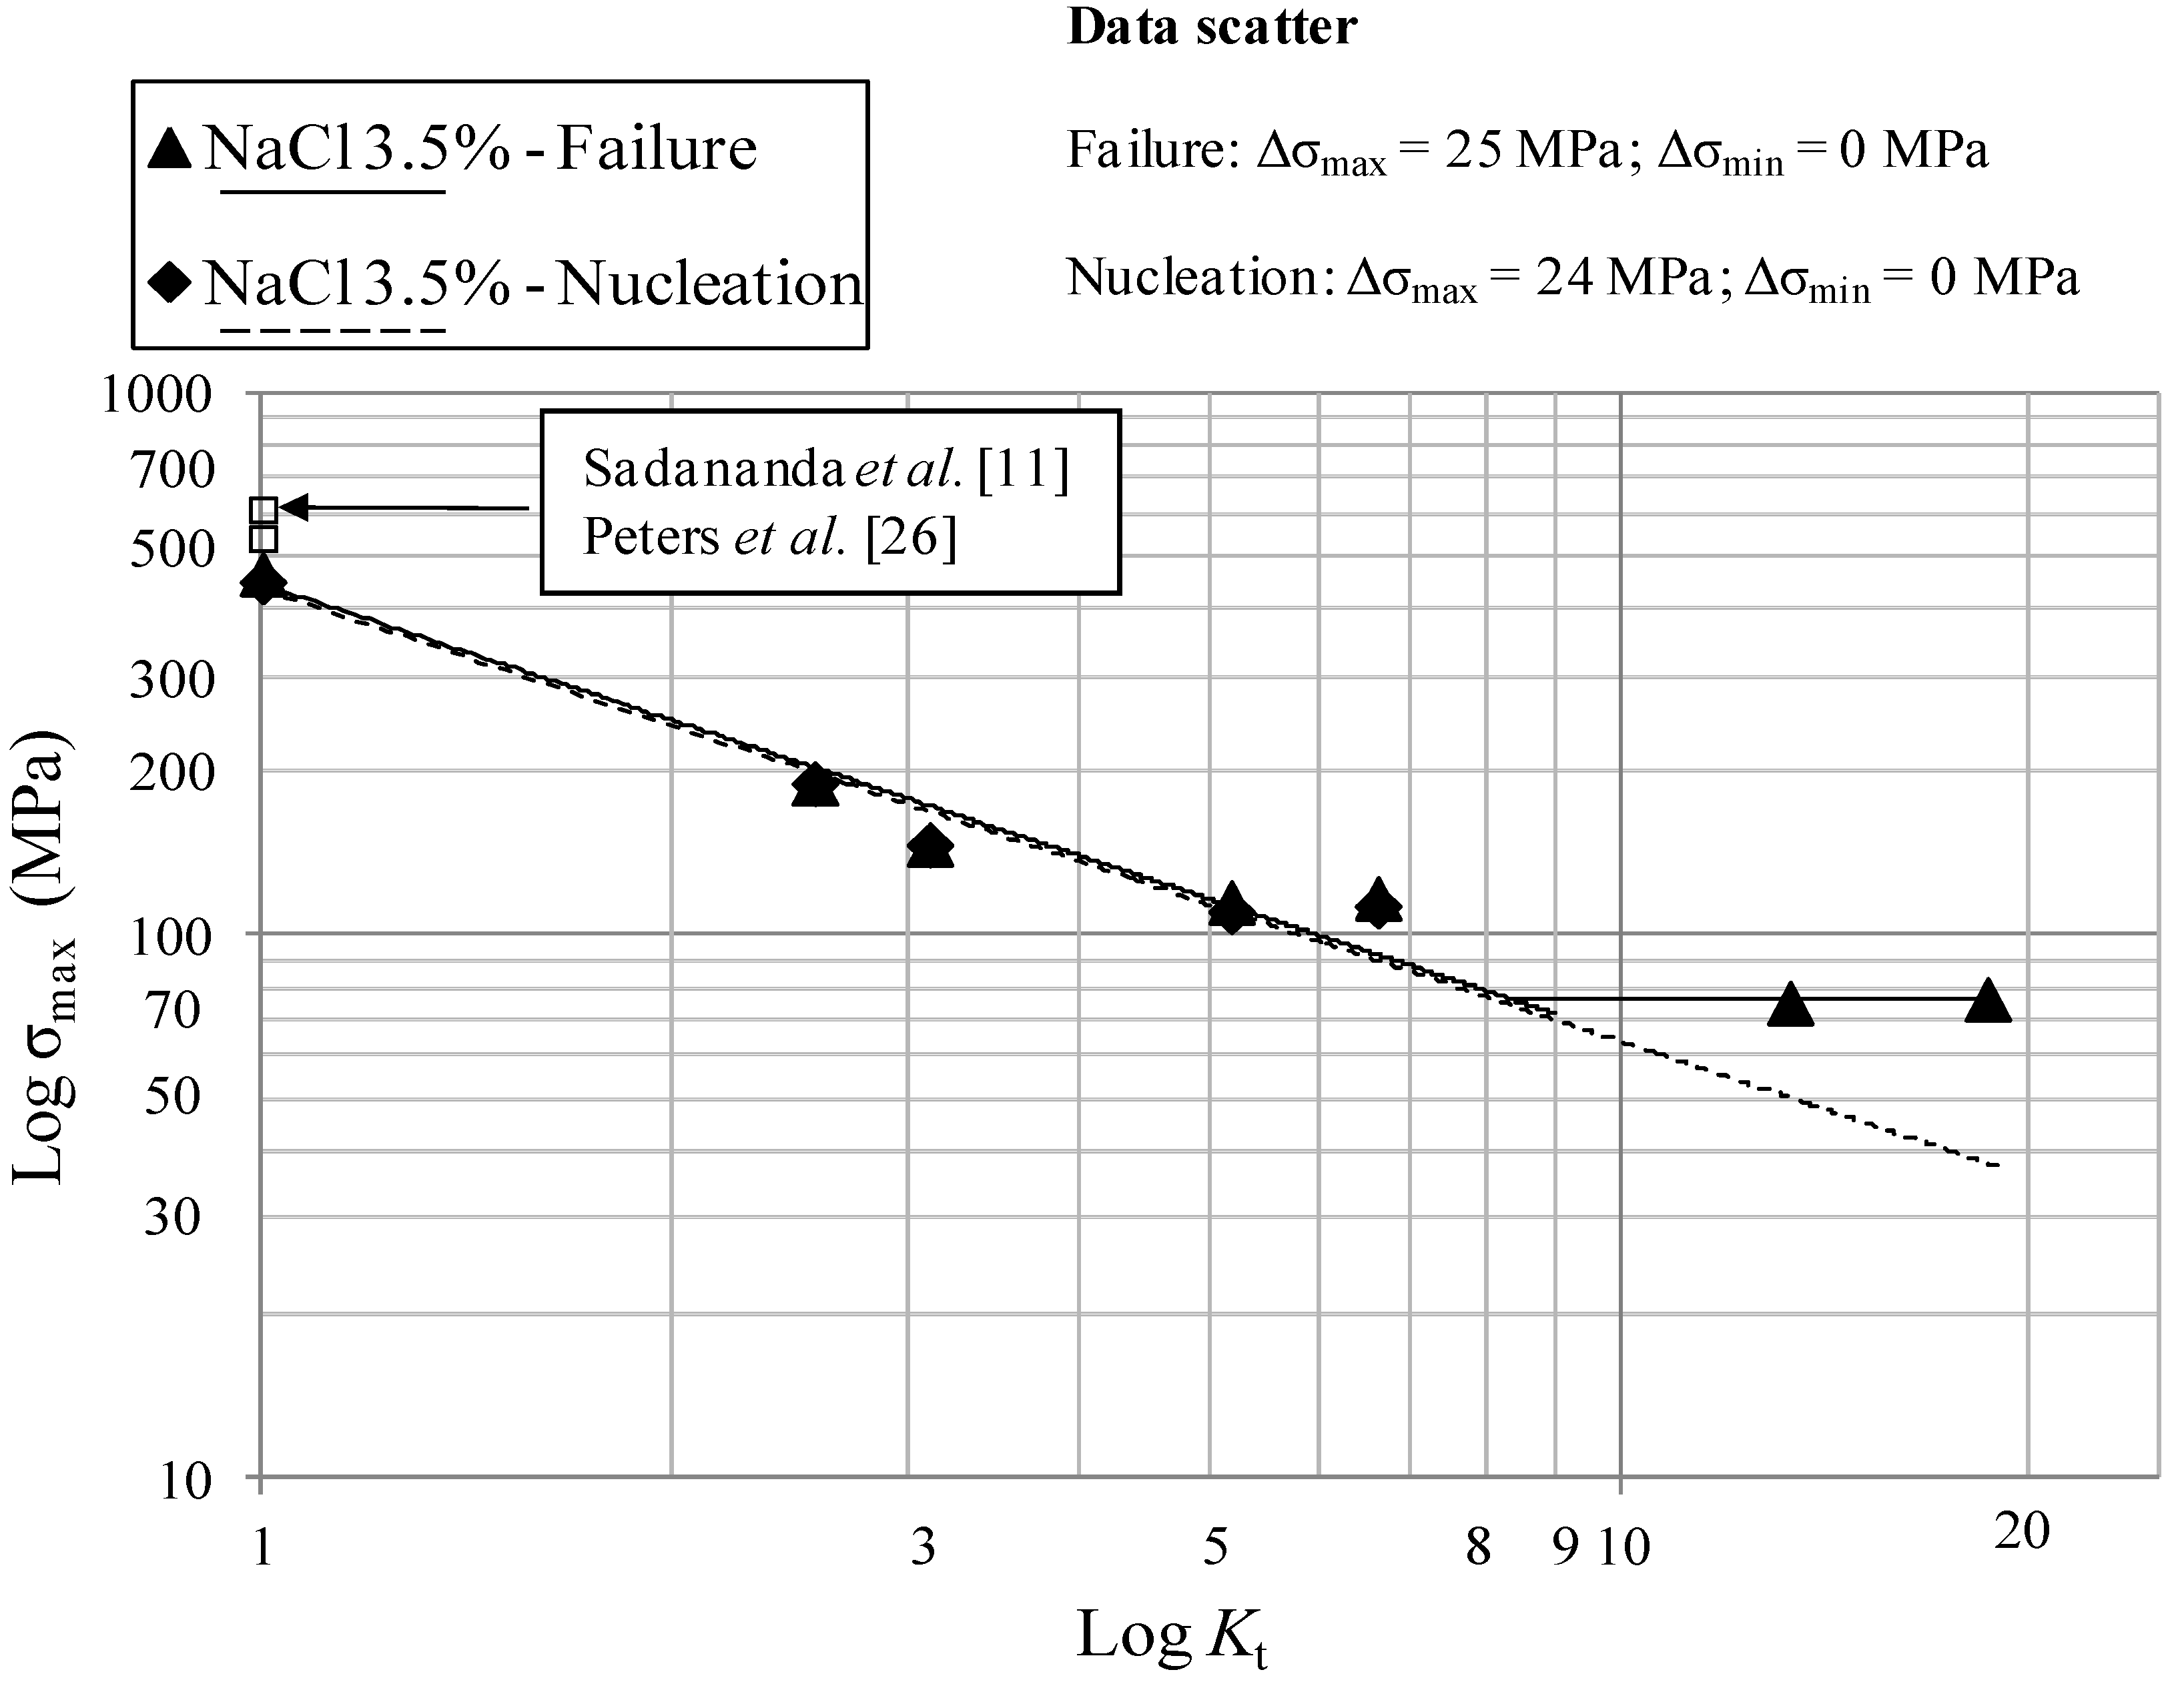
The interpolating lines in
Figure 13 (tests in NaCl 3.5 wt%) have the following equations:
The limit stresses in air and paraffin oil, shown in
Figure 11 and
Figure 12, are nearly the same, thus confirming that laboratory air and the inert paraffin oil environment exert the same damaging effect. Beeswax was used too in order to simulate the inert environment but the results were the same as the ones obtained in air and paraffin oil. The percentage of reduction of the fatigue maximum stress in 3.5% NaCl solution is approximately 20% with respect to air and paraffin oil, thus indicating a shift of the curves towards lower stresses in case of tests in 3.5% NaCl solution.
There is a good agreement between the literature values of the limiting maximum stresses at
Kt = 1 (Sadananda
et al. [
11], Peters
et al. [
23]) as shown in
Figure 11 and
Figure 12.
Figure 11.
Log-limiting maximum stress (R = 0.1, 10 Hz) at initiation and failure vs. Log-Kt at a constant life of 200,000 cycles for the samples tested in air.
Figure 11.
Log-limiting maximum stress (R = 0.1, 10 Hz) at initiation and failure vs. Log-Kt at a constant life of 200,000 cycles for the samples tested in air.
Figure 12.
Log-limiting maximum stress (R = 0.1, 10 Hz) at initiation and failure vs. Log-Kt at a constant life of 200,000 cycles for the samples tested in Paraffin oil.
Figure 12.
Log-limiting maximum stress (R = 0.1, 10 Hz) at initiation and failure vs. Log-Kt at a constant life of 200,000 cycles for the samples tested in Paraffin oil.
Figure 13.
Log-limiting maximum stress (R = 0.1, 10 Hz) at initiation and failure vs. Log-Kt at a constant life of 200,000 cycles for the samples tested in NaCl 3.5 wt%.
Figure 13.
Log-limiting maximum stress (R = 0.1, 10 Hz) at initiation and failure vs. Log-Kt at a constant life of 200,000 cycles for the samples tested in NaCl 3.5 wt%.
Log-Log plots show a bilinear behavior in different environments and a threshold
Kt = 8–9 after which σ
max remains constant, regardless of
Kt. After the threshold
Kt there is a region of non-propagating cracks between crack initiation and crack failure, in accordance with the literature for other materials at lower
Kt [
24]. Referring to [
7], in which Frost and Dugdale fatigue tested flat mild steel smooth and notched specimens, a relatively low threshold
Kt equal to three was found. This Titanium alloy shows a different behavior both in inert, air and in corrosive environments. This means that, regardless of
Kt, if
Kt is higher that 8–9, σ
max remains constant for a notched component and the environment does not have a great influence on the fatigue resistance. This seems to be a relative important result in case of the aeronautical Ti-6Al-4V components that work in aggressive environments like a 3.5% NaCl solution. The non-propagating cracks curve and the almost triangular area after bifurcation of the curve after the
Kt = 3, clearly visible in
Figure 10 and obtained for a mild steel, is equal to 8–9 in
Figure 11,
Figure 12 and
Figure 13 for Ti-6Al-4V. Furthermore, crack nucleation and complete failure curves are very close for Ti-6Al-4V. The Titanium alloy exerts a much higher crack propagation rate [
24] with respect to mild steel, for all the
Kt and test environment considered in the present paper. This means that after nucleation the crack rapidly propagates until complete fracture of the specimens. Moreover, crack growth rates in 3.5% NaCl solution proved to be higher than they were in air at all the
Kt investigated [
24].
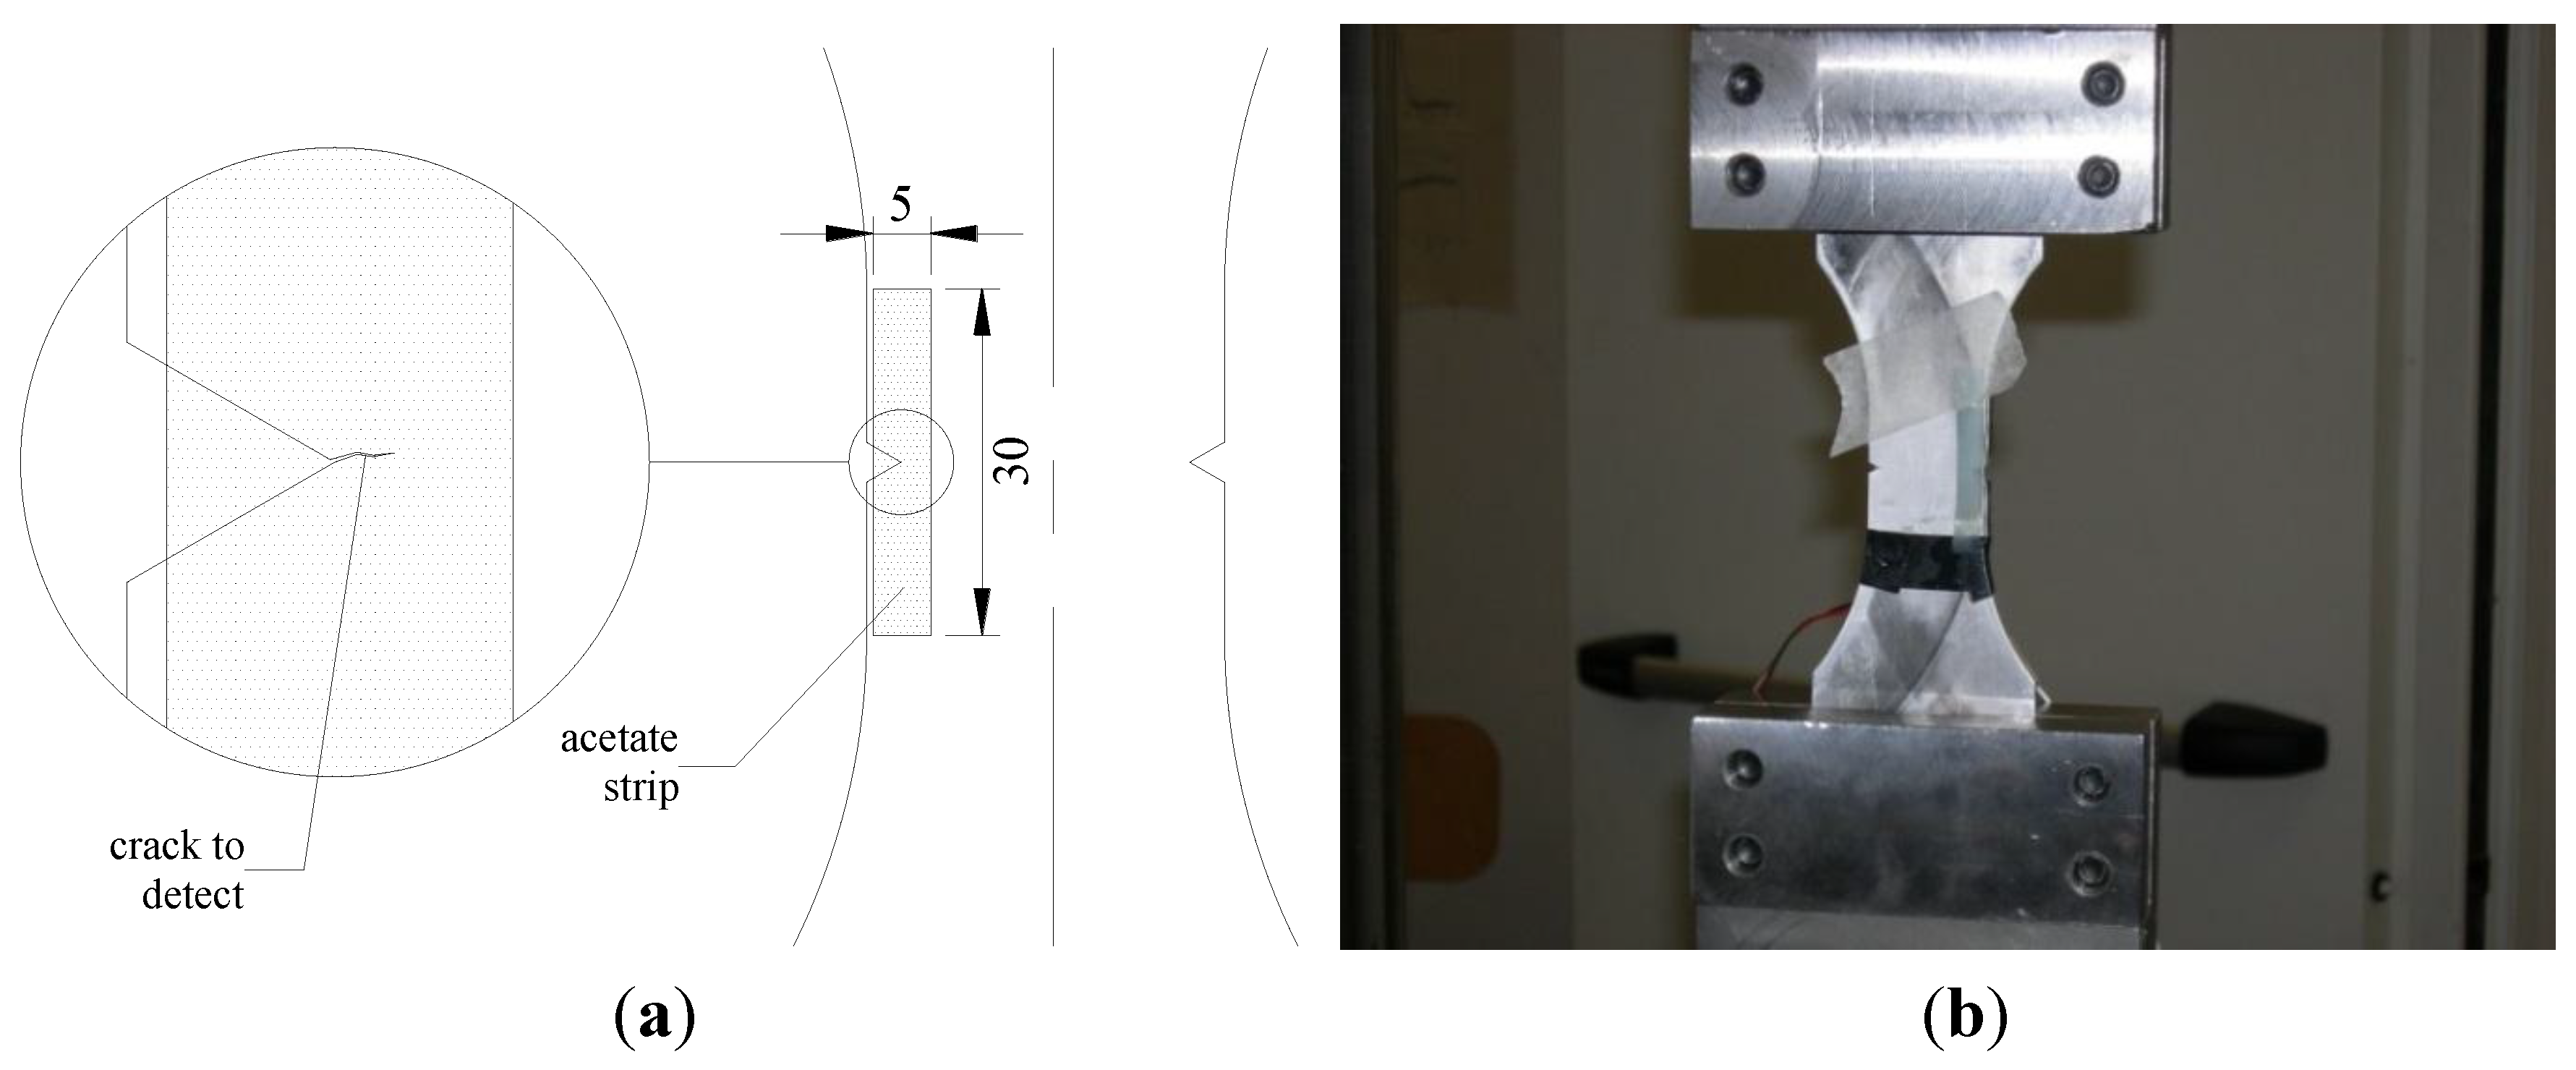
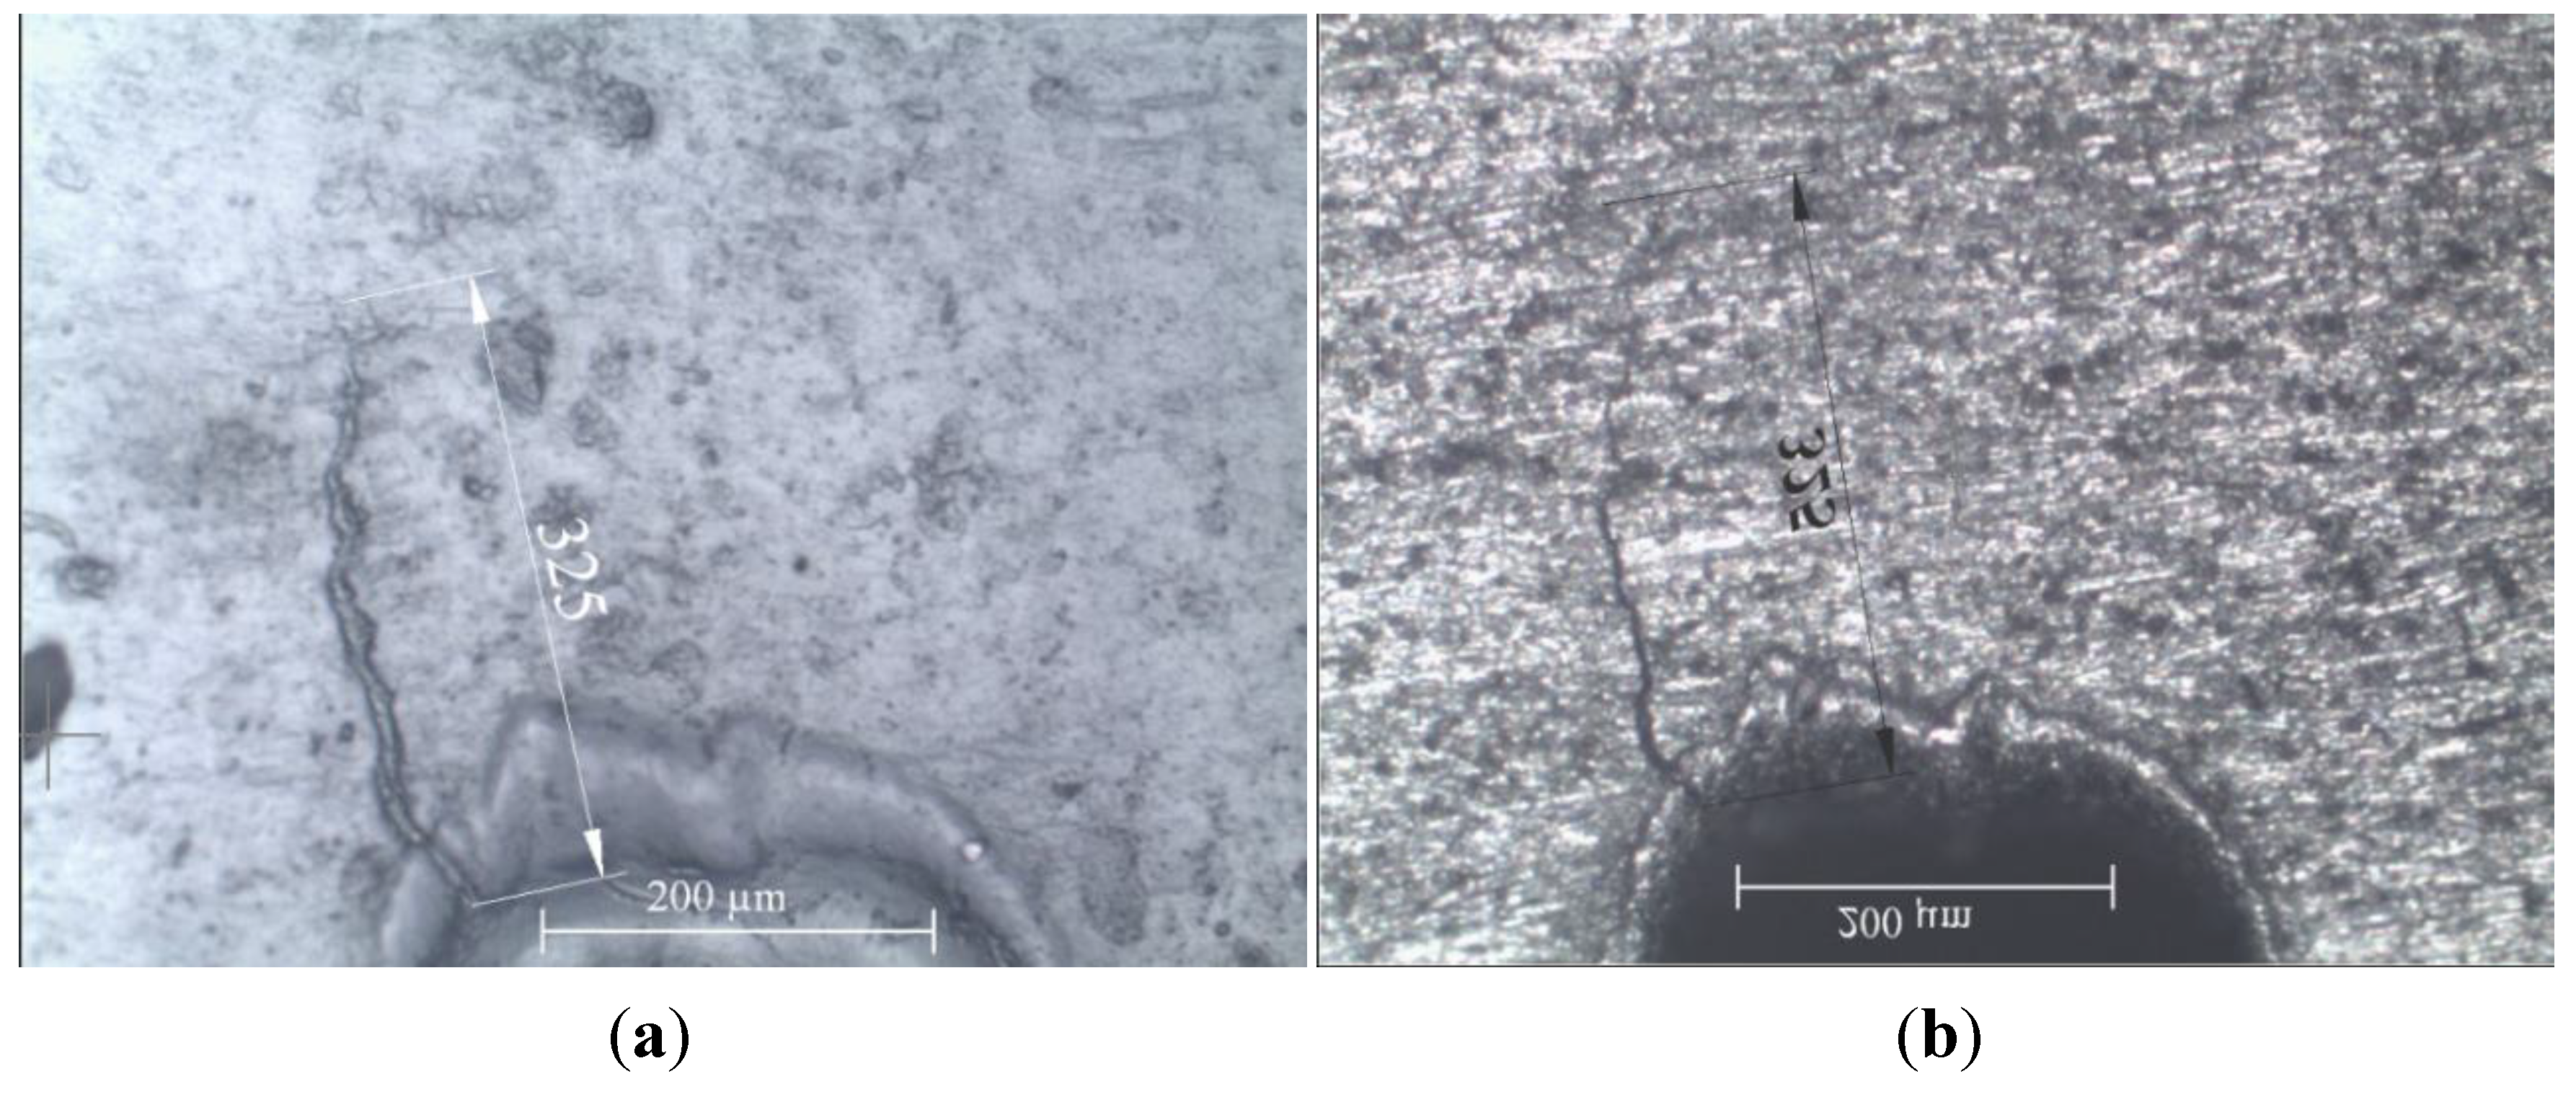
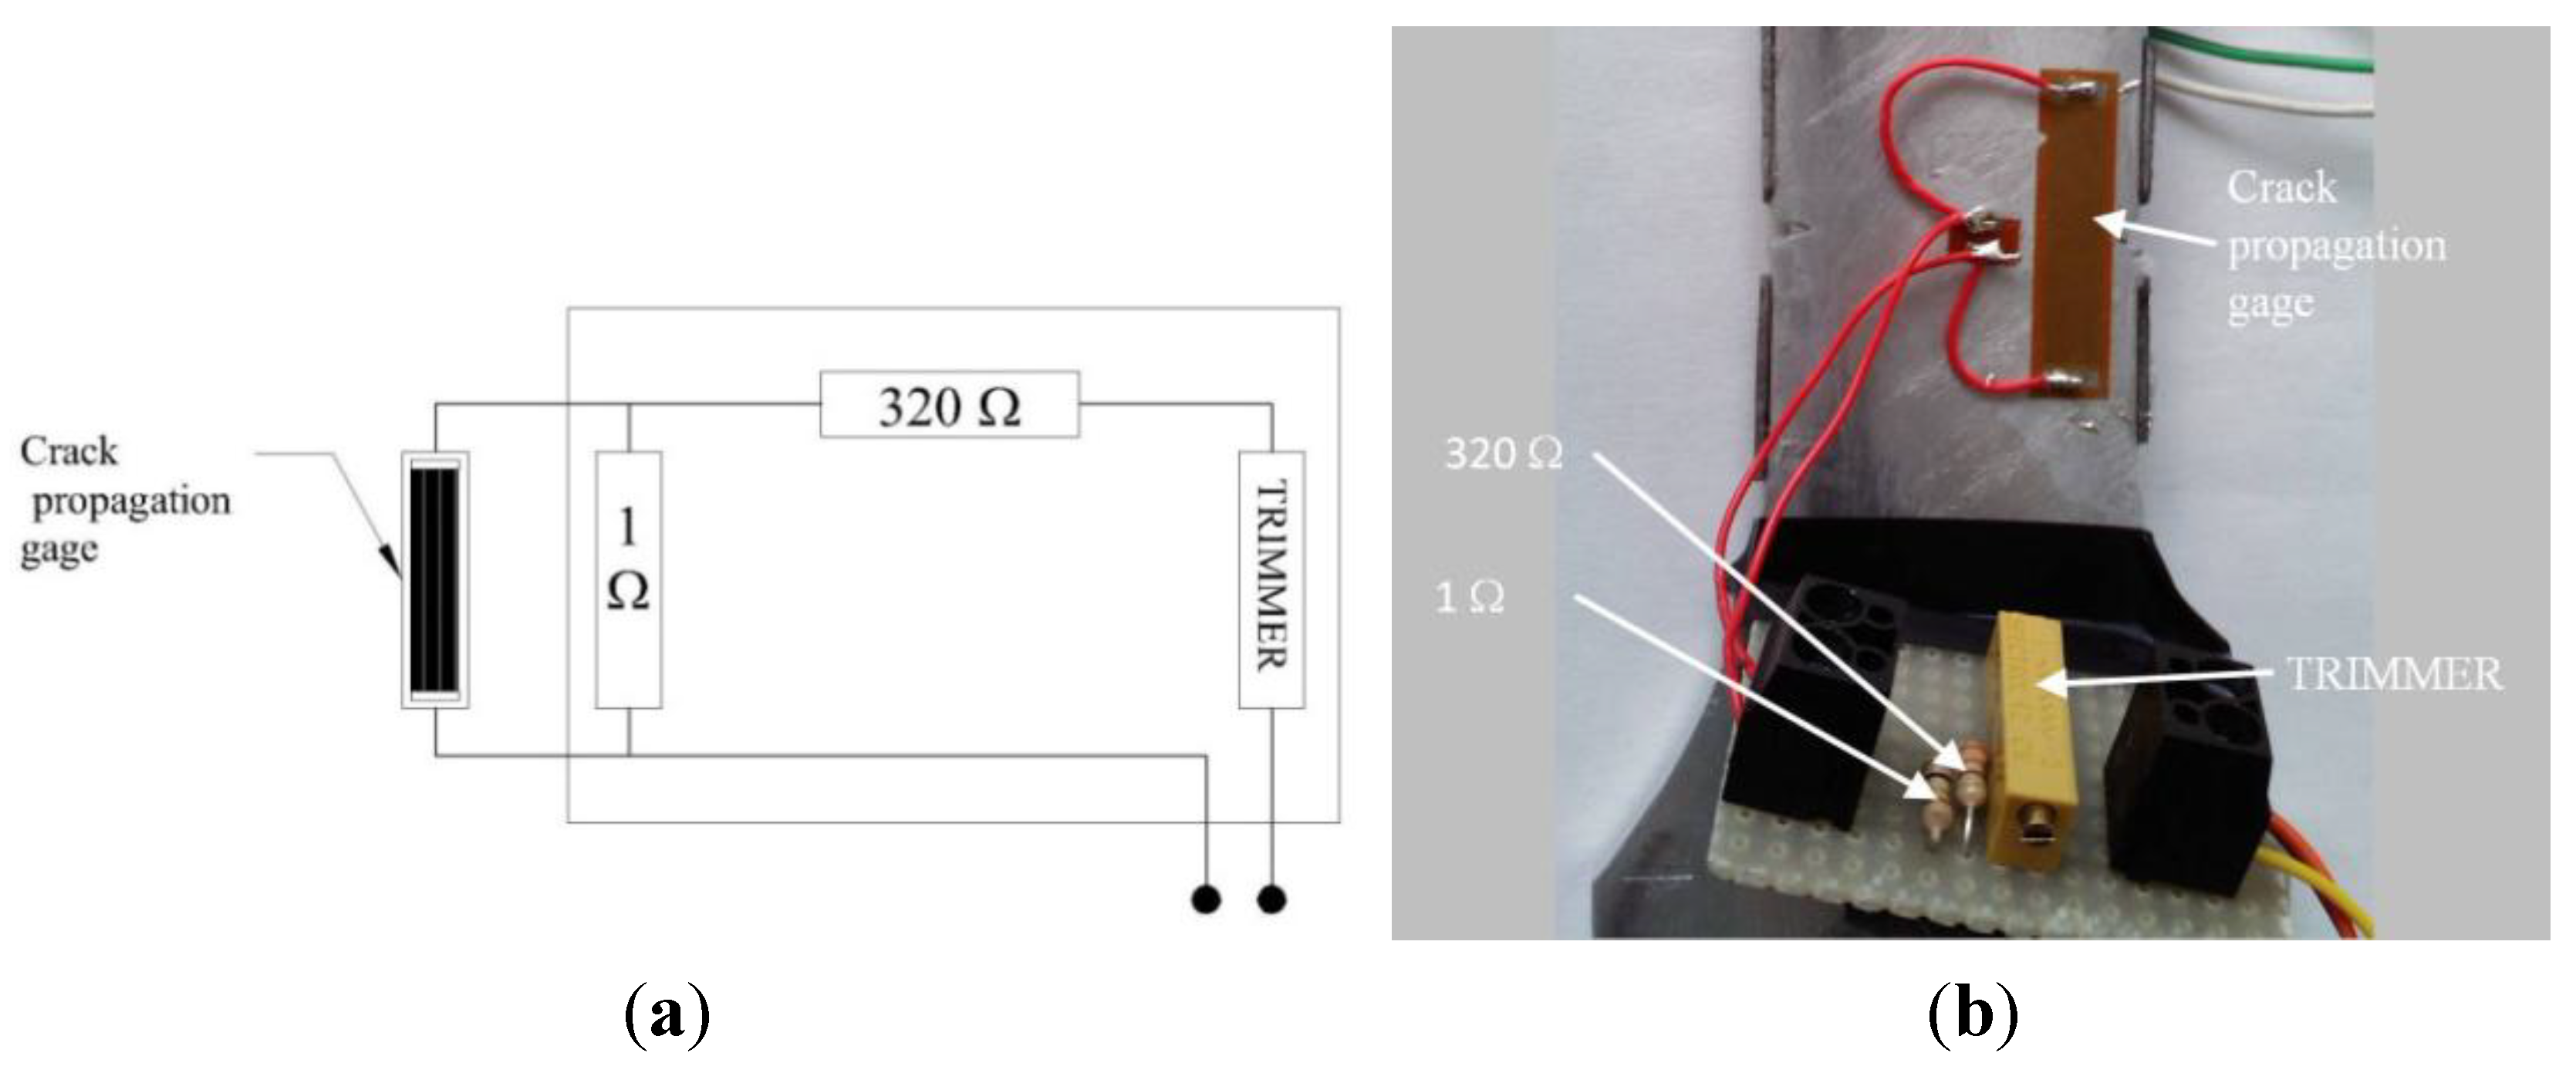
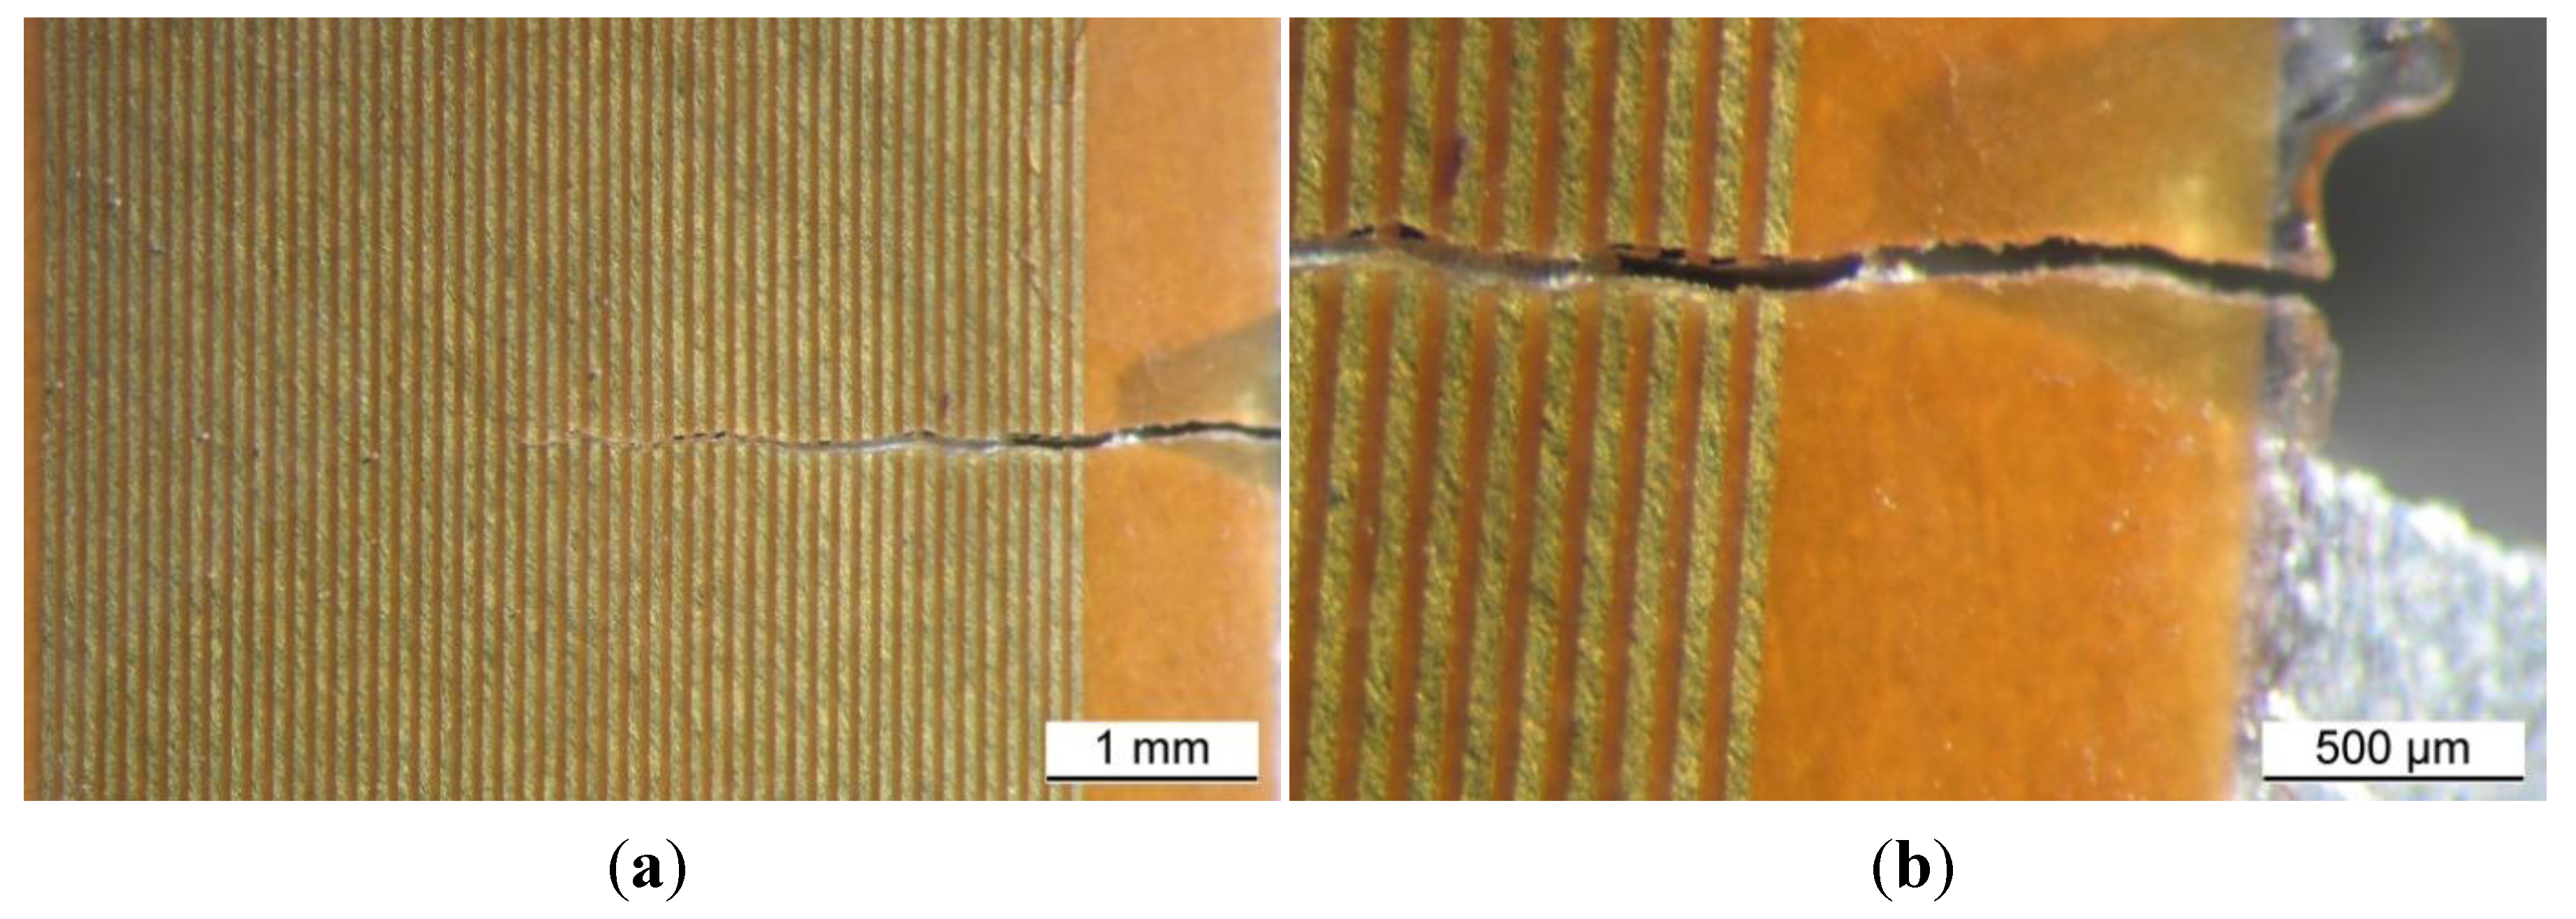
Due to the high notch sensitivity of the material and to the rather high crack propagation rate, it was quite difficult to more accurately detect crack initiation by using the replica method and crack propagation gages. Nucleation is mainly controlled by the maximum stress at the notch tip: the time for nucleation is the same if the maximum stress at the notch is the same. Fatigue crack propagation until failure depends on the stress gradient and on the applied load. The potential drop technique [
25] might prove to be useful to detect with a higher accuracy crack initiation and better describe what happens after the threshold
Kt.
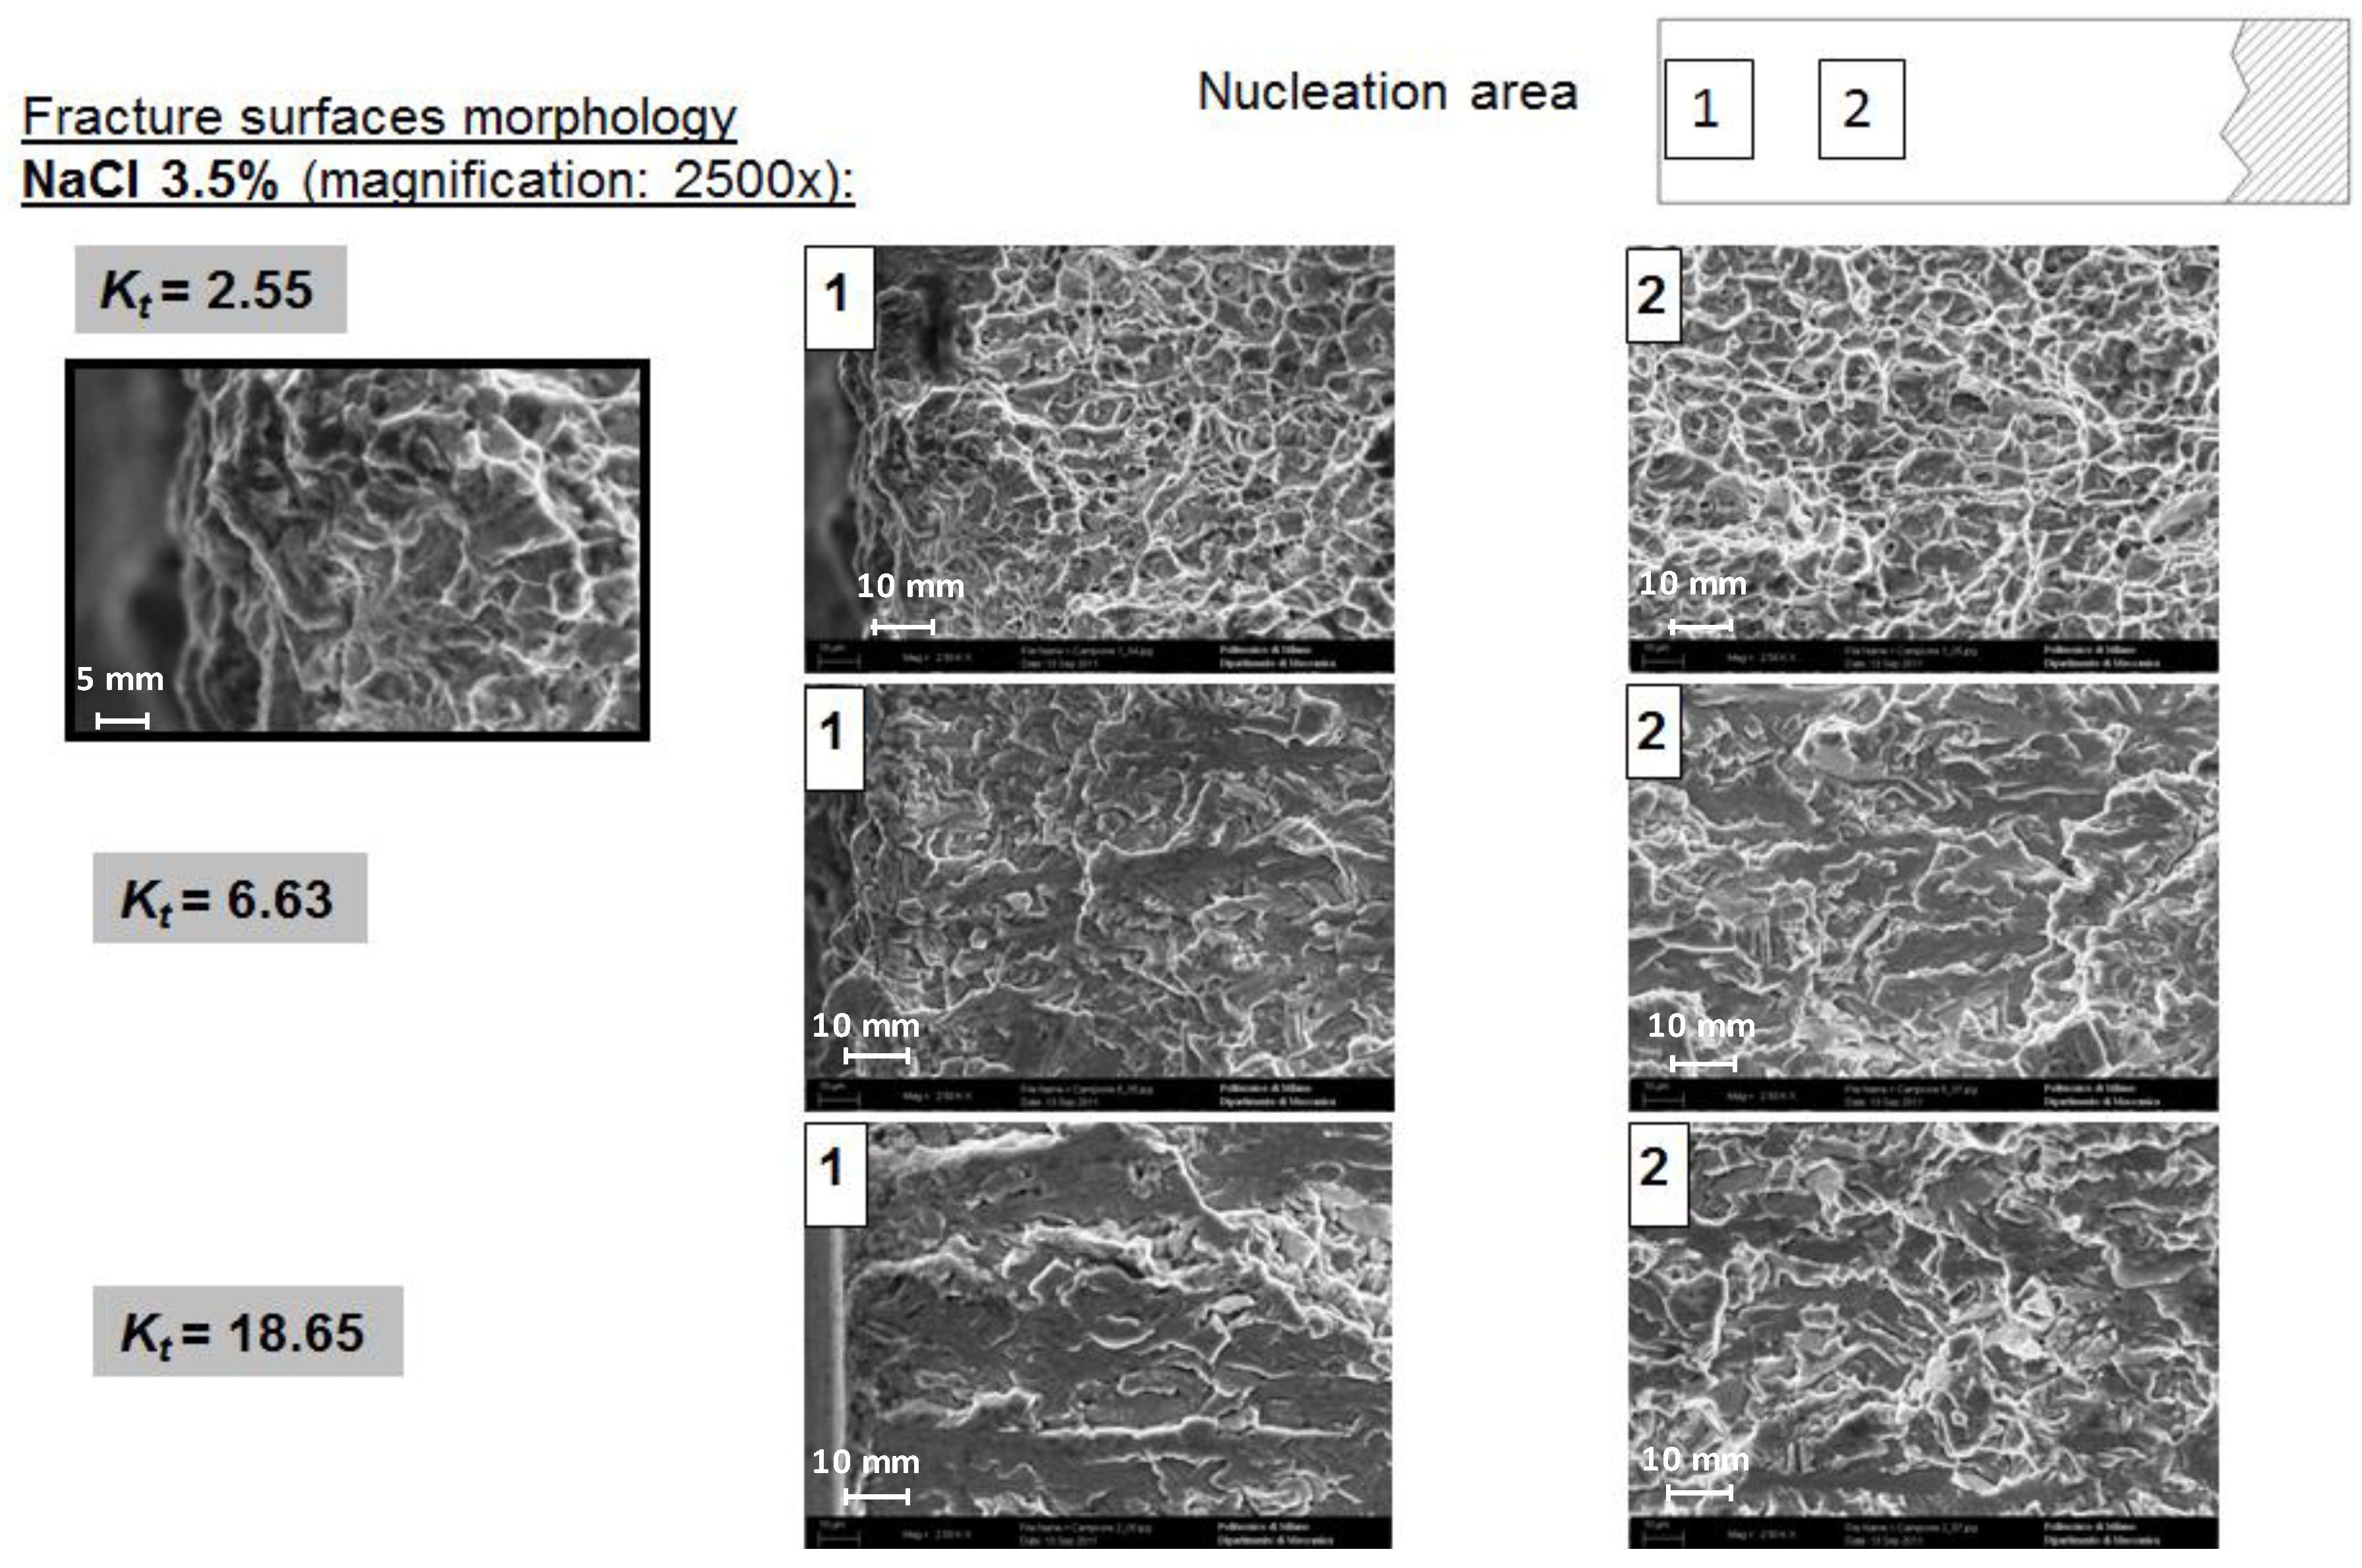
The SEM analyses highlighted different fracture surface features for different
Kt in 3.5 wt% NaCl solution (
Figure 14). Between the two points (1 and 2) of the fracture surfaces there is no difference of morphology. As
Kt increases the fracture surface becomes smoother and less corrugated with no dimples. The explanation is that lower
Kt means higher applied loads in order to reach the stress for crack nucleation at the notch tip; on the other hand, because of the steep stress gradient, higher
Kt means lower applied loads in order to reach the stress for crack nucleation at the notch tip.
Figure 14.
Fracture surface morphology: effect of
Kt [
26].
Figure 14.
Fracture surface morphology: effect of
Kt [
26].
The observed behavior and the presence of the threshold
Kt is surely strongly dependent on a lot of parameters among which the most important might be cyclic frequency, microstructure and the notch depth. For very shallow notches the threshold
Kt shifts towards lower values of
Kt and the non-propagating domain starts at very low values of
Kt. After increasing the notch value beyond a critical value the non-propagating domain disappears completely. With shallow notches the plastic zone at the root of the notch is much larger with respect to deep notches. The plastic enclave that arises at the notch root of shallow notches would embed the nucleated cracks in this plastic shelter stopping their propagation. With deep notches nucleated cracks fast overcome the small plastic zone and become macro cracks [
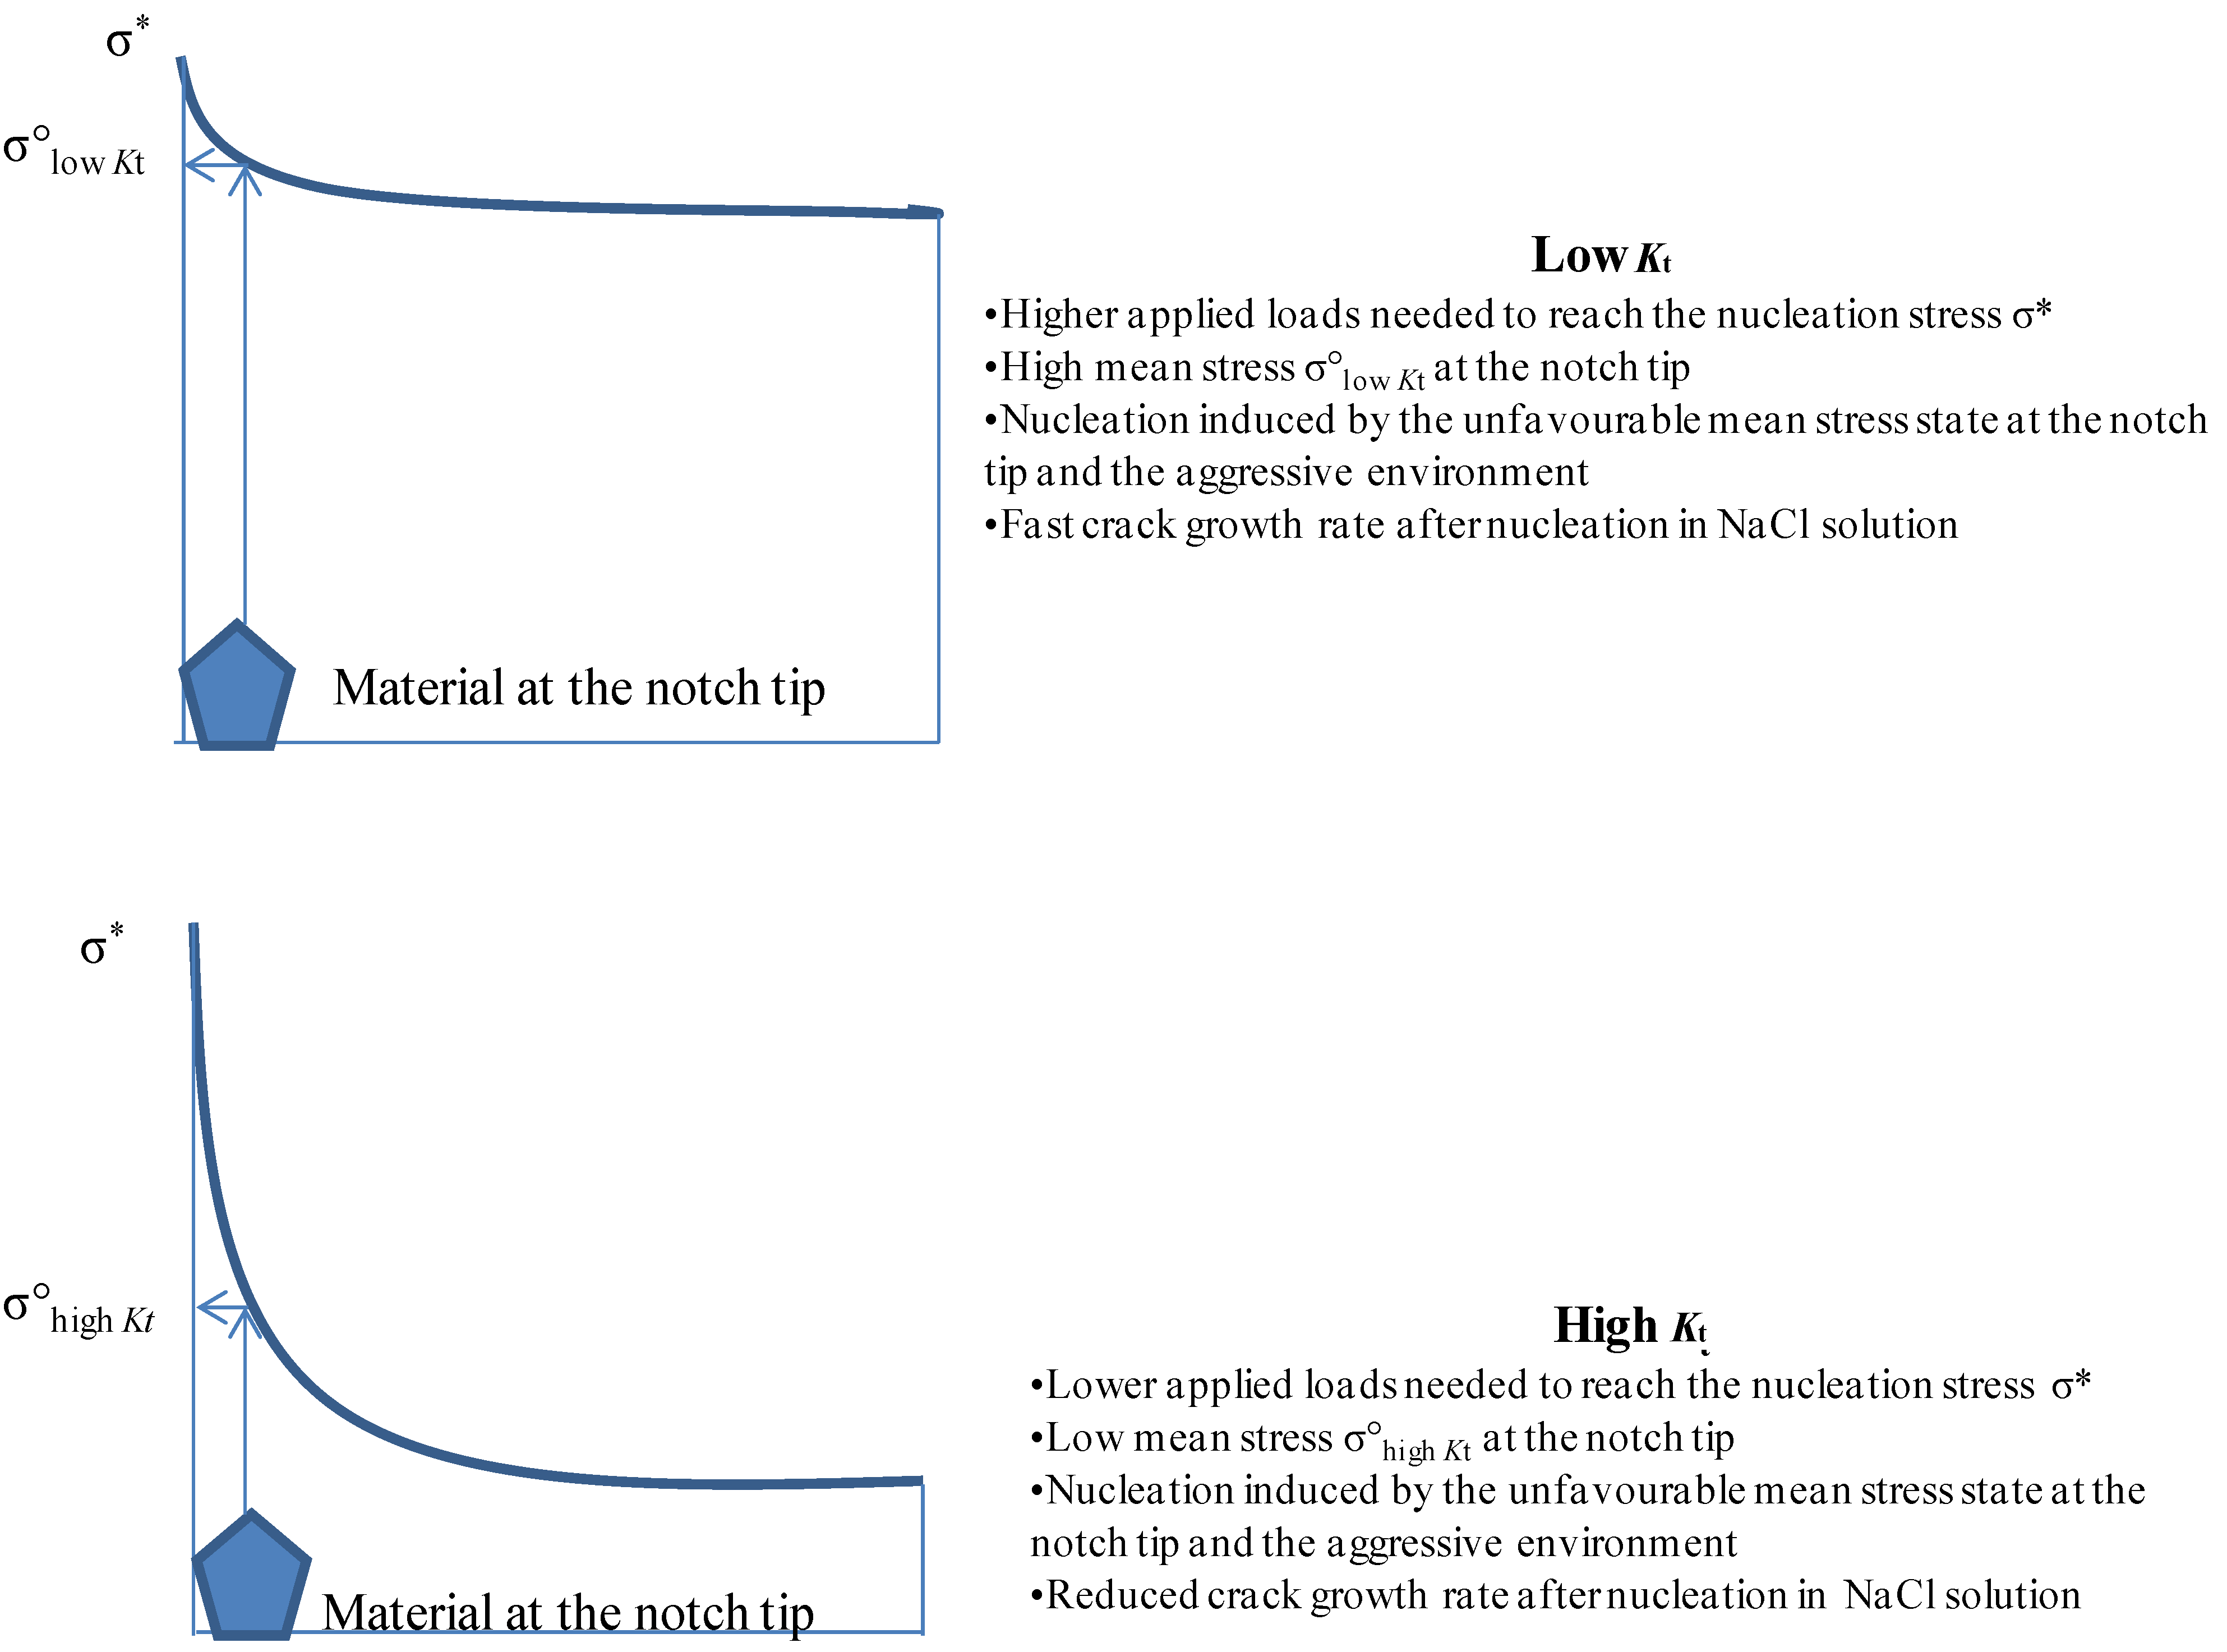
21]. The effect of the stress gradient is also shown in
Figure 15.
The driving forces for crack nucleation and propagation in notched components are respectively the maximum stress at the notch tip and the stress gradient ahead of the notch tip [
11]. Low
Kt and high
Kt need the same stress σ* for crack nucleation but different applied loads to have such stress at the notch tip. Furthermore, low
Kt means mild stress gradient and a high applied load needed to reach the nucleation stress σ* at the notch tip; on the other hand high
Kt means steep stress gradient and a low applied load needed to reach the same nucleation stress σ* at the notch tip. Moreover, the steep stress gradient at high
Kt reduces the mean stress at the notch tip (
Figure 15). The aggressive environment is another driving force for crack nucleation and, together with the stress gradient and maximum stress, has a big influence on the nucleation process of cracks. The driving force for crack propagation is the applied load: thus the applied stress far from the notch tip (crack tip after nucleation). Such stress is much higher in case of low
Kt, thus reducing the fatigue resistance with respect to higher
Kt specimens. An example of the different stress gradients at low and high
Kt, having the same maximum stress σ* at the notch tip, is shown in
Figure 15.
Figure 15.
Crack nucleation and propagation: stress gradient and environmental effects.
Figure 15.
Crack nucleation and propagation: stress gradient and environmental effects.
The results show that the influence of the aggressive environment is more evident at low
Kt because of the higher crack growth rate in NaCl solution and of the higher applied loads, needed to reach the nucleation stress at the notch tip, together with the stress gradient effect (higher mean loads at the tip of the notch as shown in
Figure 15).
Static tests are required to complete the research. Such tests would allow to decouple the environmental and stress effects and understand the corrosion fatigue mechanism in terms of chemical and mechanical driving forces.


