
Development of a Hopkinson Bar Apparatus for Testing Soft Materials: Application to a Closed-Cell Aluminum Foam


Abstract
:1. Introduction
2. Modified Hopkinson Pressure Bar for Soft Materials (MHPB-SM)
- Low signal amplitude to noise ratio. This phenomenon is essentially due to the low strength of tested material compared with the sensitivity of the equipment bars. This aspect substantially decreases the accuracy of the data obtained with Hopkinson bar techniques.
- If solid steel bars are employed, the strong impedance mismatch between specimen and equipment bar makes sometimes difficult to interpret the experimental data concerning this type of test.
- The use of plastic bars in SHPB to obtain stronger strain signals inevitably introduces other problems (marked wave dispersion due to high internal damping and non-linear elastic behavior, etc.) that dramatically increase the complexity of data processing [16].
- It is normally difficult to examine the whole stress-strain curve of this kind of materials because of their high compliance compared with the small displacement capability of standard Hopkinson bars.
- The specimen sizes imposed by Hopkinson techniques constraints (compared with the foam cells dimensions) are usually too small to have a fully representative material volume.
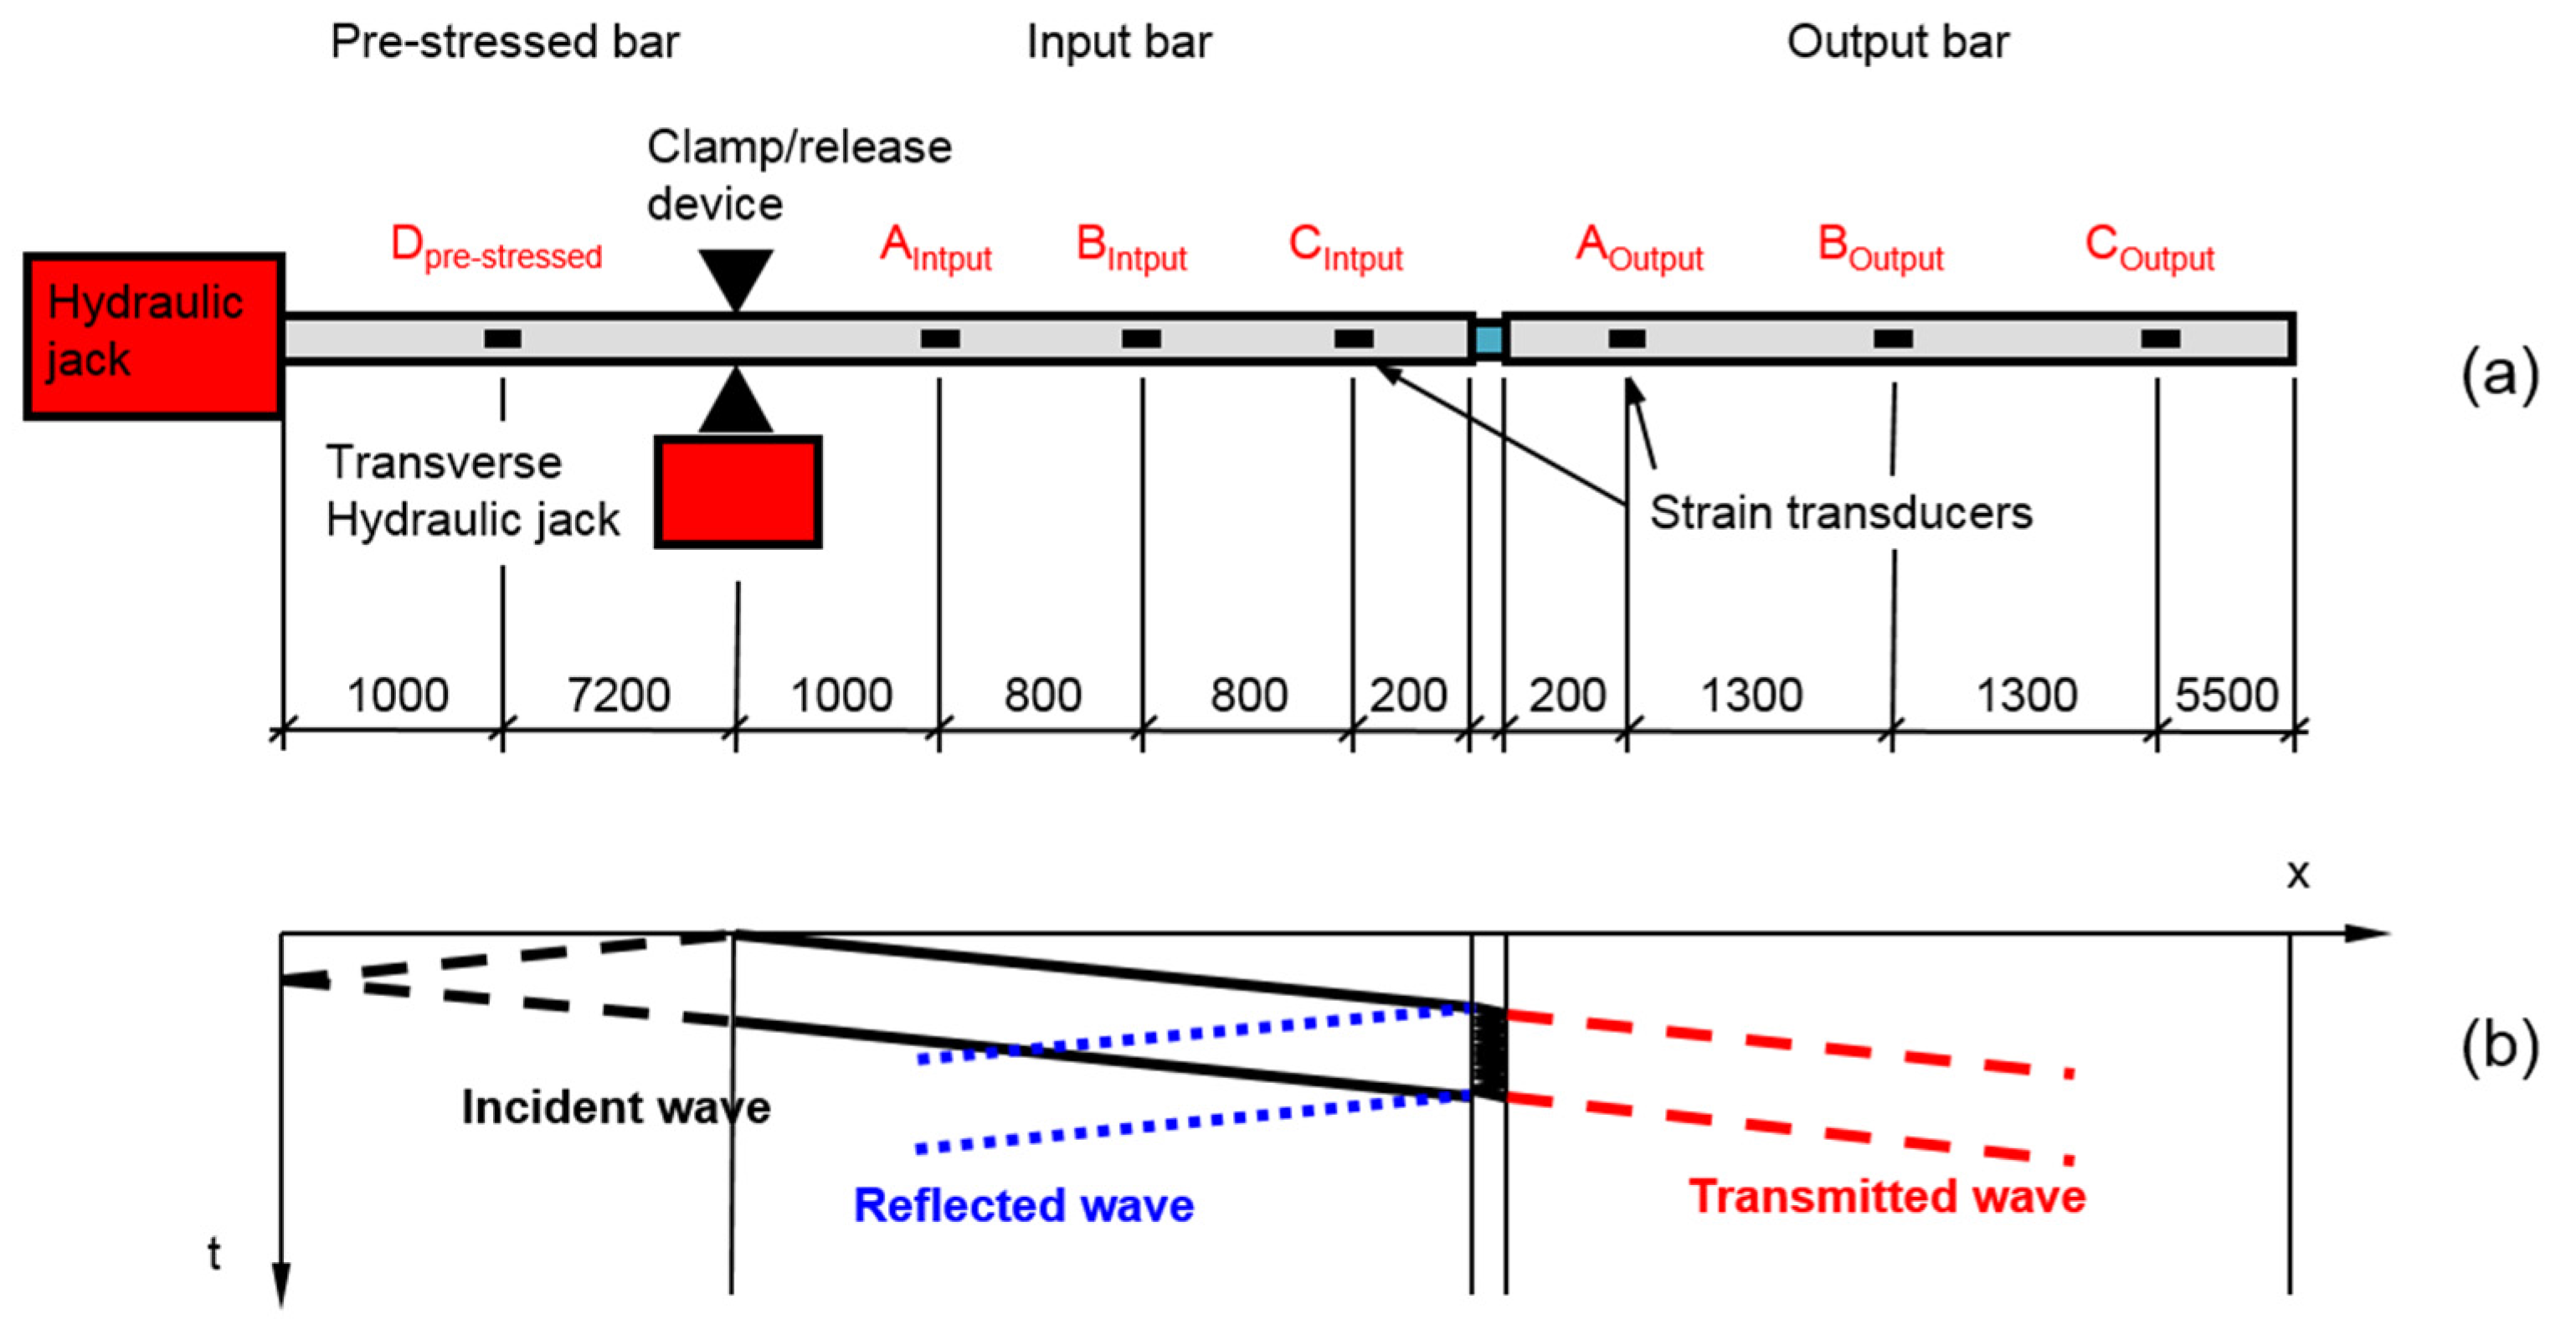
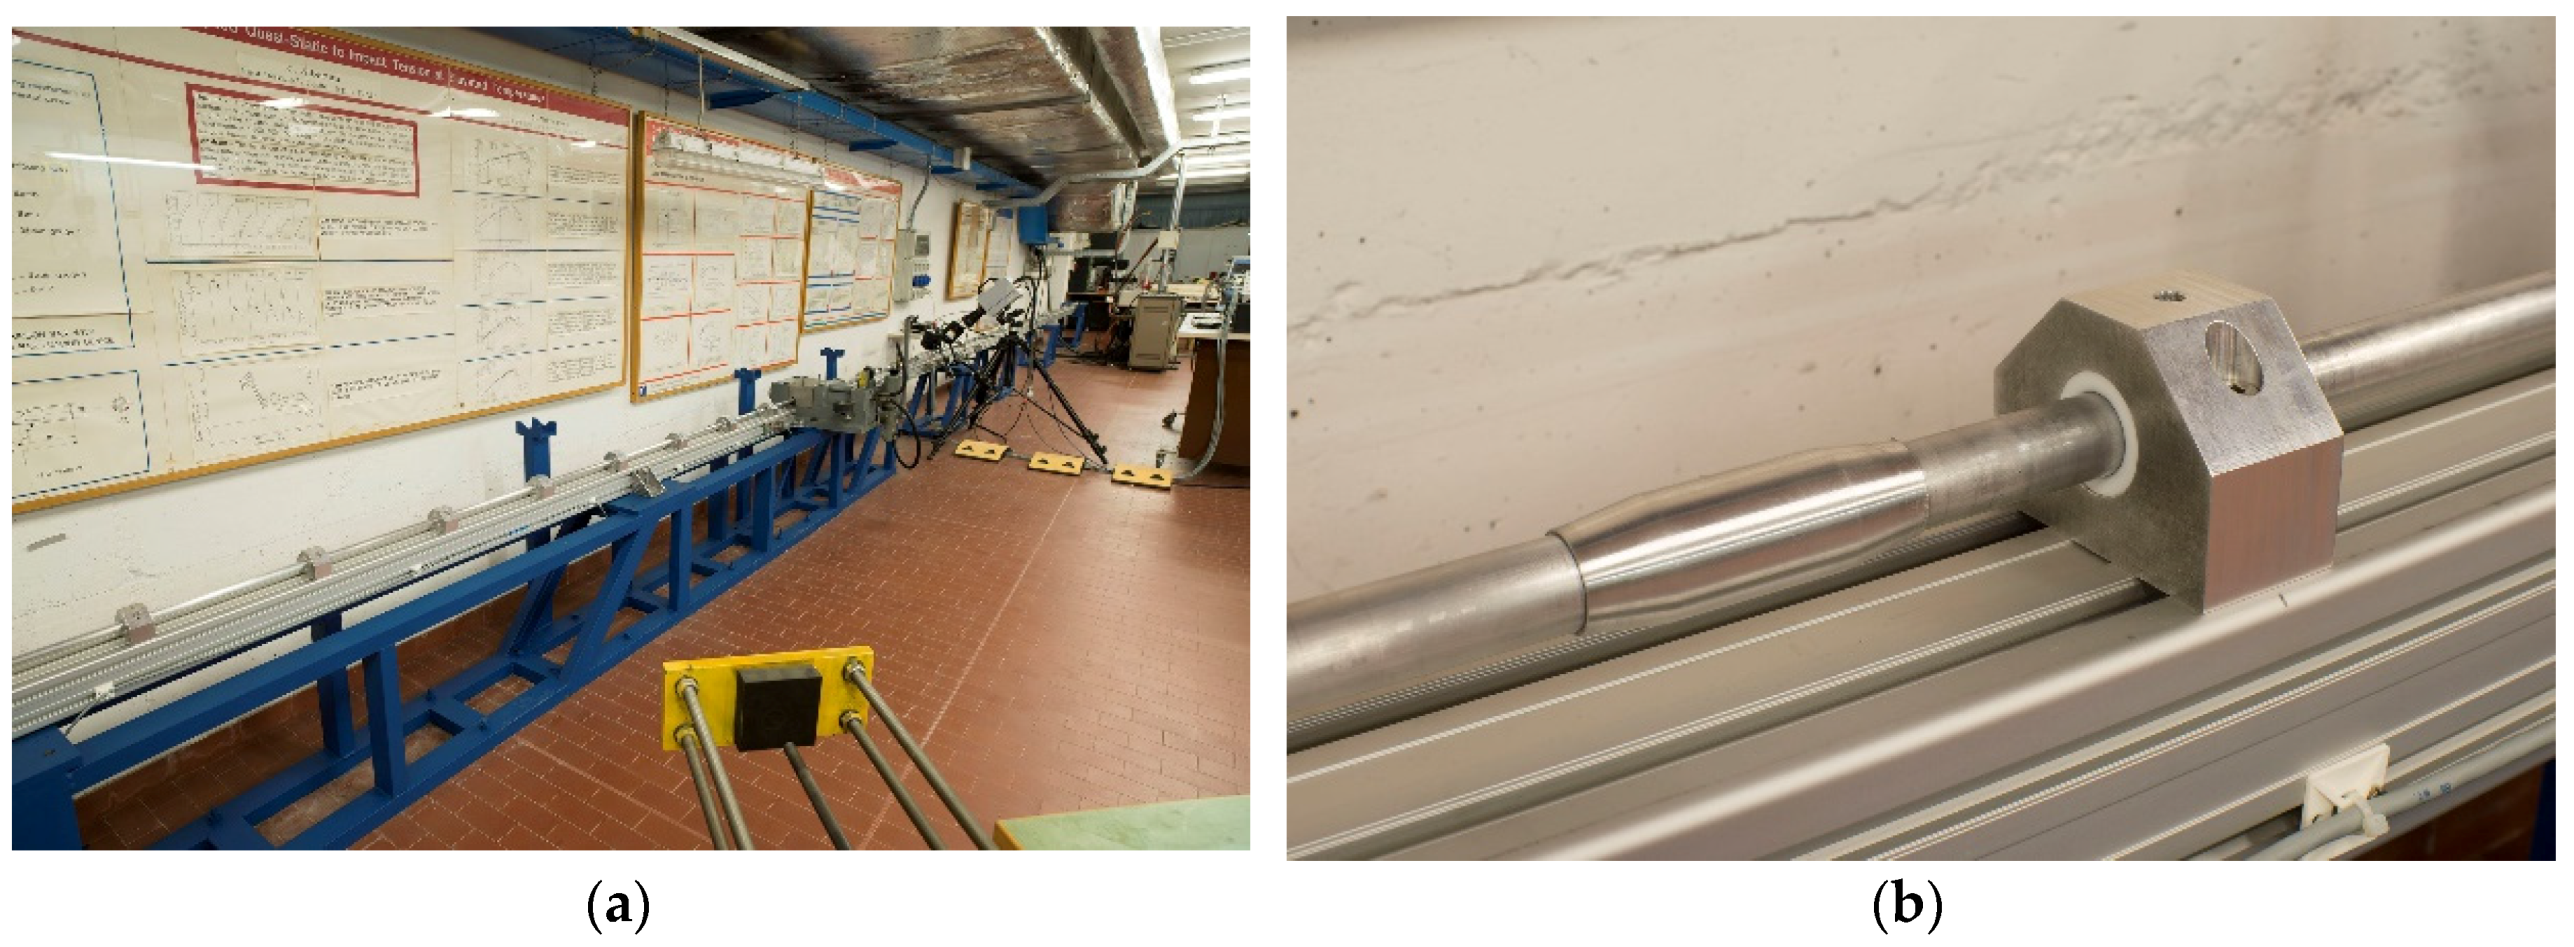
2.1. Mechanical Structure

- The input bar is clamped with the θ-clamp by applying an adequate force with the transverse hydraulic jack;
- The pre-stressed part is next compressed by using the main hydraulic jack at the bar left end;
- Having reached the design pre-compression (it depends on the test desired input pulse) in the pre-stressed part, the fragile bolt of the θ-clamp is forced to break (by further increasing the transverse jack load);
- The pre-stressed bar is then rapidly released thus generating a compression pulse with a rise time of about 20 µs, which starts propagating in the incident bar towards the specimen.
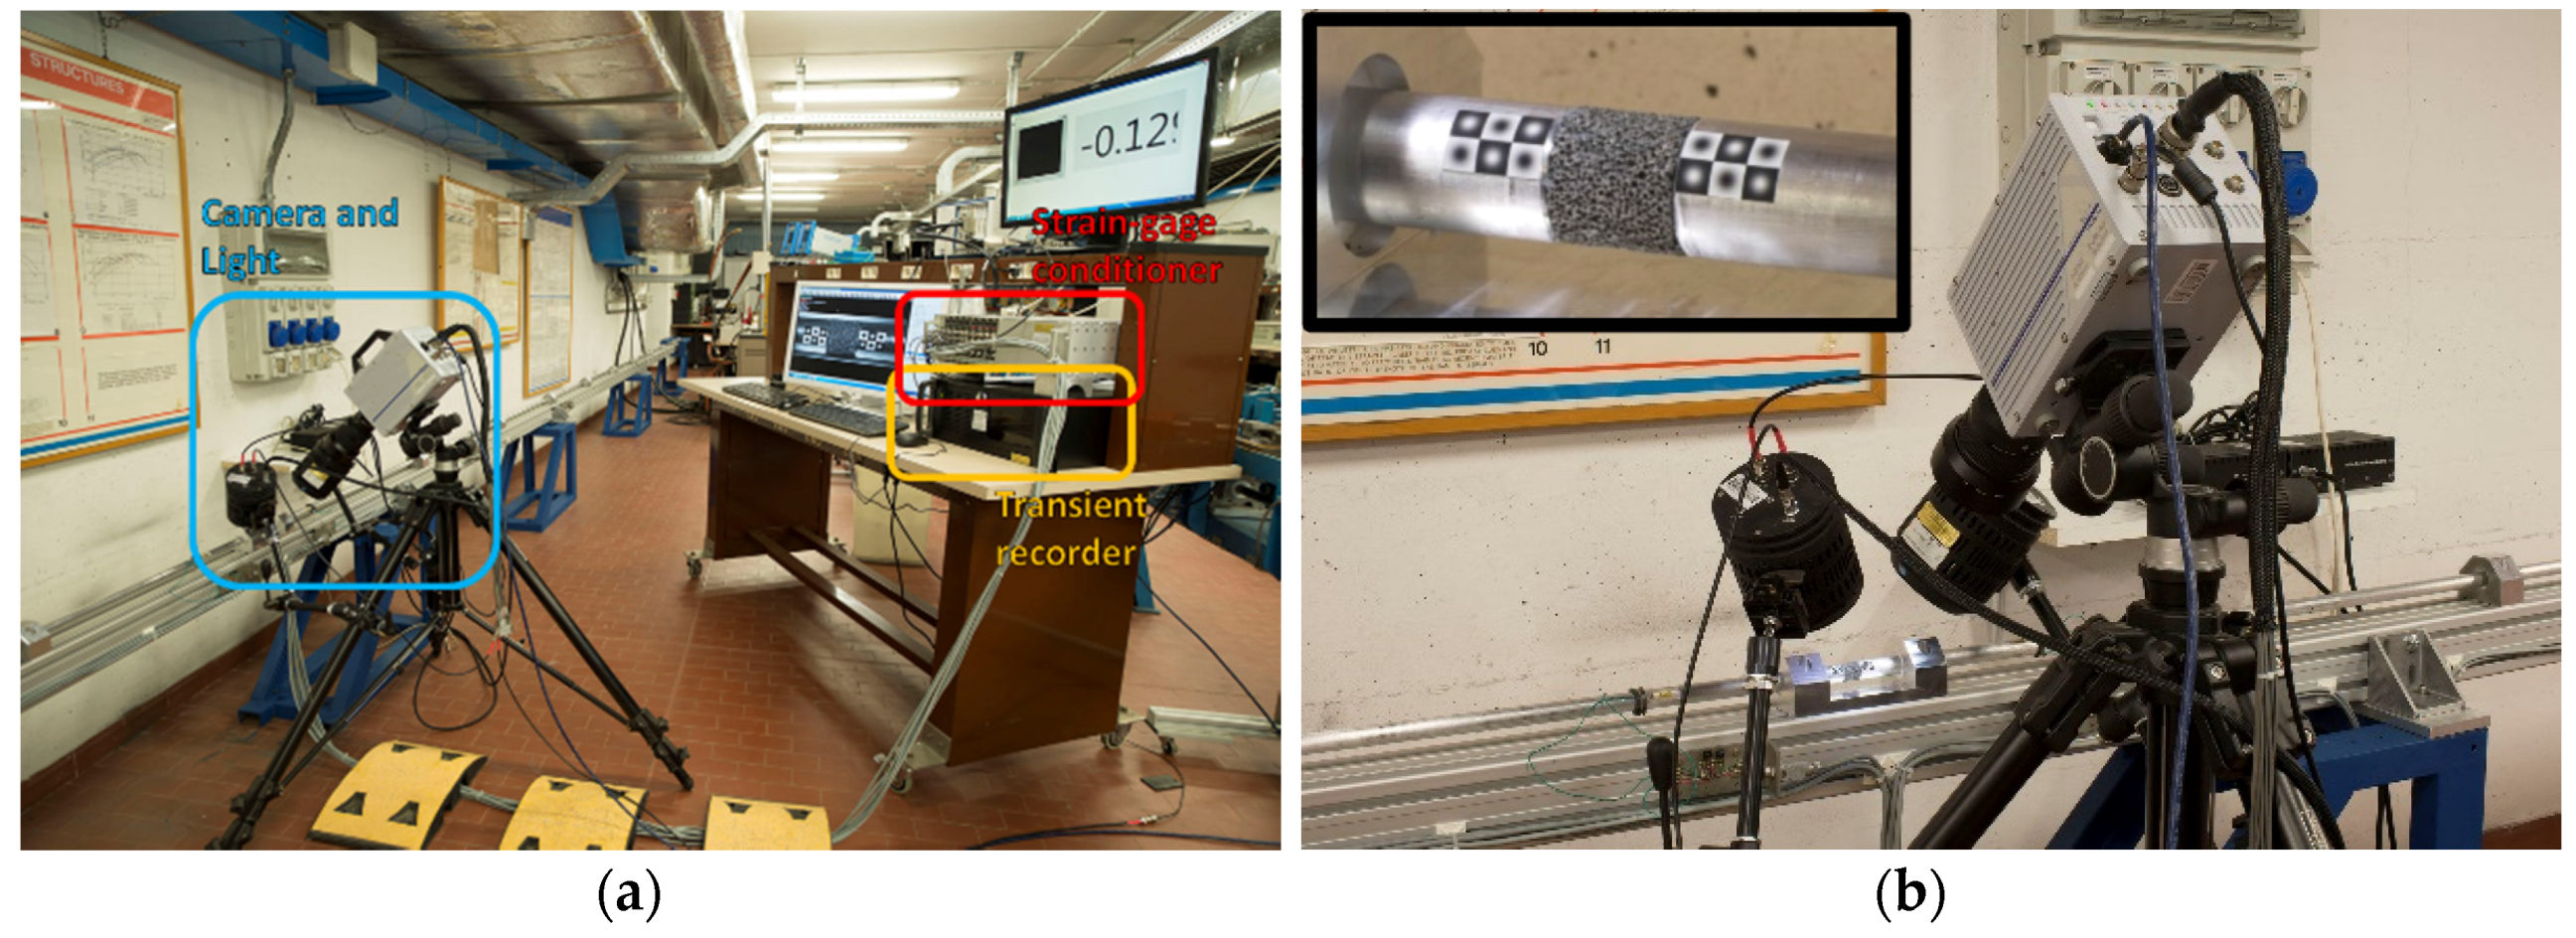
2.2. Instrumentation

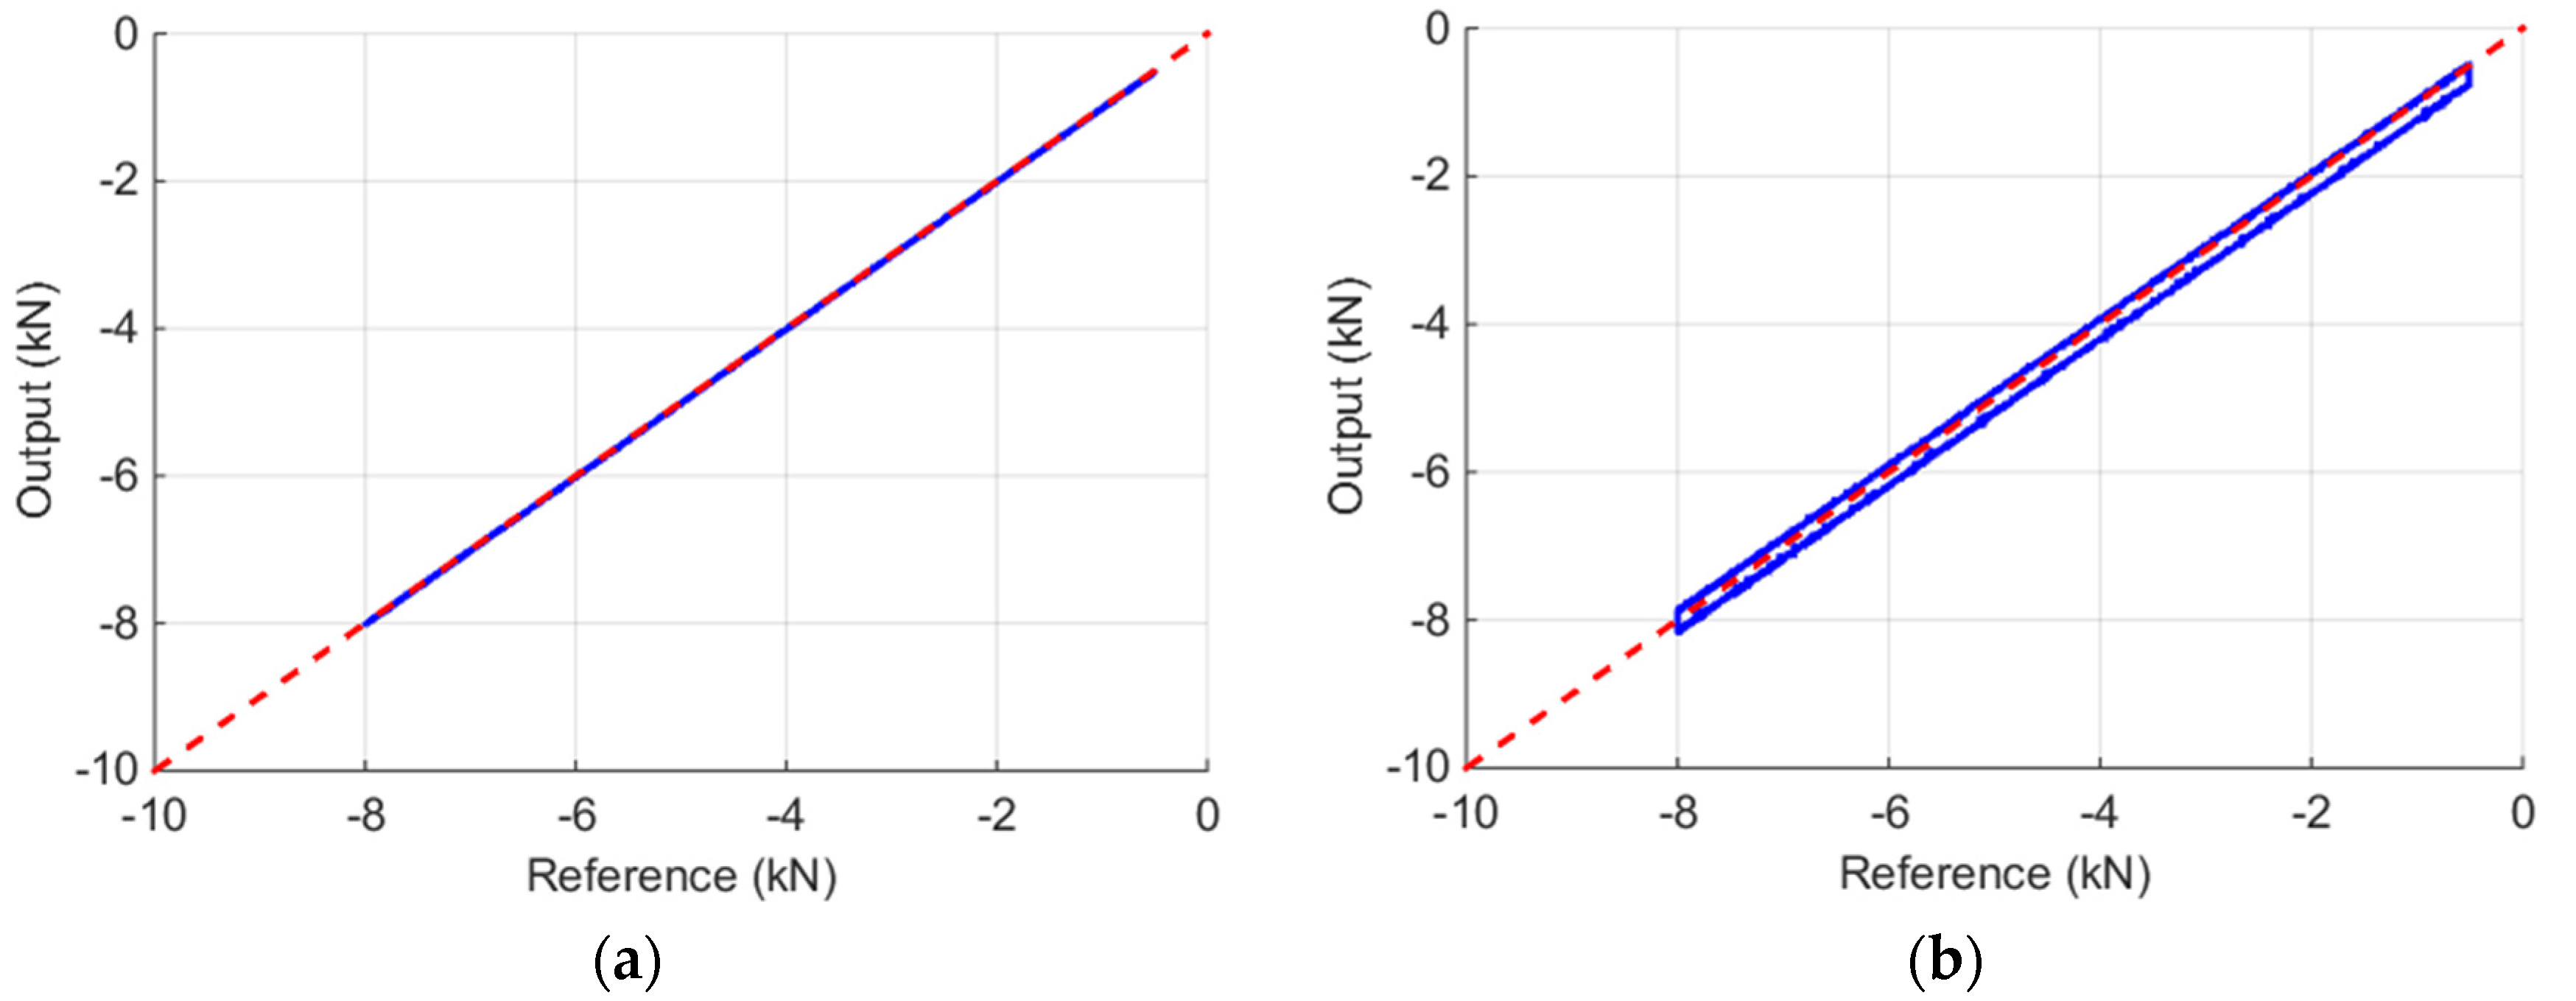
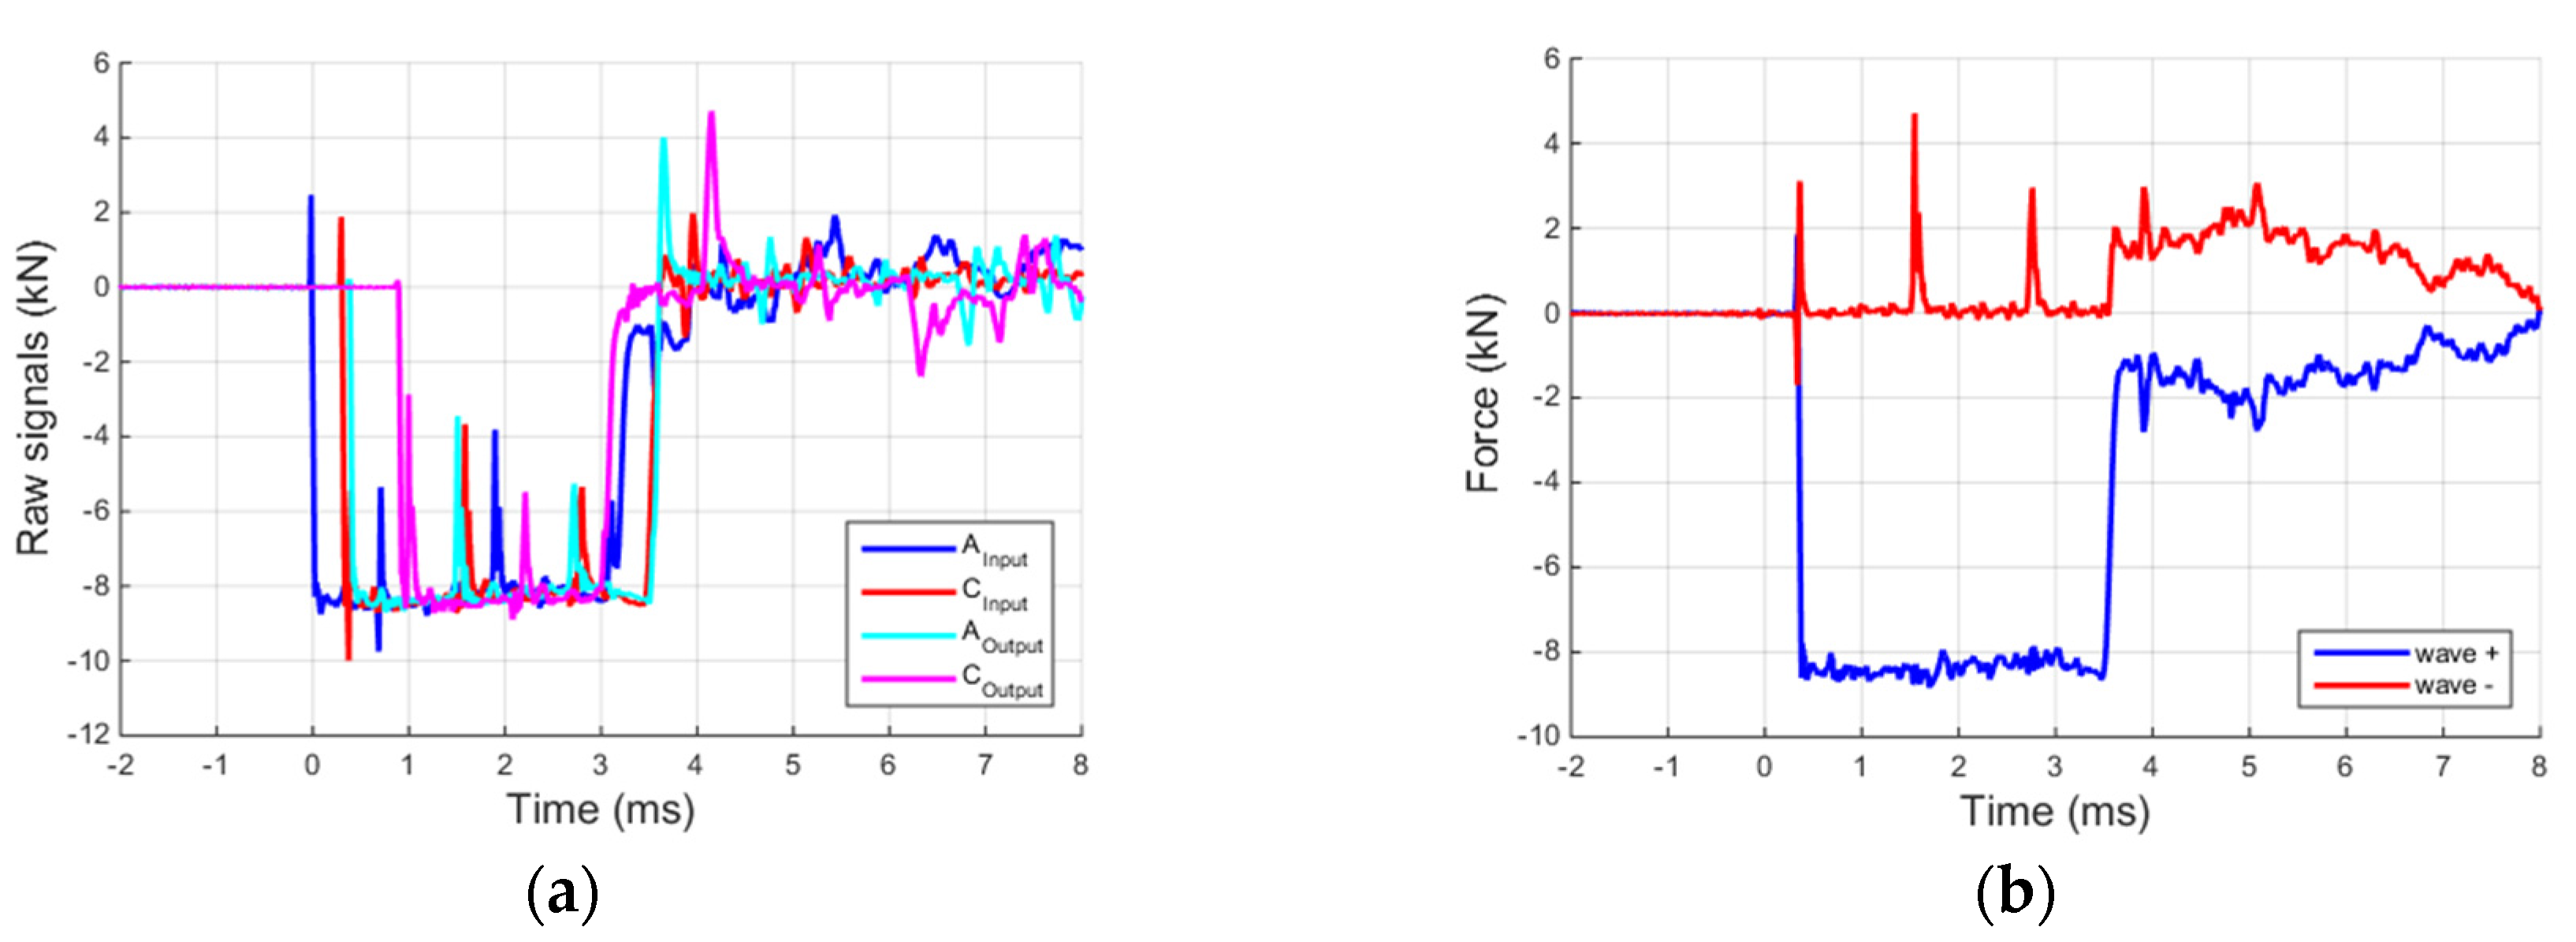
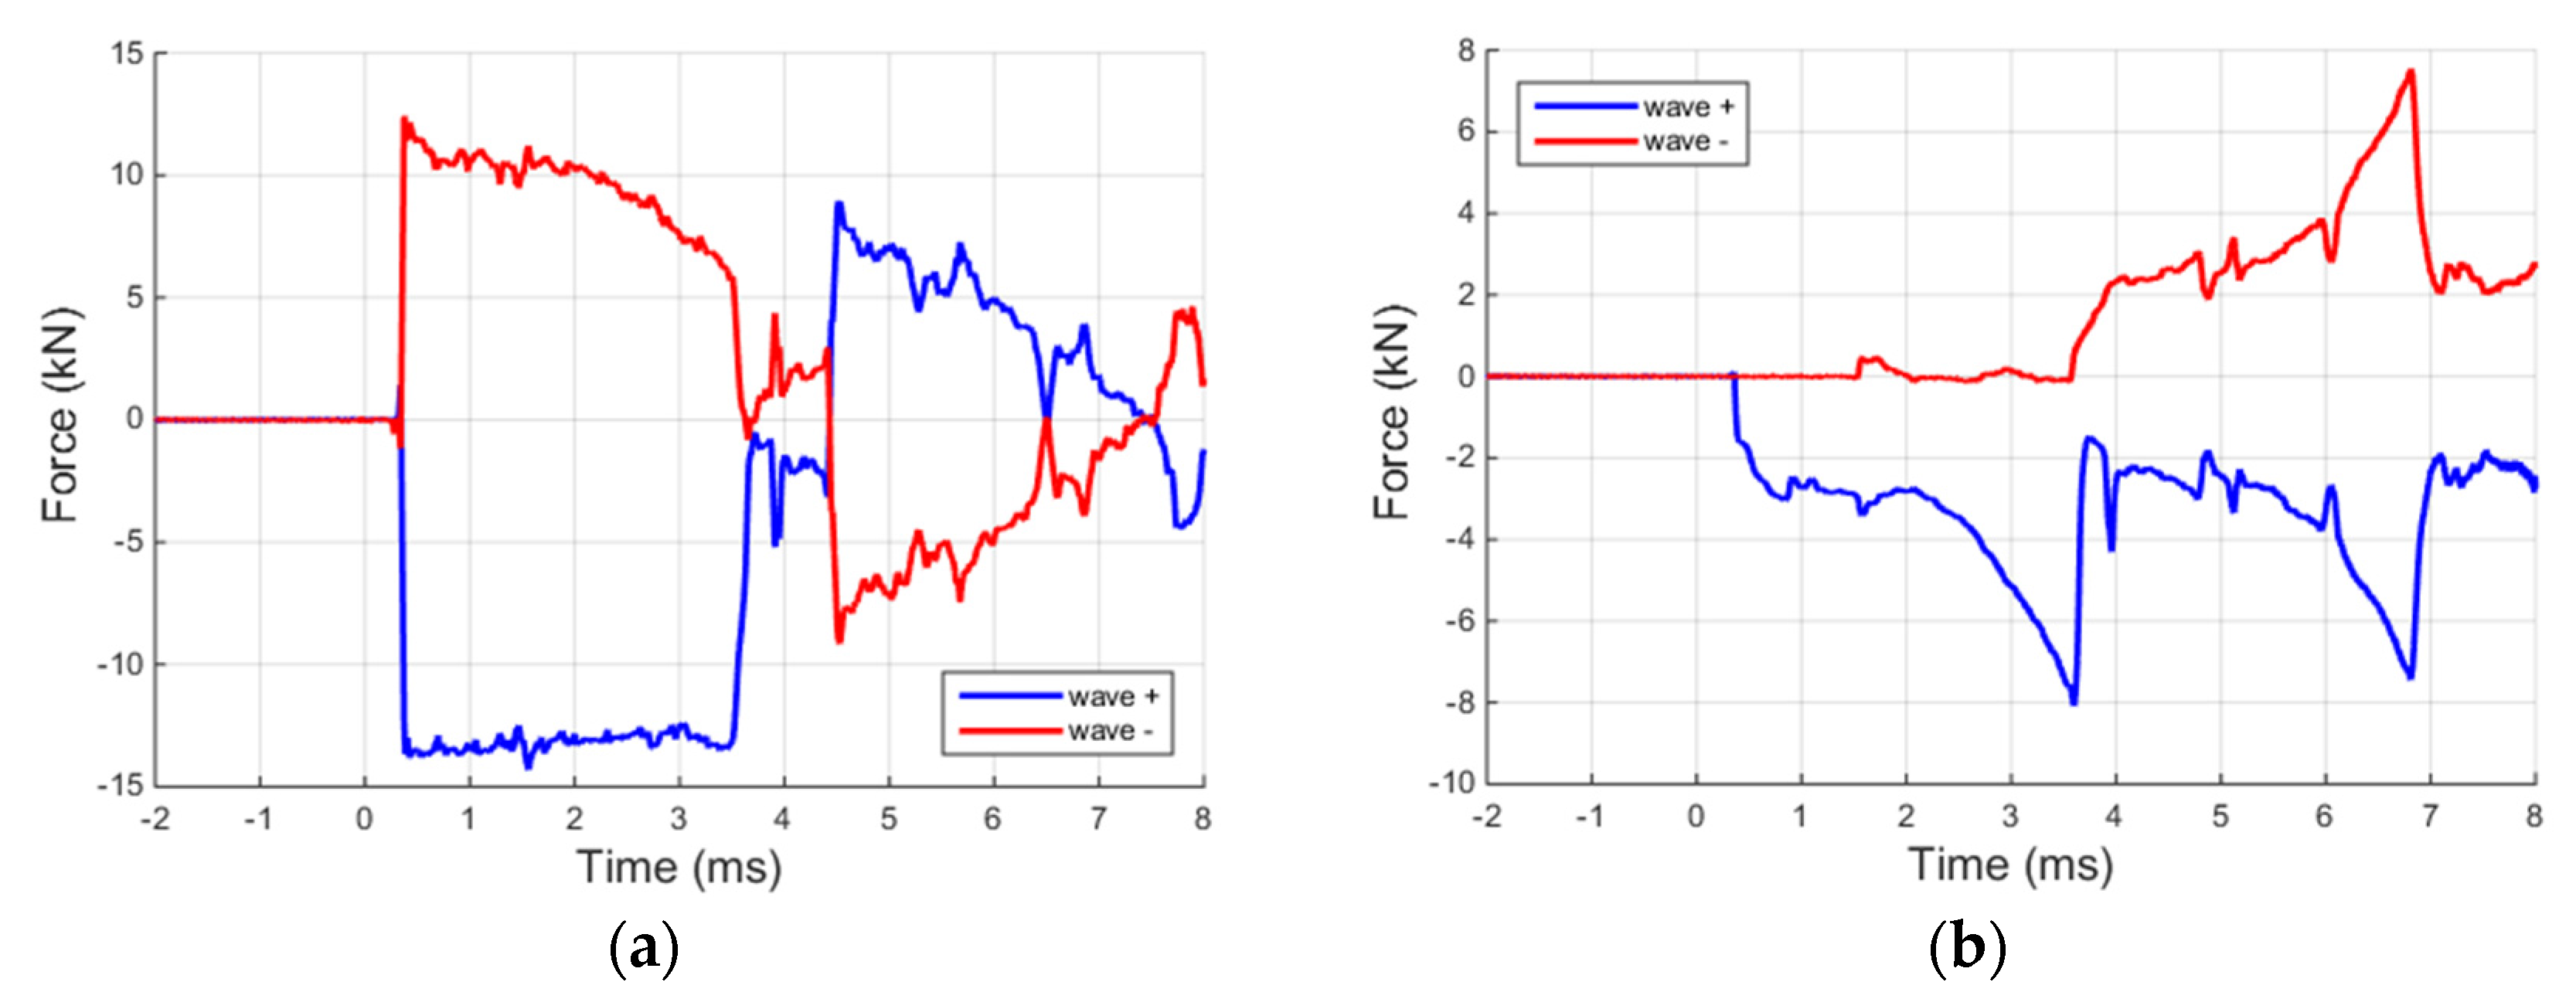
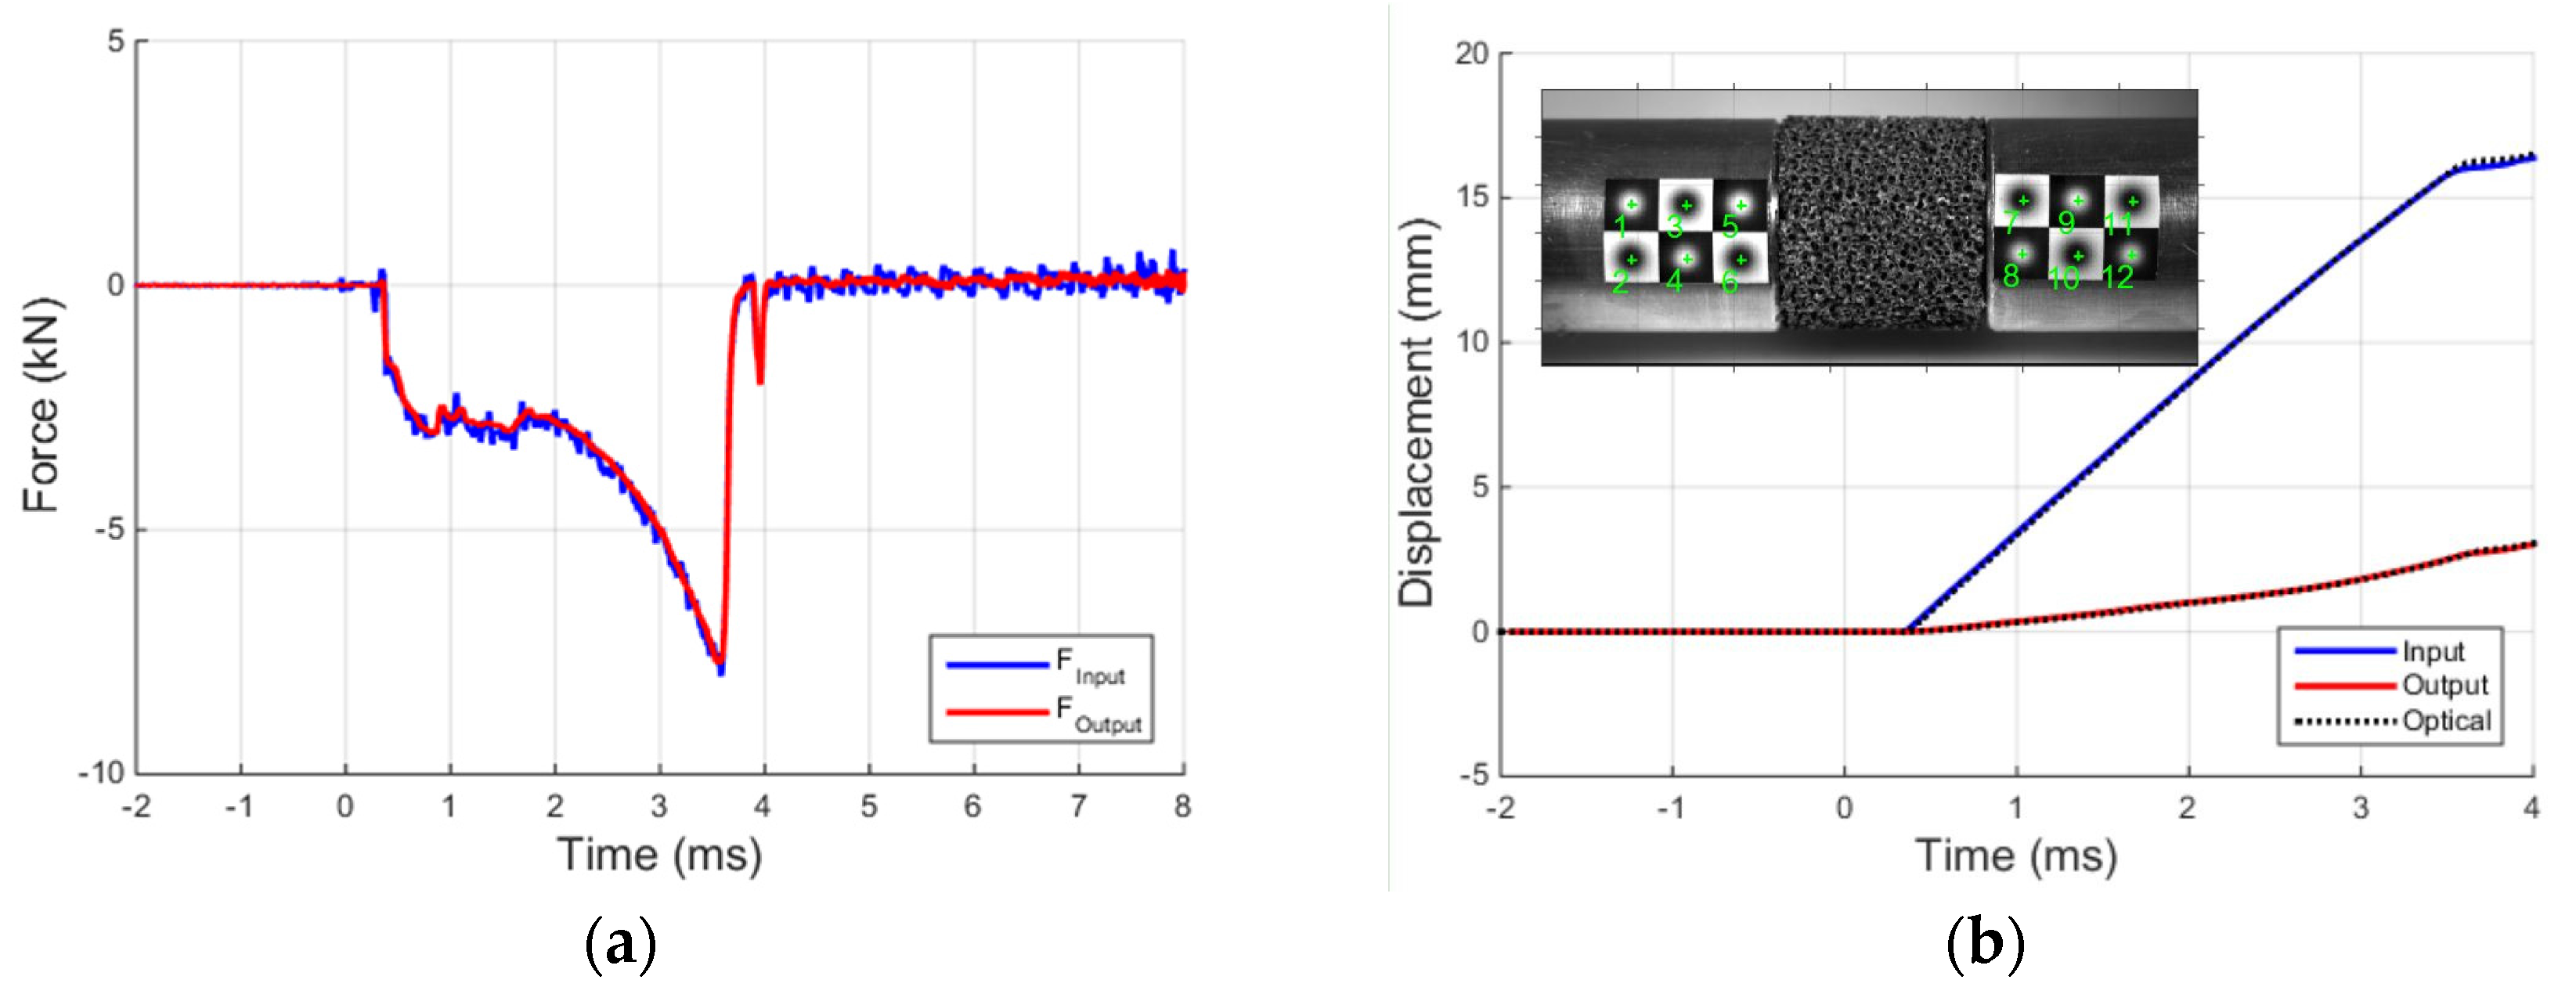
2.3. Data Elaboration
3. Experimental Tests and Data Analysis

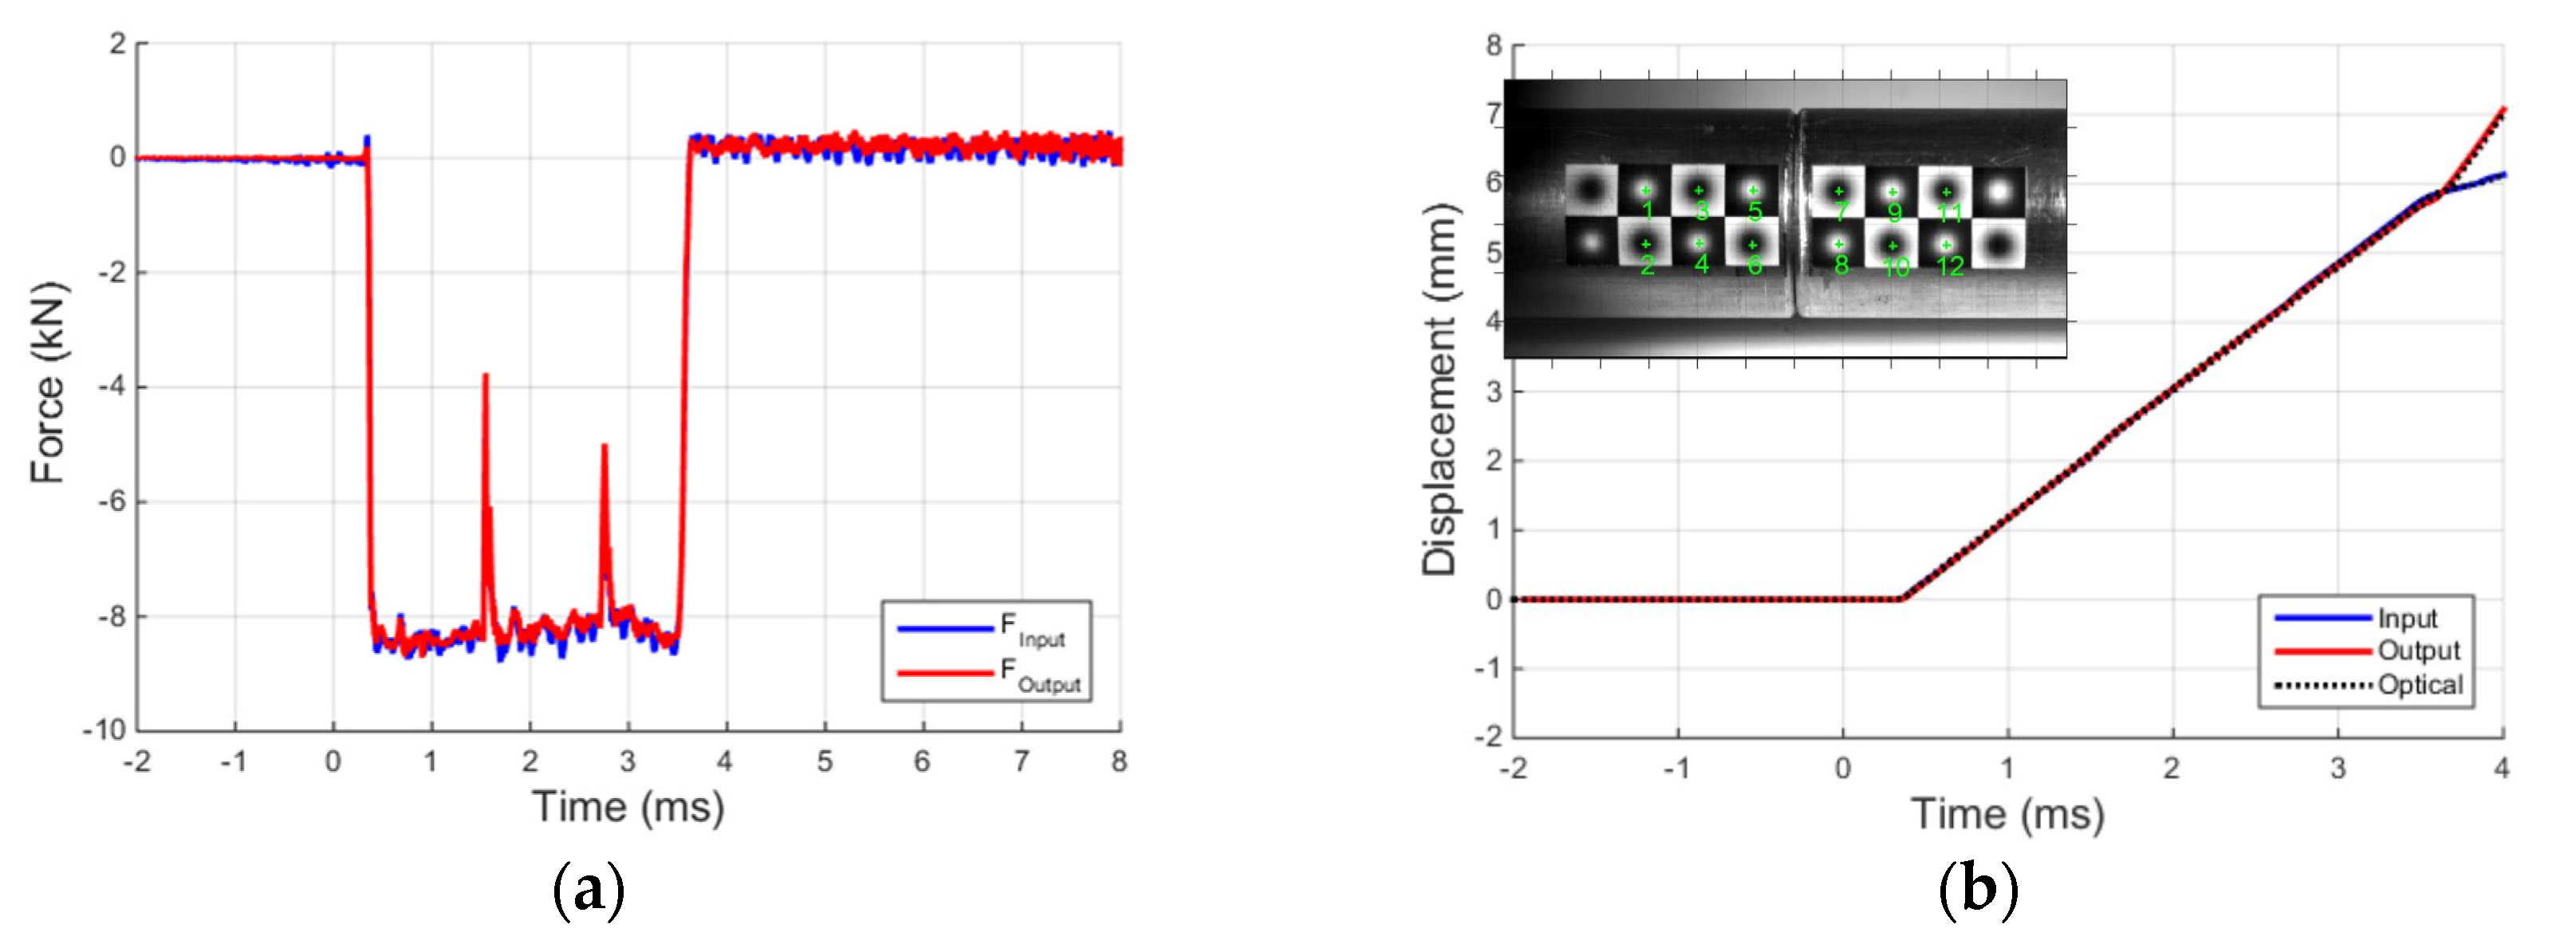
3.1. Void Test

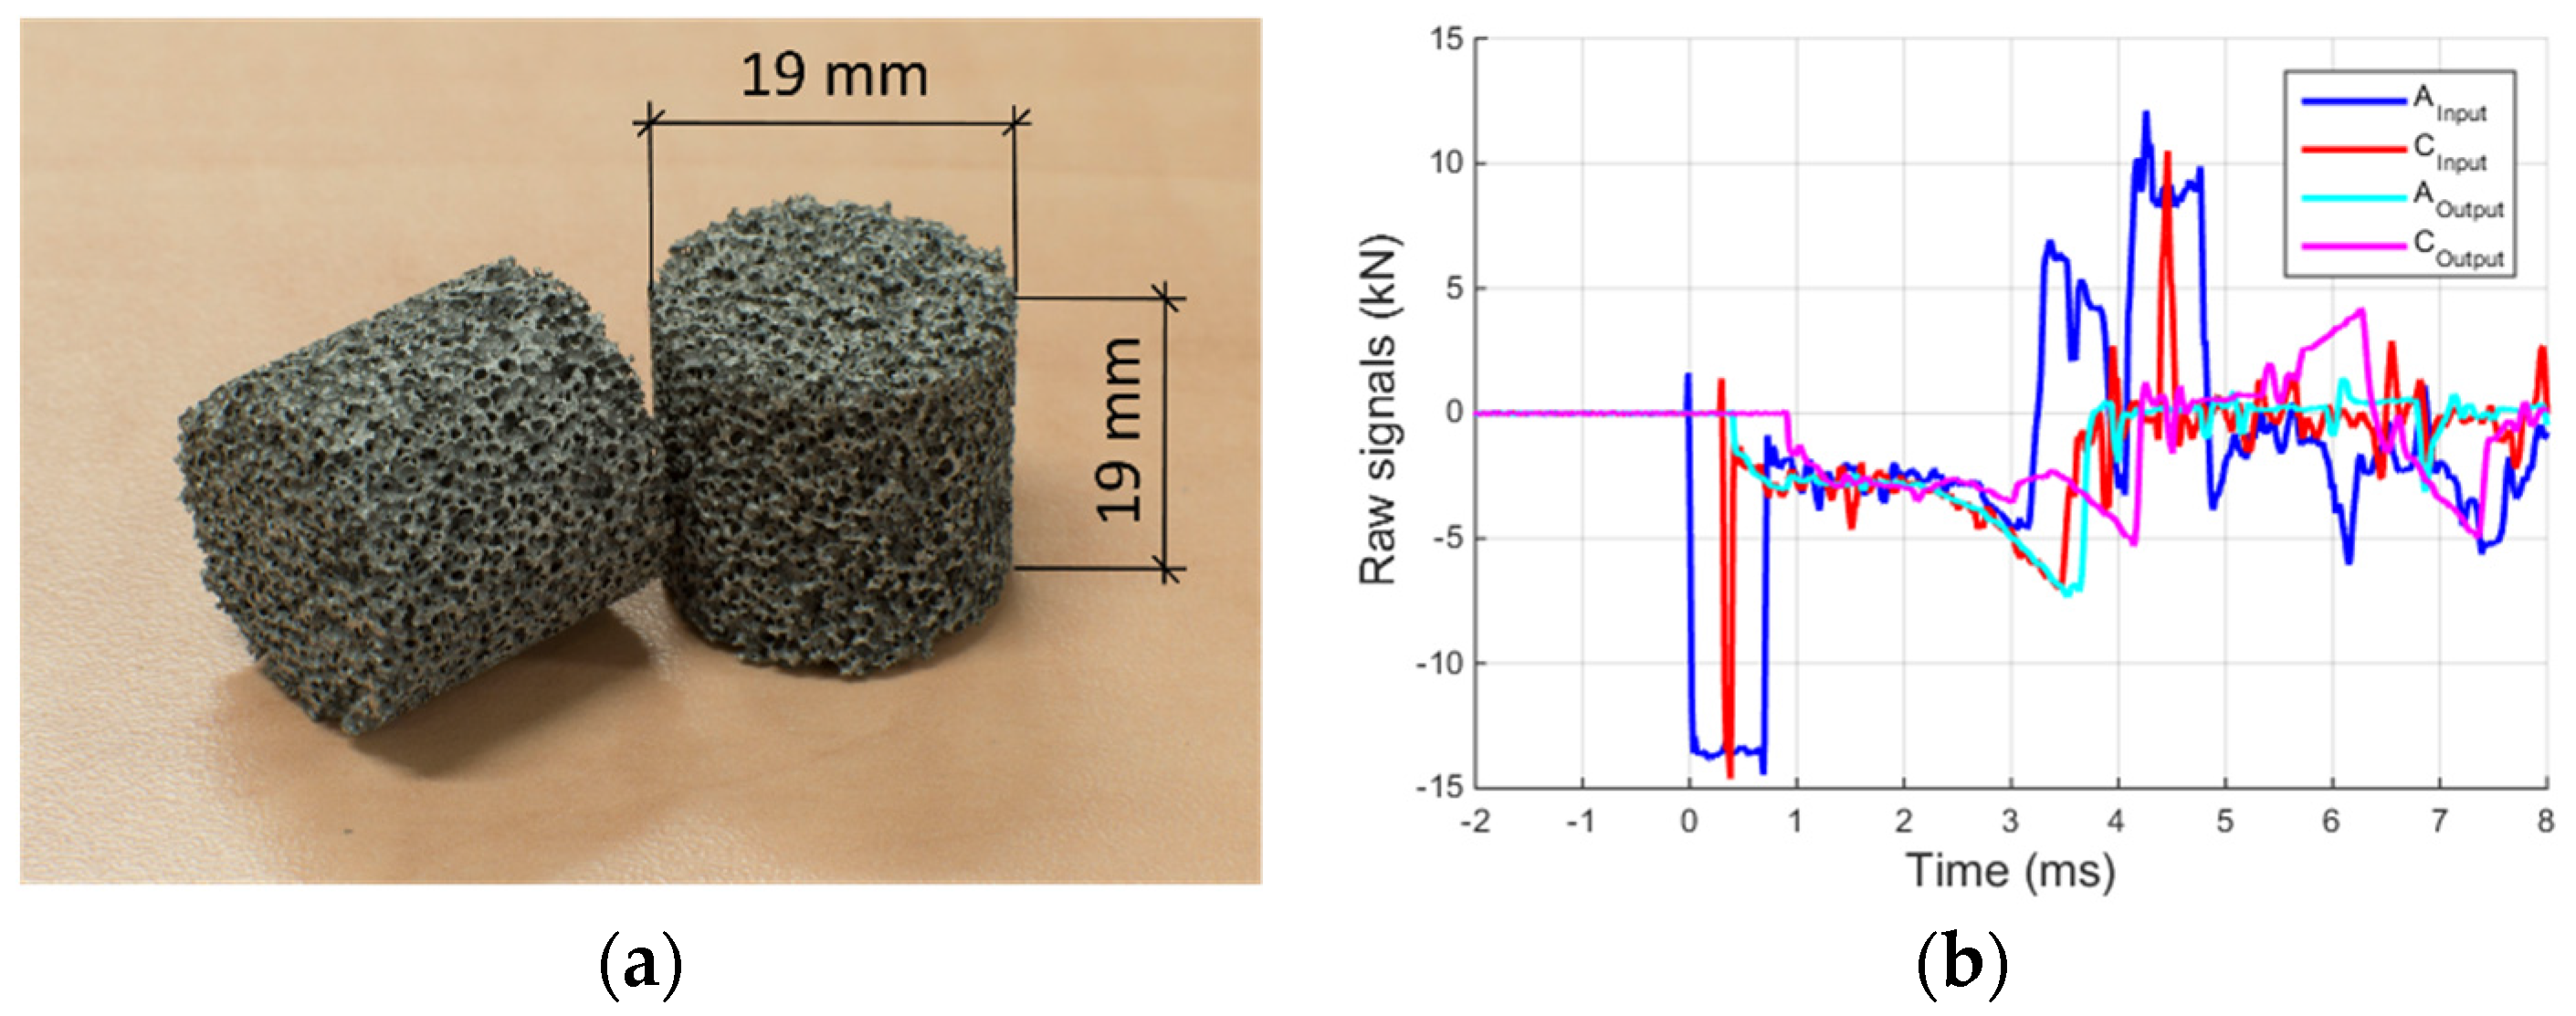
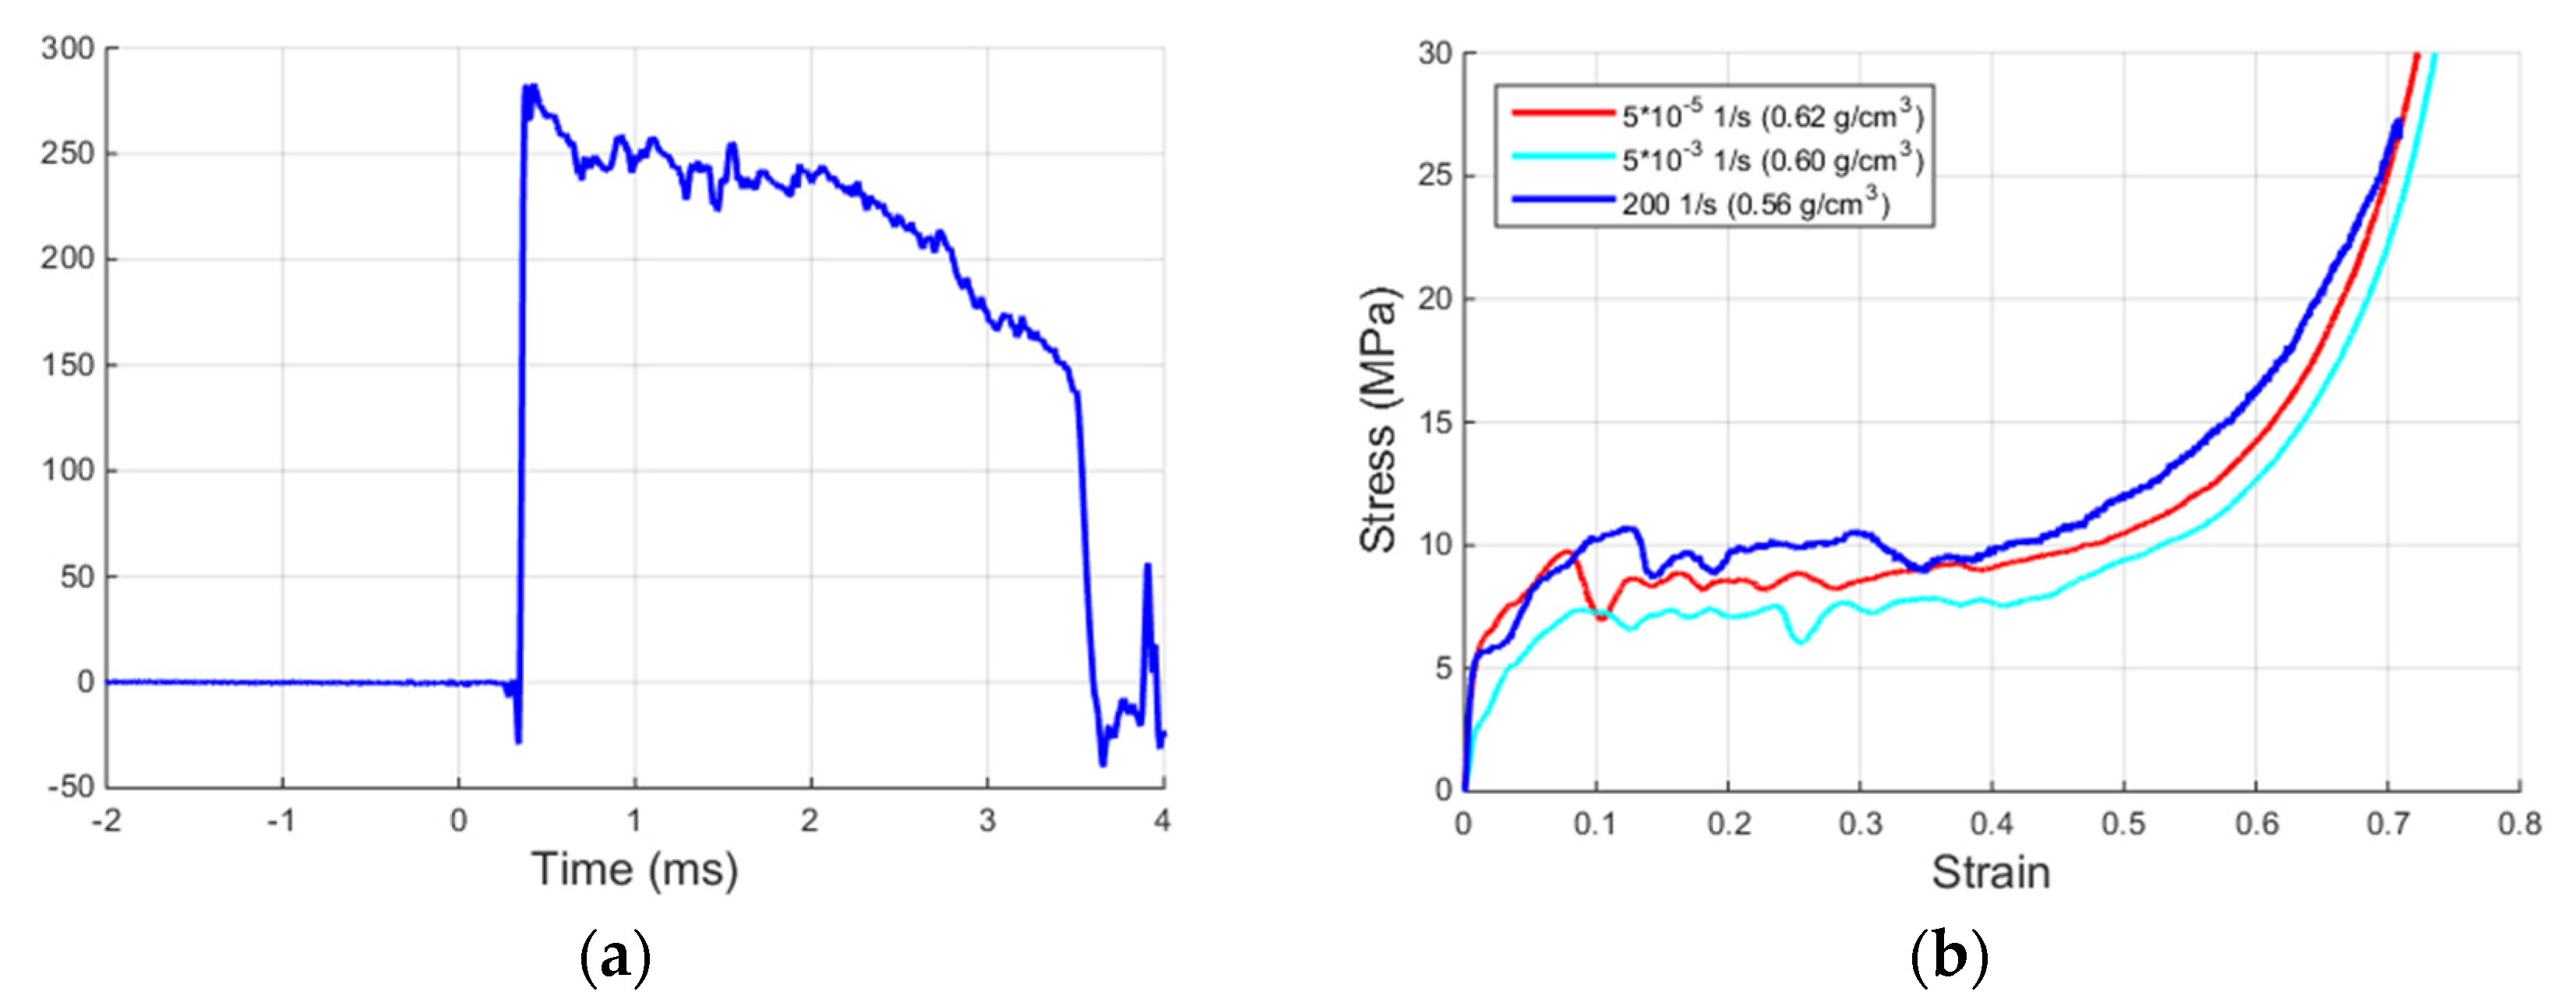
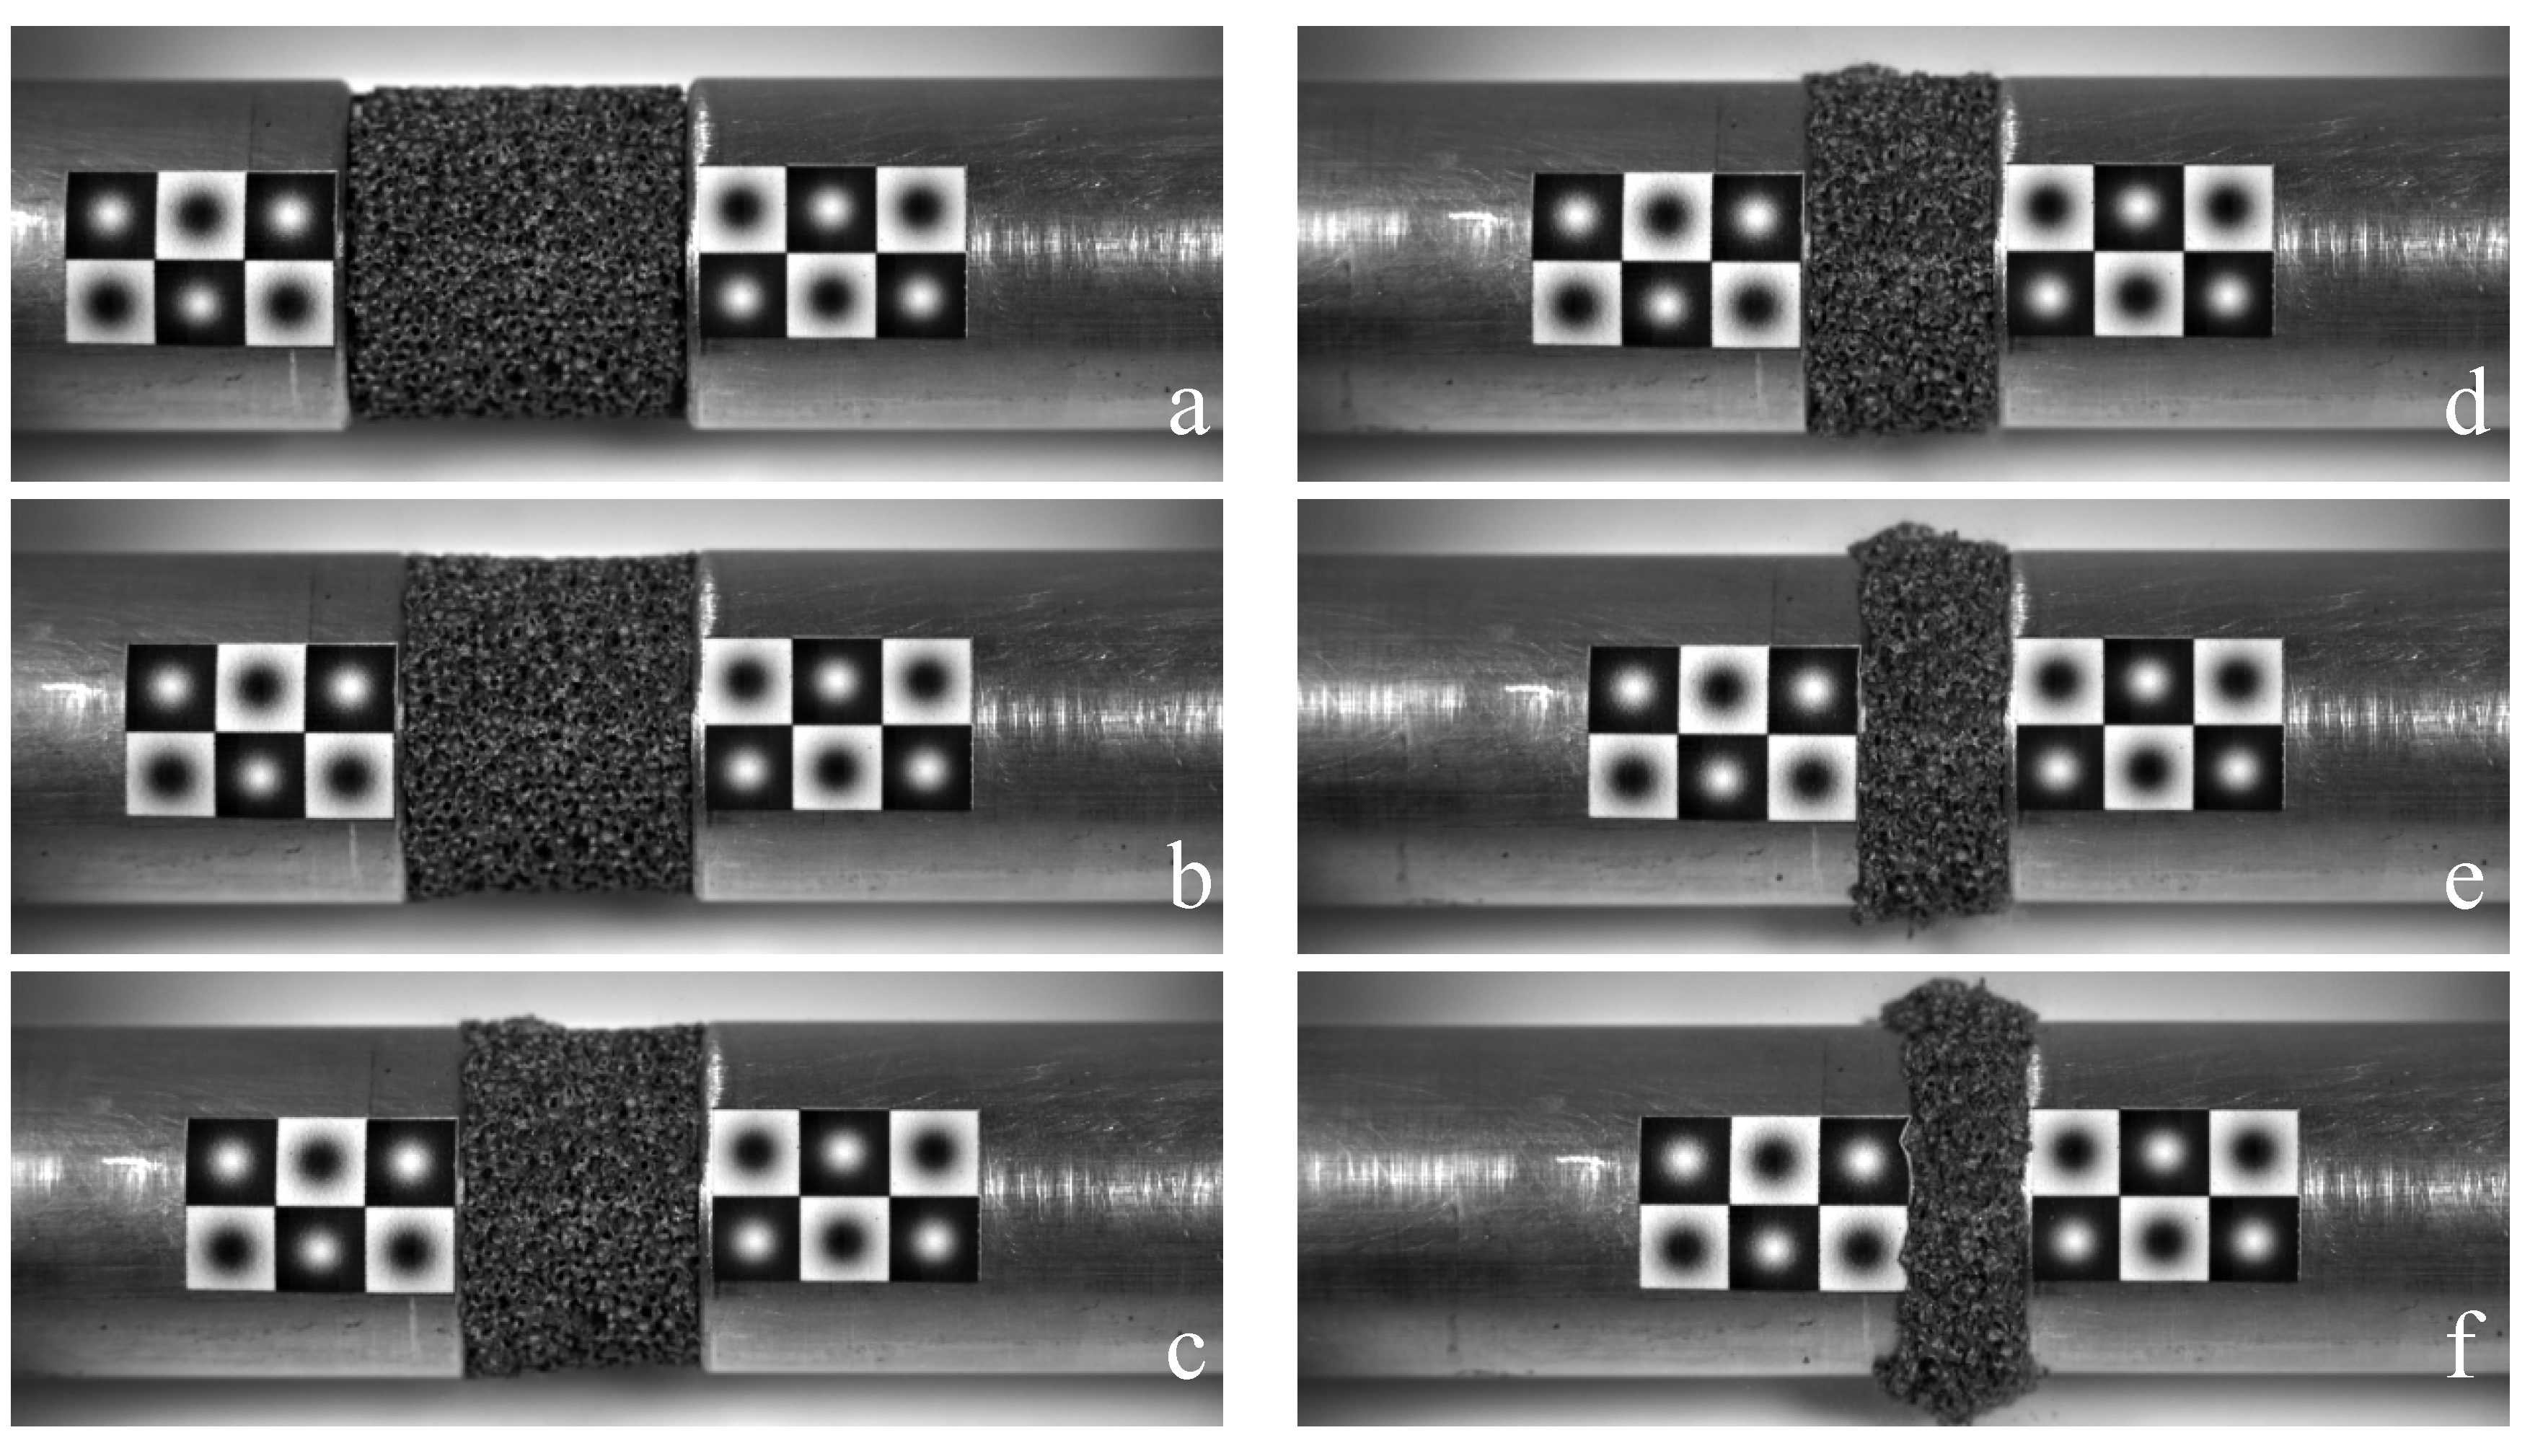
3.2. Foam Tests


4. Conclusions
Acknowledgments
Author Contributions
Conflicts of Interest
References
- Banhart, J. Aluminium foams for lighter vehicles. Int. J. Vehicle Des. 2005, 37, 114–125. [Google Scholar] [CrossRef]
- Ashby, M.; Evans, A.; Fleck, N.; Gibson, L.; Hutchinson, J.; Wadley, H. Metal Foams: A Design Guide; Butterworth, Heinemann: Boston, MA, USA, 2000. [Google Scholar]
- Hanssen, A.G.; Enstoc, L.; Langseth, M. Close-range blast loading of aluminium foam panels. Int. J. Impact Eng. 2002, 27, 593–618. [Google Scholar] [CrossRef]
- Peroni, M.; Peroni, L.; Avalle, M. The mechanical behaviour of aluminium foam structures in different loading conditions. Int. J. Impact Eng. 2008, 35, 644–658. [Google Scholar] [CrossRef]
- Banhart, J.; Baumeister, J. Deformation characteristics of metal foams. J. Mater. Sci. 1998, 33, 1431–1446. [Google Scholar] [CrossRef]
- Yi, F.; Zhu, Z.; Zu, F.; Hu, S.; Yi, P. Strain rate effects on the compressive property and the energy-absorbing capacity of aluminium alloy foams. Mater. Caract. 2001, 47, 417–422. [Google Scholar] [CrossRef]
- Mukai, T.; Miyoshi, T.; Nakano, S.; Somekawa, H.; Higashi, K. Compressive response of a closed-cell aluminum foam at high strain rate. Scr. Mater. 2006, 54, 533–537. [Google Scholar] [CrossRef]
- Mukai, T.; Kanahashi, H.; Miyoshi, T.; Mabuchi, M.; Nieh, T.; Higashi, K. Experimental study of energy absorption in a closed-celled aluminium foam under dynamic loading. Scr. Mater. 1999, 40, 921–927. [Google Scholar] [CrossRef]
- Dannemann, K.A.; Lankford, J. High strain rate compression of closed-cell aluminium foams. Mater. Sci. Eng. A 2000, 293, 157–164. [Google Scholar] [CrossRef]
- Kenny, L.D. Mechanical properties of particle stabilised aluminium foam. Mater. Sci. 1996, 217–222, 1883–1890. [Google Scholar]
- Lankford, J.; Danneman, K.A. Strain rate effects in porous materials. In Porous and Cellular Materials for Structural Applications, Proceedings of 1998 MRS Spring Meeting, San Francisco, CA, USA, 13–17 April 1998; Swartz, D.S., Shih, D.S., Evans, A.G., Wadley, H.N.G., Eds.; Materials Research Society: Pittsburgh, PA, USA, 1998; pp. 103–108. [Google Scholar]
- Deshpande, V.S.; Fleck, N.A. High strain rate compressive behaviour of aluminium alloy foams. Int. J. Impact Eng. 2000, 24, 277–298. [Google Scholar] [CrossRef]
- Deshpande, V.S.; Fleck, N.A. Isotropic constitutive models for metallic foams. J. Mech. Phys. Solids 2000, 48, 1253–1283. [Google Scholar] [CrossRef]
- Tan, P.J.; Reid, S.R.; Harrigan, J.J.; Zou, Z.; Li, S. Dynamic compressive strength properties of aluminium foams. Part I—Experimental data and observations. J. Mech. Phys. Solids 2005, 53, 2174–2205. [Google Scholar] [CrossRef]
- Peroni, M.; Solomos, G.; Pizzinato, V. Impact behaviour testing of aluminium foam. Int. J. Impact Eng. 2013, 53, 74–83. [Google Scholar] [CrossRef]
- Zhao, H.; Gary, G. Crushing Behaviour of Aluminium Honeycombs Under. Int. J. Impact Eng. 1998, 21, 827–836. [Google Scholar] [CrossRef]
- Cadoni, E.; Solomos, G.; Albertini, C. Mechanical characterization of concrete in tension and compression at high strain-rate using a modified Hopkinson bar. Mac Concrete Res. 2008, 60, 221–236. [Google Scholar]
- Bussac, M.; Collet, P.; Gary, G.; Othman, R. An optimization method for separating and rebuild one-dimensional dispersive waves from multi-point measurement. Application to elastic or viscoelastic bars. J. Mech. Phys. Solid 2002, 50, 321–349. [Google Scholar] [CrossRef]
- Zhao, H.; Gary, G. A new method for the separation of waves. Application to the SHPB technique for an unlimited duration of measurement. J. Mech. Phys. Solids 1997, 45, 1185–1202. [Google Scholar] [CrossRef]
- Capéran, P.; Poljanšek, M.; Gutiérrez, E.; Primi, S.; Paulotto, C. Optical 3-dimensional measurements on a FRP beam tested at serviceability limit. Comp. Struct. 2012, 94, 3465–3477. [Google Scholar] [CrossRef]
- Zach, C.; Pock, T.; Bischof, H. A duality based approach for realtime TV-L1 optical flow. In Proccedings of the 29th Annual Symposium of the Deutsche Arbeitsgemeinschaft fur Mustererkennung, DAGM 2007, Heidelberg, Germany, 12–14 September 2007; pp. 214–223.
- Lindholm, U.S. High strain rate tests. In Techniques of Metals Research; Bunsmah, R.F., Ed.; Wiley & Sons: Hoboken, NJ, USA, 1971; Volume V, Part l. [Google Scholar]
- Peroni, M.; Solomos, G.; Larcher, M.; Pizzinato, V. Experimental investigation of high strain-rate behaviour of glass. AMM 2011, 82, 63–68. [Google Scholar] [CrossRef]
- Metallic Materials—Verification of Static Uniaxial Testing Machines—Part 1: Tension/Compression Testing Machines—Verification and Calibration of the Force-Measuring System; ISO 7500-1:2004; International Organization for Standardization: Geneva, Switzerland, 2004.
© 2016 by the authors; licensee MDPI, Basel, Switzerland. This article is an open access article distributed under the terms and conditions of the Creative Commons by Attribution (CC-BY) license (http://creativecommons.org/licenses/by/4.0/).
Share and Cite
Peroni, M.; Solomos, G.; Babcsan, N. Development of a Hopkinson Bar Apparatus for Testing Soft Materials: Application to a Closed-Cell Aluminum Foam. Materials 2016, 9, 27. https://doi.org/10.3390/ma9010027
Peroni M, Solomos G, Babcsan N. Development of a Hopkinson Bar Apparatus for Testing Soft Materials: Application to a Closed-Cell Aluminum Foam. Materials. 2016; 9(1):27. https://doi.org/10.3390/ma9010027
Chicago/Turabian StylePeroni, Marco, George Solomos, and Norbert Babcsan. 2016. "Development of a Hopkinson Bar Apparatus for Testing Soft Materials: Application to a Closed-Cell Aluminum Foam" Materials 9, no. 1: 27. https://doi.org/10.3390/ma9010027
APA StylePeroni, M., Solomos, G., & Babcsan, N. (2016). Development of a Hopkinson Bar Apparatus for Testing Soft Materials: Application to a Closed-Cell Aluminum Foam. Materials, 9(1), 27. https://doi.org/10.3390/ma9010027