
Prediction of Three-Dimensional Downward Flame Spread Characteristics over Poly(methyl methacrylate) Slabs in Different Pressure Environments

Abstract
:1. Introduction
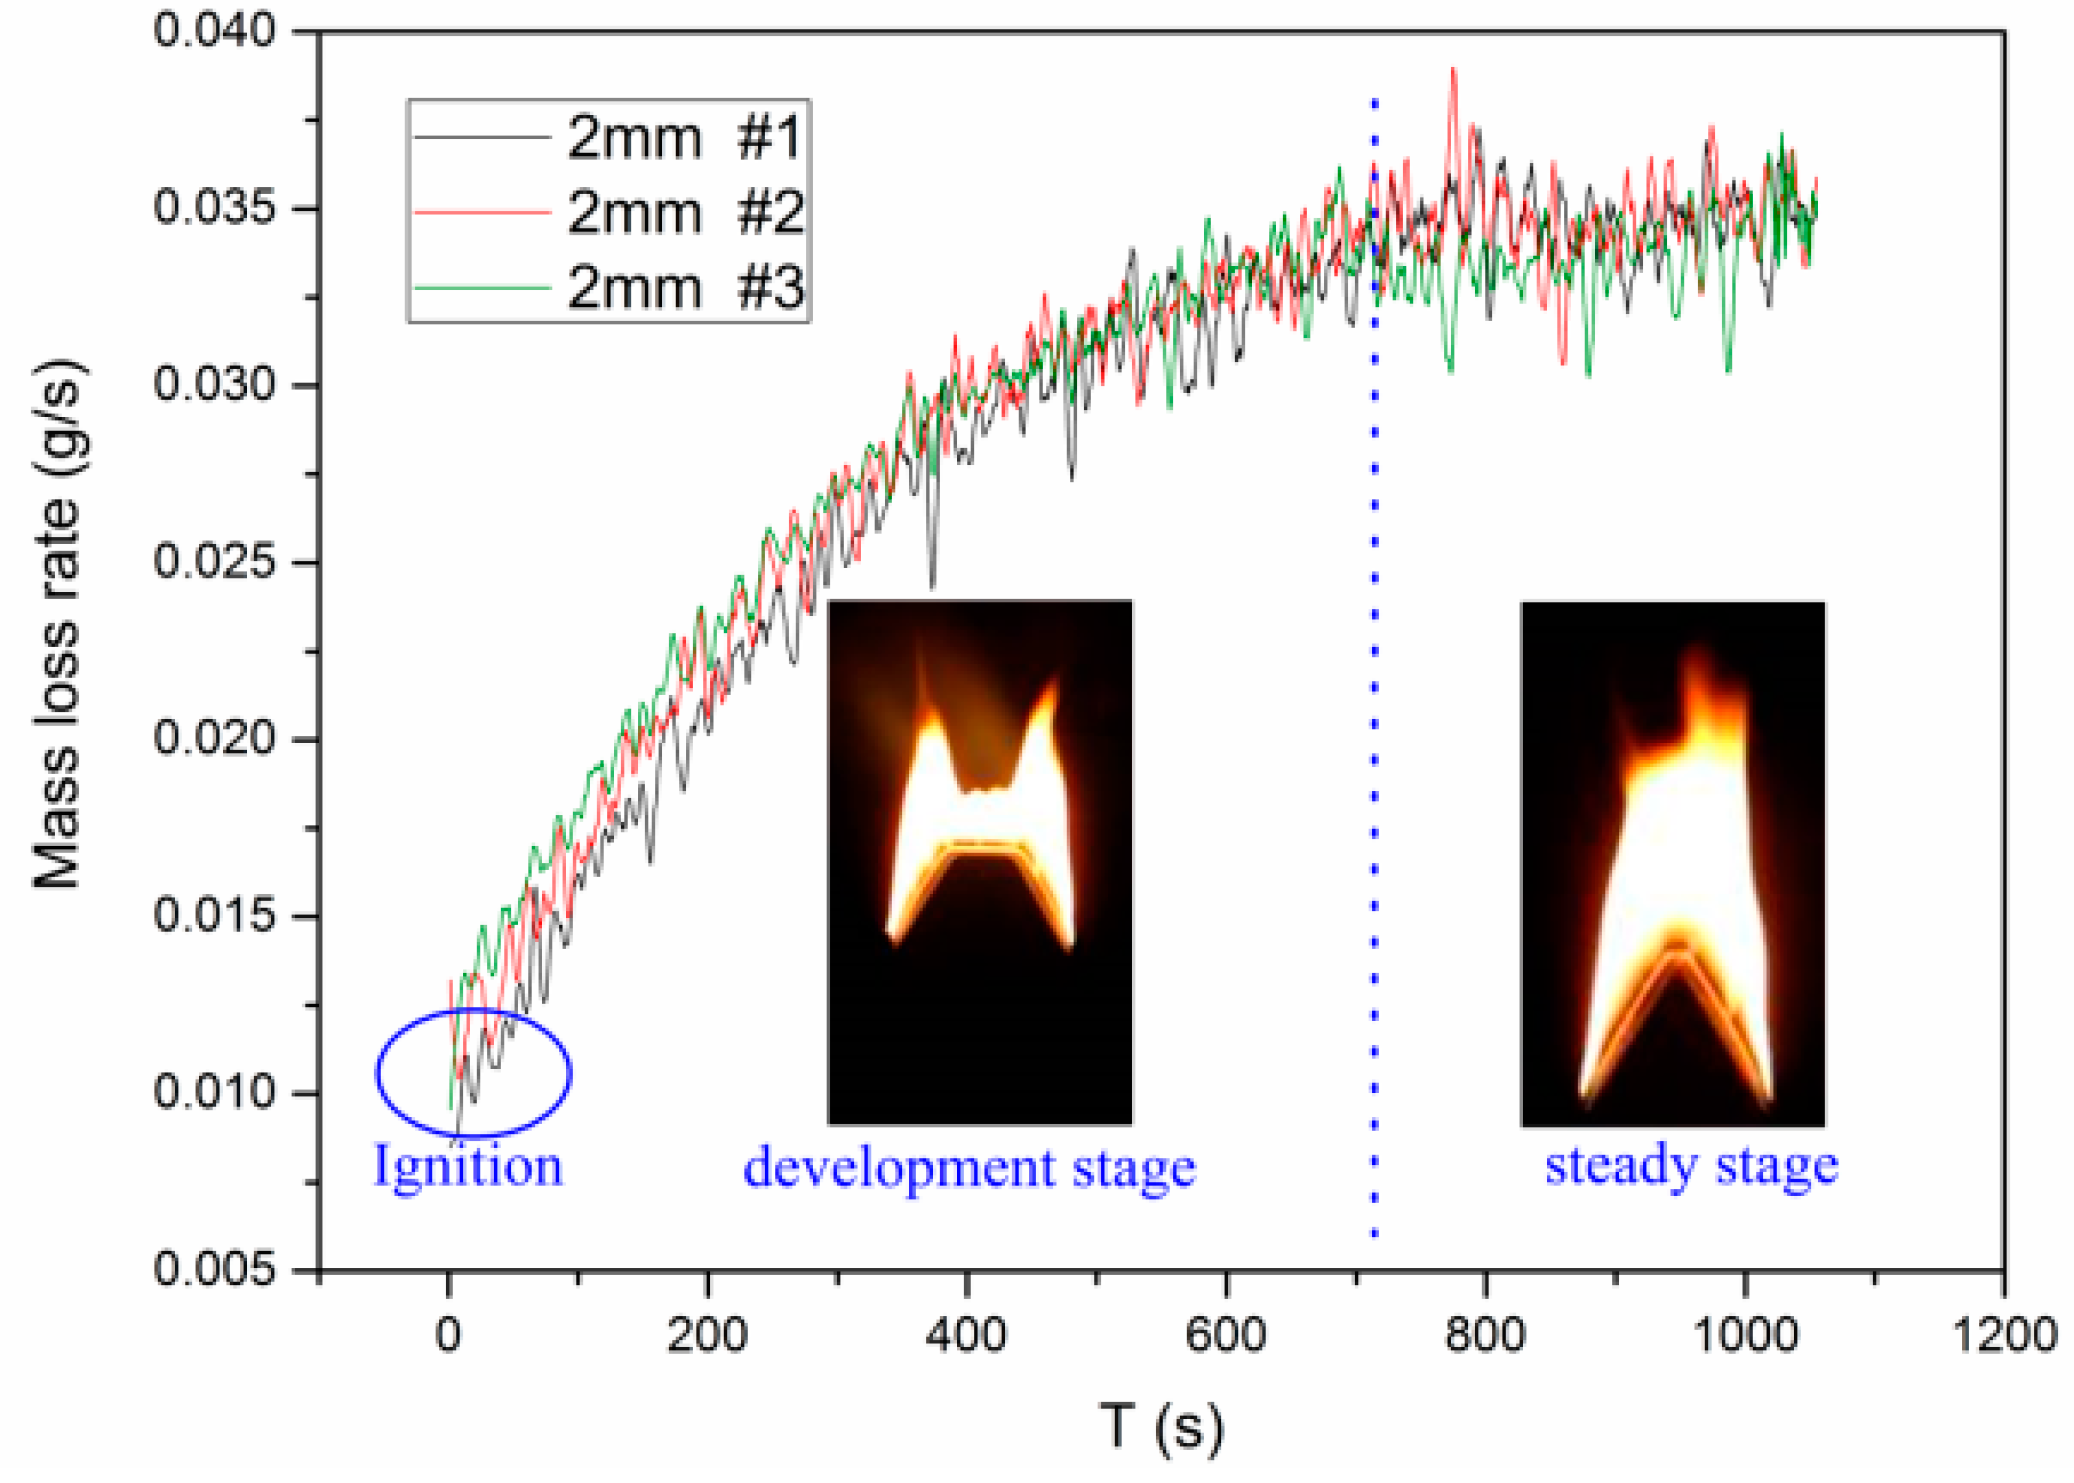
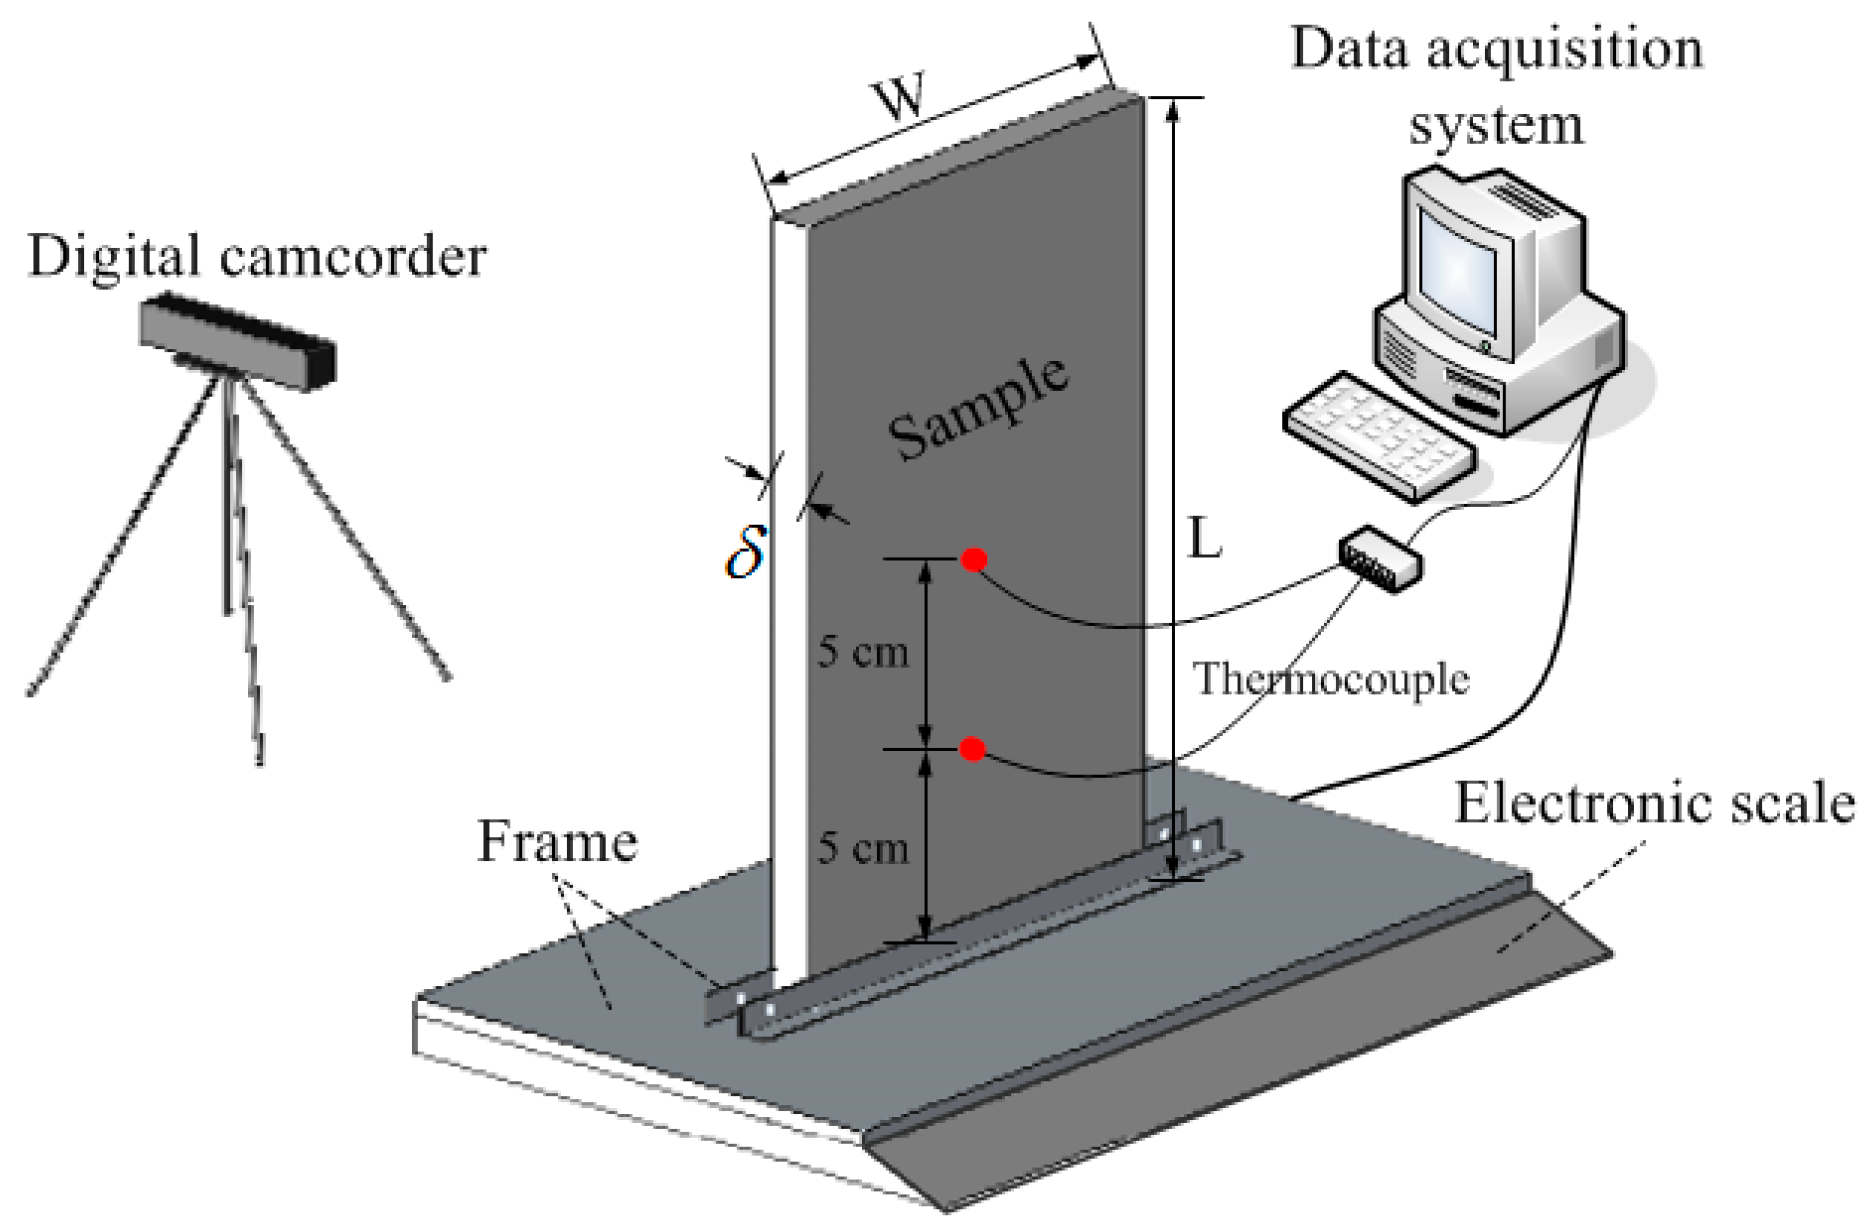
2. Experimental
3. Results and Discussion
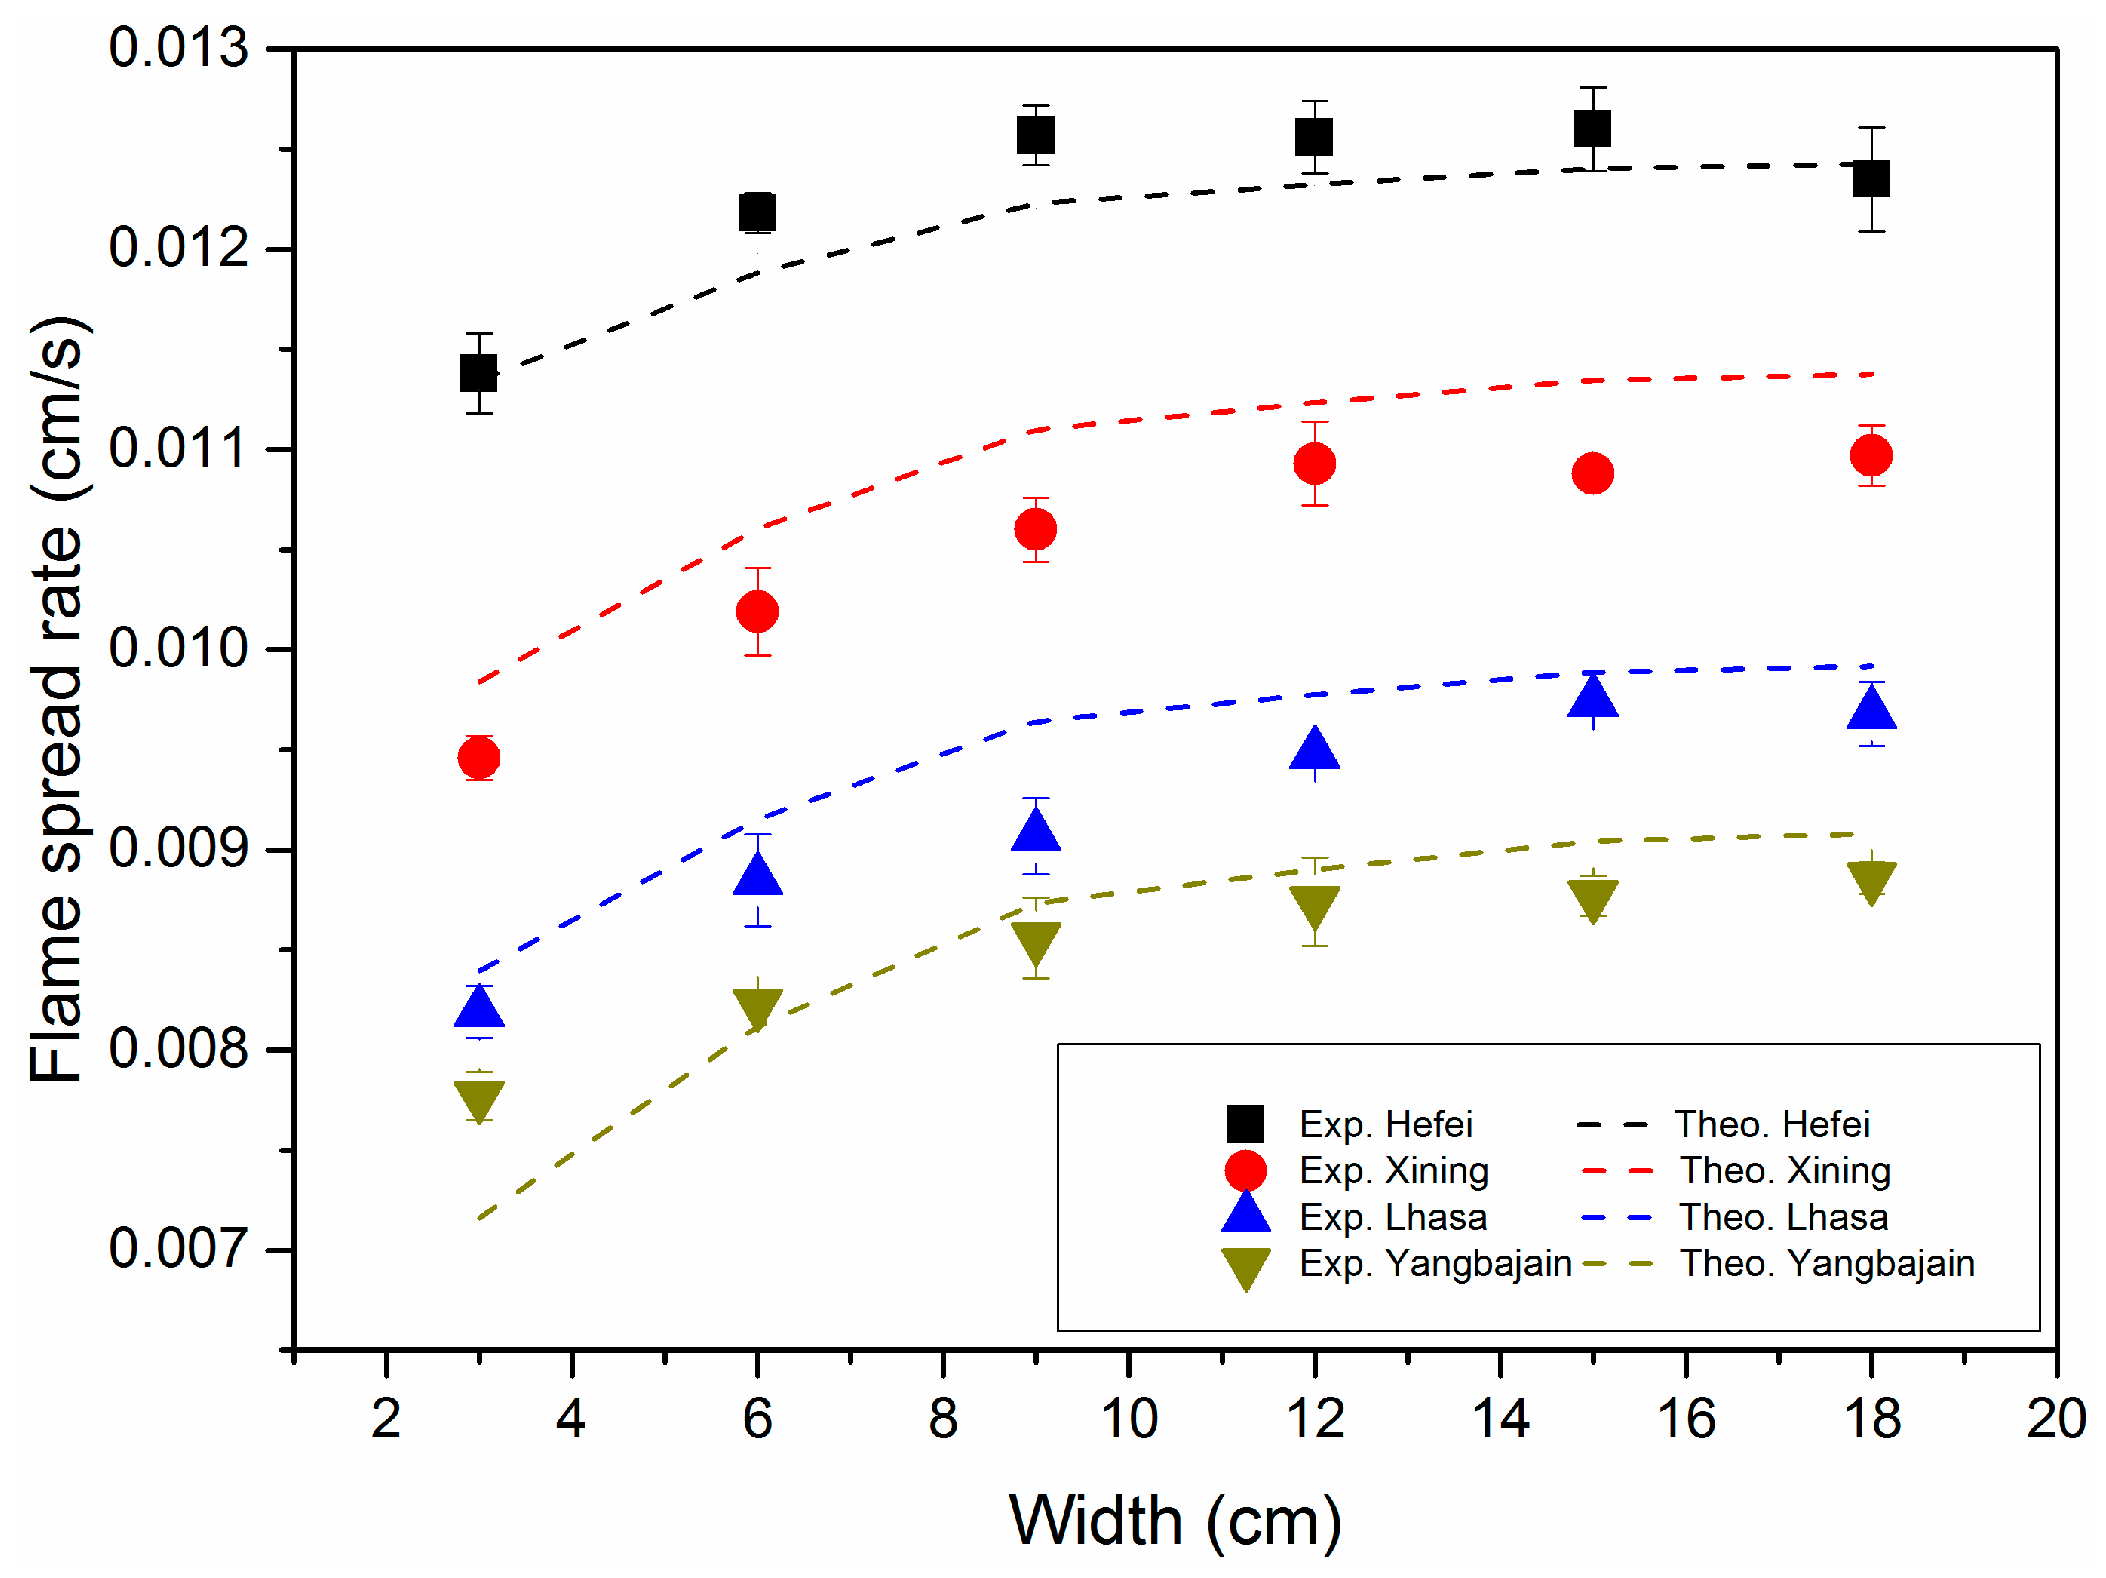
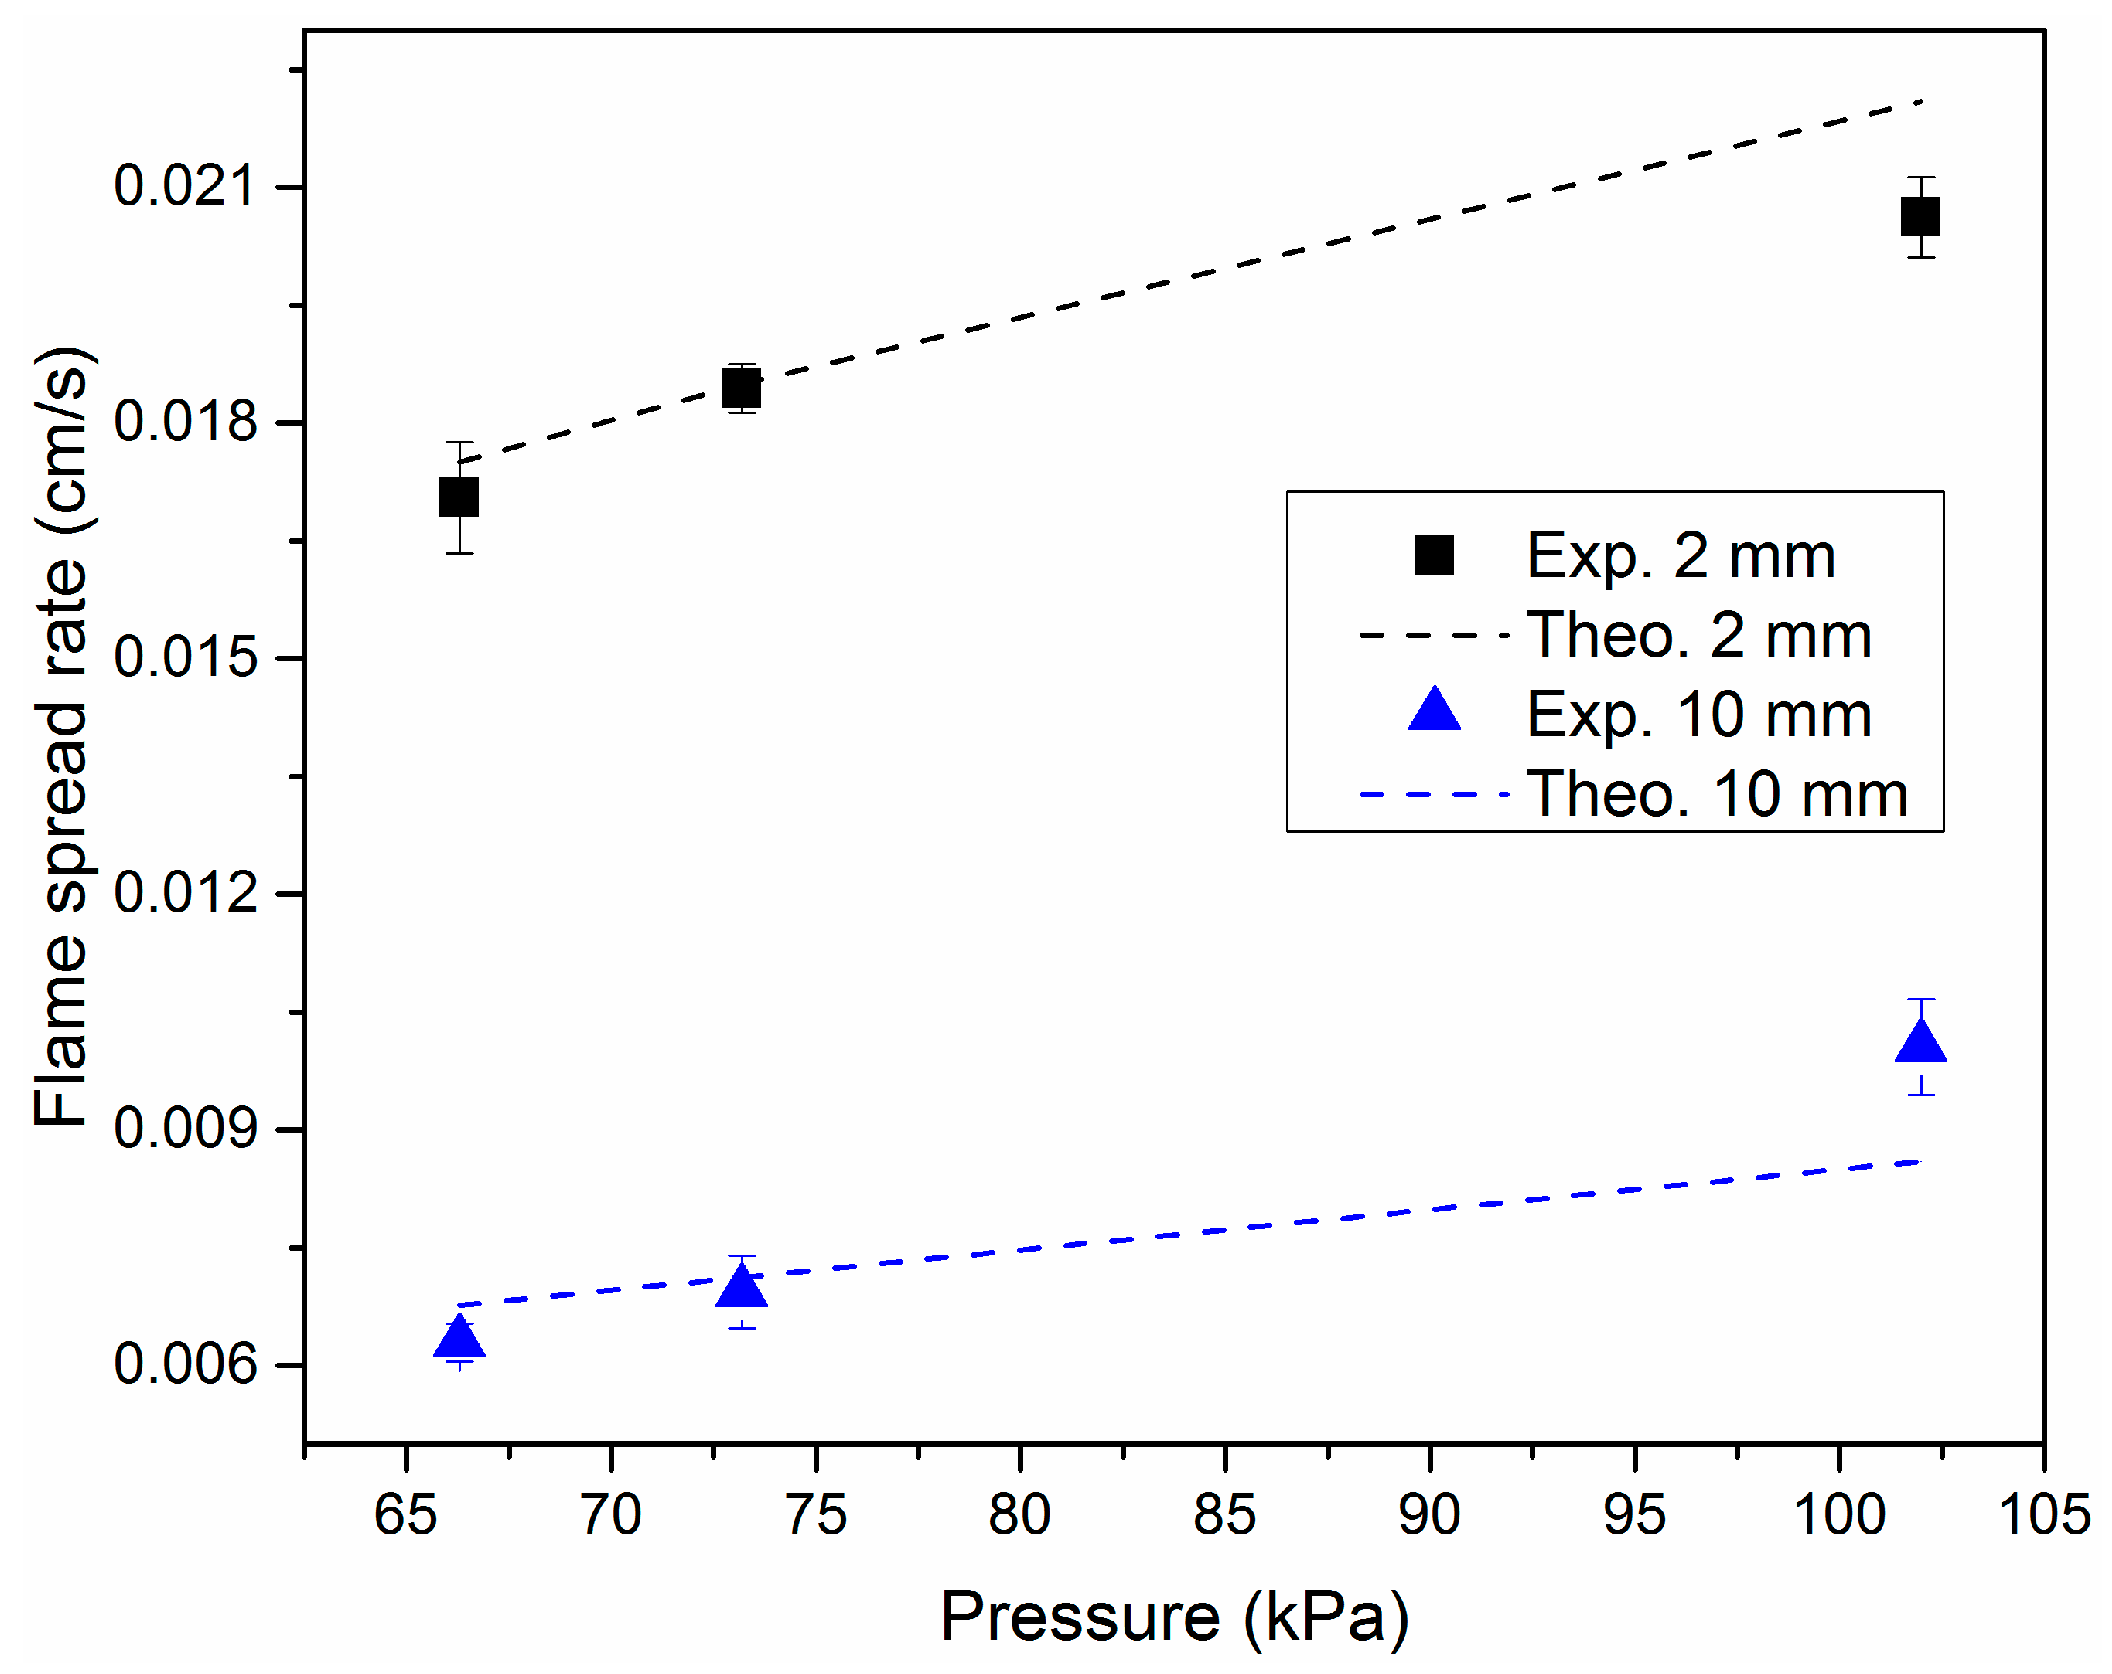
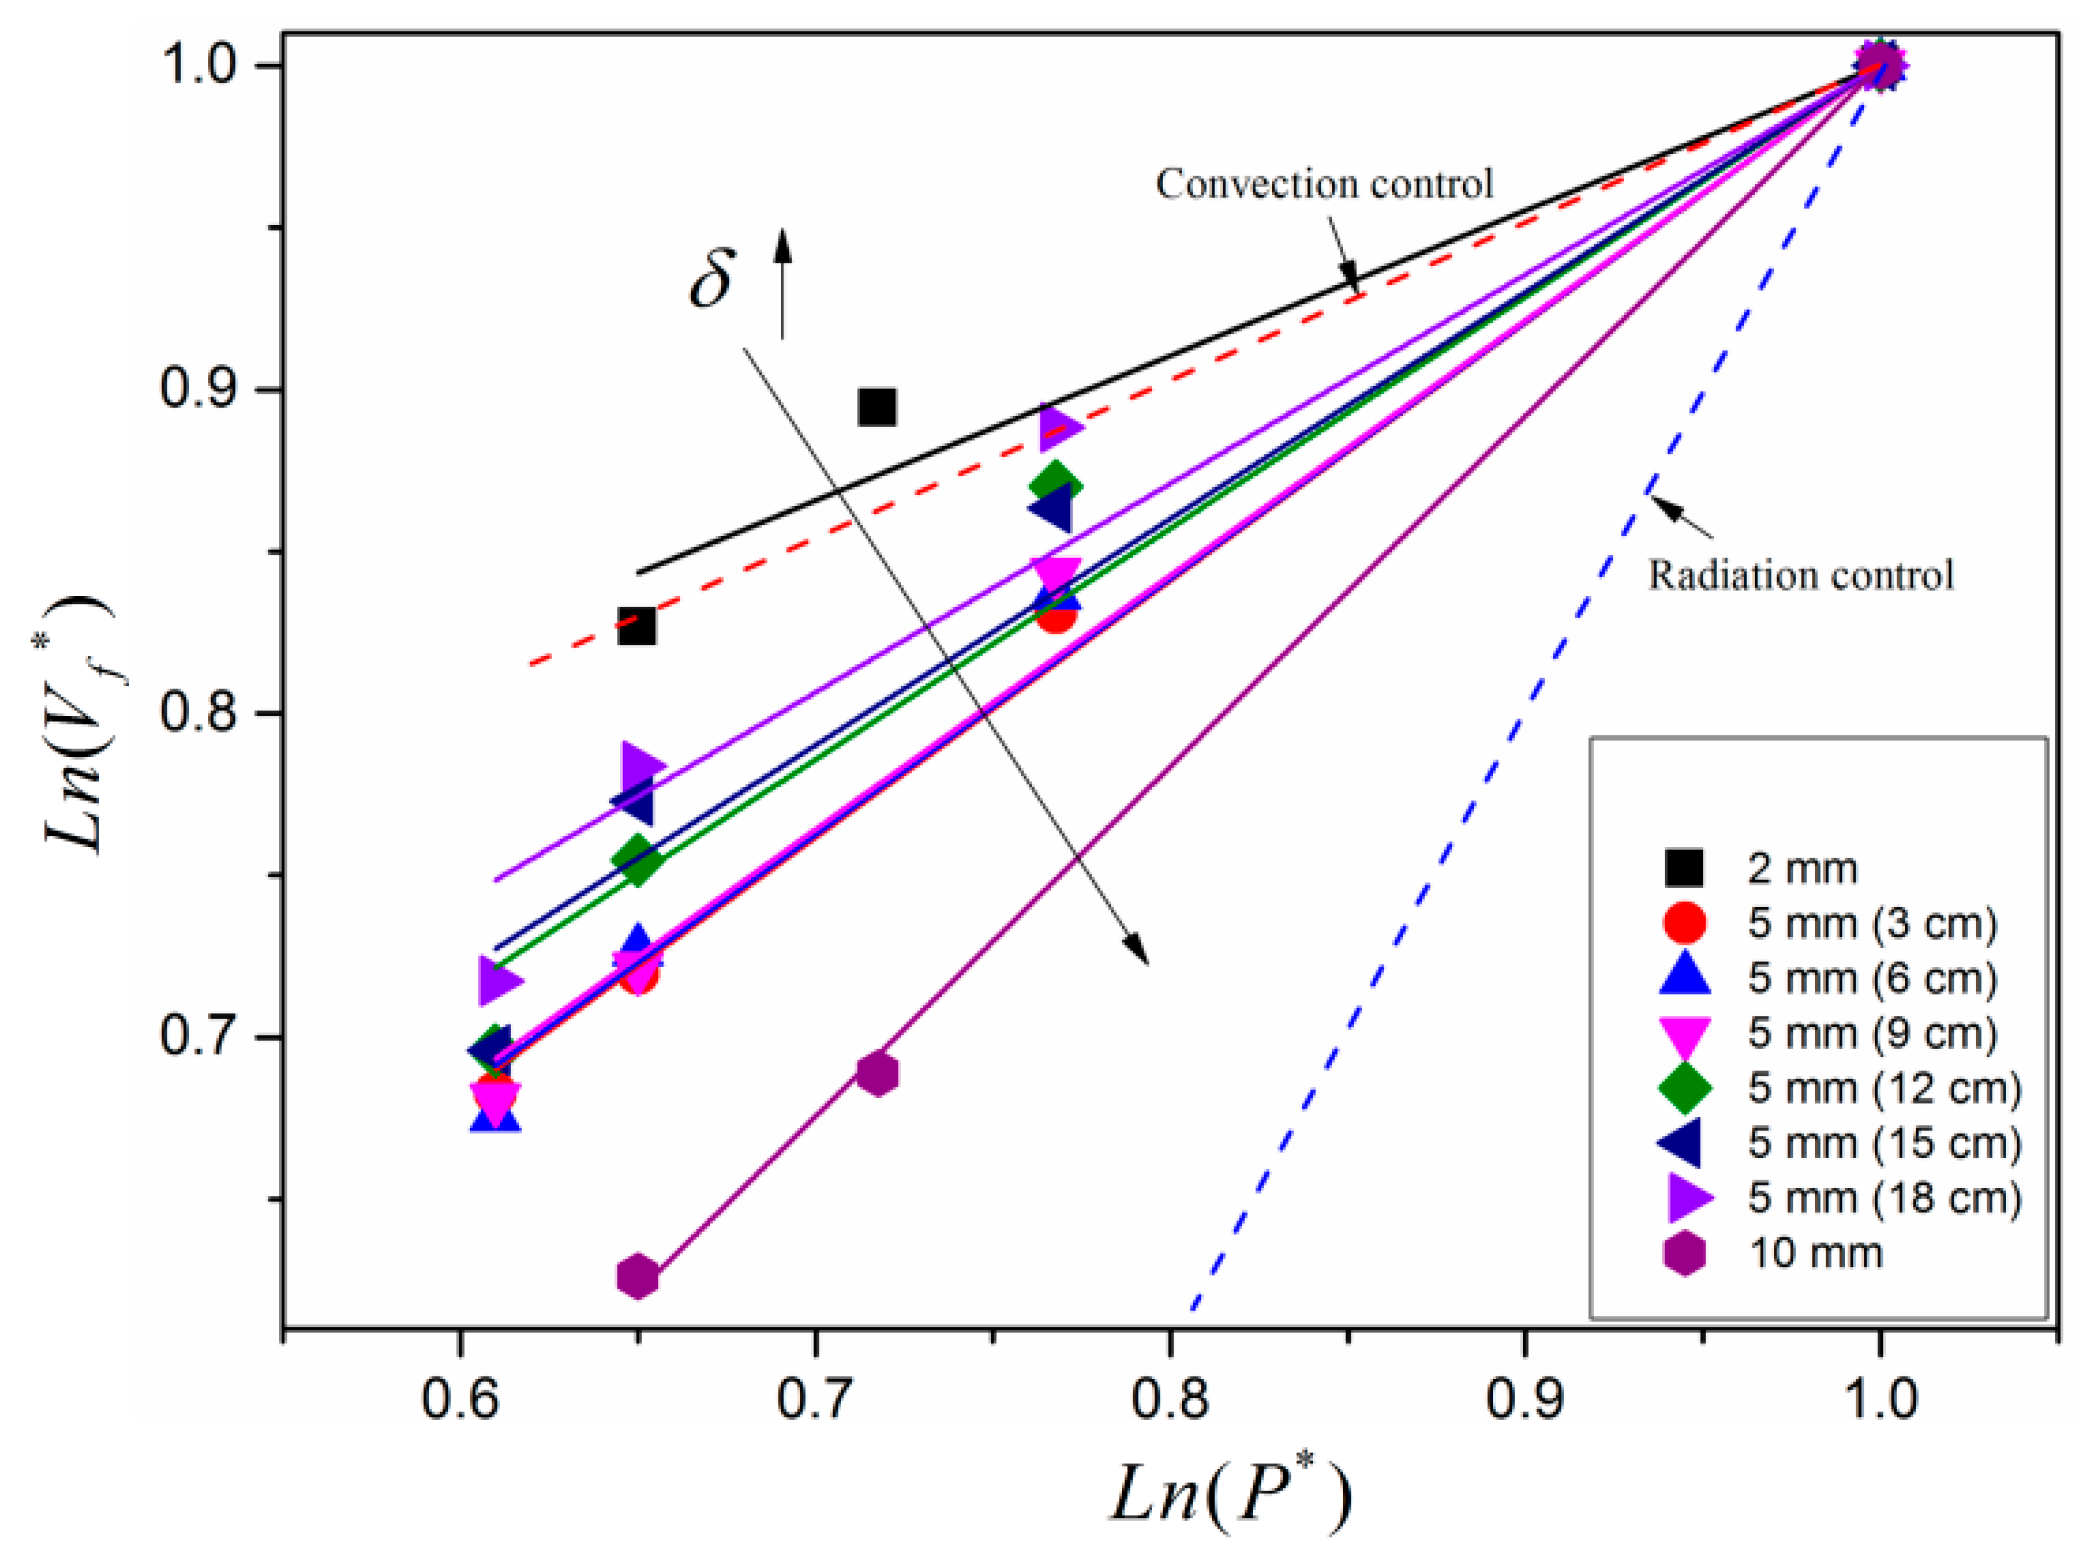
3.1. Prediction of Flame Spread Rate
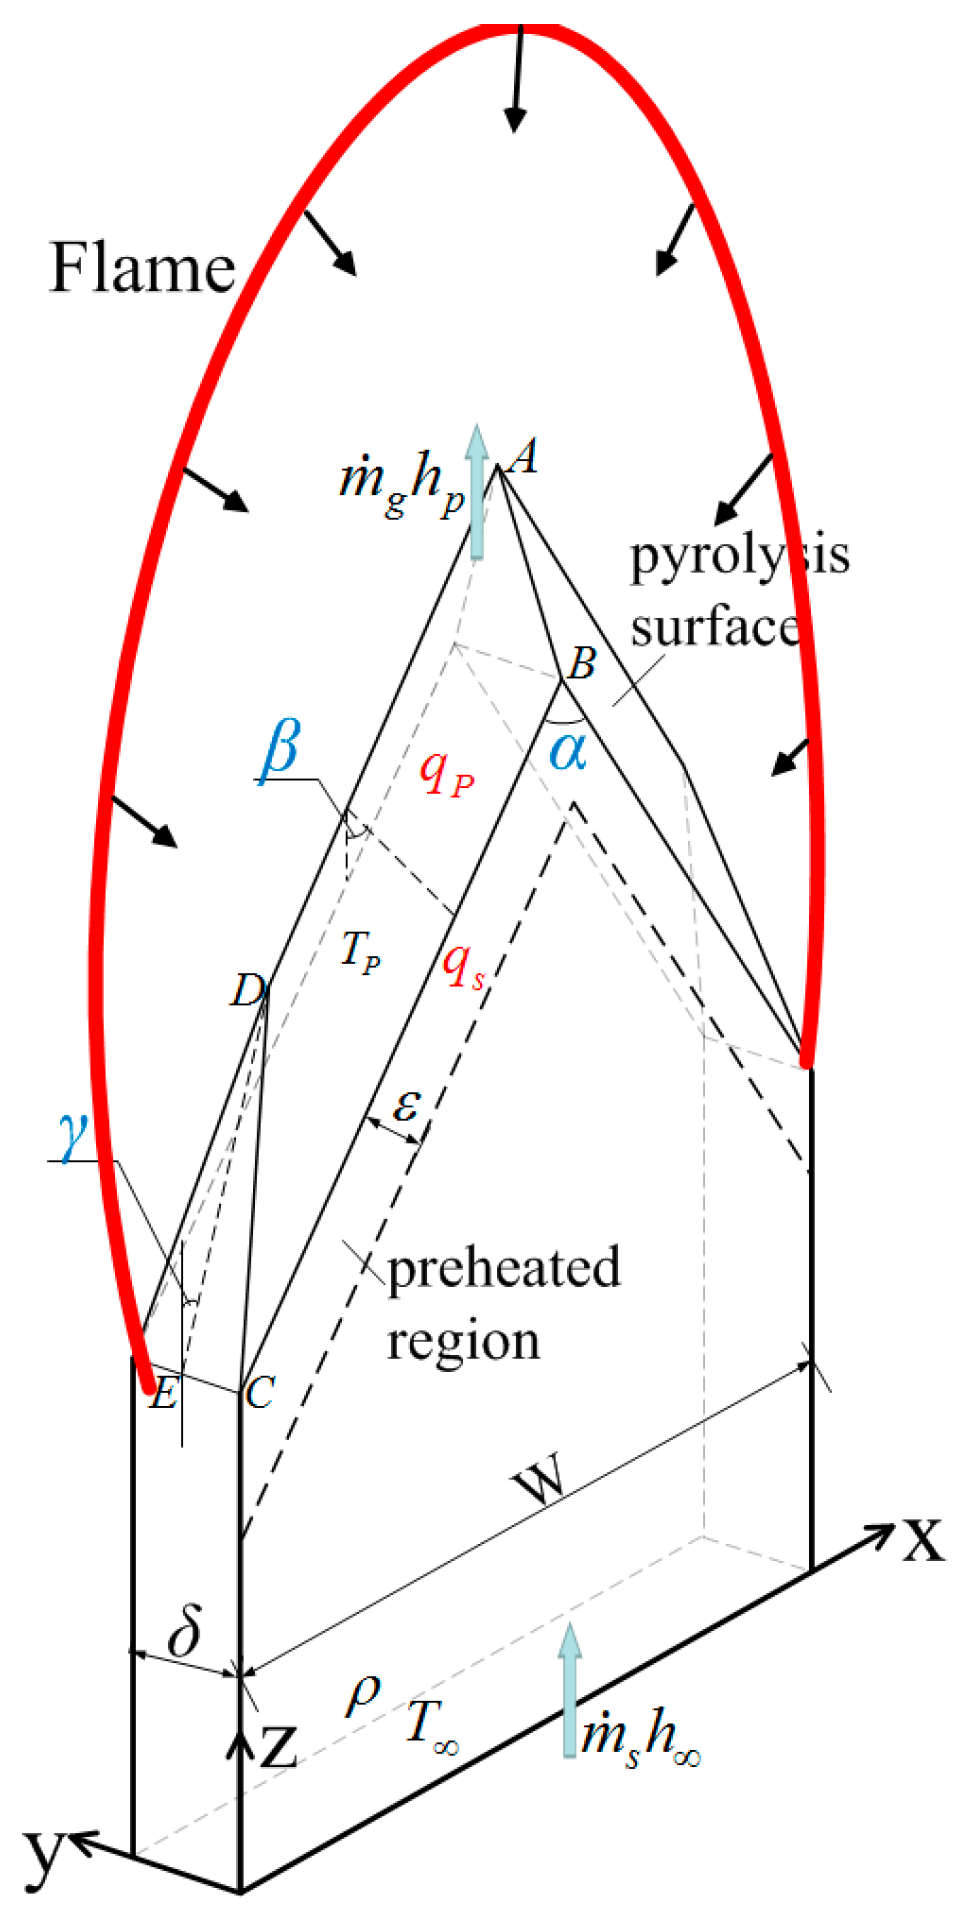
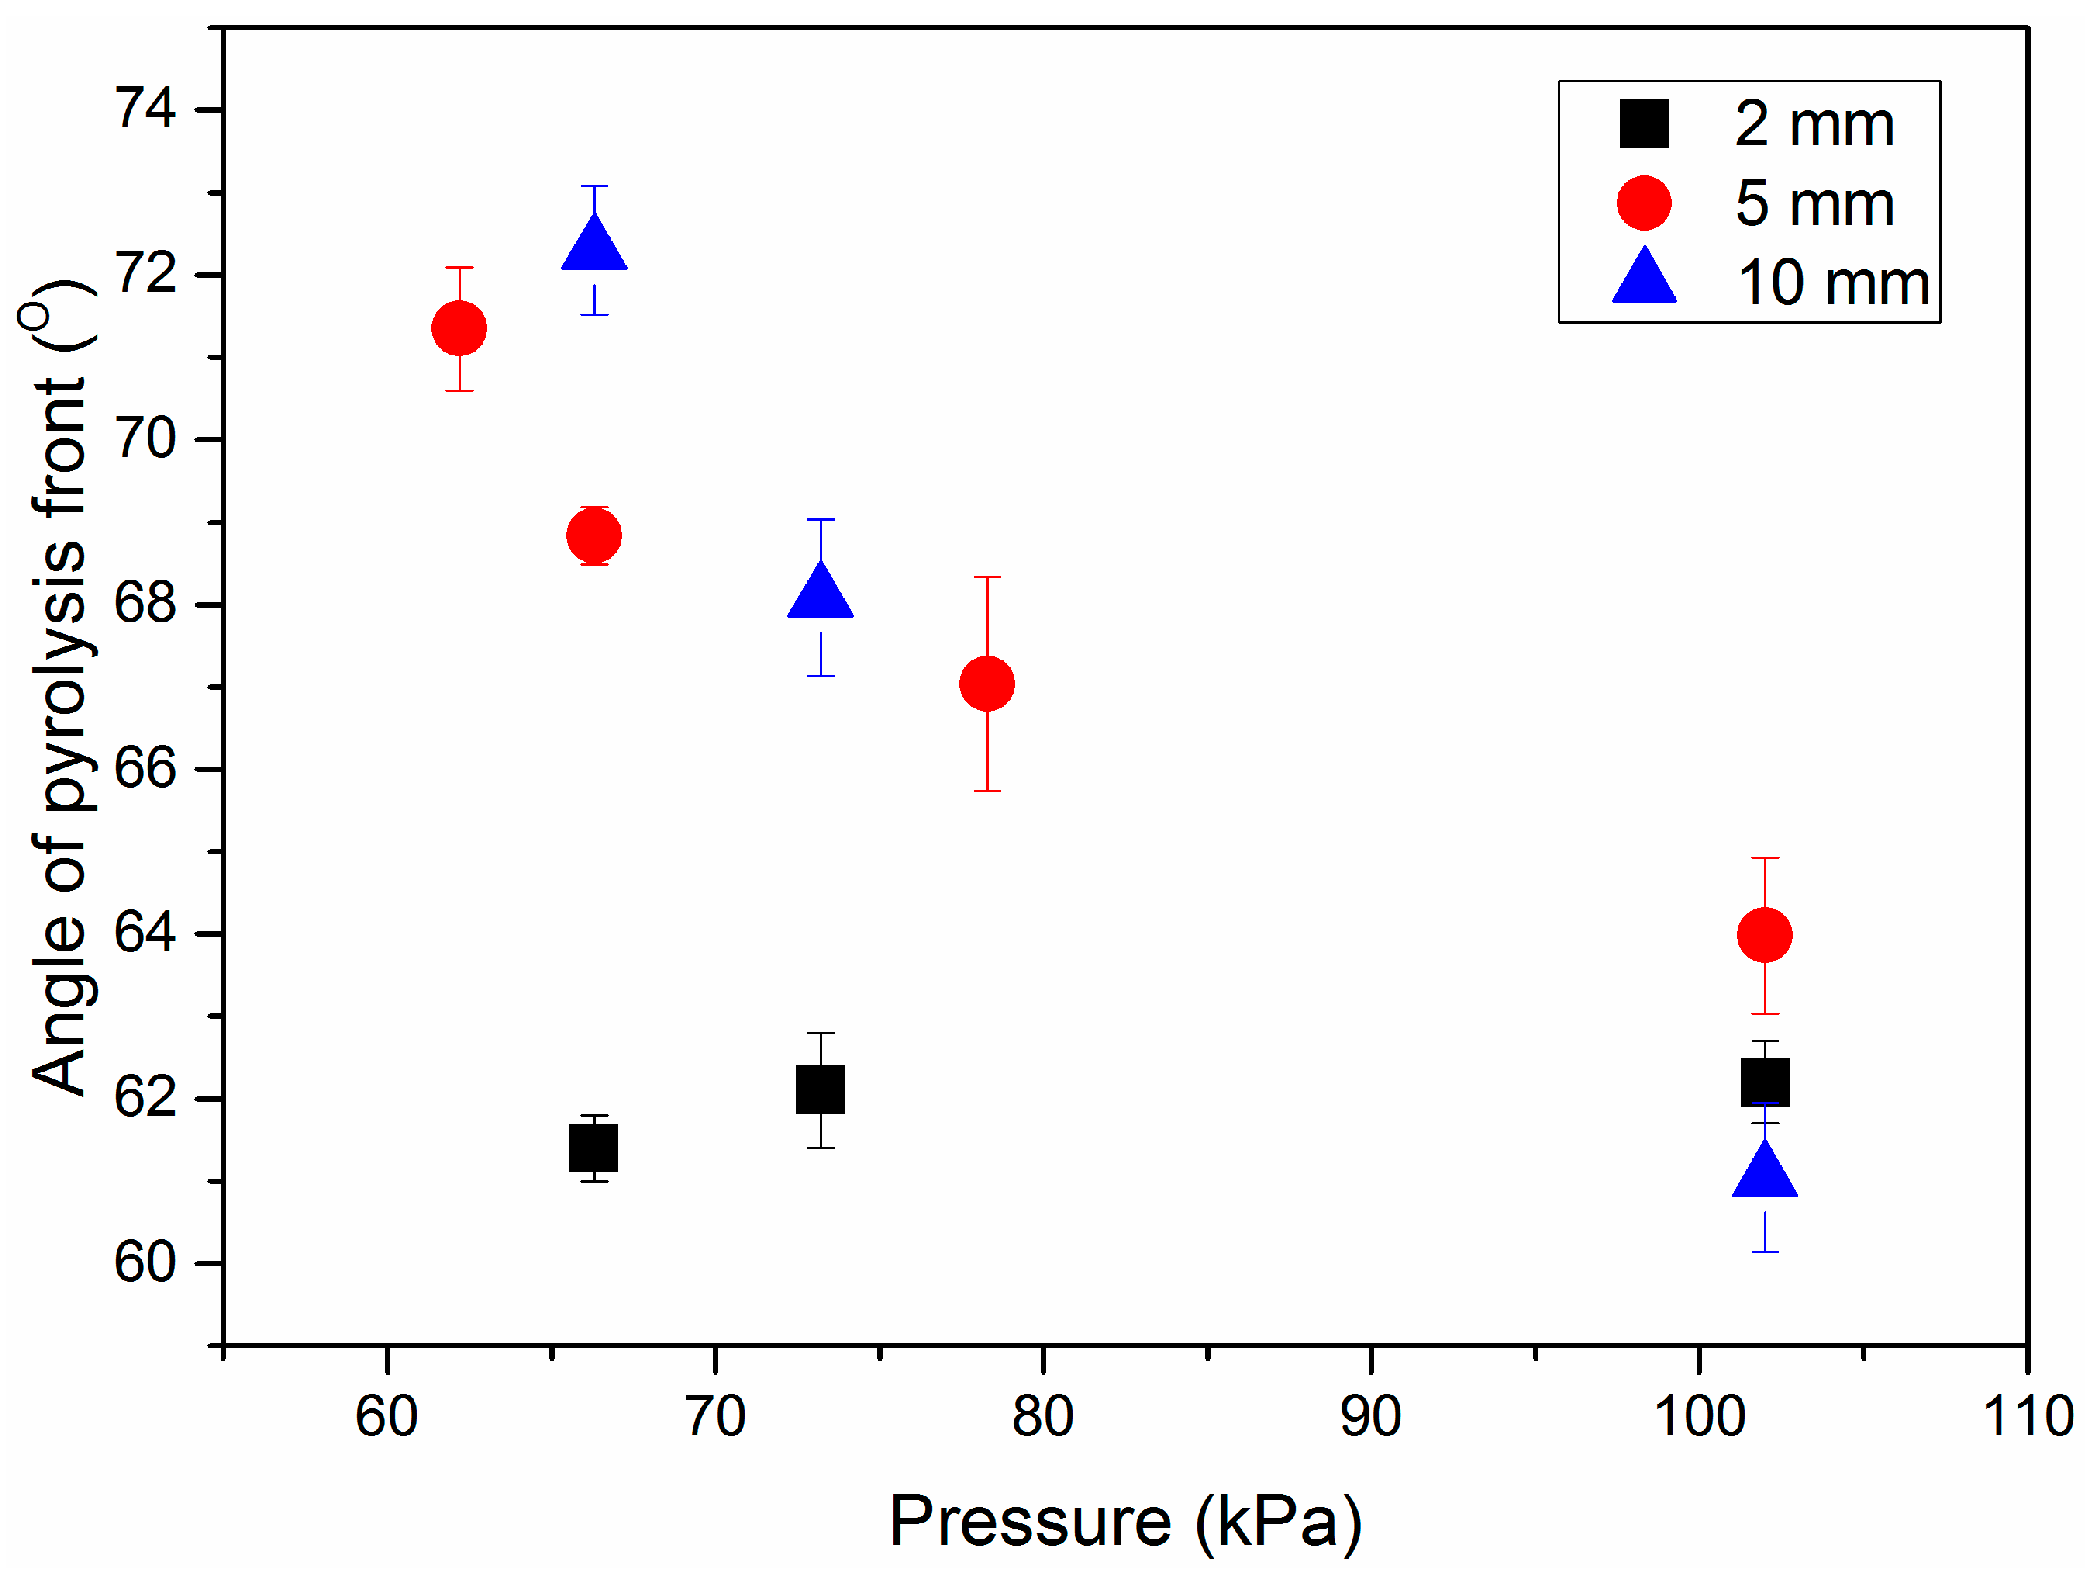
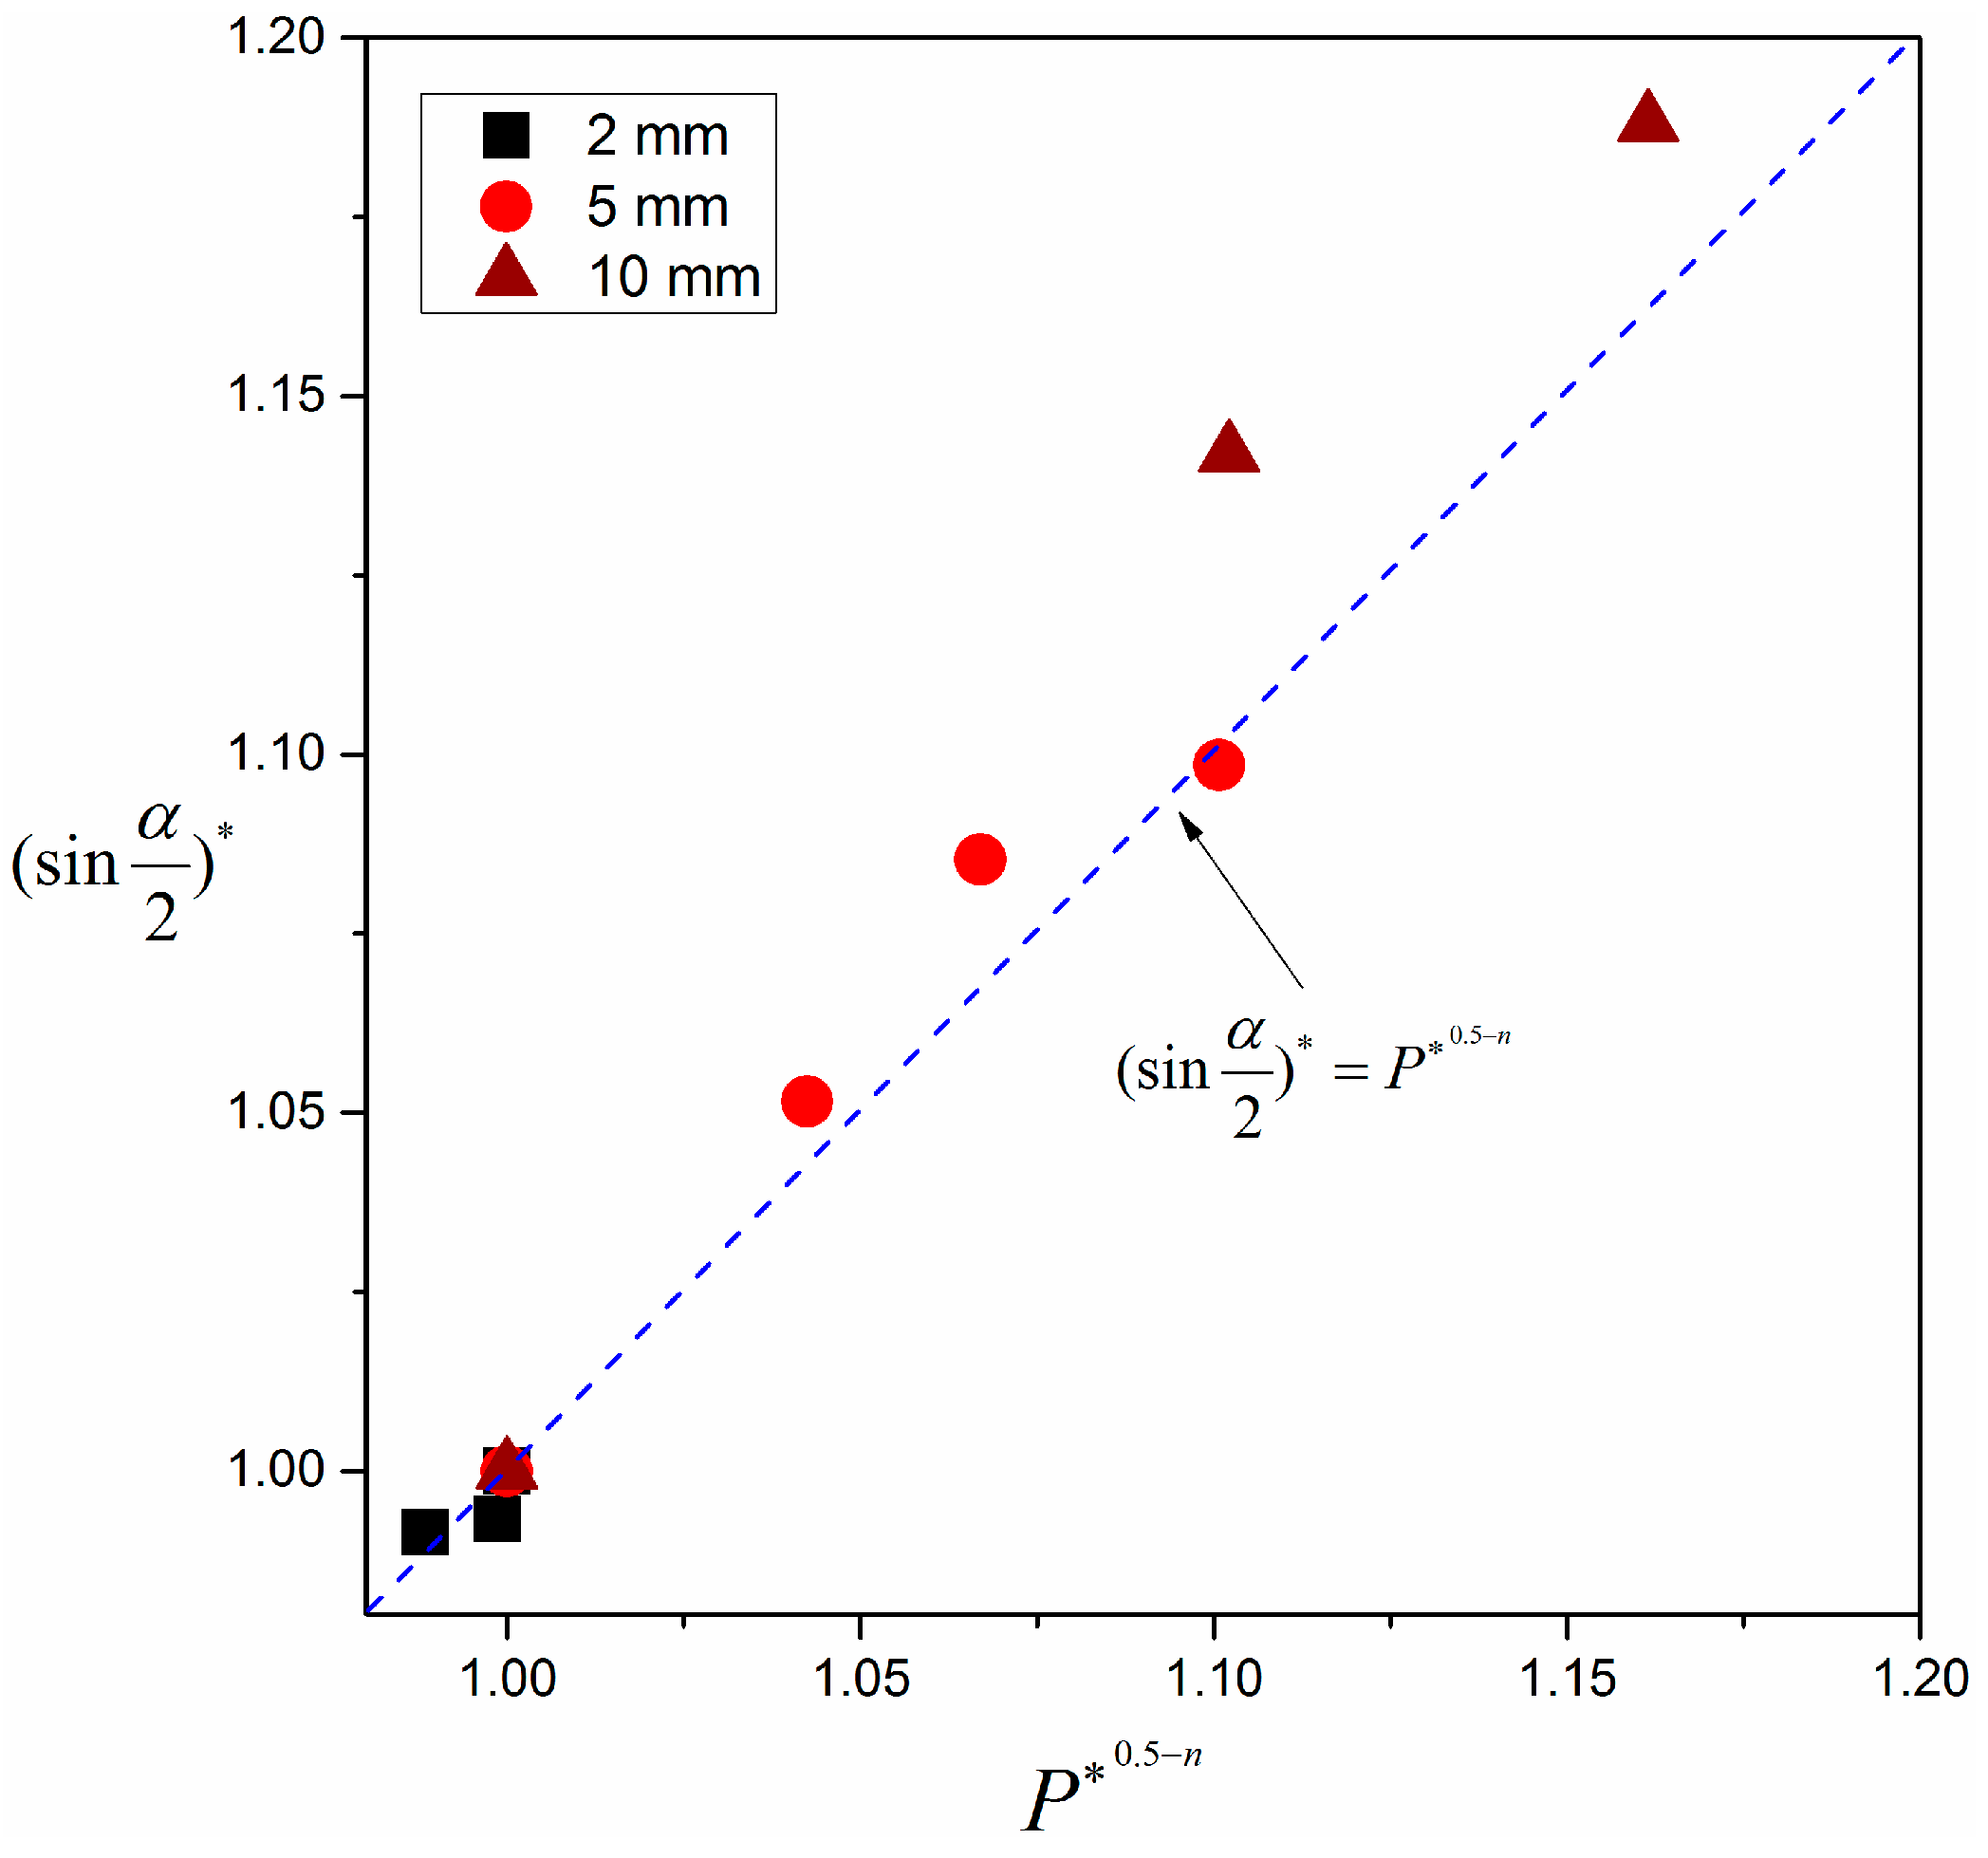
3.2. Prediction of Angle of Pyrolysis Front
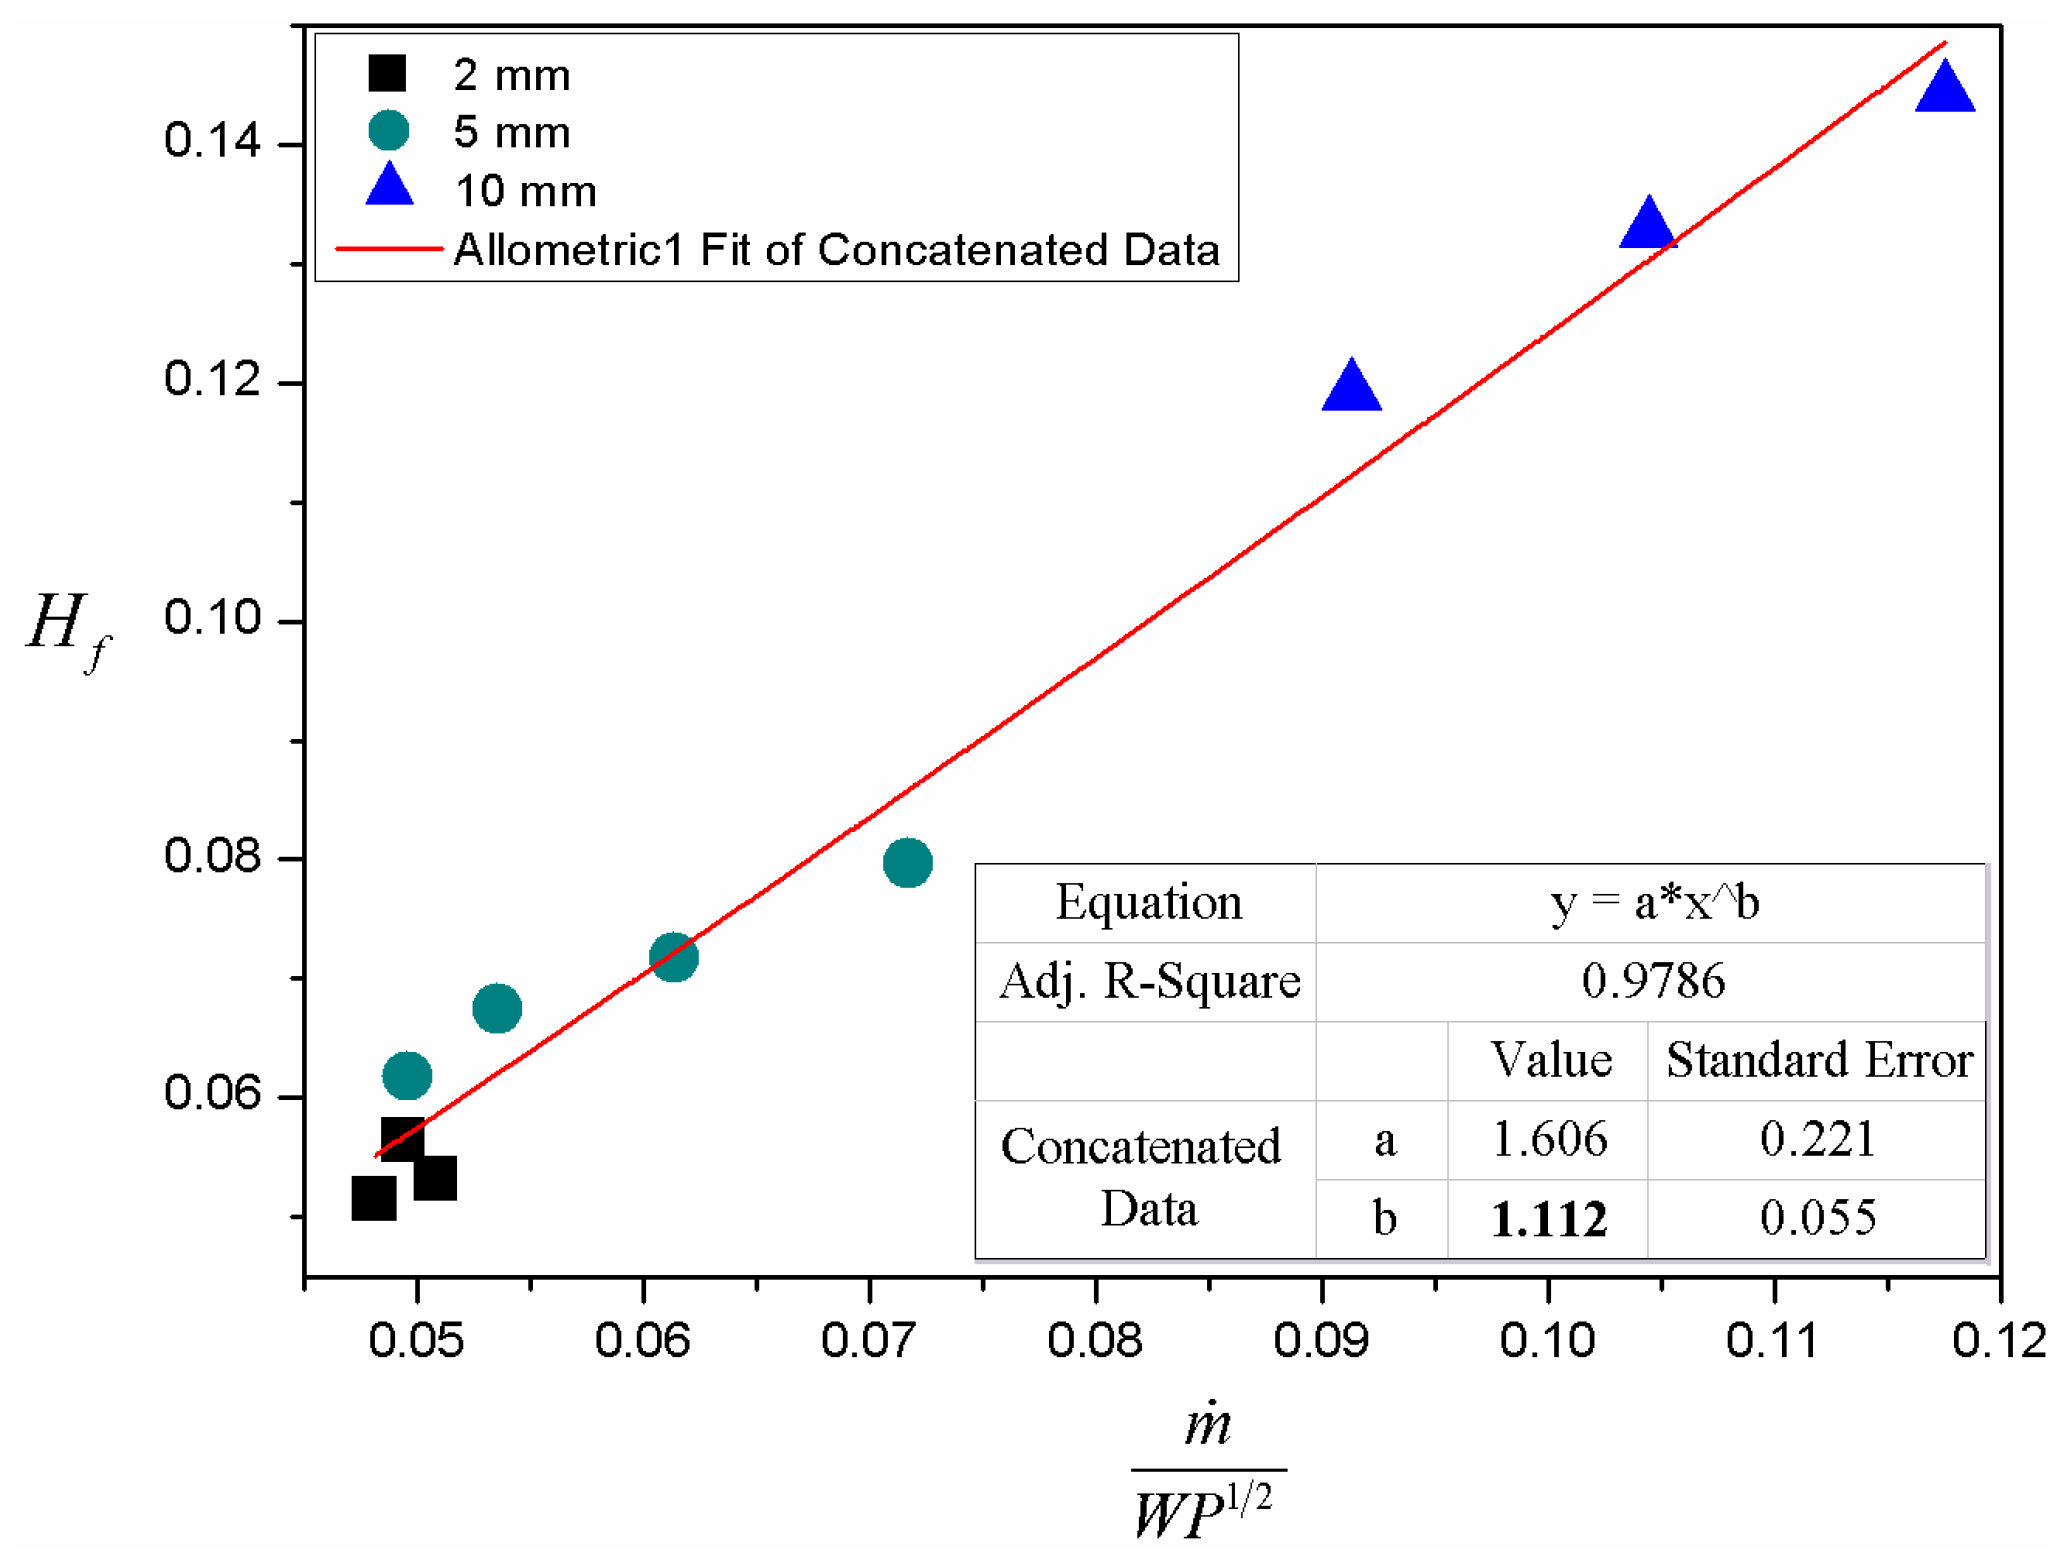
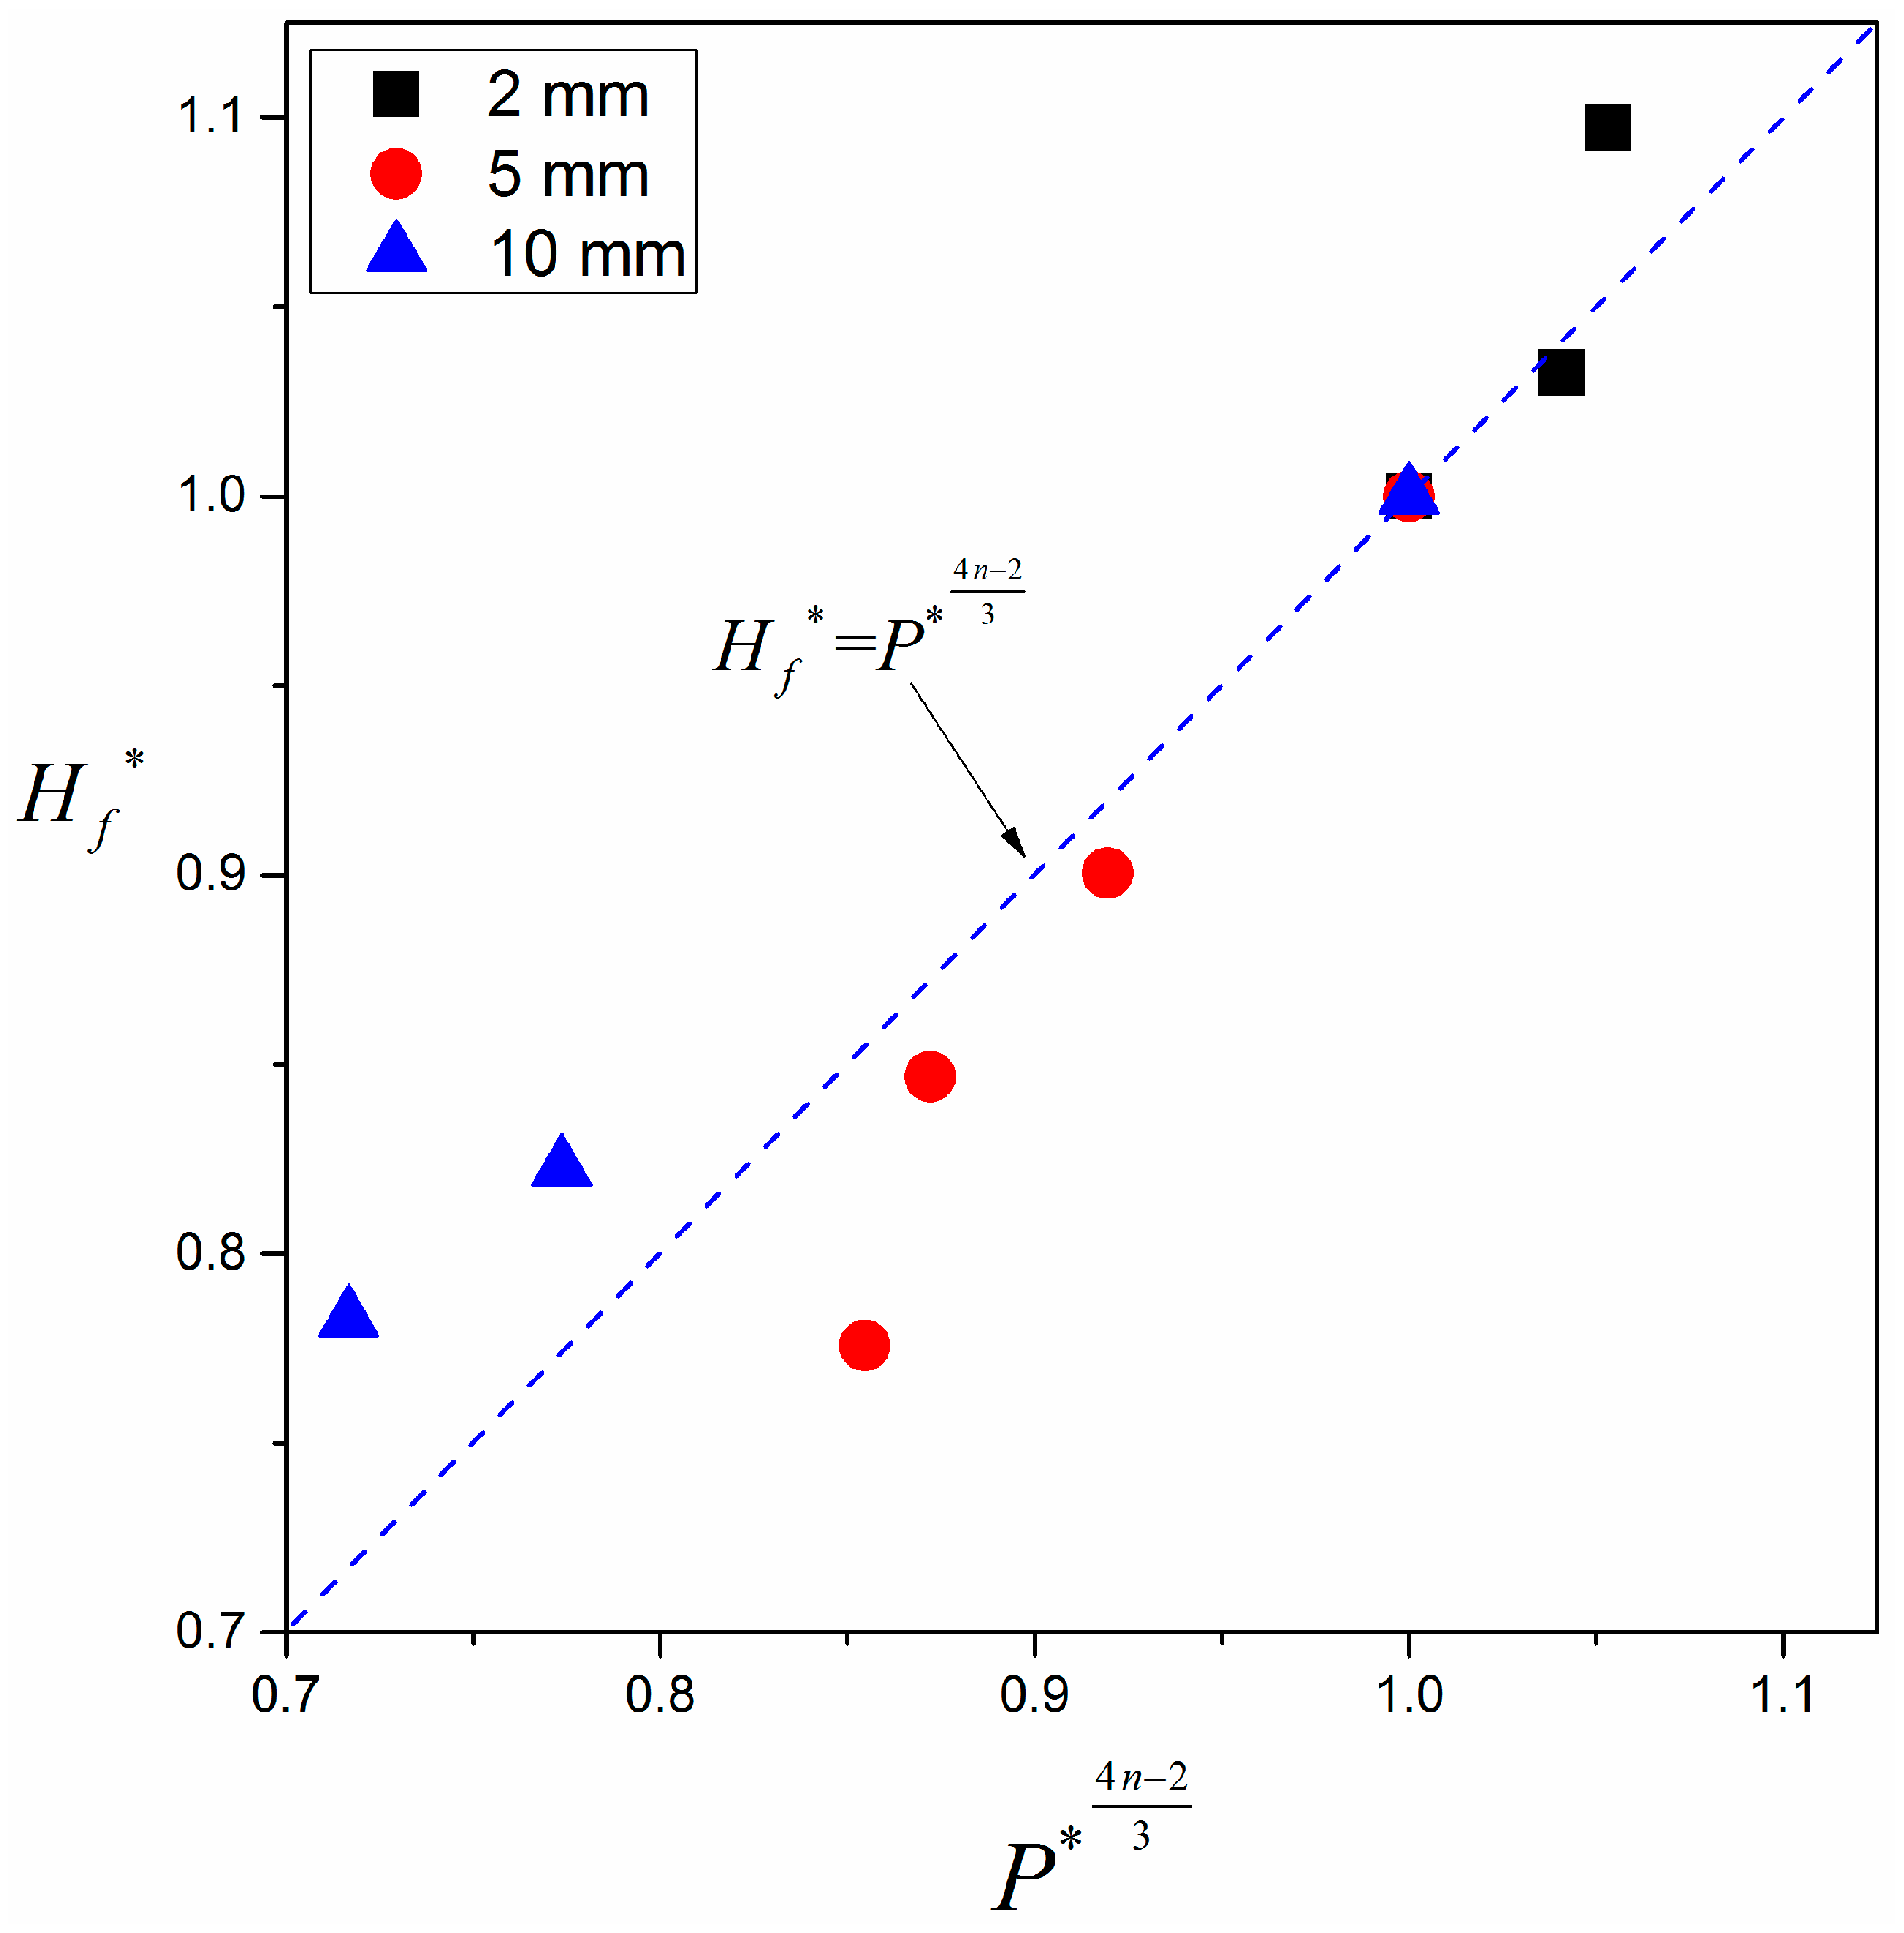
3.3. Prediction of Averaged Flame Height
4. Conclusions
- Heat fluxes at the pyrolysis surface and preheated region increase exponentially with pressure, with exponents of 1/2 and 2/3, respectively. Through the established 3-D theoretical model and heat flux distributions, flame spread rate in different pressure environments was predicted successfully. In addition, it was found that flame spread rate was exponentially proportional to pressure, approximately. The fitted exponent increases with sample thickness. However, it merely changes with sample width.
- The changing trends of angle of the pyrolysis front with pressure for samples with different thicknesses are distinctly different. For the 2 mm sample, the angle of the pyrolysis front hardly changed with pressure. In contrast, for a larger sample width, this angle decreases significantly with increasing pressure, which in turn will increase the length of the burning region. Through the derived correlation of 3-D flame spread rate, a normalized formula for the angle of the pyrolysis front with pressure was proposed, , which coincided well with experimental results in this study.
- A power-law dependence of averaged flame height on mass burning rate, sample dimension and ambient pressure in downward flame spread was presented based on laminar diffusion theory and confirmed through experimental results. The fitted exponent is 1.11, basically consistent with the theoretical result. In addition, a normalized correlation of flame height with pressure was proposed as well, .
Acknowledgments
Author Contributions
Conflicts of Interest
References
- De Ris, J. Spread of a laminar diffusion flame. Symp. Int. Combust. 1969, 12, 241–252. [Google Scholar] [CrossRef]
- Creeden, J.V., Jr.; Sibulkin, M. The effect of an uninhibited edge on downward flame propagation. Combust. Sci. Technol. 1976, 14, 123–124. [Google Scholar] [CrossRef]
- Fernandez-Pello, A.; Williams, F. A theory of laminar flame spread over flat surfaces of solid combustibles. Combust. Flame 1977, 28, 251–277. [Google Scholar] [CrossRef]
- Frey, A.E.; T’ien, J.S. A theory of flame spread over a solid fuel including finite-rate chemical kinetics. Combust. Flame 1979, 36, 263–289. [Google Scholar] [CrossRef]
- Altenkirch, R.; Eichhorn, R.; Shang, P. Buoyancy effects on flames spreading down thermally thin fuels. Combust. Flame 1980, 37, 71–83. [Google Scholar] [CrossRef]
- Fernandez—Pello, A. Flame spread modeling. Combust. Sci. Technol. 1984, 39, 119–134. [Google Scholar] [CrossRef]
- Ito, A.; Kashiwagi, T. Characterization of flame spread over PMMA using holographic interferometry sample orientation effects. Combust. Flame 1988, 71, 189–204. [Google Scholar] [CrossRef]
- Delichatsios, M.A. Creeping flame spread: Energy balance and application to practical materials. Symp. Int. Combust. 1996, 26, 1495–1503. [Google Scholar] [CrossRef]
- Delichatsios, M. Relation of opposed flow (creeping) flame spread with extinction/ignition. Combust. Flame 2003, 135, 441–447. [Google Scholar] [CrossRef]
- Ayani, M.; Esfahani, J.; Mehrabian, R. Downward flame spread over PMMA sheets in quiescent air: Experimental and theoretical studies. Fire Saf. J. 2006, 41, 164–169. [Google Scholar] [CrossRef]
- Mamourian, M.; Abolfazli Esfahani, J.; Ayani, M.B. Experimental investigation of the effect of the solid fuel dimensions on the downward flame spread. Kuwait J. Sci. Eng. 2009, 36, 183–200. [Google Scholar]
- Comas, B.; Pujol, T. Experimental study of the effects of side-edge burning in the downward flame spread of thin solid fuels. Combust. Sci. Technol. 2012, 184, 489–504. [Google Scholar] [CrossRef]
- Gong, J.; Zhou, X.; Deng, Z.; Yang, L. Influences of low atmospheric pressure on downward flame spread over thick PMMA slabs at different altitudes. Int. J. Heat Mass Transfer 2013, 61, 191–200. [Google Scholar] [CrossRef]
- Zhao, K.; Zhou, X.; Yang, L.; Gong, J.; Wu, Z.; Huan, Z.; Liu, X. Width effects on downward flame spread over poly(methyl methacrylate) sheets. J. Fire Sci. 2015, 33, 69–84. [Google Scholar] [CrossRef]
- Pujol, T.; Comas, B. Analytical expressions for the flame front speed in the downward combustion of thin solid fuels and comparison to experiments. Phys. Rev. E 2011, 84, 026306. [Google Scholar] [CrossRef] [PubMed]
- Comas, B.; Pujol, T. Flame front speed and onset of instability in the burning of inclined thin solid fuel samples. Phys. Rev. E 2013, 88, 063019. [Google Scholar] [CrossRef] [PubMed]
- Leventon, I.T.; Li, J.; Stoliarov, S.I. A flame spread simulation based on a comprehensive solid pyrolysis model coupled with a detailed empirical flame structure representation. Combust. Flame 2015, 162, 3884–3895. [Google Scholar] [CrossRef]
- Fernandez-Pello, A.; Williams, F. Laminar flame spread over PMMA surfaces. Symp. Int. Combust. 1975, 15, 217–231. [Google Scholar] [CrossRef]
- Fernandez-Pello, A.; Ray, S.; Glassman, I. Downward flame spread in an opposed forced flow. Combust. Sci. Technol. 1978, 19, 19–30. [Google Scholar] [CrossRef]
- Delichatsios, M.A. Turbulent convective flows and burning on vertical walls. Symp. Int. Combust. 1982, 19, 855–868. [Google Scholar] [CrossRef]
- Dellchatsios, M.A. Flame heights in turbulent wall fires with significant flame radiation. Combust. Sci. Technol. 1984, 39, 195–214. [Google Scholar] [CrossRef]
- Tewarson, A.; Ogden, S. Fire behavior of polymethylmethacrylate. Combust. Flame 1992, 89, 237–259. [Google Scholar] [CrossRef]
- Tsai, C.; Drysdale, D. Flame height correlation and upward flame spread modelling. Fire Mater. 2002, 26, 279–287. [Google Scholar] [CrossRef]
- Gollner, M.; Williams, F.; Rangwala, A. Upward flame spread over corrugated cardboard. Combust. Flame 2011, 158, 1404–1412. [Google Scholar] [CrossRef]
- Fernandez-Pello, A.; Hirano, T. Controlling mechanisms of flame spread. Combust. Sci. Technol. 1983, 32, 1–31. [Google Scholar] [CrossRef]
- Mell, W.; Olson, S.; Kashiwagi, T. Flame spread along free edges of thermally thin samples in microgravity. Proc. Combust. Inst. 2000, 28, 2843–2849. [Google Scholar] [CrossRef]
- Gong, J.; Zhou, X.; Li, J.; Yang, L. Effect of finite dimension on downward flame spread over PMMA slabs: Experimental and theoretical study. Int. J. Heat Mass Transfer 2015, 91, 225–234. [Google Scholar] [CrossRef]
- Bergman, T.L.; Incropera, F.P.; DeWitt, D.P.; Lavine, A.S. Fundamentals of Heat and Mass Transfer; John Wiley & Sons: Hoboken, NJ, USA, 2011. [Google Scholar]
- Chen, C.-H.; T’ien, J.S. Diffusion flame stabilization at the leading edge of a fuel plate. Combust. Sci. Technol. 1986, 50, 283–306. [Google Scholar] [CrossRef]
- Chen, C.-H.; Hou, W.-H. Diffusion flame stabilization and extinction under naturally convective flows. Combust. Flame 1991, 83, 309–324. [Google Scholar] [CrossRef]
- Liang, C.; Cheng, X.; Yang, H.; Zhang, H.; Yuen, K.K. Effects of altitude and inclination on flame spread over poly(methyl methacrylate) slabs. J. Fire Sci. 2013. [Google Scholar] [CrossRef]
- Gong, J.; Chen, Y.; Jiang, J.; Yang, L.; Li, J. A numerical study of thermal degradation of polymers: Surface and in-depth absorption. Appl. Therm. Eng. 2016, 106, 1366–1379. [Google Scholar] [CrossRef]
- Quintiere, J.G. The effects of angular orientation on flame spread over thin materials. Fire Saf. J. 2001, 36, 291–312. [Google Scholar] [CrossRef]
- Glassman, I.; Yetter, R. Combustion, 4th ed.; Academic Press Inc. Ltd.: London, UK, 2008. [Google Scholar]
- Ali, S.M.; Raghavan, V.; Rangwala, A.S. A numerical study of quasi-steady burning characteristics of a condensed fuel: Effect of angular orientation of fuel surface. Combust. Theor. Model. 2010, 14, 495–518. [Google Scholar] [CrossRef]
- Hu, L.; Hu, J.; Liu, S.; Tang, W.; Zhang, X. Evolution of heat feedback in medium pool fires with cross air flow and scaling of mass burning flux by a stagnant layer theory solution. Proc. Combust. Inst. 2015, 35, 2511–2518. [Google Scholar] [CrossRef]
- Tang, W.; Miller, C.H.; Gollner, M.J. Local flame attachment and heat fluxes in wind-driven line fires. Proc. Combust. Inst. 2016, in press. [Google Scholar] [CrossRef]
- Tu, R.; Zeng, Y.; Fang, J.; Zhang, Y. The influence of low air pressure on horizontal flame spread over flexible polyurethane foam and correlative smoke productions. Appl. Therm. Eng. 2016, 94, 133–140. [Google Scholar] [CrossRef]
- Fernandez-Pello, A.; Santoro, R. On the dominant mode of heat transfer in downward flame spread. Symp. Int. Combust. 1979, 17, 1201–1209. [Google Scholar] [CrossRef]


| Location | Altitude (m) | Ambient Pressure (kPa) | Ambient Temperature (°C) |
|---|---|---|---|
| Hefei | 30 | 102 | 11–15 |
| Xining | 2295 | 78.3 | 9–13 |
| Geermu | 2800 | 73.2 | 7–12 |
| Lhasa | 3650 | 66.3 | 9–13 |
| Yangbajain | 4300 | 62.2 | 7–10 |
| Sample Dimension () | Slope (n) | Standard Error | Adjusted R-Square |
|---|---|---|---|
| 2 mm–5 cm | 0.45 | 0.041 | 0.954 |
| 5 mm–3 cm | 0.79 | 0.018 | 0.995 |
| 5 mm–6 cm | 0.79 | 0.026 | 0.989 |
| 5 mm–9 cm | 0.79 | 0.029 | 0.986 |
| 5 mm–12 cm | 0.71 | 0.045 | 0.963 |
| 5 mm–15 cm | 0.70 | 0.045 | 0.962 |
| 5 mm–18 cm | 0.65 | 0.050 | 0.946 |
| 10 mm–3 cm | 1.08 | 0.012 | 0.999 |
© 2016 by the authors; licensee MDPI, Basel, Switzerland. This article is an open access article distributed under the terms and conditions of the Creative Commons Attribution (CC-BY) license (http://creativecommons.org/licenses/by/4.0/).
Share and Cite
Zhao, K.; Zhou, X.-D.; Liu, X.-Q.; Lu, L.; Wu, Z.-B.; Peng, F.; Ju, X.-Y.; Yang, L.-Z. Prediction of Three-Dimensional Downward Flame Spread Characteristics over Poly(methyl methacrylate) Slabs in Different Pressure Environments. Materials 2016, 9, 948. https://doi.org/10.3390/ma9110948
Zhao K, Zhou X-D, Liu X-Q, Lu L, Wu Z-B, Peng F, Ju X-Y, Yang L-Z. Prediction of Three-Dimensional Downward Flame Spread Characteristics over Poly(methyl methacrylate) Slabs in Different Pressure Environments. Materials. 2016; 9(11):948. https://doi.org/10.3390/ma9110948
Chicago/Turabian StyleZhao, Kun, Xiao-Dong Zhou, Xue-Qiang Liu, Lei Lu, Zhi-Bo Wu, Fei Peng, Xiao-Yu Ju, and Li-Zhong Yang. 2016. "Prediction of Three-Dimensional Downward Flame Spread Characteristics over Poly(methyl methacrylate) Slabs in Different Pressure Environments" Materials 9, no. 11: 948. https://doi.org/10.3390/ma9110948