
Diketonylpyridinium Cations as a Support of New Ionic Liquid Crystals and Ion-Conductive Materials: Analysis of Counter-Ion Effects

 , ,
, ,
Abstract
:
1. Introduction
2. Results and Discussion
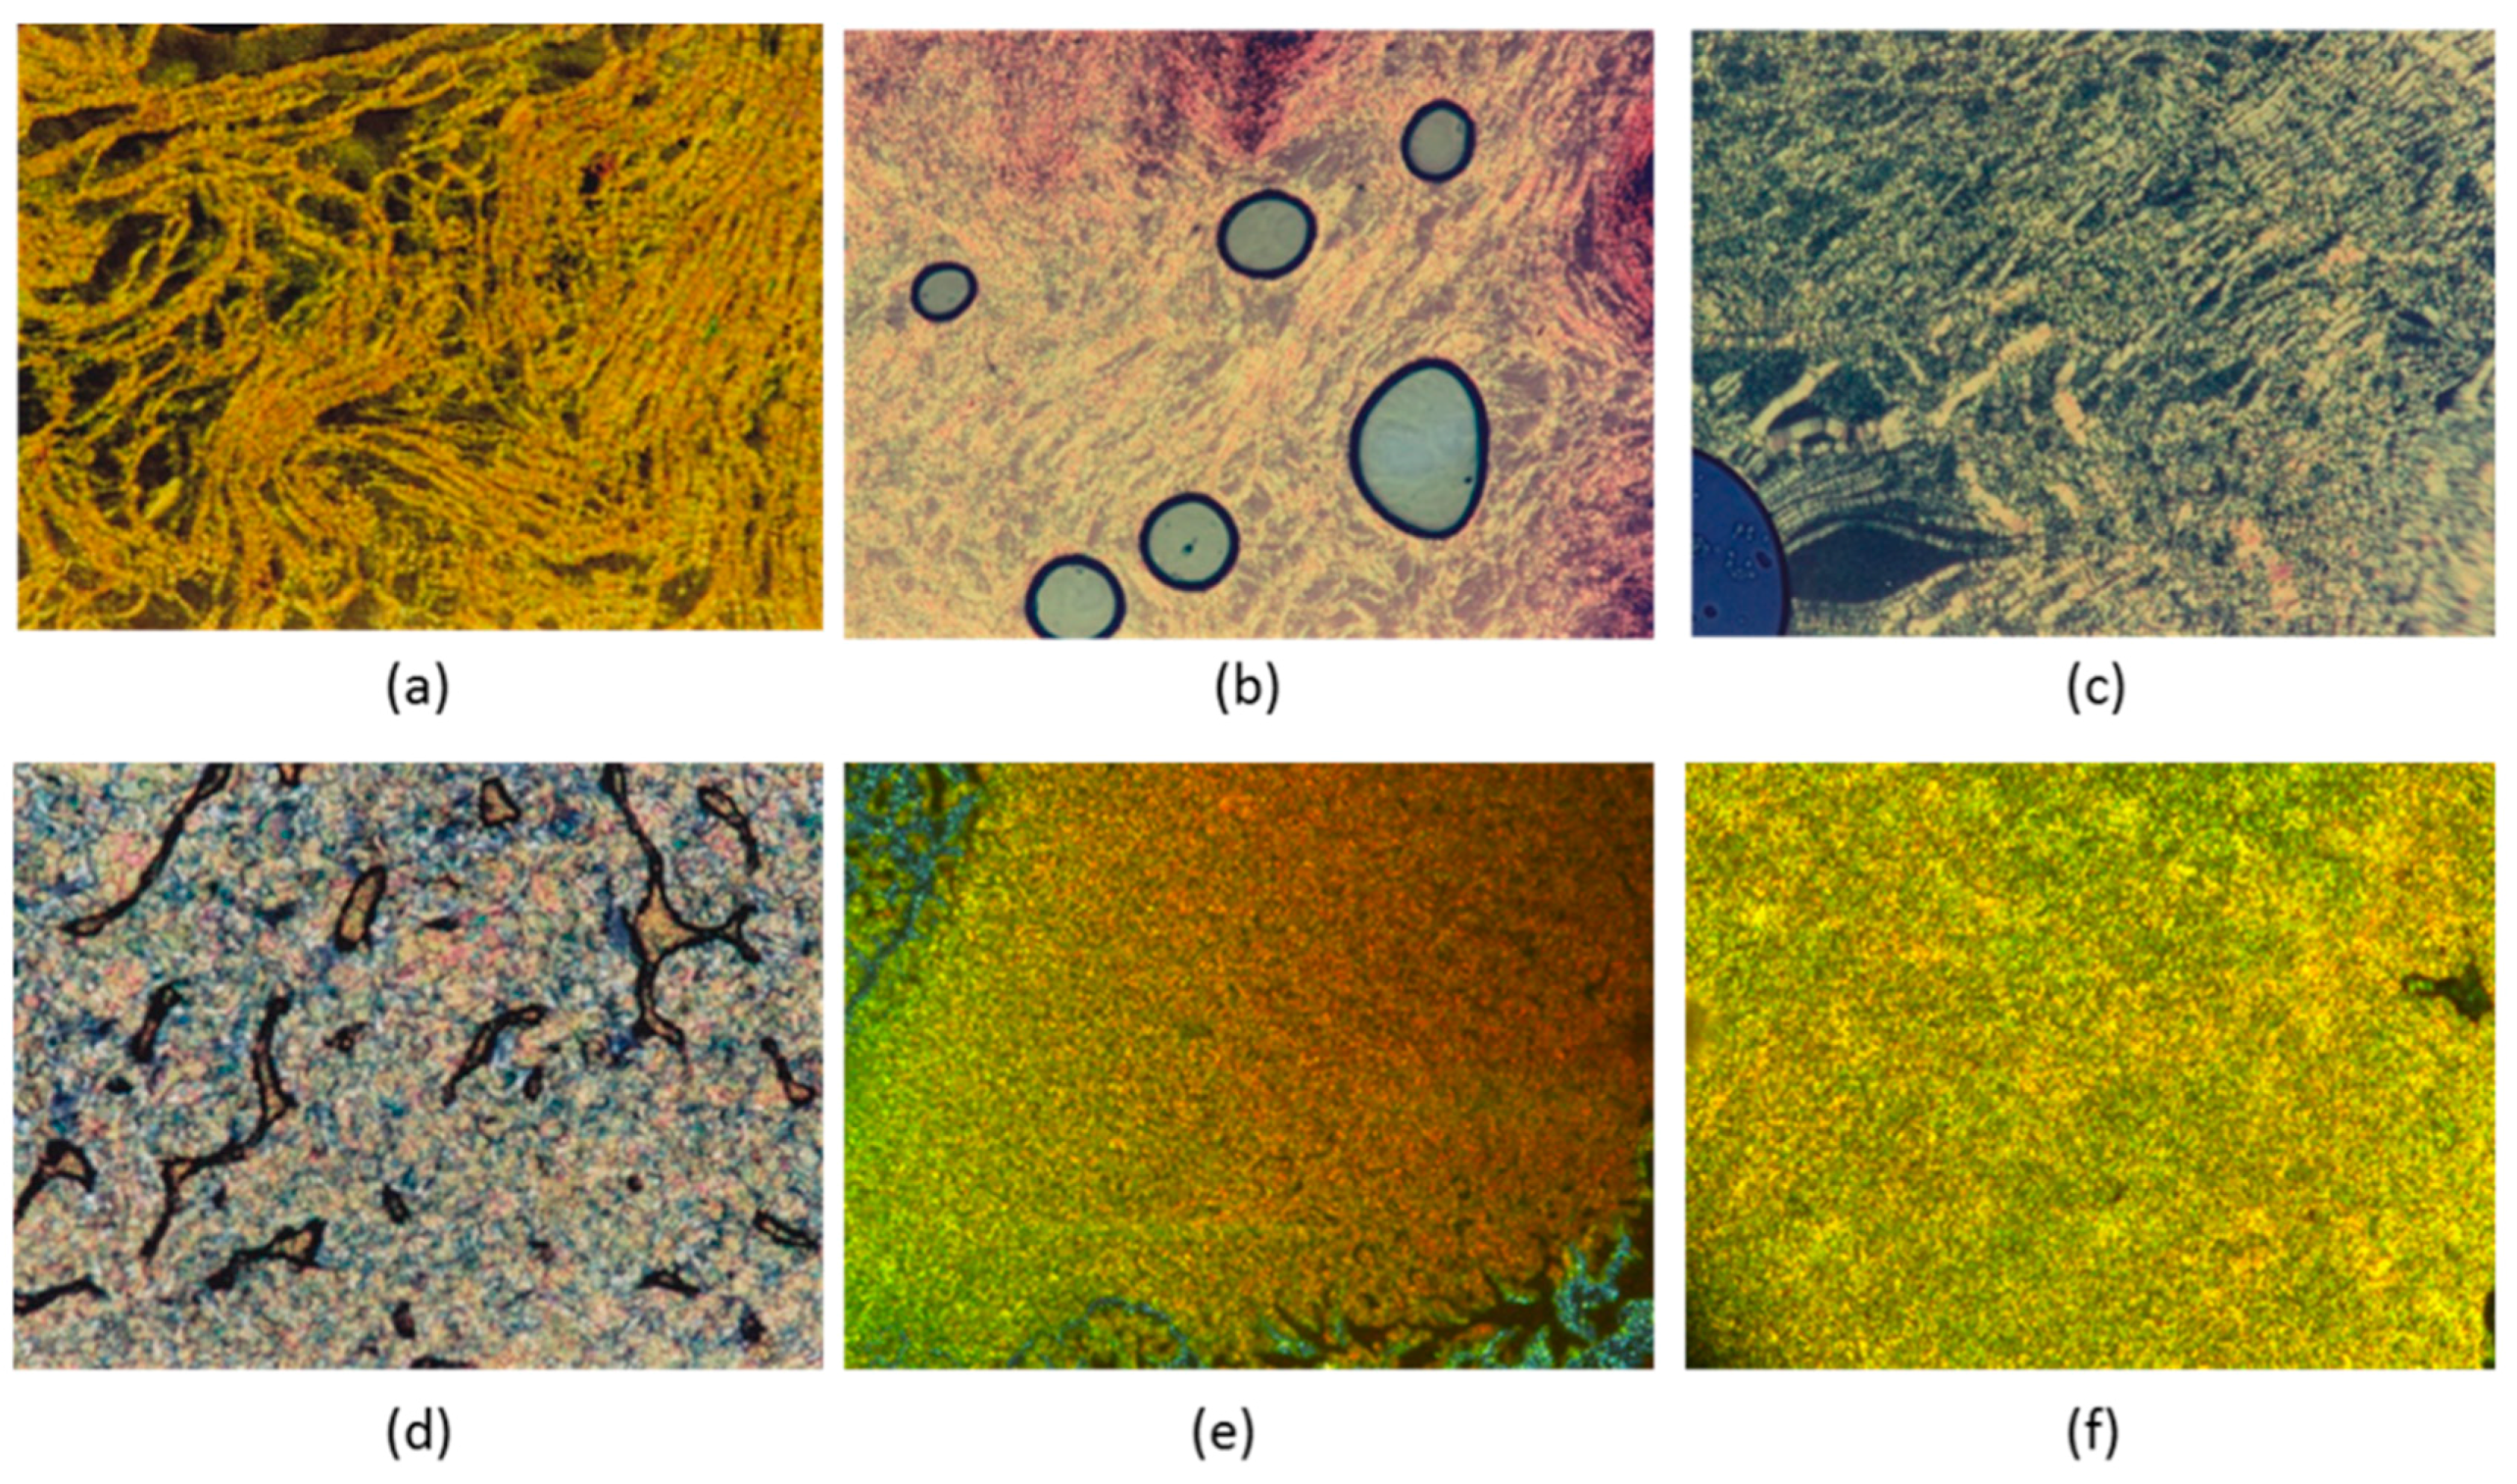
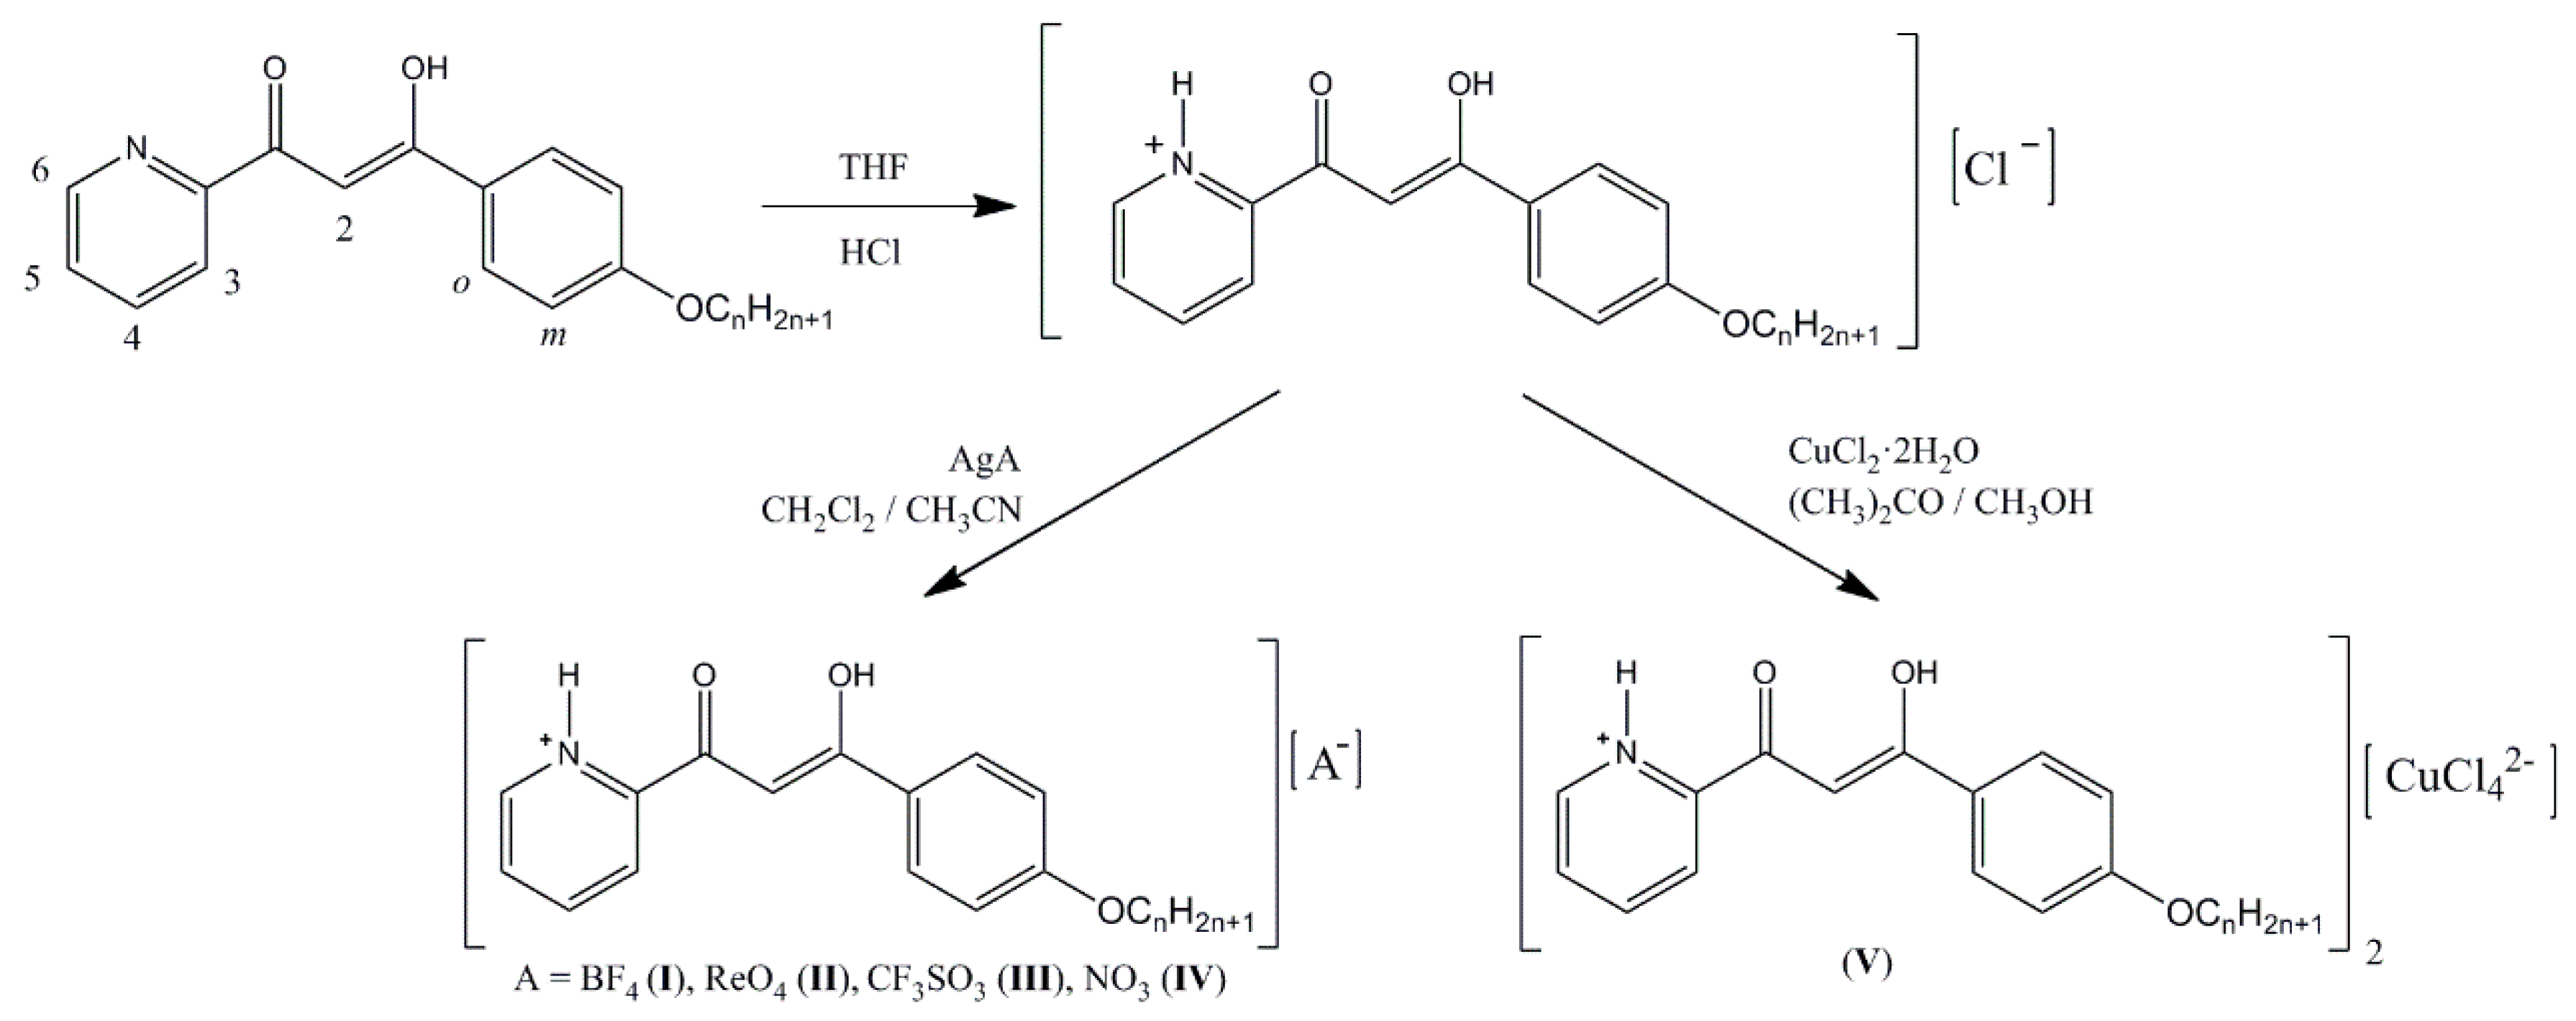
2.1. Synthesis and Characterization
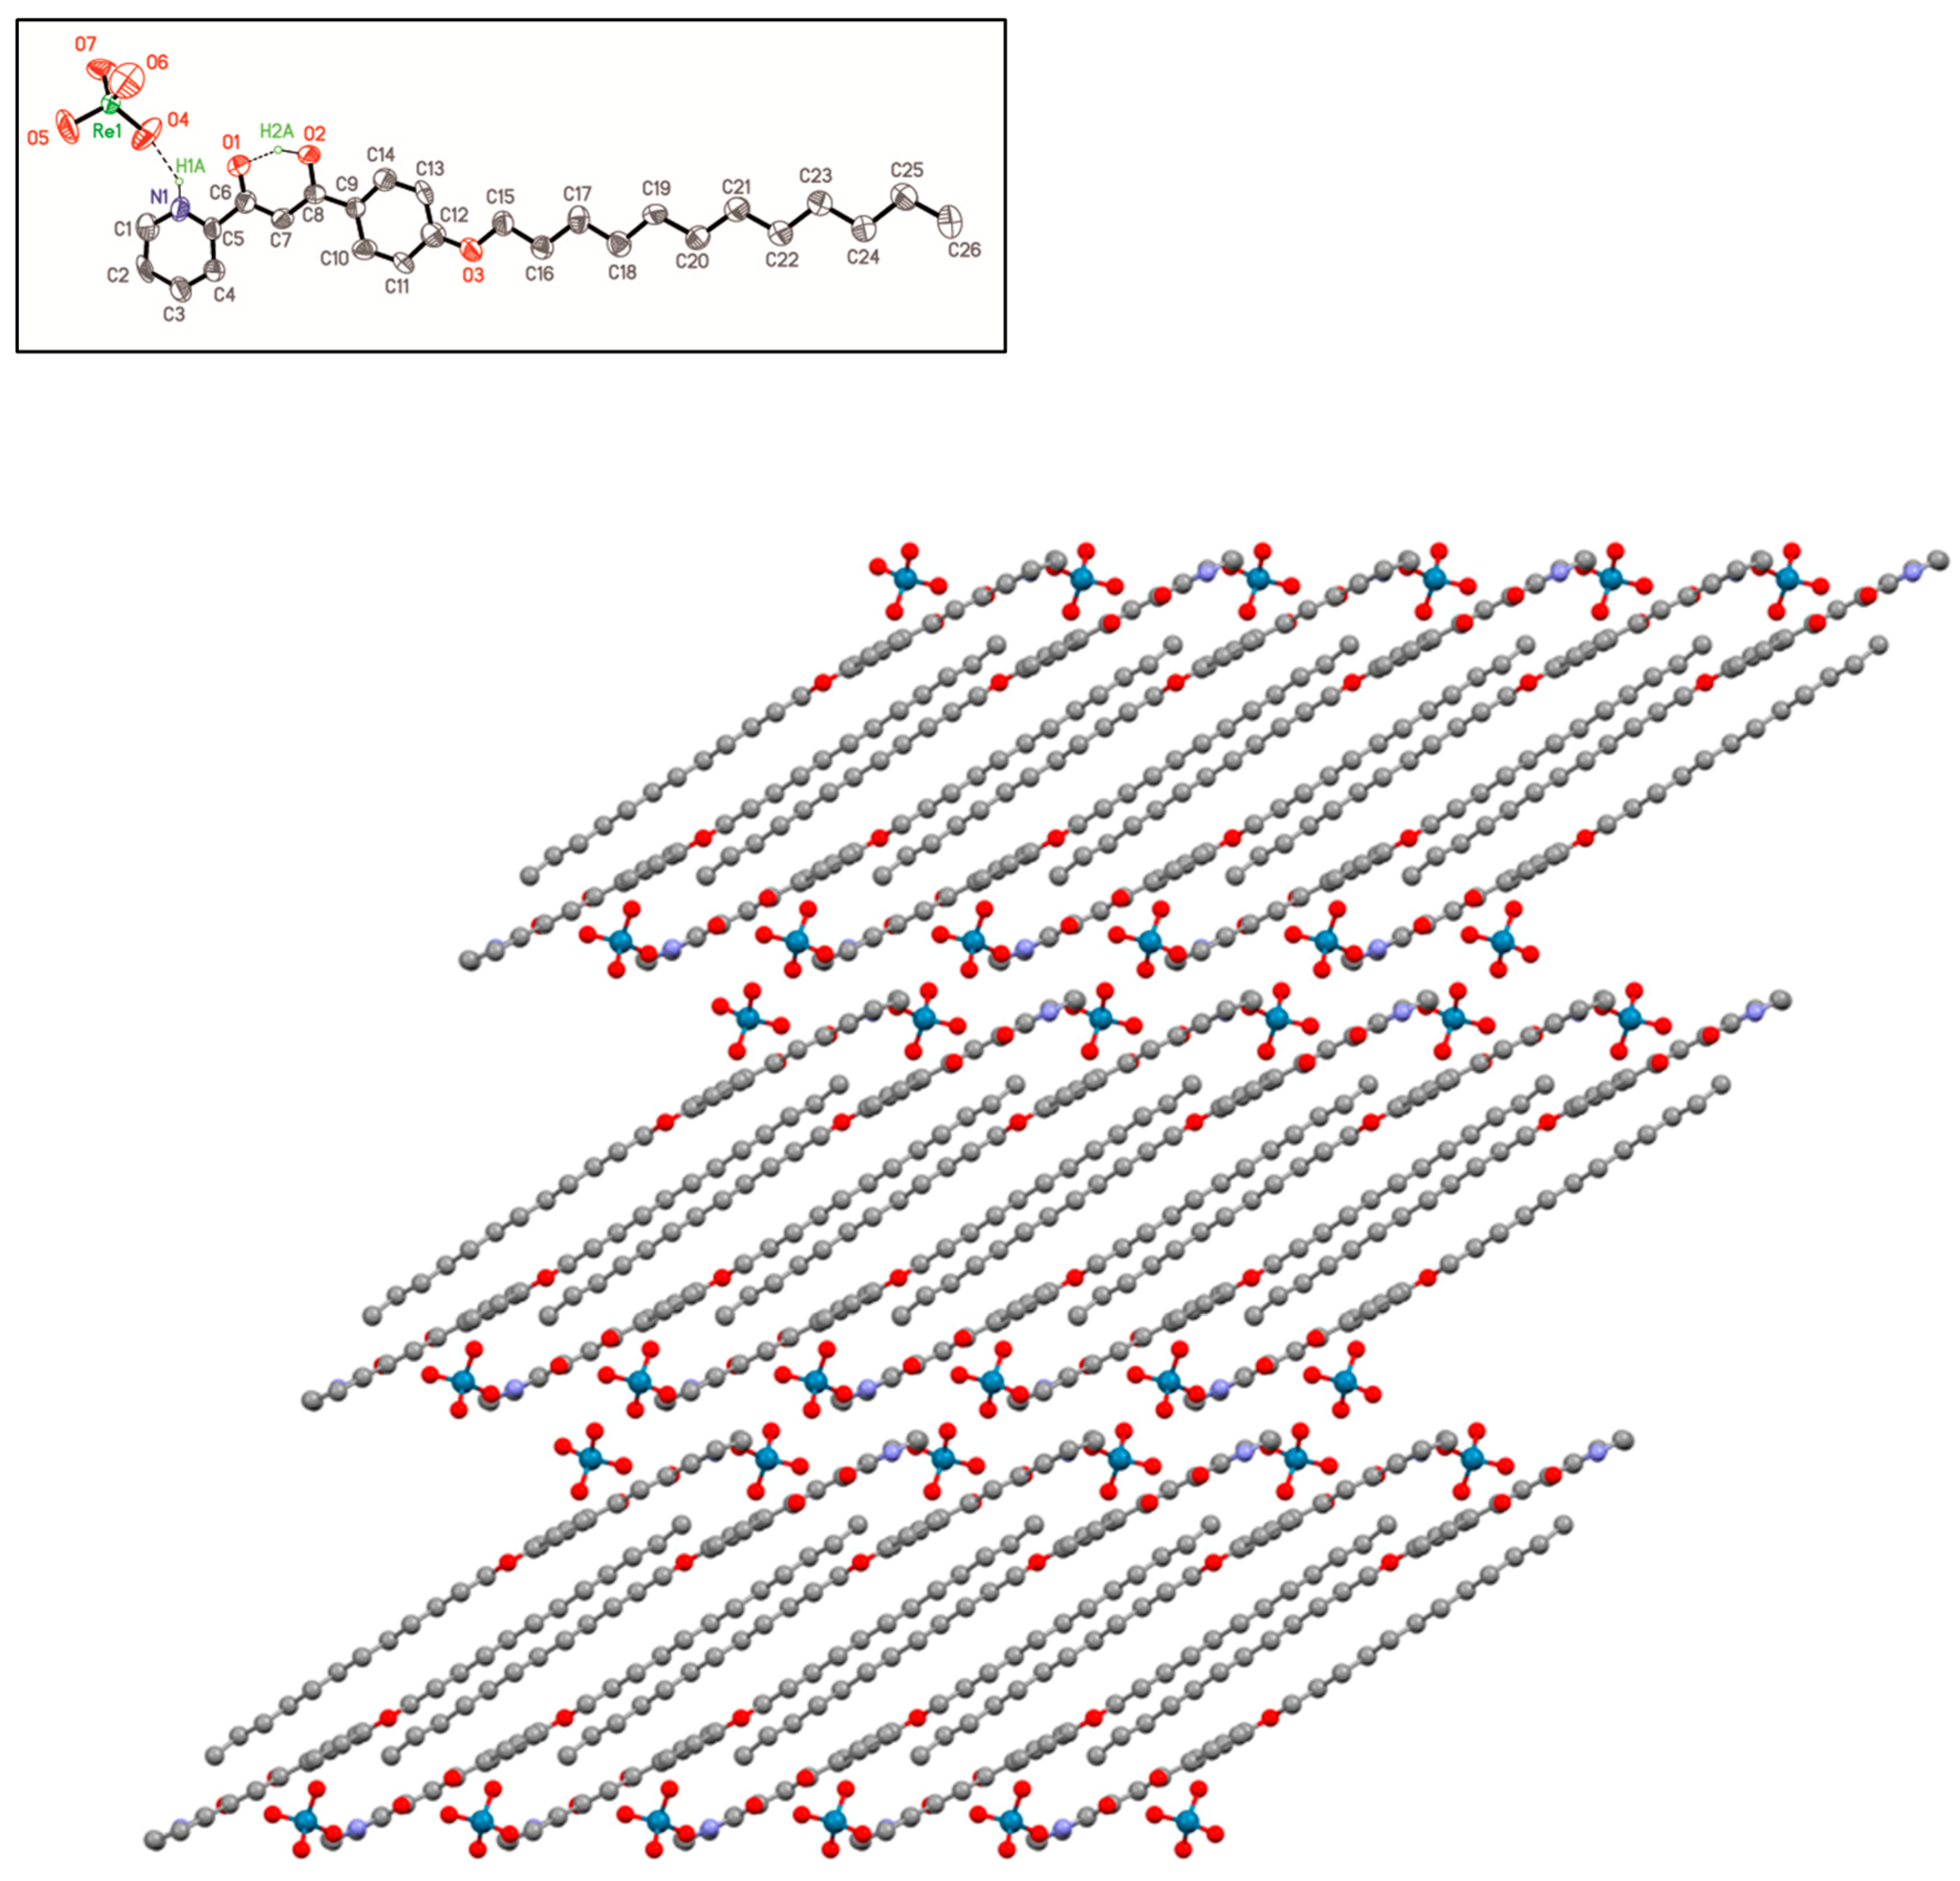
2.2. X-ray Crystal Structure of [HOOR(12)pyH][ReO4] (5)
2.3. Thermal Behavior
2.4. Variable Temperature Powder X-ray Diffraction Studies
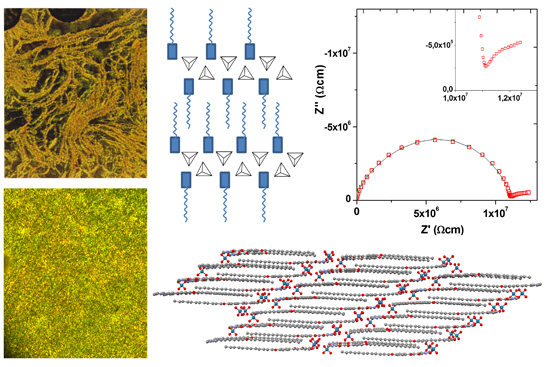
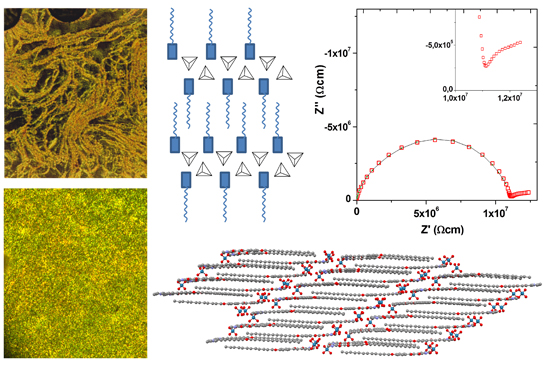
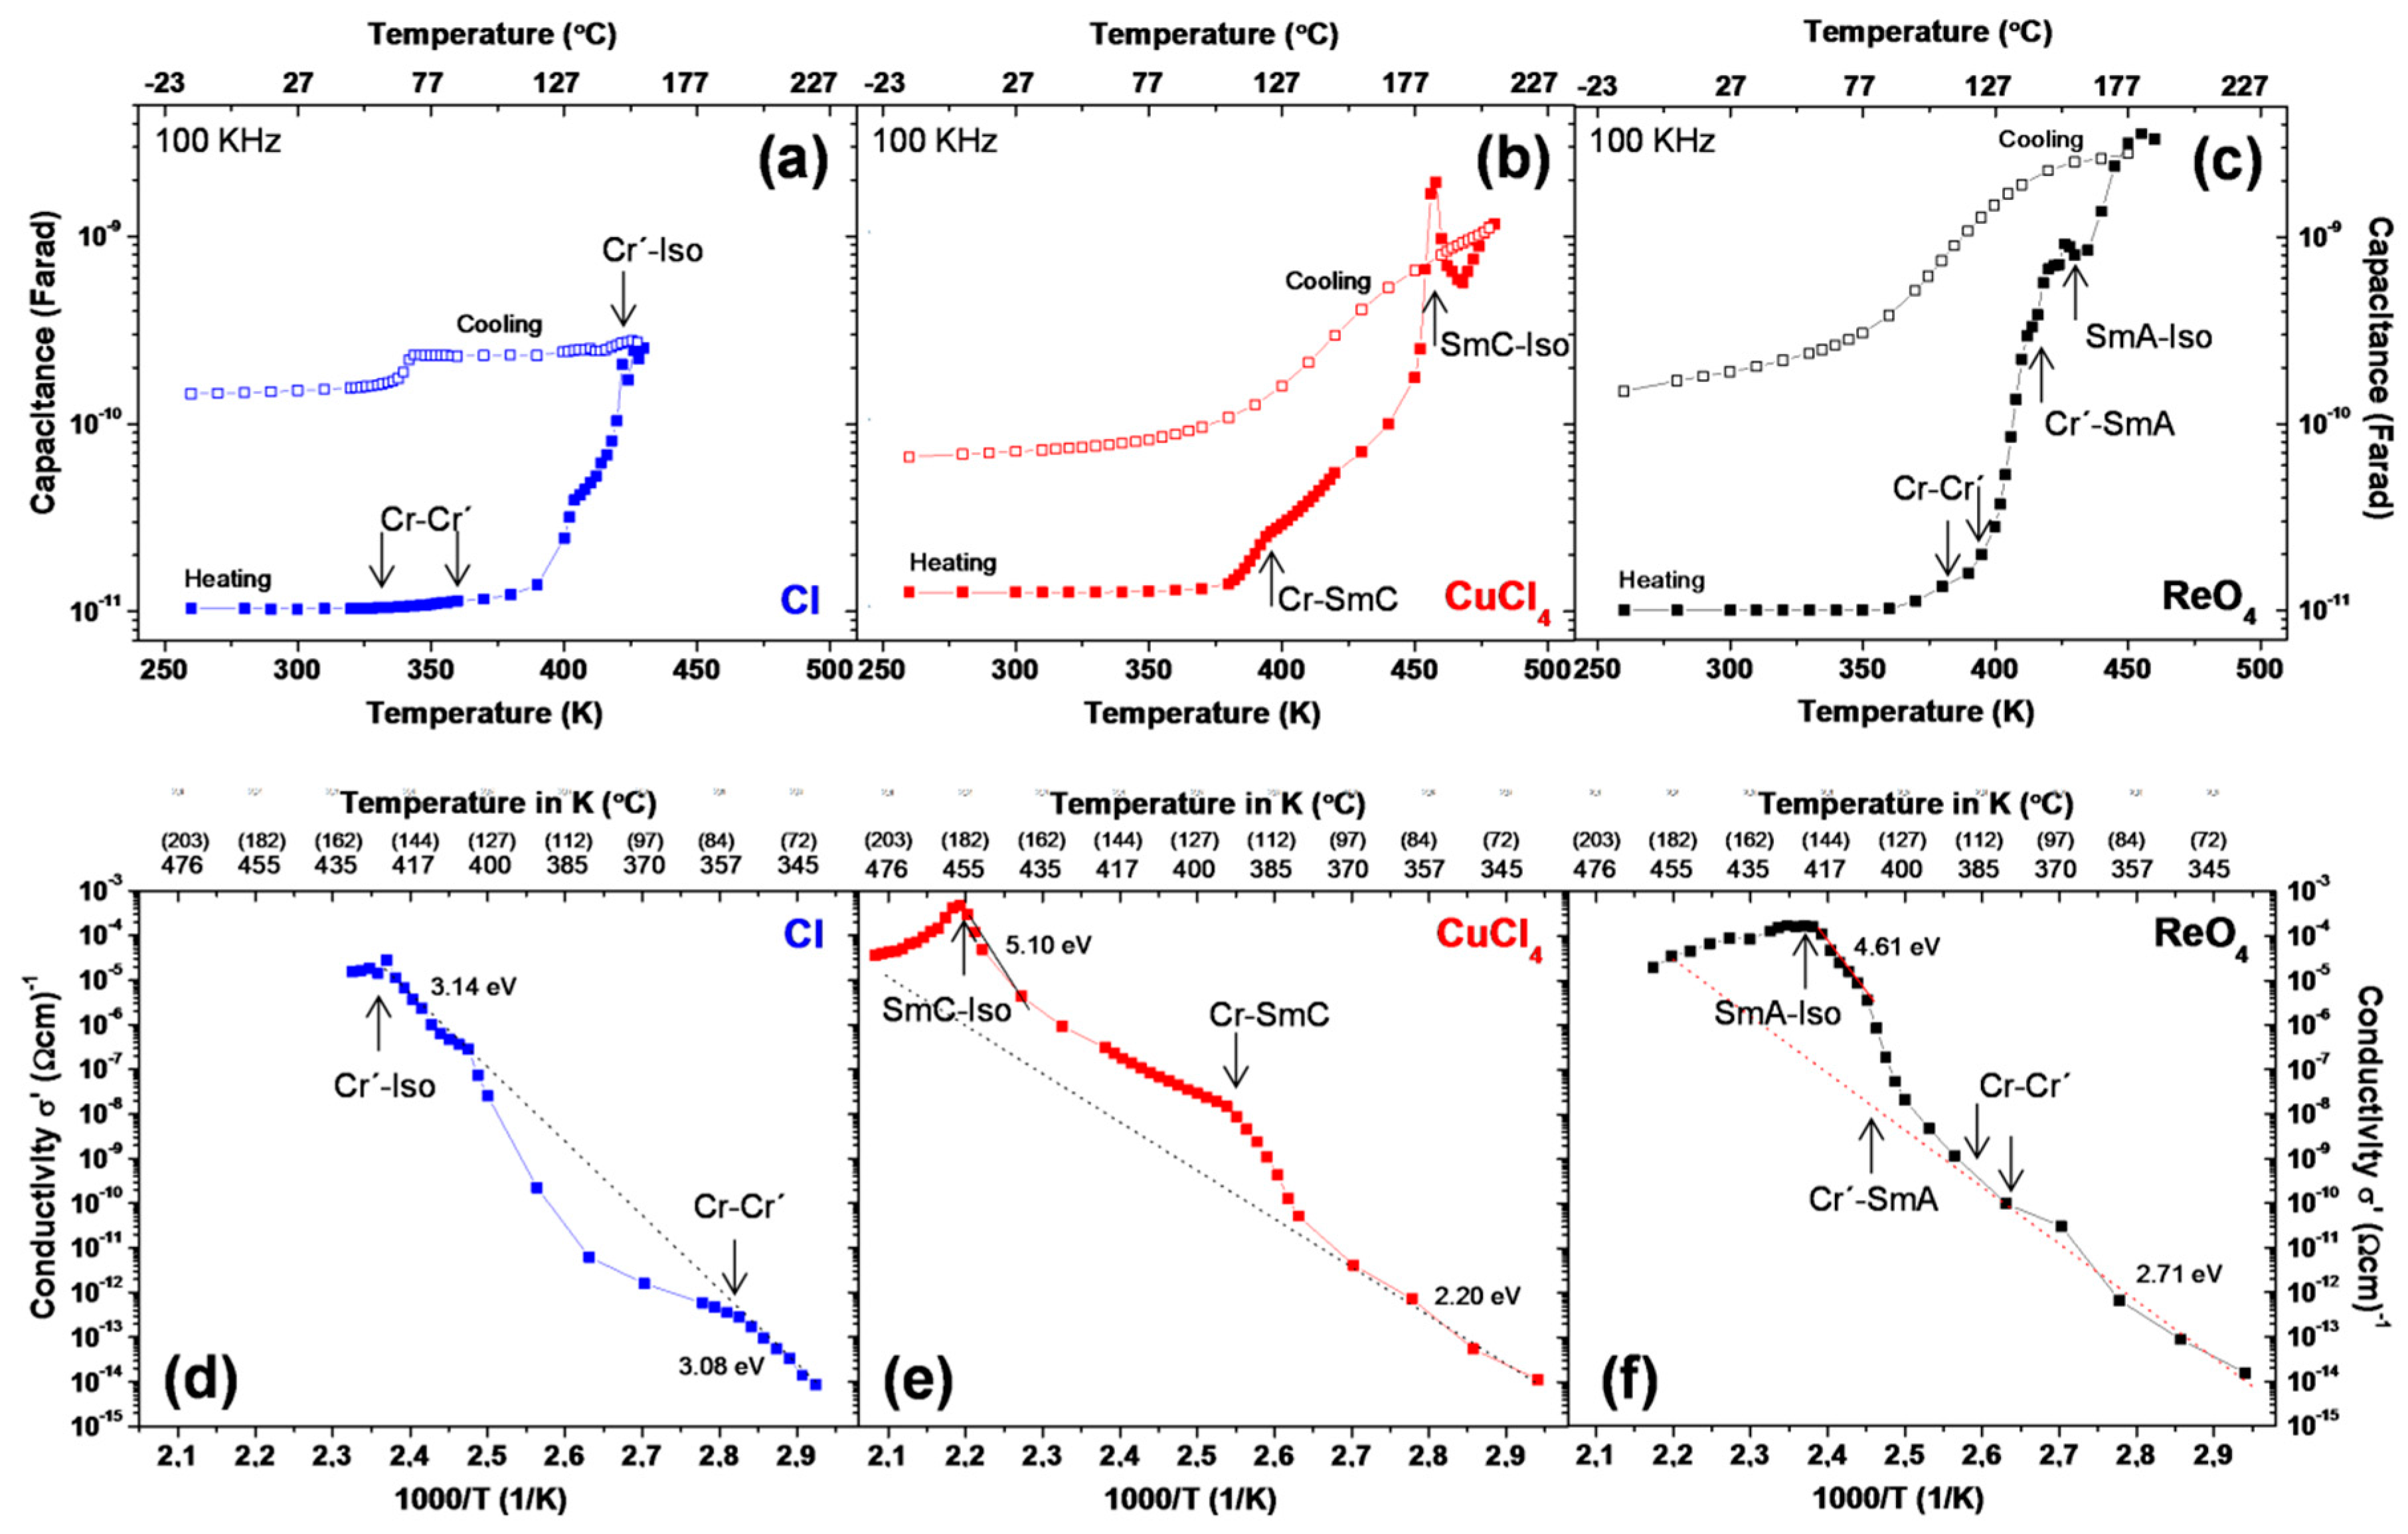
2.5. Conductivity and Dielectric Properties
3. Materials and Methods
3.1. Materials and Physical Measurements
3.2. Preparation of 2-[3-(4-n-alkyloxyphenyl)propane-1,3-dion-1-yl]pyridinium chloride [HOOR(n)pyH]Cl (R = C6H4OCnH2n+1, n = 12, 14, 16, 18)
3.3. Preparation of 2-[3-(4-n-alkyloxyphenyl)propane-1,3-dion-1-yl]pyridinium salts [HOOR(n)pyH][A] (A = BF4−, ReO4−, CF3SO3−, NO3−; R = C6H4OCnH2n+1, n = 12, 14, 16, 18)
3.4. Preparation of 2-[3-(4-n-alkyloxyphenyl)propane-1,3-dion-1-yl]pyridinium tetrachlorocuprate(II) [HOOR(n)pyH]2[CuCl4] (R = C6H4OCnH2n+1, n = 12, 18)
4. Conclusions
- (a)
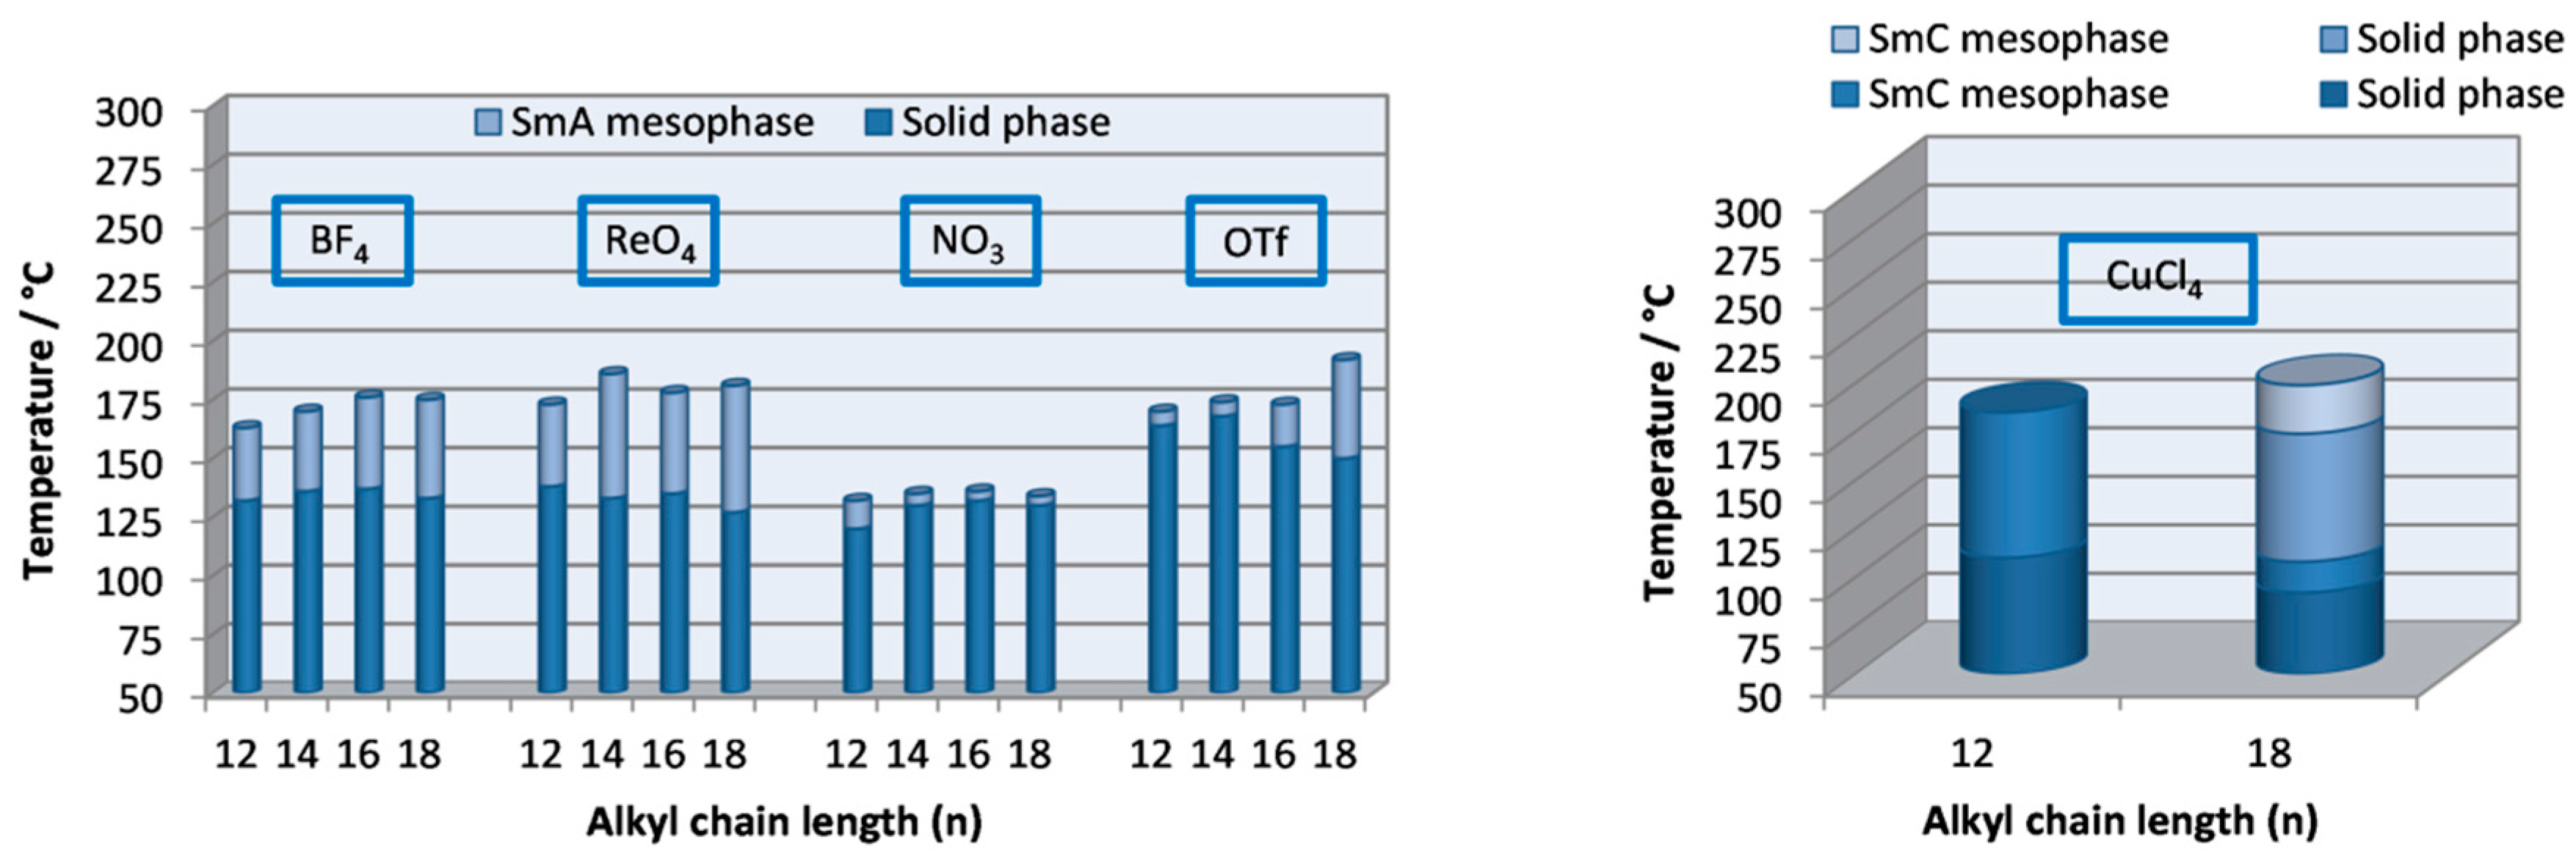
- The presence of the tetrahedral counter-ions BF4− or ReO4− did not substantially modify neither the melting points nor the mesophase stability range. However the latter was increased when NO3− was present as the counter-ion in the salt.
- (b)
- The bulkiest counter-anion CF3SO3− causes an unfavorable increase in the melting point as well as a significant narrowing of the mesophase range.
- (c)
- The modification on the chain length has no significant influence on the mesomorphic properties in the series (I–IV). In contrast, the chain length is determinant in compounds of the family V, where increasing the alkyl chains from 12 to 18 carbon atoms results in the presence of two mesophases.
Supplementary Materials
Acknowledgments
Author Contributions
Conflicts of Interest
Abbreviations
| IL | Ionic Liquid |
| ILC | Ionic Liquid Crystal |
| LC | Liquid Crystal |
| Iso | Isotropic liquid |
| Cr, Cr′, Cr″ | Solid Phases |
| Sm | Smectic Mesophase |
| POM | Polarized light Optical Microscopy |
| DSC | Differential Scanning Calorimetry |
| XRD | X-ray Diffraction |
| CPE | Constant Phase Element |
| RC | Resistor-Capacitor |
| NMR | Nuclear Magnetic Resonance |
References
- Armand, M.; Endres, F.; MacFarlane, D.R.; Ohno, H.; Scrosati, B. Ionic-liquid materials for the electrochemical challenges of the future. Nat. Mater. 2009, 8, 621–629. [Google Scholar] [CrossRef] [PubMed]
- Plechkova, N.V.; Seddon, K.R. Applications of ionic liquids in the chemical industry. Chem. Soc. Rev. 2008, 37, 123–150. [Google Scholar] [CrossRef] [PubMed]
- Gordon, C.M. New developments in catalysis using ionic liquids. Appl. Cat. A Gen. 2001, 222, 101–117. [Google Scholar] [CrossRef]
- Sheldon, R. Catalytic reactions in ionic liquids. Chem. Commun. 2001. [Google Scholar] [CrossRef]
- Wasserscheid, P. Ionic Liquids in Synthesis; Wiley-VCH: Weinheim, Germany, 2003. [Google Scholar]
- Bowlas, C.J.; Bruce, D.W.; Seddon, K.R. Liquid-crystalline ionic liquids. Chem. Commun. 1996, 1625–1626. [Google Scholar] [CrossRef]
- Yamanaka, N.; Kawano, R.; Kubo, W.; Masaki, N.; Kitamura, T.; Wada, Y.; Watanabe, M.; Yanagida, S. Dye-Sensitized TiO2 Solar Cells Using Imidazolium-Type Ionic Liquid Crystal Systems as Effective Electrolytes. J. Phys. Chem. B 2007, 111, 4763–4769. [Google Scholar] [CrossRef] [PubMed]
- Sakuda, J.; Yoshio, M.; Ichikawa, T.; Ohno, H.; Kato, T. 2D assemblies of ionic liquid crystals based on imidazolium moieties: Formation of ion-conductive layers. New J. Chem. 2015, 39, 4471–4477. [Google Scholar] [CrossRef]
- Yoshio, M.; Mukai, T.; Ohno, H.; Kato, T. One-dimensional ion transport in self-organized columnar ionic liquids. J. Am. Chem. Soc. 2004, 126, 994–995. [Google Scholar] [CrossRef] [PubMed]
- Yoshio, M.; Kagata, T.; Mukai, T.; Ohno, H.; Kato, T. One-dimensional ion-conductive polymer films: Alignment and fixation of ionic channels formed by self-organization of polymerizable columnar liquid crystals. J. Am. Chem. Soc. 2006, 128, 5570–5577. [Google Scholar] [CrossRef] [PubMed]
- Yazaki, S.; Kamikawa, Y.; Yoshio, M.; Hamasaki, A.; Mukai, T.; Ohno, H.; Kato, T. Ionic liquid crystals: Self-assembly of imidazolium salts containing and L-glutamic acid moiety. Chem. Lett. 2008, 37, 538–539. [Google Scholar] [CrossRef]
- Tanabe, K.; Yasuda, T.; Kato, T. Luminescent ionic liquid crystals based on tripodal pyridinium salts. Chem. Lett. 2008, 37, 1208–1209. [Google Scholar] [CrossRef]
- Kato, T.; Yasuda, T.; Kamikawa, Y.; Yoshio, M. Self-assembly of functional columnar liquid crystals. Chem. Commun. 2009, 729–739. [Google Scholar] [CrossRef] [PubMed]
- Frise, A.E.; Ichikawa, T.; Yoshio, M.; Ohno, H.; Dvinskilch, S.V.; Kato, T.; Furó, I. Ion-conductive behaviour in a confined nanostructure: NMR observation of self-diffusion in a liquid-crystalline bicontinous cubic phase. Chem. Commun. 2010, 46, 728–730. [Google Scholar] [CrossRef] [PubMed]
- Kato, T. From nanostructured liquid crystals to polymer-based electrolytes. Angew. Chem. Int. Ed. 2010, 49, 7847–7848. [Google Scholar] [CrossRef] [PubMed]
- Tanabe, K.; Suzui, Y.; Hasegawa, M.; Kato, T. Full-color tunable photoluminescent ionic liquid crystals based on tripodal pyridinium, pyrimidinium and quinolinium salts. J. Am. Chem. Soc. 2012, 134, 5652–5661. [Google Scholar] [CrossRef] [PubMed]
- Soberats, B.; Uchida, E.; Yoshio, M.; Kagimoto, J.; Ohno, H.; Kato, T. Macroscopic photocontrol of ion-transporting pathways of a nanostructural imidazolium-based photoresponsive liquid crystal. J. Am. Chem. Soc. 2014, 136, 9552–9555. [Google Scholar] [CrossRef] [PubMed]
- Soberats, B.; Yoshio, M.; Ichikawa, T.; Taguchi, S.; Ohno, H.; Kato, T. 3D Anhydrous proton-transporting nanochannels formed by self-assembly of liquid crystals composed of a sulfobetaine and a sulfonic acid. J. Am. Chem. Soc. 2014, 136, 15286–15289. [Google Scholar] [CrossRef] [PubMed]
- Högberg, D.; Soberats, B.; Uchida, S.; Yoshio, M.; Kloo, L.; Segawa, H.; Kato, T. Nanostructured two-component liquid-crystalline electrolytes for high-temperature dye-sensitized solar cells. Chem. Mat. 2014, 26, 6496–6502. [Google Scholar] [CrossRef]
- Cho, B.-K. Nanostructured organic electrolytes. RSC Adv. 2014, 4, 395–405. [Google Scholar] [CrossRef]
- Sergeyev, S.; Pisula, W.; Geerts, Y.H. Discotic liquid crystals: A new generation of organic semiconductors. Chem. Soc. Rev. 2007, 36, 1902–1929. [Google Scholar] [CrossRef] [PubMed]
- Wang, X.; Vogel, C.S.; Heinemann, F.W.; Wasserscheid, P.; Meyer, K. Solid-State Structures of Double-Long-Chain Imidazolium Ionic Liquids: Influence of Anion Shape on Cation Geometry and Crystal Packing. Cryst. Growth Des. 2011, 11, 1974–1988. [Google Scholar] [CrossRef]
- Wang, X.; Heinemann, F.W.; Yang, M.; Melcher, B.U.; Fekete, M.; Mudring, A.-V.; Wasserscheid, P.; Meyer, K. A new class of double alkyl-substituted, liquid crystalline imidazolium ionic liquids-a unique combination of structural features, viscosity effects, and thermal properties. Chem. Commun. 2009, 7405–7407. [Google Scholar] [CrossRef] [PubMed]
- Dobbs, W.; Douce, L.; Allouche, L.; Louati, A.; Malbosc, F.; Welter, R. New ionic liquid crystals based on imidazolium salts. New J. Chem. 2006, 30, 528–532. [Google Scholar] [CrossRef]
- Stappert, K.; Mudring, A.V. Triazolium based ionic liquid crystals: Effect of asymmetric substitution. RSC Adv. 2015, 5, 16886–16896. [Google Scholar] [CrossRef]
- Stappert, K.; Unal, D.; Mallick, B.; Mudring, A.-V. New triazolium based ionic liquid crystals. J. Mater. Chem. C 2014, 2, 7976–7986. [Google Scholar] [CrossRef]
- Causin, V.; Saielli, G. Effect of a structural modification of the bipyridinium core on the phase behavior of viologen-based bistriflimide salts. J. Mol. Liq. 2009, 145, 41–47. [Google Scholar] [CrossRef]
- Sudholter, E.J.R.; Engberts, J.B.F.N.; De Jeu, W.H. Thermotropic liquid-crystalline behavior of some single- and double-chained pyridinium amphiphiles. J. Phys. Chem. 1982, 86, 1908–1913. [Google Scholar] [CrossRef]
- Lava, K.; Binnemans, K.; Cardinaels, T. Piperidinium, Piperazinium and Morpholinium Ionic Liquid Crystals. J. Phys. Chem. B 2009, 113, 9506–9511. [Google Scholar] [CrossRef] [PubMed] [Green Version]
- Yang, M.; Stappert, K.; Mudring, A.-V. Bis-cationic ionic liquid crystals. J. Mater. Chem. C 2014, 2, 458–473. [Google Scholar] [CrossRef]
- Yang, M.; Mallick, B.; Mudring, A.-V. A Systematic Study on the Mesomorphic Behavior of Asymmetrical 1-Alkyl-3-dodecylimidazolium Bromides. Cryst. Growth Des. 2014, 14, 1561–1571. [Google Scholar] [CrossRef]
- Yang, M.; Mallick, B.; Mudring, A.-V. On the Mesophase Formation of 1,3-Dialkylimidazolium Ionic Liquids. Cryst. Growth Des. 2013, 13, 3068–3077. [Google Scholar] [CrossRef]
- Neve, F.; Francescangeli, O.; Crispini, A. Crystal architecture and mesophase structure of long-chain N-alkylpyridinium tetrachlorometallates. Inorg. Chim. Acta 2002, 338, 51–58. [Google Scholar] [CrossRef]
- Neve, F.; Crispini, A.; Francescangeli, O. Structural Studies on Layered Alkylpyridinium Iodopalladate Networks. Inorg. Chem. 2000, 39, 1187–1194. [Google Scholar] [CrossRef] [PubMed]
- Getsis, A.; Mudring, A.V. Imidazolium based ionic liquid crystals: Structure, photophysical and thermal behavior of [Cnmim]Br·xH2O (n = 12, 14; x = 0, 1). Cryst. Res. Technol. 2008, 43, 1187–1196. [Google Scholar] [CrossRef]
- Downard, A.; Earle, M.J.; Hardacre, C.; McMath, S.E.J.; Nieuwenhuyzen, M.; Teat, S.J. Structural Studies of Crystalline 1-Alkyl-3-Methylimidazolium Chloride Salts. Chem. Mater. 2004, 16, 43–48. [Google Scholar] [CrossRef]
- Holbrey, J.D.; Seddon, K.R. The phase behavior of 1-alkyl-3-methylimidazolium tetrafluoroborates; ionic liquids and ionic liquid crystals. J. Chem. Soc. Dalton Trans. 1999. [Google Scholar] [CrossRef]
- Stappert, K.; Ünal, D.; Spielberg, E.T.; Mudring, A.-V. Influence of the Counteranion on the Ability of 1-Dodecyl-3-methyltriazolium Ionic Liquids to Form Mesophases. Cryst. Growth Des. 2015, 15, 752–758. [Google Scholar] [CrossRef]
- Axenov, K.V.; Laschat, S. Thermotropic Ionic Liquid Crystals. Materials 2011, 4, 206–259. [Google Scholar] [CrossRef]
- Sanchez, I.; Campo, J.A.; Heras, J.V.; Torres, M.R.; Cano, M. Pyrazolium salts as a new class of ionic liquid crystals. J. Mater. Chem. 2012, 22, 13239–13251. [Google Scholar] [CrossRef]
- Mayoral, M.J.; Ovejero, P.; Campo, J.A.; Heras, J.V.; Pinilla, E.; Torres, M.R.; Cano, M. Ionic liquid crystals from β-diketonyl containing pyridinium cations and tetrachlorozincate anions. Inorg. Chem. Commun. 2009, 12, 214–218. [Google Scholar] [CrossRef]
- Nakamoto, K. Infrared and Raman Spectra of Inorganic and Coordination Compounds, Part A: Theory and Applications in Inorganic Chemistry, 6th ed.; Wiley: Hoboken, NJ, USA, 2009. [Google Scholar]
- Barsukov, E.; Macdonald, J. Impedance Spectroscopy: Theory, Experiment and Applications; John Wiley & Sons Inc.: Hoboken, NJ, USA, 2005. [Google Scholar]
- Prado-Gonjal, J.; Schmidt, R.; Espíndola-Canuto, J.; Ramos-Alvarez, P.; Morán, E. Increased ionic conductivity in microwave hydrothermally synthesized rare-earth doped ceria Ce1−xRExO2−(x/2). J. Power Sources 2012, 209, 163–171. [Google Scholar] [CrossRef]
- Prado-Gonjal, J.; Heuguet, R.; Muñoz-Gila, D.; Rivera-Calzada, A.; Marinel, S.; Morán, E.; Schmidt, R. Microwave synthesis & sintering of Sm and Ca co-doped ceria ceramics. Int. J. Hydrogen Energy 2015, 40, 15640–15651. [Google Scholar] [Green Version]
- Irvine, J.T.S.; Sinclair, D.C.; West, A.R. Electroceramics: Characterization by Impedance Spectroscopy. Adv. Mater. 1990, 2, 132–138. [Google Scholar] [CrossRef]
- Funke, K.; Hoppe, R. Jump-relaxation model yields Kohlrausch-Williams-Watts behavior. Solid State Ionics 1990, 40–41, 200–204. [Google Scholar] [CrossRef]
- Boukamp, B.A. Electrochemical impedance spectroscopy in solid state ionics: Recent advances. Solid State Ionics 2004, 169, 65–73. [Google Scholar] [CrossRef]
- Schmidt, R. Impedance spectroscopy of nanomaterials. In CRC Concise Encyclopedia of Nanotechnology; Kharisov, B.I., Kharissova, O.V., Ortiz-Mendez, U., Eds.; CRC Press Taylor & Francis Group: Boca Raton, FL, USA, 2015. [Google Scholar]
- Jonscher, A.K. Dielectric Relaxation in Solids; Chelsea Dielectrics Press: London, UK, 1983. [Google Scholar]
- Gainaru, C.; Rivera, A.; Putselyk, S.; Eska, G.; Rössler, E.A. Low-temperature dielectric relaxation of molecular glasses: Crossover from the nearly constant loss to the tunneling regime. Phys. Rev. B 2005, 72. [Google Scholar] [CrossRef]
- Sheldrick, G.M. Program for Refinement of Crystal Structure; SHELX97; University of Göttingen: Göttingen, Germany, 1997. [Google Scholar]
- The Cambridge Crystallographic Data Centre (CCDC). Available online: http://www.ccdc.cam.ac.uk/data_request/cif (accessed on 10 May 2016).


| Family | I | II | III | IV | V |
|---|---|---|---|---|---|
| n/A | BF4− | ReO4− | CF3SO3− | NO3− | CuCl42− |
| 12 | BF4-12 (1) | ReO4-12 (5) | CF3SO3-12 (9) | NO3-12 (13) | CuCl4-12 (17) |
| 14 | BF4-14 (2) | ReO4-14 (6) | CF3SO3-14 (10) | NO3-14 (14) | – |
| 16 | BF4-16 (3) | ReO4-16 (7) | CF3SO3-16 (11) | NO3-16 (15) | – |
| 18 | BF4-18 (4) | ReO4-18 (8) | CF3SO3-18 (12) | NO3-18 (16) | CuCl4-18 (18) |
| Compound | Transition 1 | T2/°C | ΔH/kJmol−1 | Compound | Transition 1 | T2/°C | ΔH/kJmol−1 |
|---|---|---|---|---|---|---|---|
| BF4-12 (1) | Cr→Cr′ | 99 | 2.0 | CF3SO3-12 (9) | Cr→Cr′ | 81 | 14.5 |
| Cr′→SmA | 132 | 25.0 | Cr′→Cr″ | 98 | 2.2 | ||
| SmA→Iso | 163 3 | – | Cr″→SmA→Iso | 165 | 18.7 4 | ||
| BF4-14 (2) | Cr→Cr′ | 72 | 14.1 | Iso→SmA→Cr′ | 142 | −19.3 4 | |
| Cr′→Cr″ | 106 | 11.9 | Cr′→Cr | 95 | −1.8 | ||
| Cr″→SmA | 136 | 26.4 | CF3SO3-14 (10) | Cr→Cr′ | 116 | 8.8 | |
| SmA→Iso | 170 3 | – | Cr′→SmA→Iso | 169 | 21.6 4 | ||
| BF4-16 (3) | Cr→Cr′ | 83 | 10.2 | Iso→SmA | 156 | −1.0 | |
| Cr′→SmA | 137 | 35.7 | SmA→Cr′ | 142 | −19.5 | ||
| SmA→Iso | 176 3 | – | Cr′→Cr | 112 | −7.0 | ||
| BF4-18 (4) | Cr→Cr′ | 85 | 55.0 4 | CF3SO3-16 (11) | Cr→Cr′ | 79 | 1.5 |
| Cr′→Cr″ | 117 | Cr′→Cr″ | 117 | 14.1 | |||
| Cr″→SmA | 133 | Cr″→SmA | 155 | 14.1 | |||
| SmA→Iso | 175 3 | – | SmA→Iso | 173 | 0.2 | ||
| ReO4-12 (5) | Cr→Cr′ | 106 | 13.5 | Iso→SmA | 170 | −0.8 | |
| Cr′→Cr″ | 114 | 7.9 | SmA→Cr′ | 129 | −15.7 | ||
| Cr″→SmA | 138 | 17.7 | Cr′→Cr | 110 | −11.4 | ||
| SmA→Iso | 173 | 1.6 | CF3SO3-18 (12) | Cr→Cr′ | 84 | 5.0 | |
| ReO4-14 (6) | Cr→Cr′ | 105 | 26.2 4 | Cr′→Cr″ | 116 | 13.4 | |
| Cr′→Cr″ | 116 | Cr″→SmA | 150 | 11.2 | |||
| Cr″→SmA | 133 | 34.7 | SmA→Iso | 192 | 0.2 | ||
| SmA→Iso | 186 | 0.5 | Iso→SmA | 166 | −0.5 | ||
| ReO4-16 (7) | Cr→Cr′ | 111 | 29.6 | SmA→Cr | 111 | −27.0 | |
| Cr′→SmA | 135 | 18.2 | NO3-12 (13) | Cr→SmA | 124 | 41.6 4 | |
| SmA→Iso | 178 | 0.8 | SmA→Iso | 132 | |||
| ReO4-18 (8) | Cr→Cr′ | 77 | 2.8 | NO3-14 (14) | Cr→SmA→Iso | 135 | 48.6 4 |
| Cr′→Cr″ | 107 | 22.4 | NO3-16 (15) | Cr→SmA→Iso | 136 | 56.4 4 | |
| Cr″→SmA | 127 | 5.4 | NO3-18 (16) | Cr→SmA→Iso | 135 | 50.1 4 | |
| SmA→Iso | 182 | 0.2 | CuCl4-12 (17) | Cr→SmC | 110 | 32.8 | |
| SmC→Iso | 185 | 54.6 | |||||
| CuCl4-18 (18) | Cr→Cr′ | 79 | 73.1 4 | ||||
| Cr′→SmC | 92 | ||||||
| SmC→Cr″ | 108 | −34.2 | |||||
| Cr″→SmC | 174 | 42.9 | |||||
| SmC→Iso | 199 | 45.7 |
| Compound | T/°C | 2θ/° | dobs 1/Å | dcal 1/Å | [hkl] 2 | Lattice Parameter/Å |
|---|---|---|---|---|---|---|
| BF4-16 (3) | 130 | 2.5 | 34.5 | 34.5 | (001) | c = 34.5 |
| 5.0 | 17.5 | 17.3 | (002) | |||
| 7.5 | 11.7 | 11.5 | (003) | |||
| 19 | 5.2 | – | halo | |||
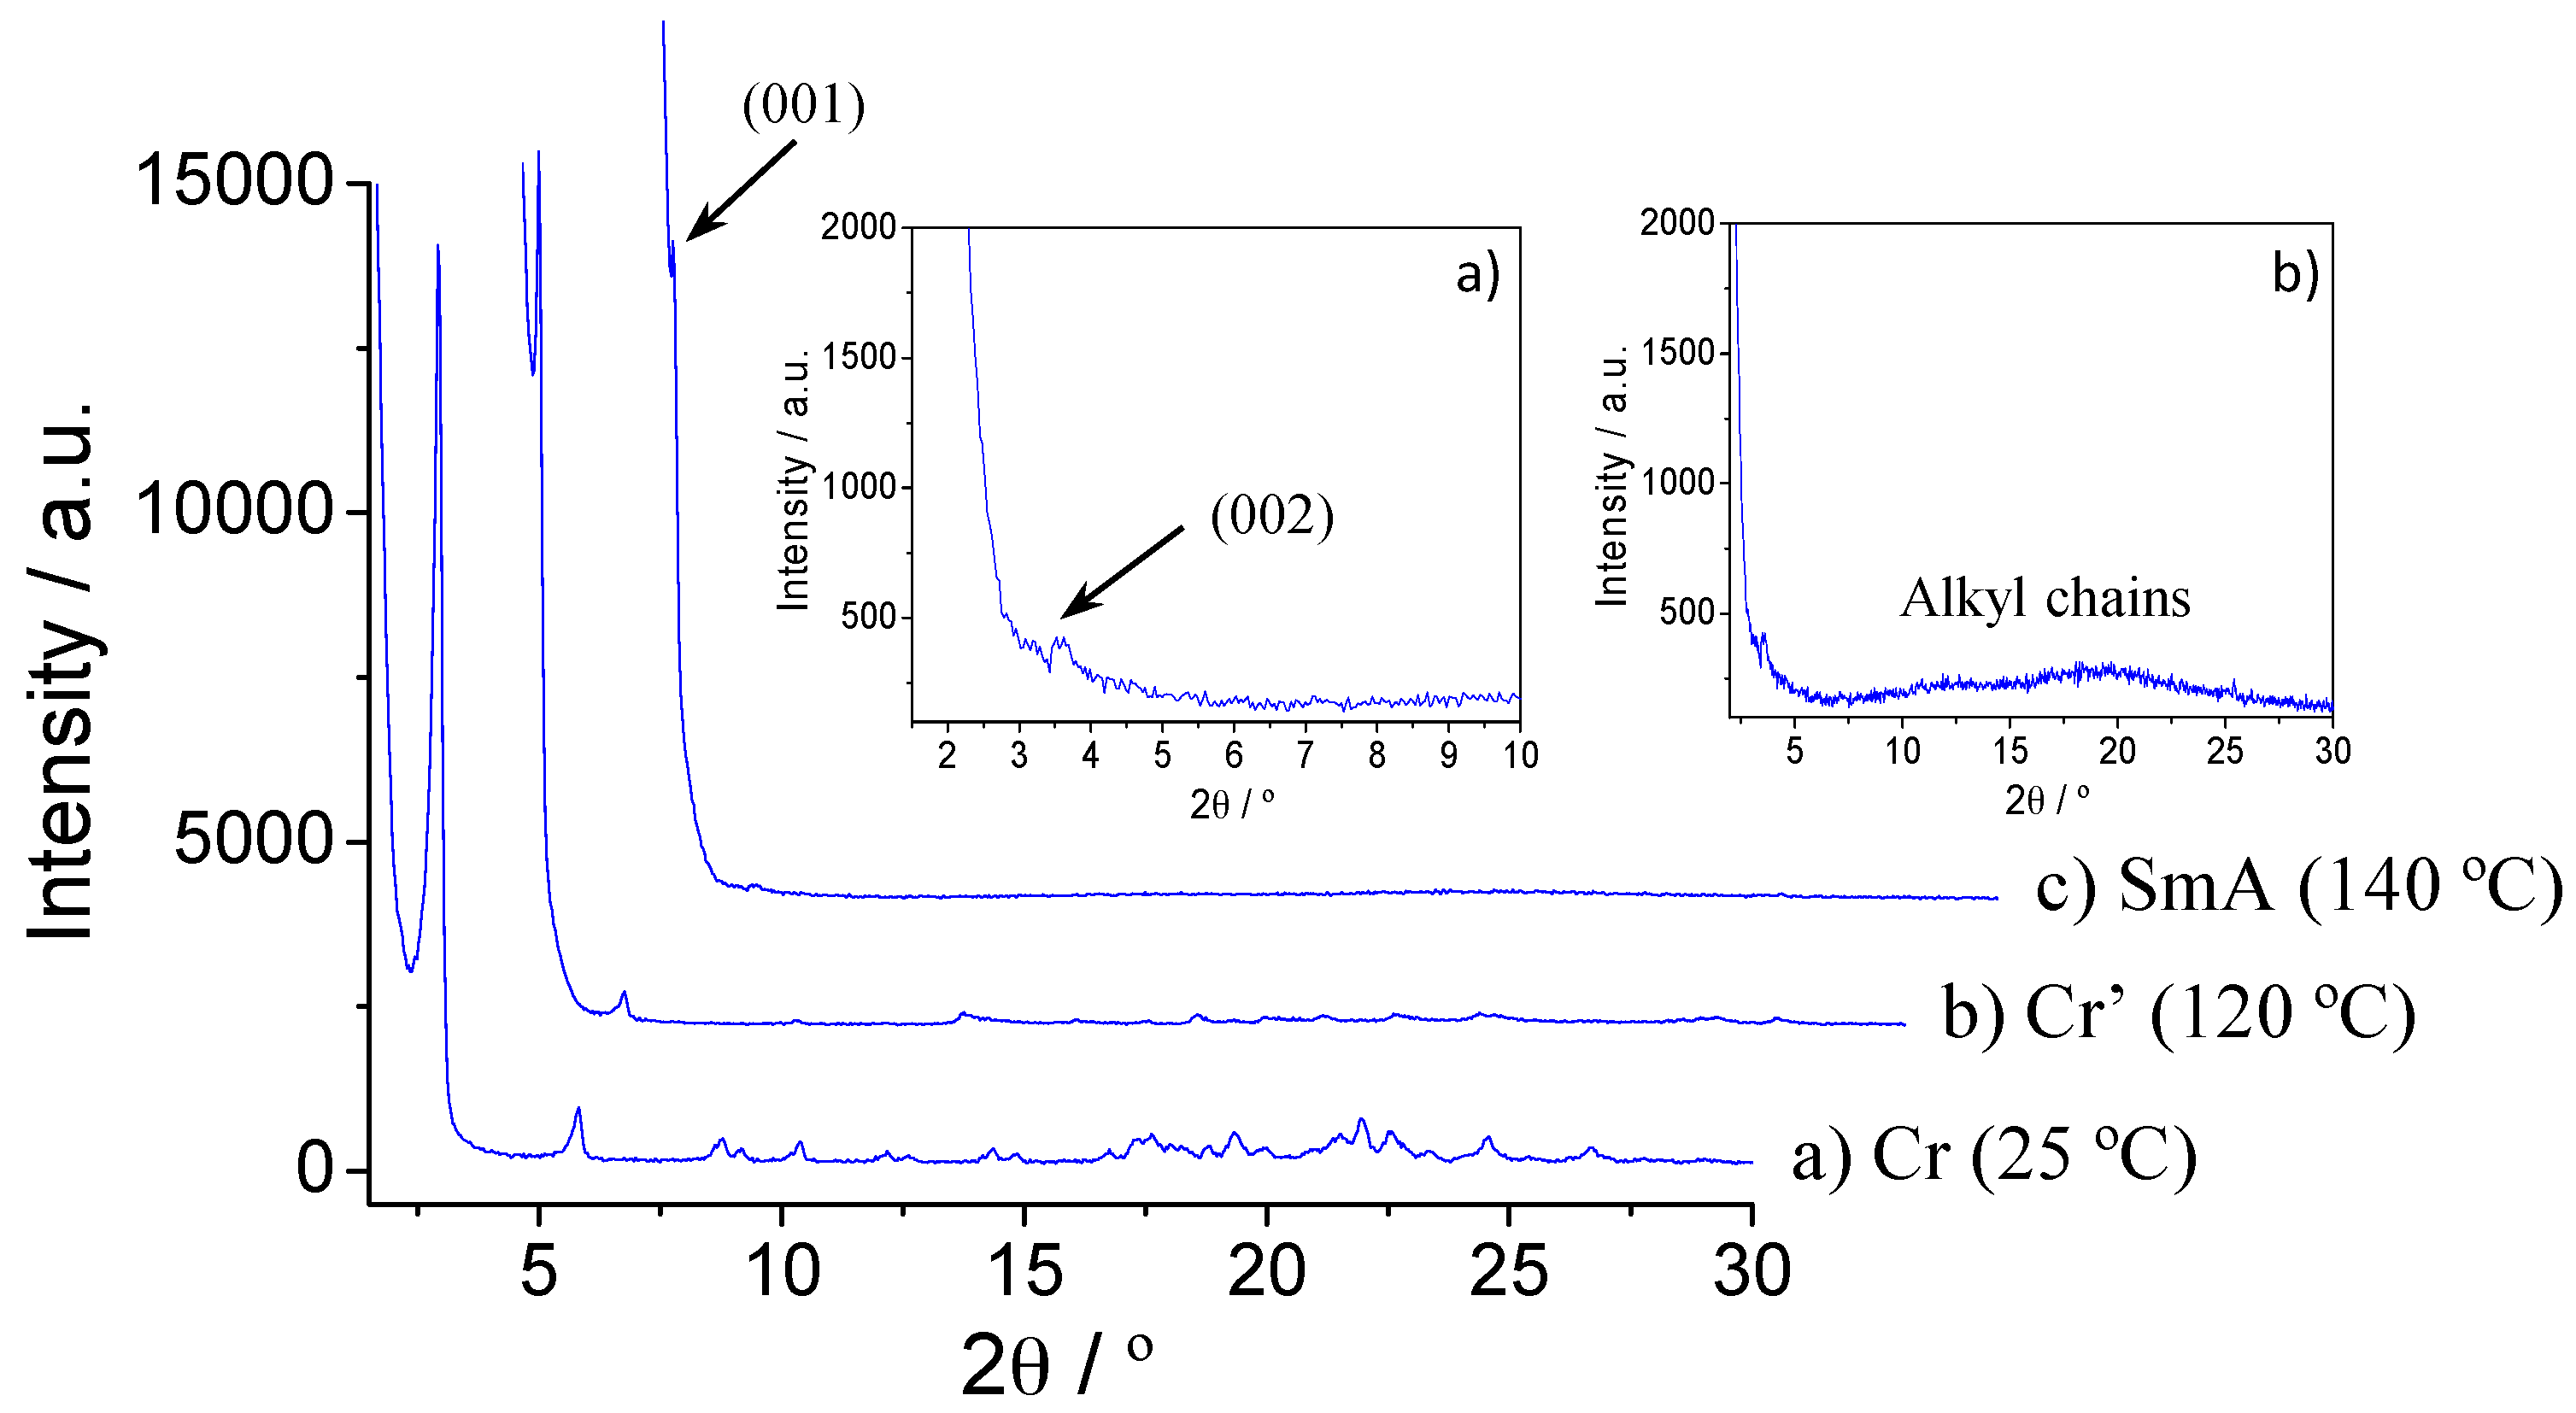
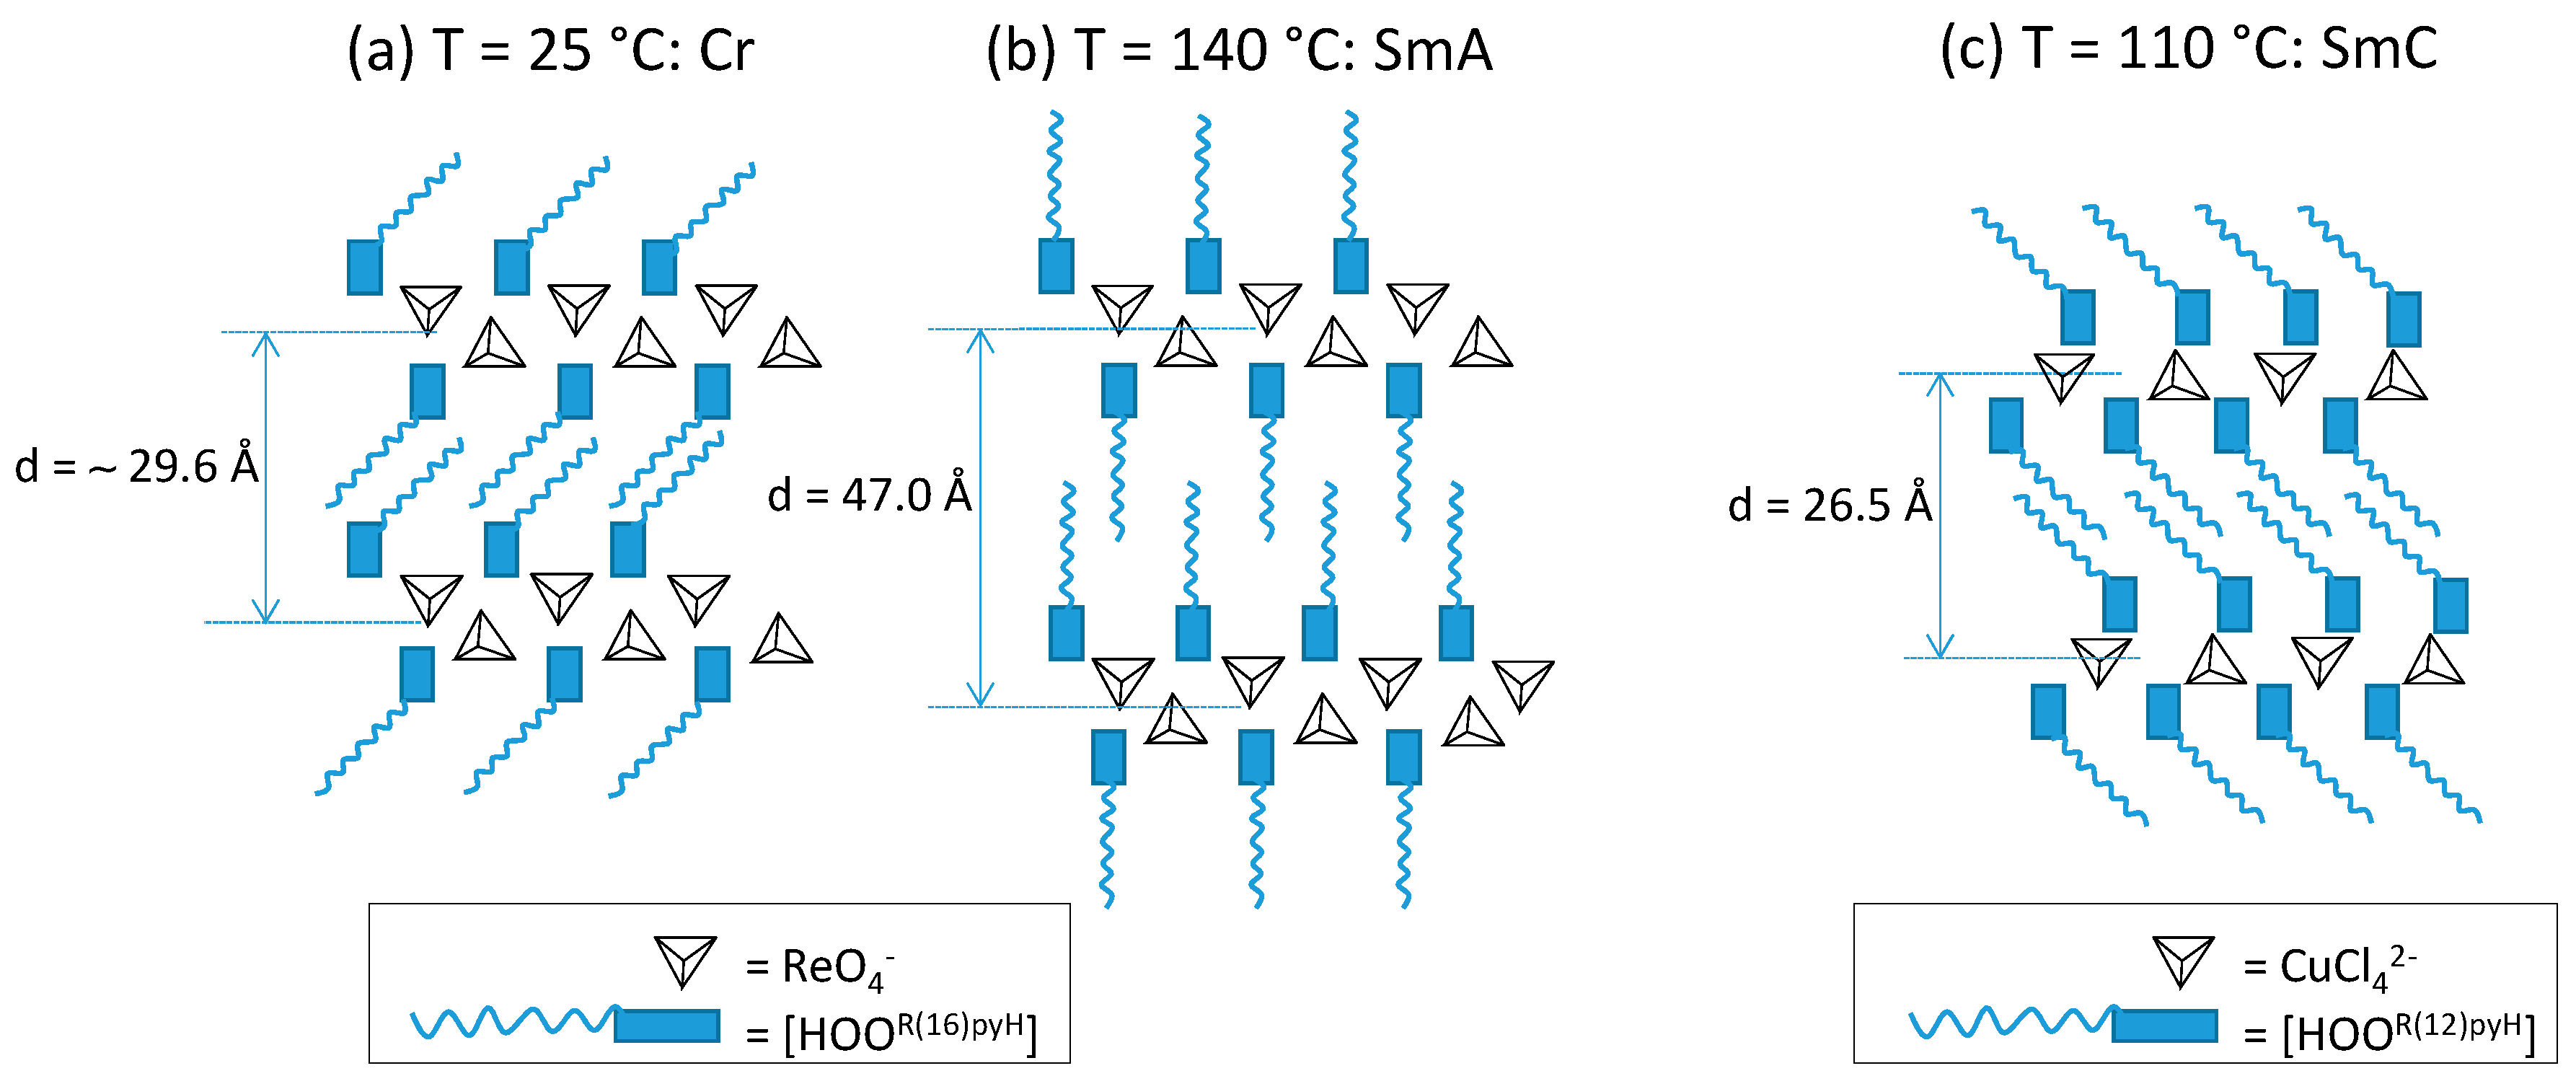
| ReO4-16 (7) | 140 | 1.8 | 47.0 | 47.0 | (001) | c = 47.0 |
| 3.6 | 24.5 | 23.5 | (002) | |||
| 20 | 4.9 | – | halo | |||
| CF3SO3-18 (12) | 160 | 2.8 | 31.5 | 31.5 | (001) | c = 31.5 |
| 5.6 | 15.7 | 15.7 | (002) | |||
| 18 | 5.4 | – | halo | |||
| NO3-12 (13) | 120 | 3.2 | 27.1 | 27.1 | (001) | c = 27.1 |
| 6.3 | 13.9 | 13.6 | (002) | |||
| 18.5 | 5.3 | – | halo | |||
| CuCl4-18 (18) | 103 | 3.3 | 26.5 | 26.5 | (001) | c = 26.5 |
| 6.8 | 13.0 | 13.2 | (002) | |||
| 10.2 | 8.7 | 8.8 | (003) | |||
| 18.5 | 5.3 | – | halo |
| [A] | EA (Solid) | EA (Mesophase) | σ410K (Ωcm)−1 |
|---|---|---|---|
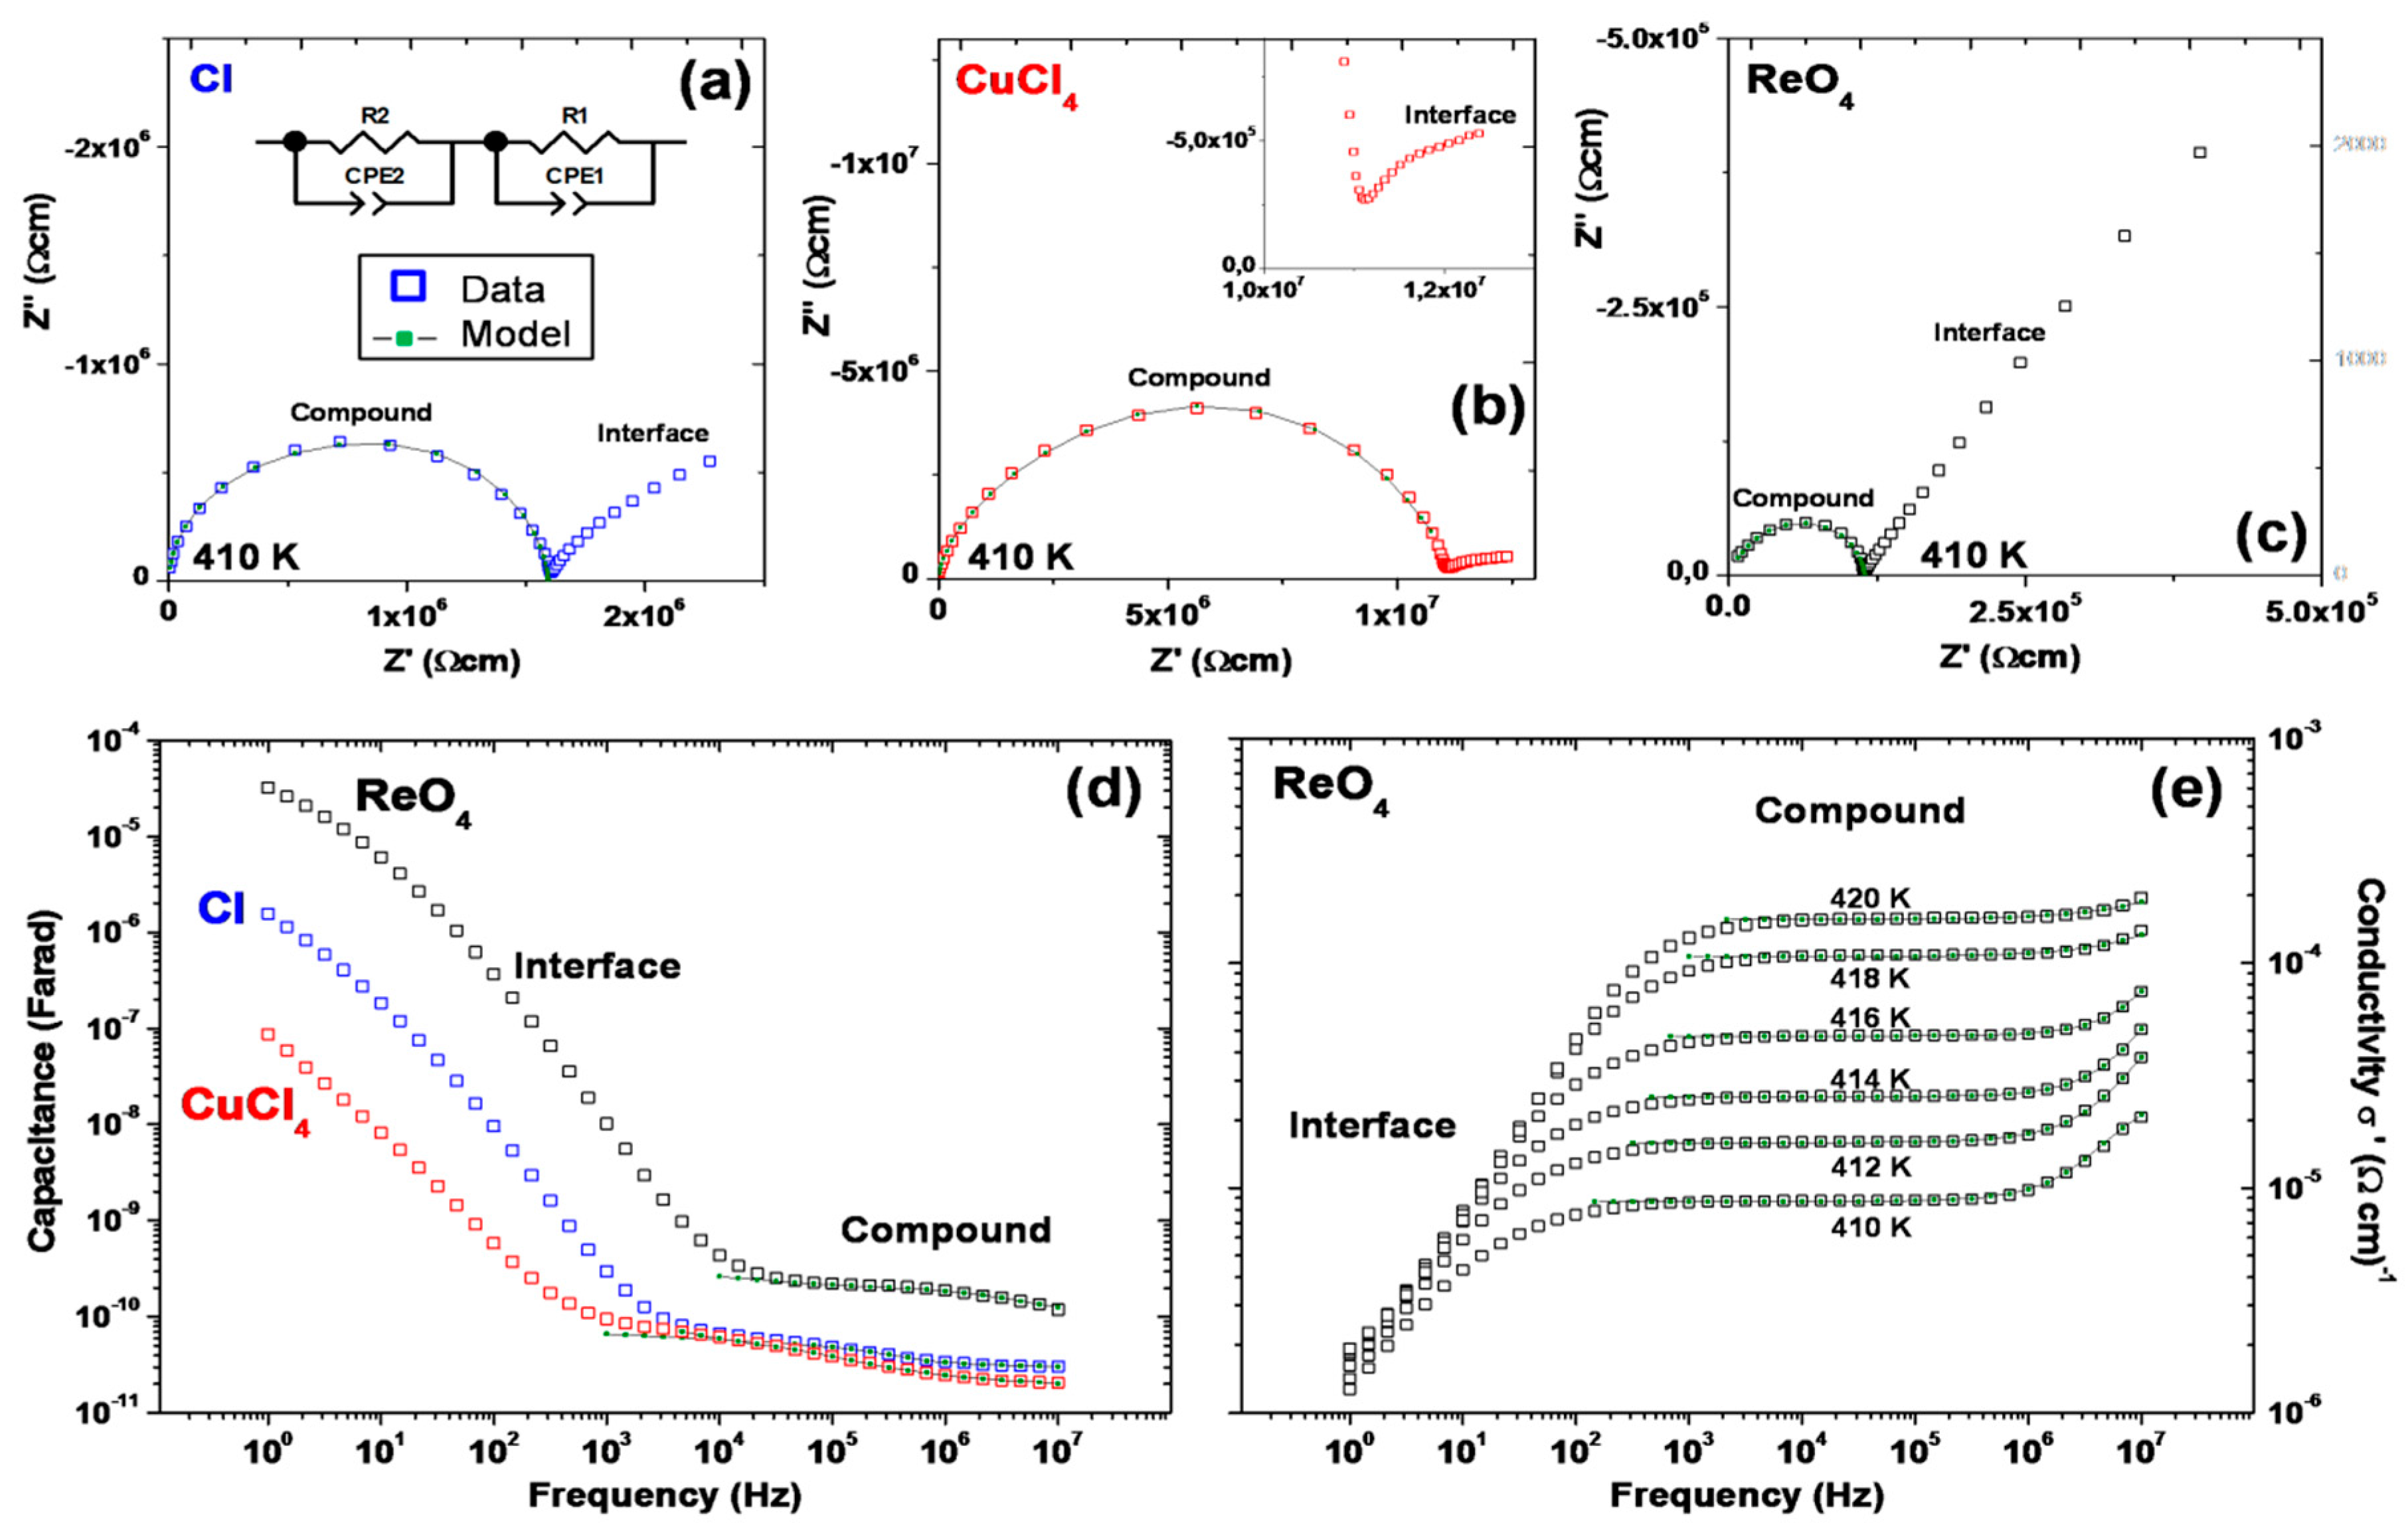
| Cl− | 3.08/3.14 | – | 6.3 × 10⁻⁷ |
| CuCl42− | 2.20 | 5.10 | 8.7 × 10⁻⁸ |
| ReO4− | 2.71 | 4.61 | 8.7 × 10⁻⁶ |
© 2016 by the authors; licensee MDPI, Basel, Switzerland. This article is an open access article distributed under the terms and conditions of the Creative Commons Attribution (CC-BY) license (http://creativecommons.org/licenses/by/4.0/).
Share and Cite
Pastor, M.J.; Cuerva, C.; Campo, J.A.; Schmidt, R.; Torres, M.R.; Cano, M. Diketonylpyridinium Cations as a Support of New Ionic Liquid Crystals and Ion-Conductive Materials: Analysis of Counter-Ion Effects. Materials 2016, 9, 360. https://doi.org/10.3390/ma9050360
Pastor MJ, Cuerva C, Campo JA, Schmidt R, Torres MR, Cano M. Diketonylpyridinium Cations as a Support of New Ionic Liquid Crystals and Ion-Conductive Materials: Analysis of Counter-Ion Effects. Materials. 2016; 9(5):360. https://doi.org/10.3390/ma9050360
Chicago/Turabian StylePastor, María Jesús, Cristián Cuerva, José A. Campo, Rainer Schmidt, María Rosario Torres, and Mercedes Cano. 2016. "Diketonylpyridinium Cations as a Support of New Ionic Liquid Crystals and Ion-Conductive Materials: Analysis of Counter-Ion Effects" Materials 9, no. 5: 360. https://doi.org/10.3390/ma9050360