
Effect of Tartaric Acid on Hydration of a Sodium-Metasilicate-Activated Blend of Calcium Aluminate Cement and Fly Ash F

Abstract
:1. Introduction
2. Materials and Methods
2.1. Materials and Samples Preparation
2.2. Testing Methods
3. Results
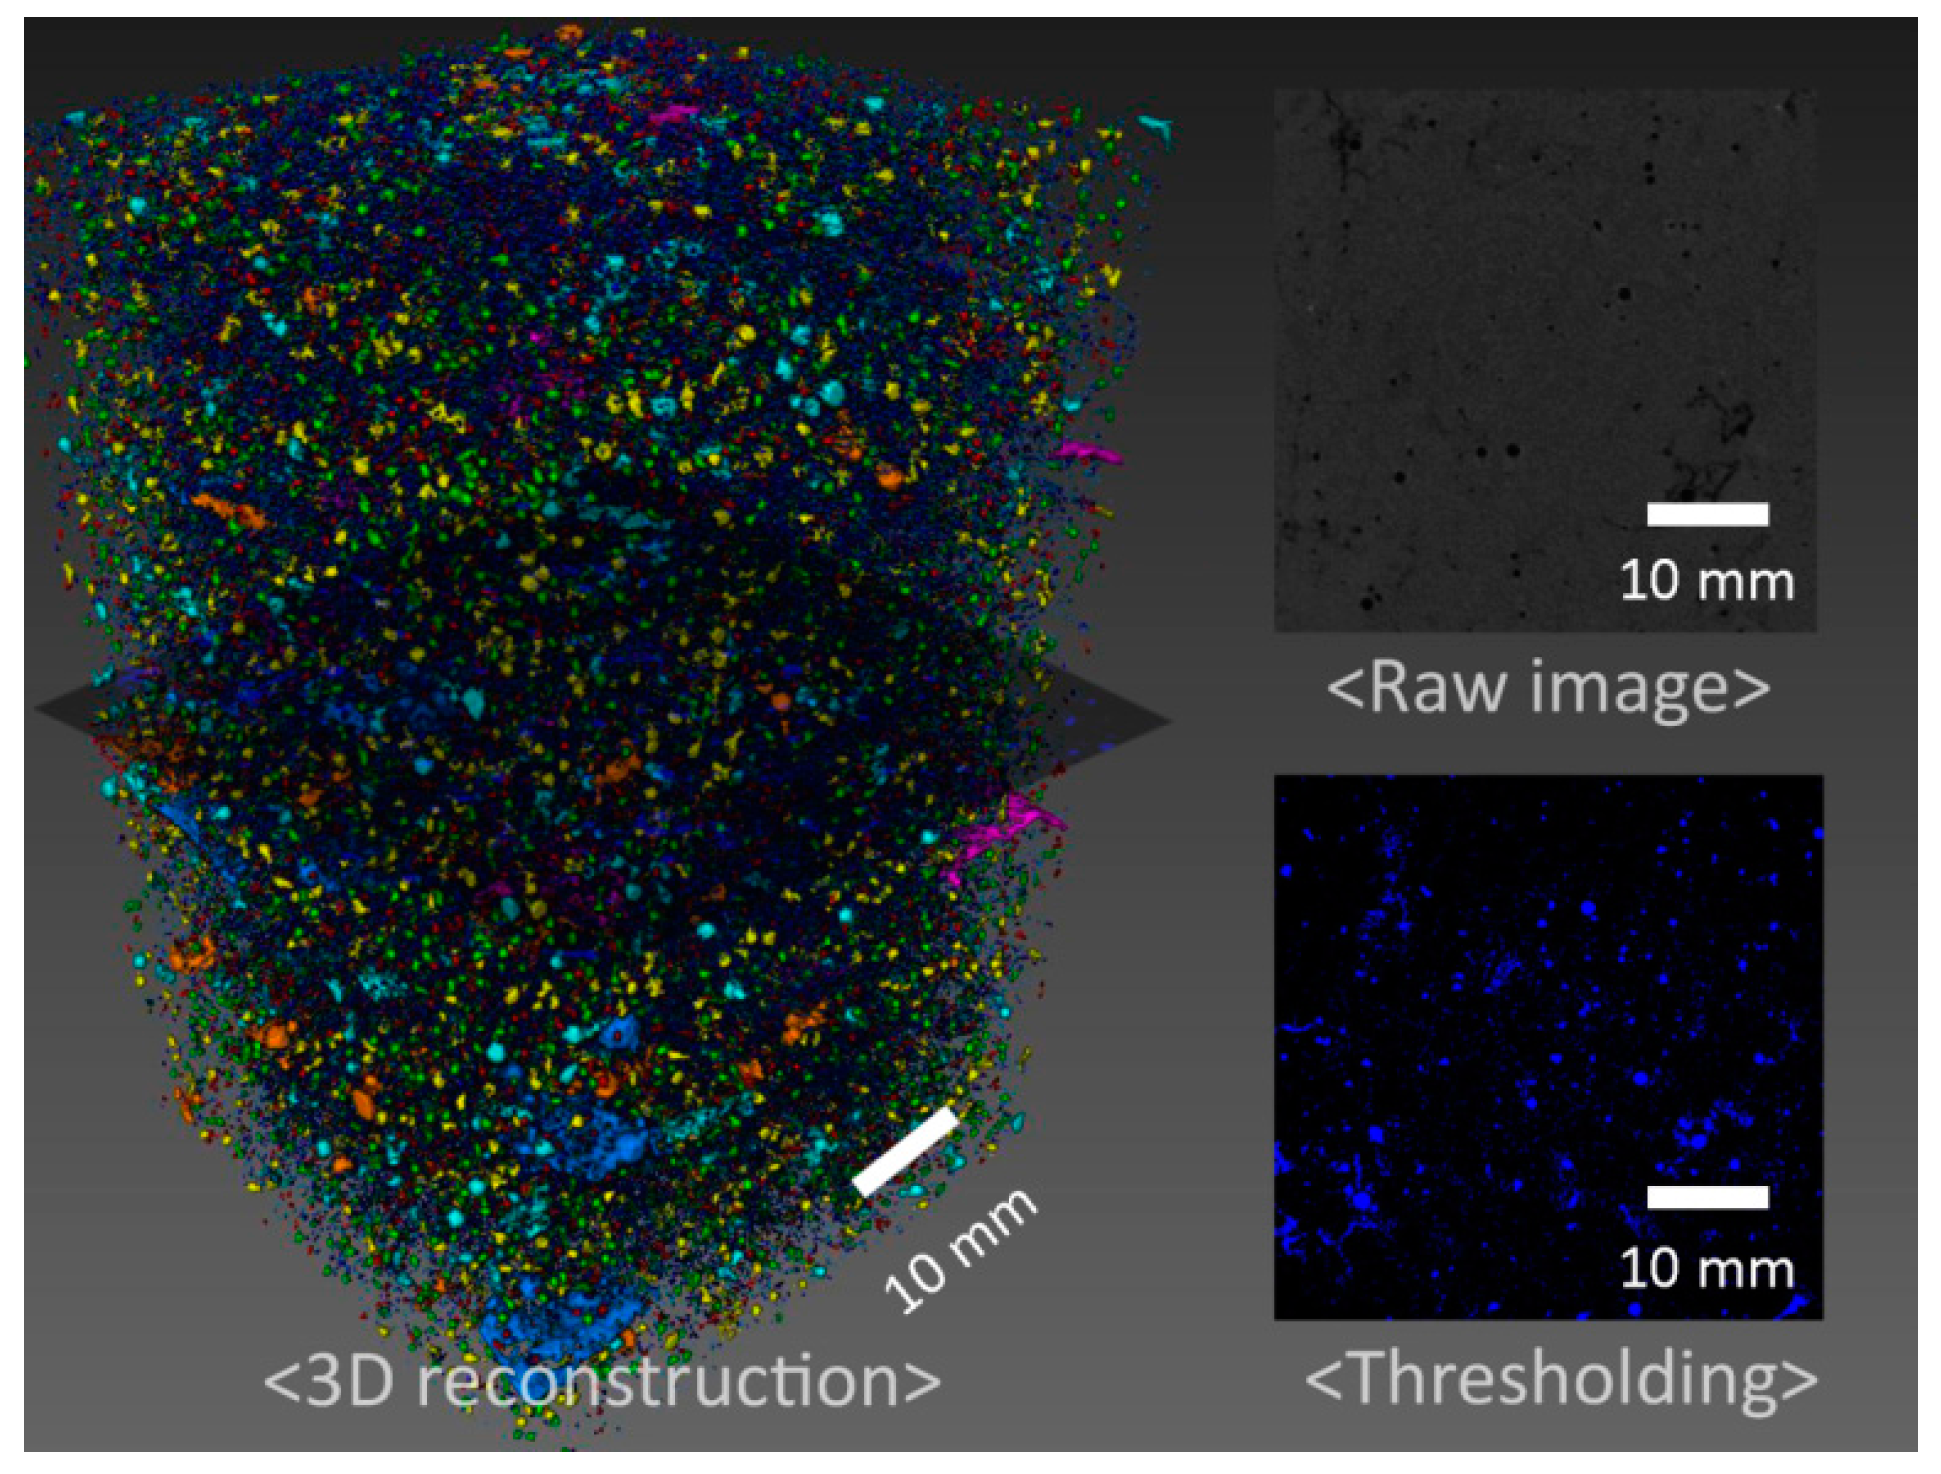
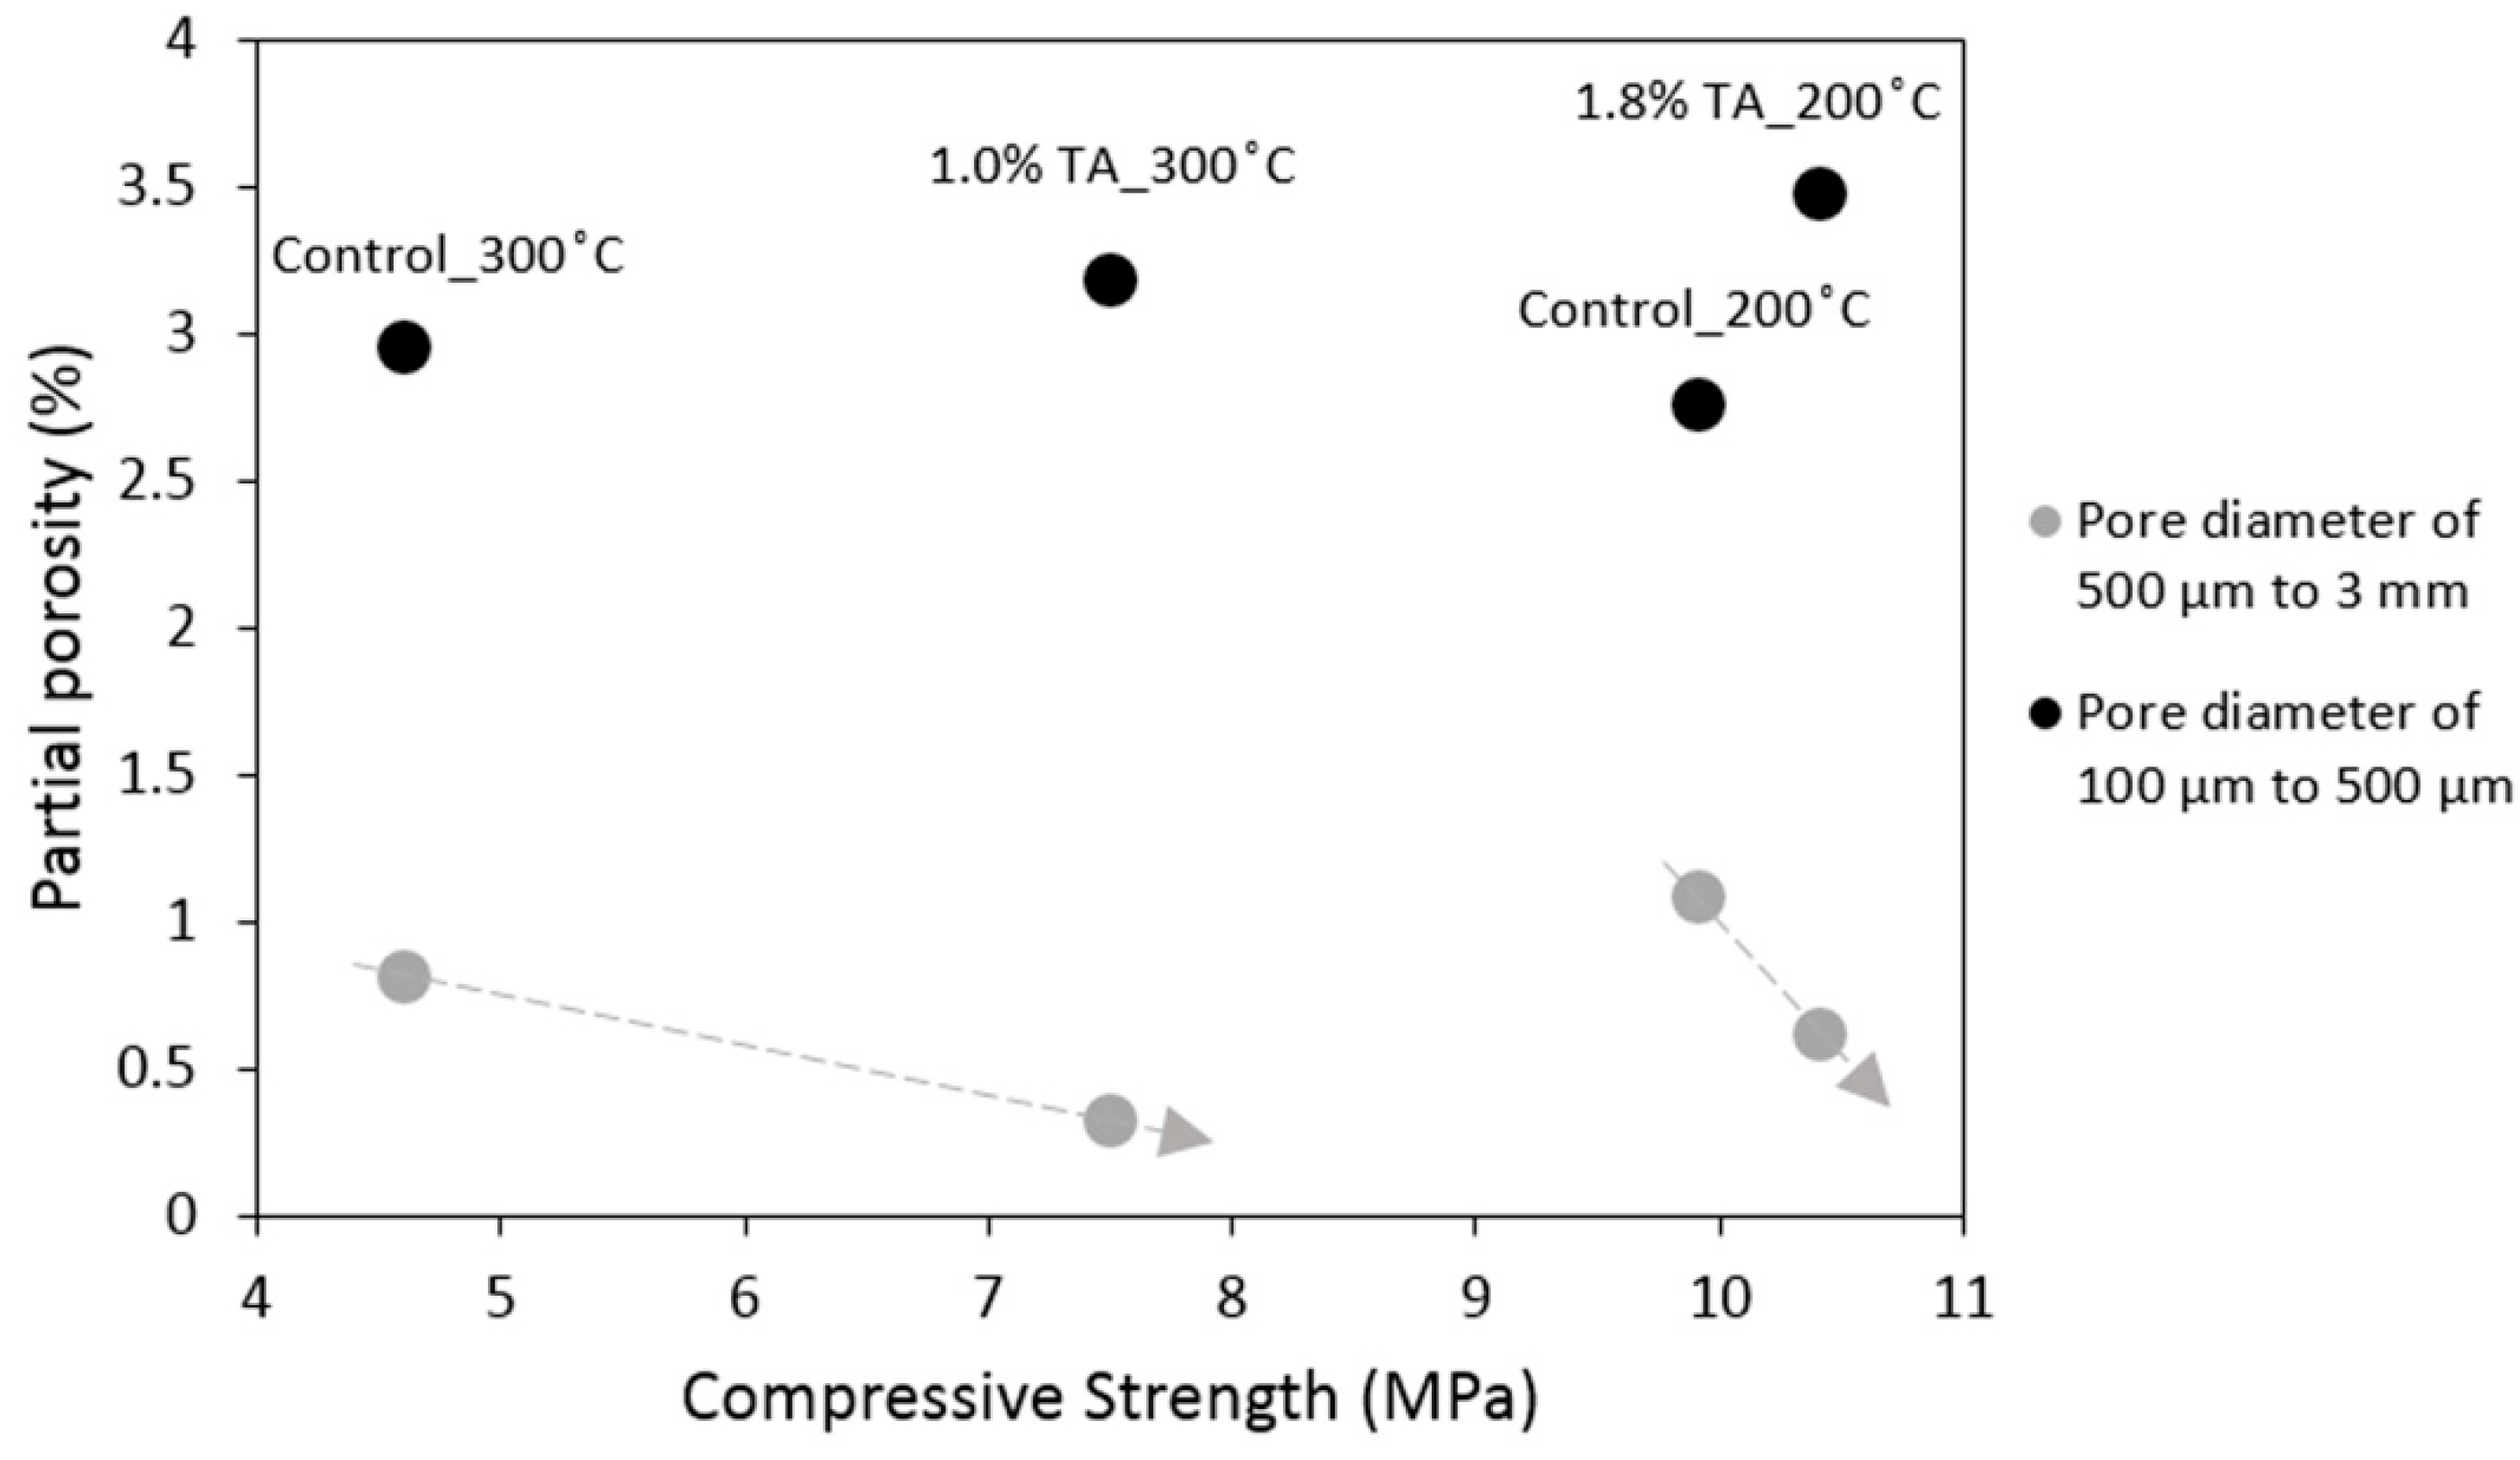
3.1. Mechanical Properties and Tomography Study
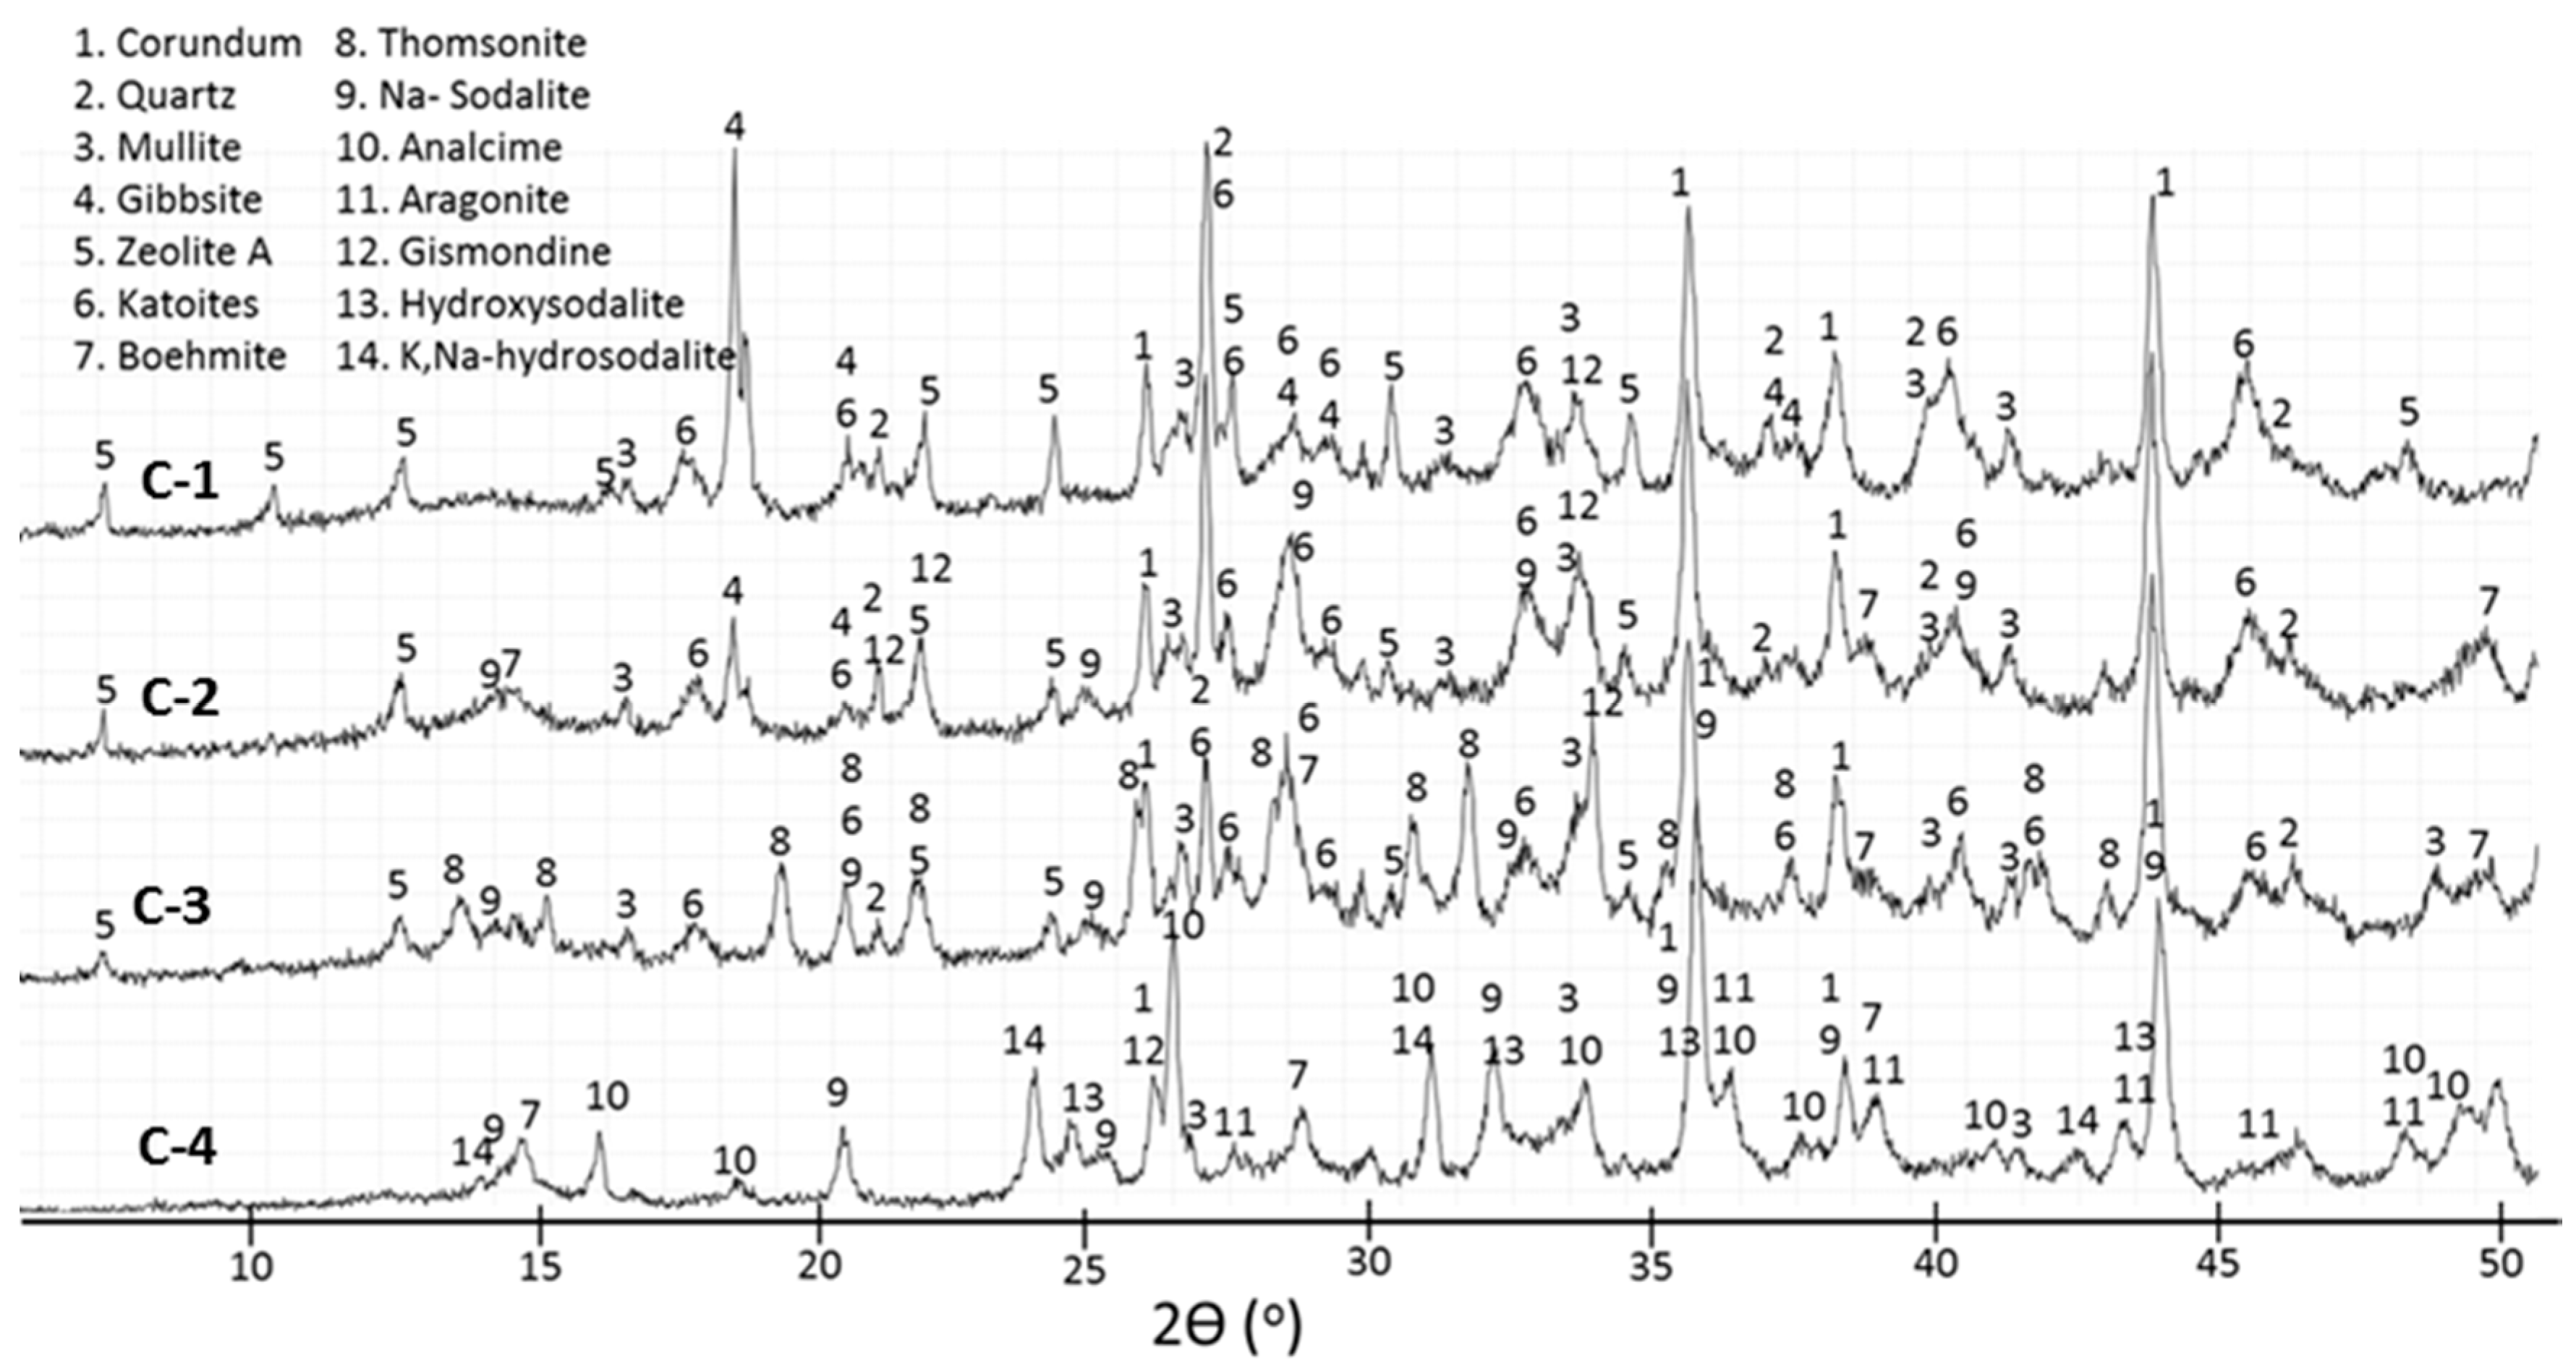
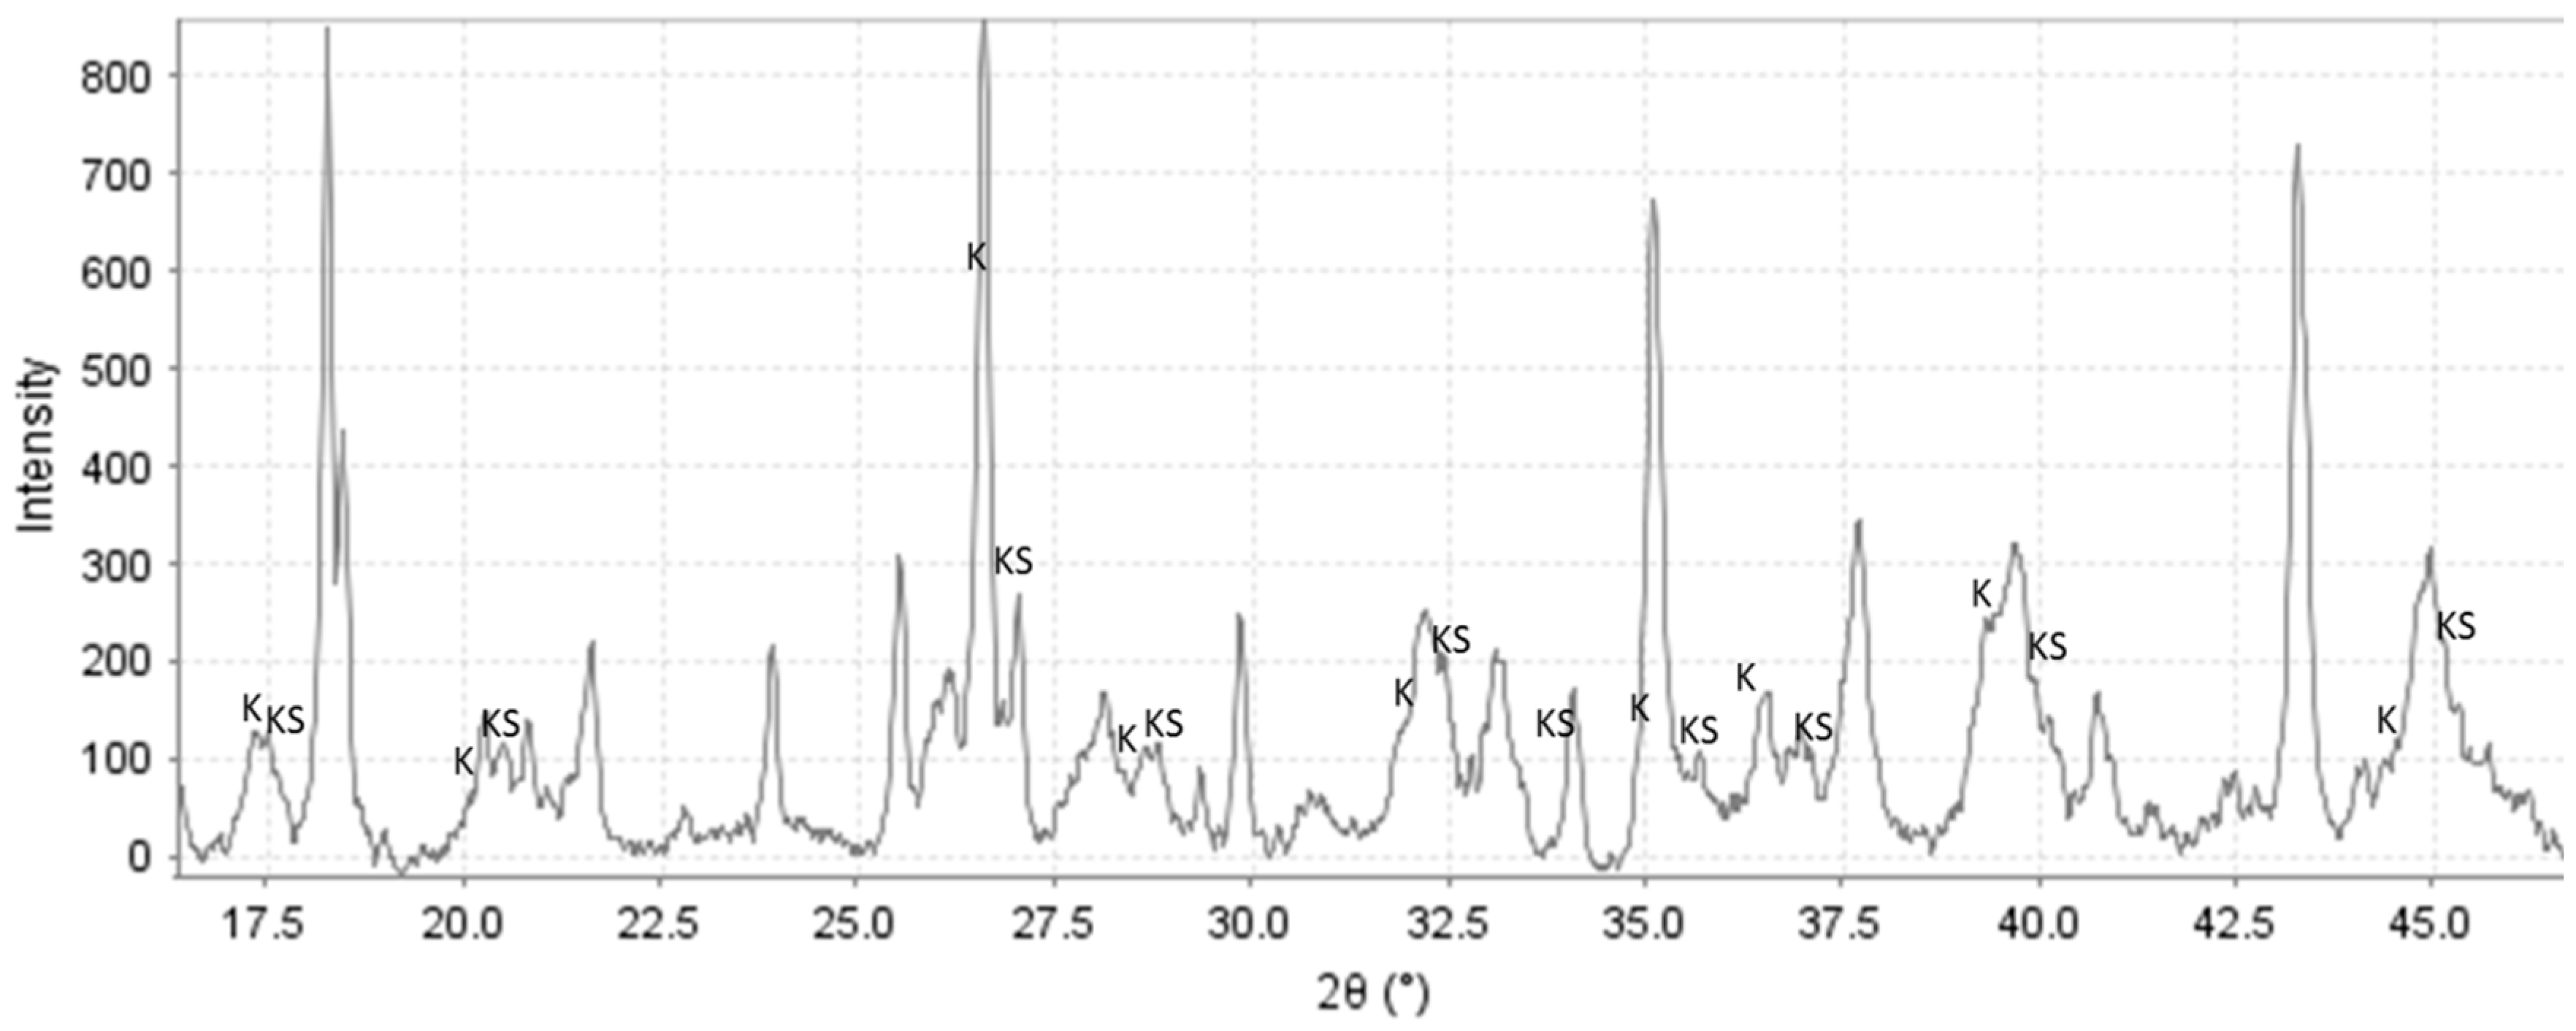
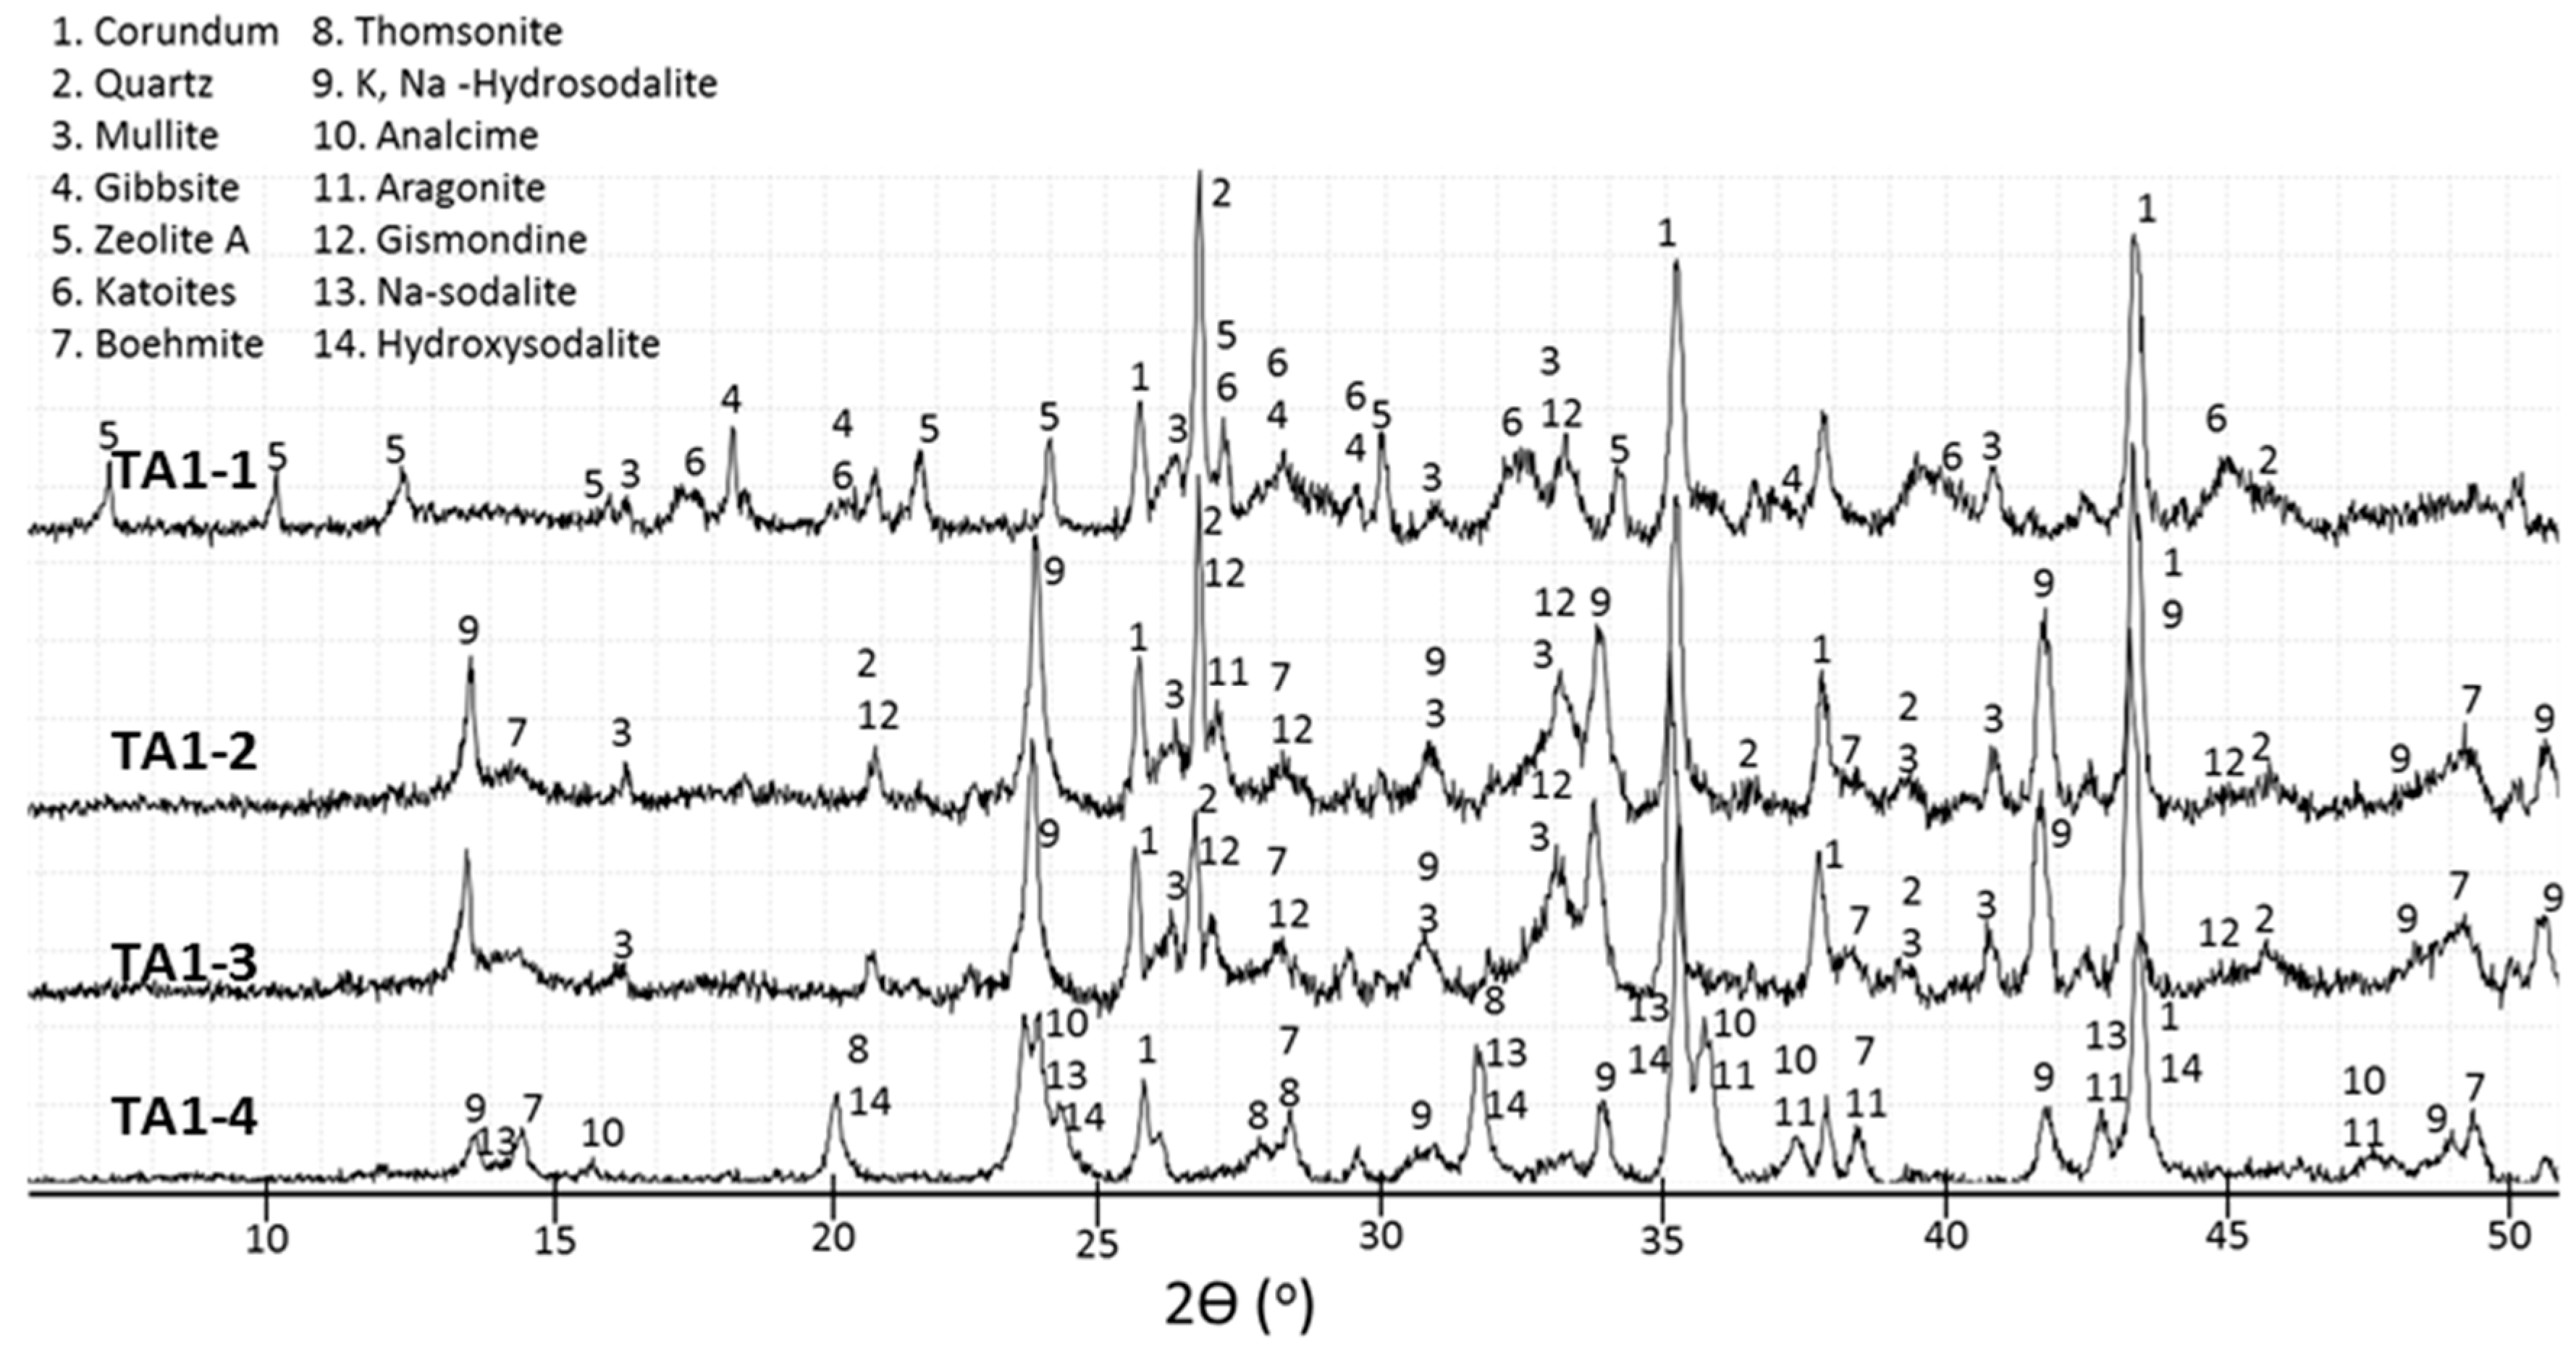
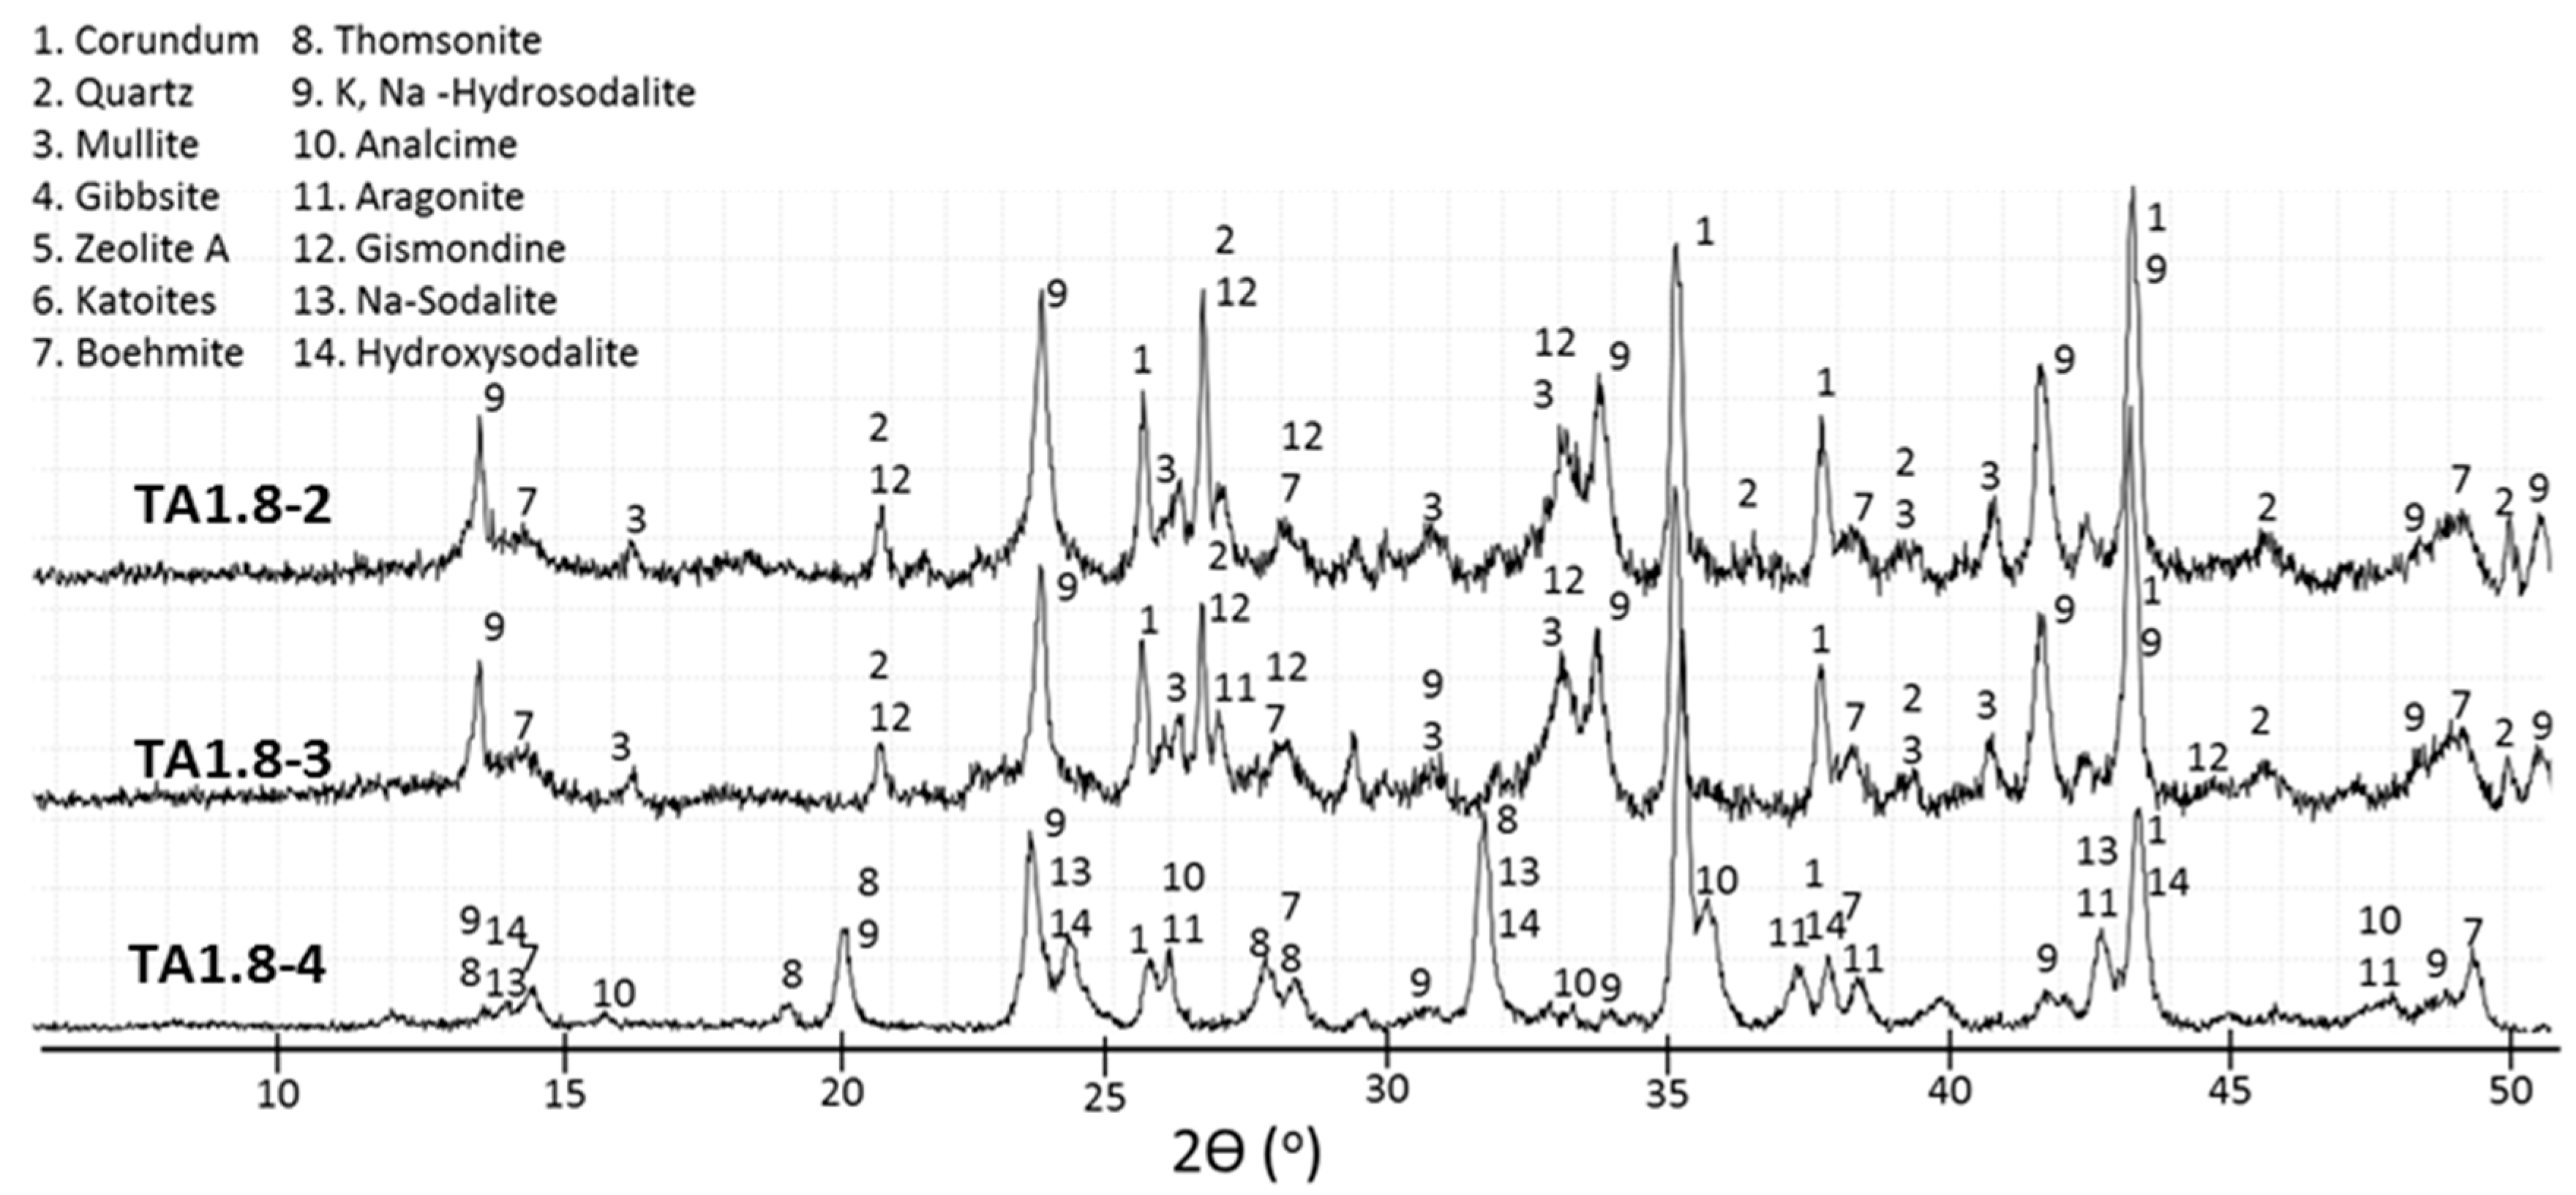
3.2. XRD Study
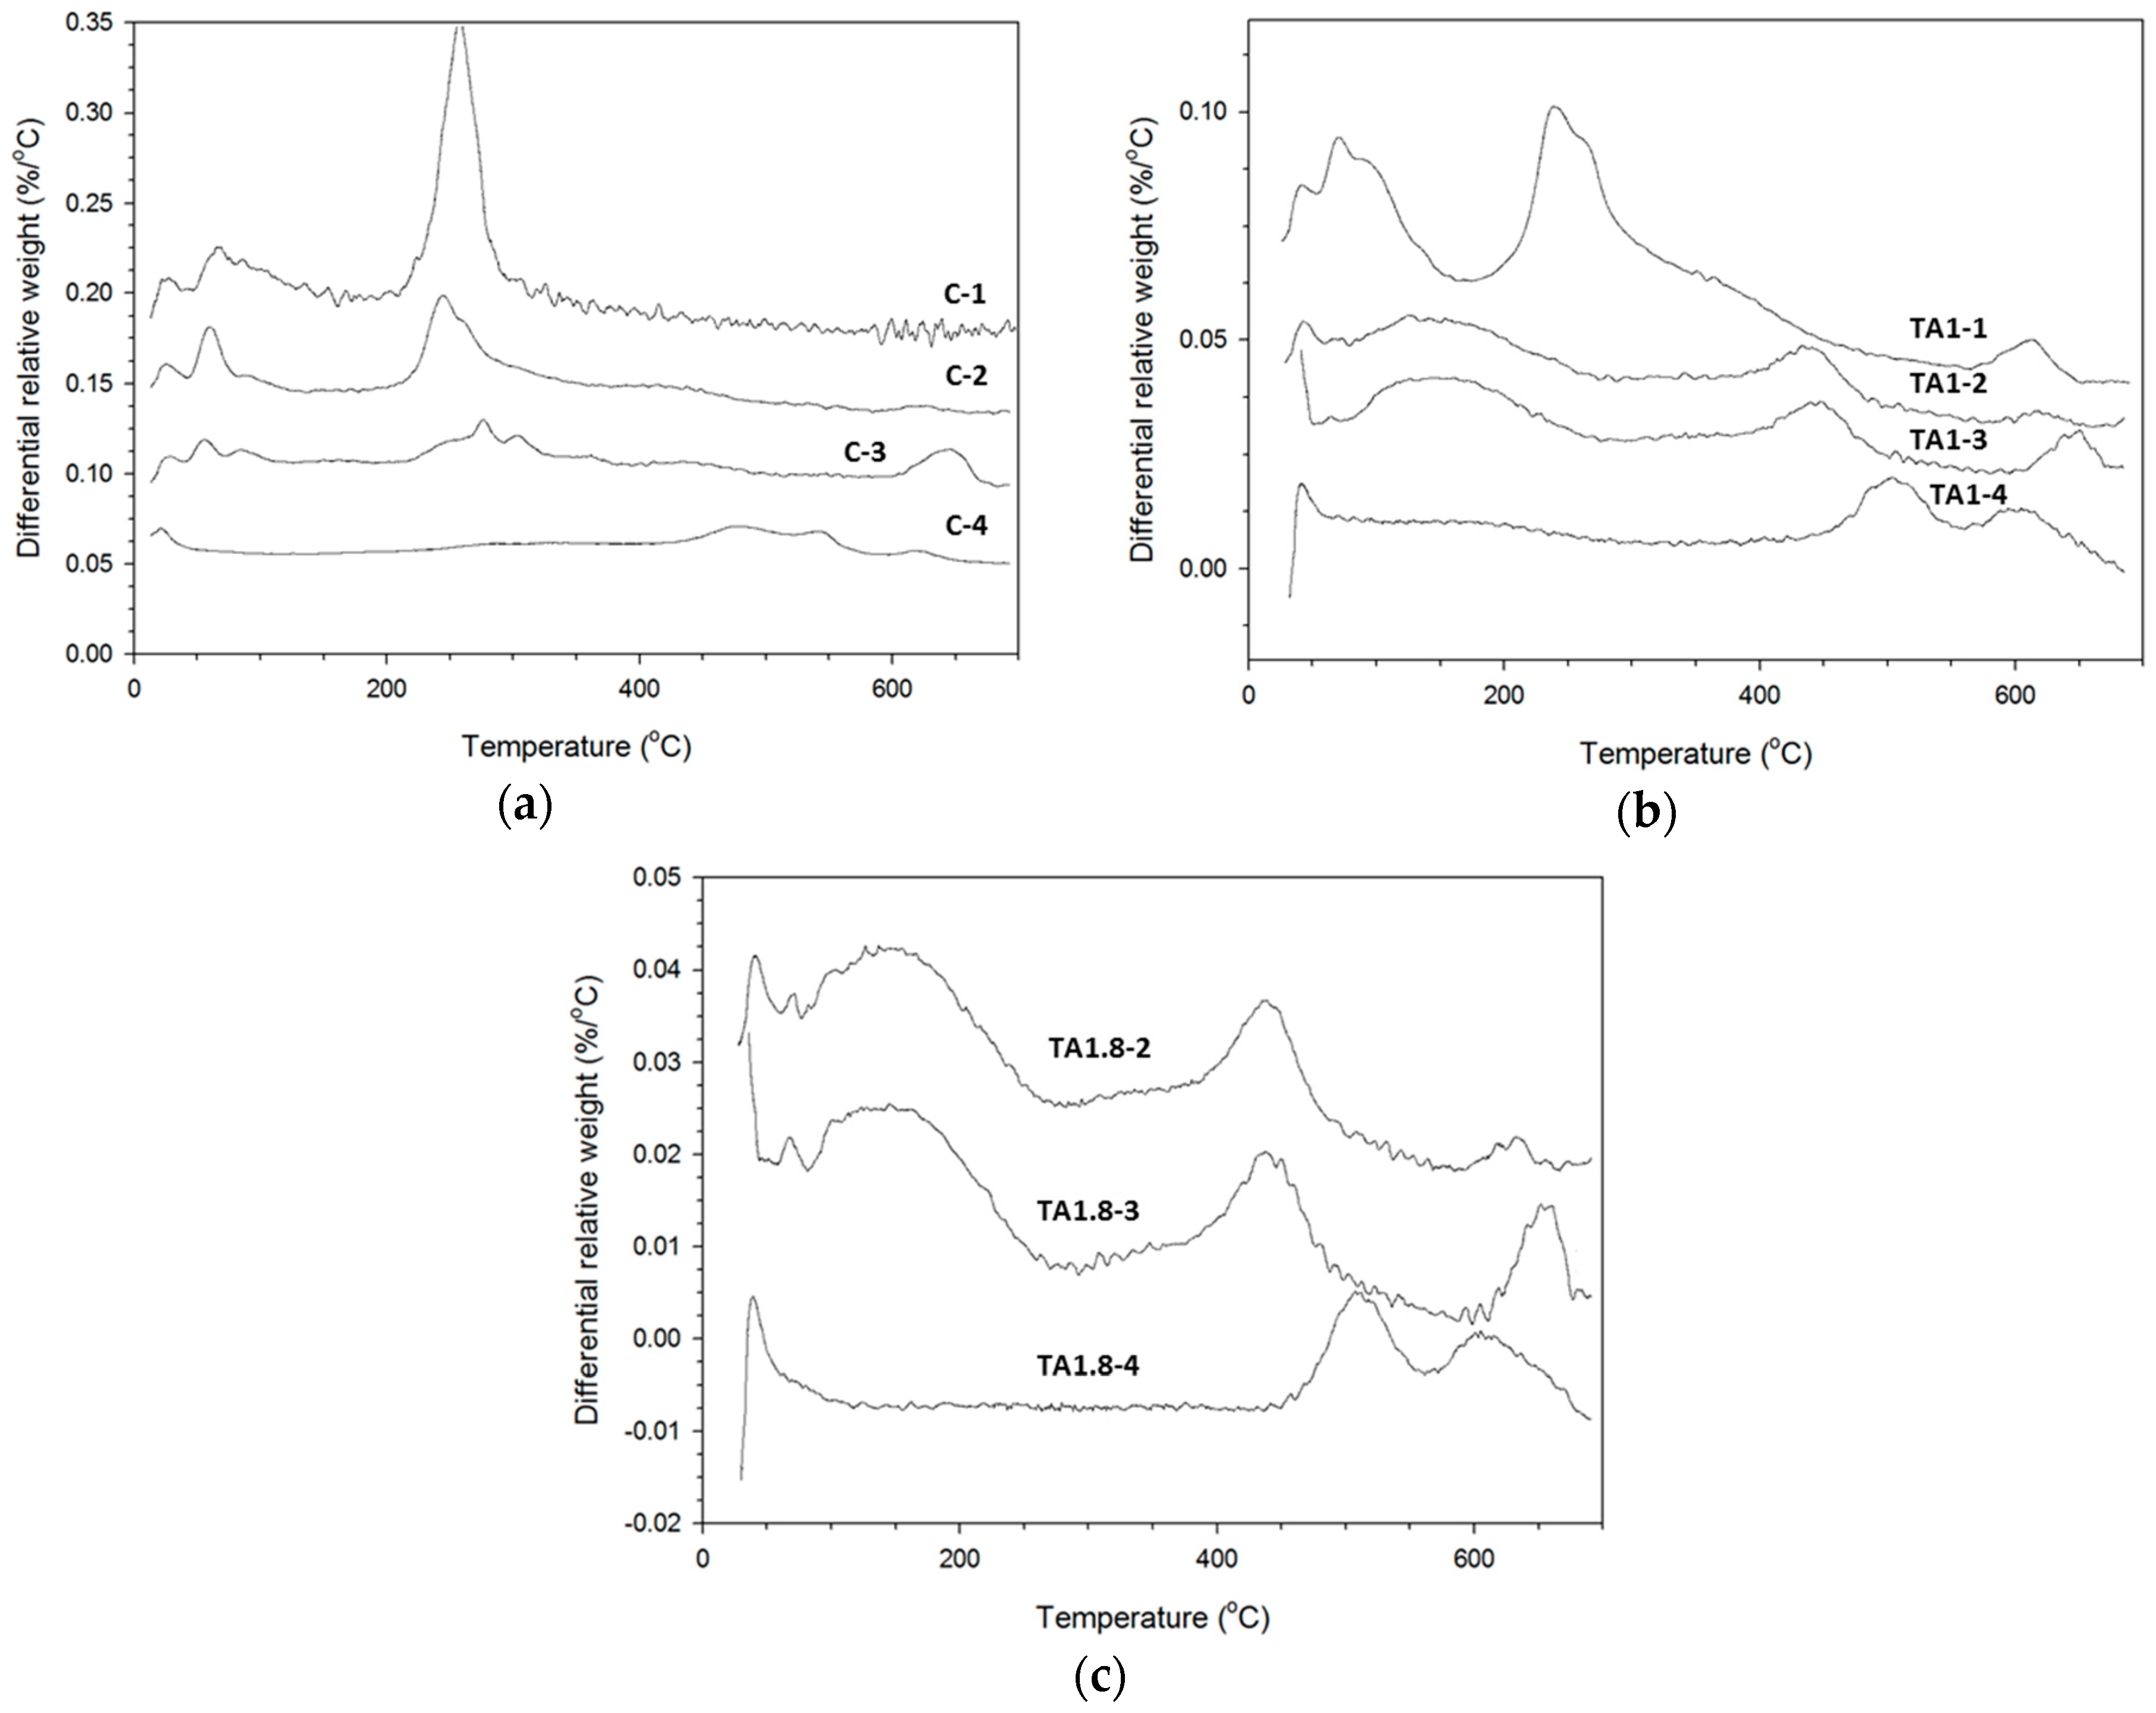
3.3. TGA Study
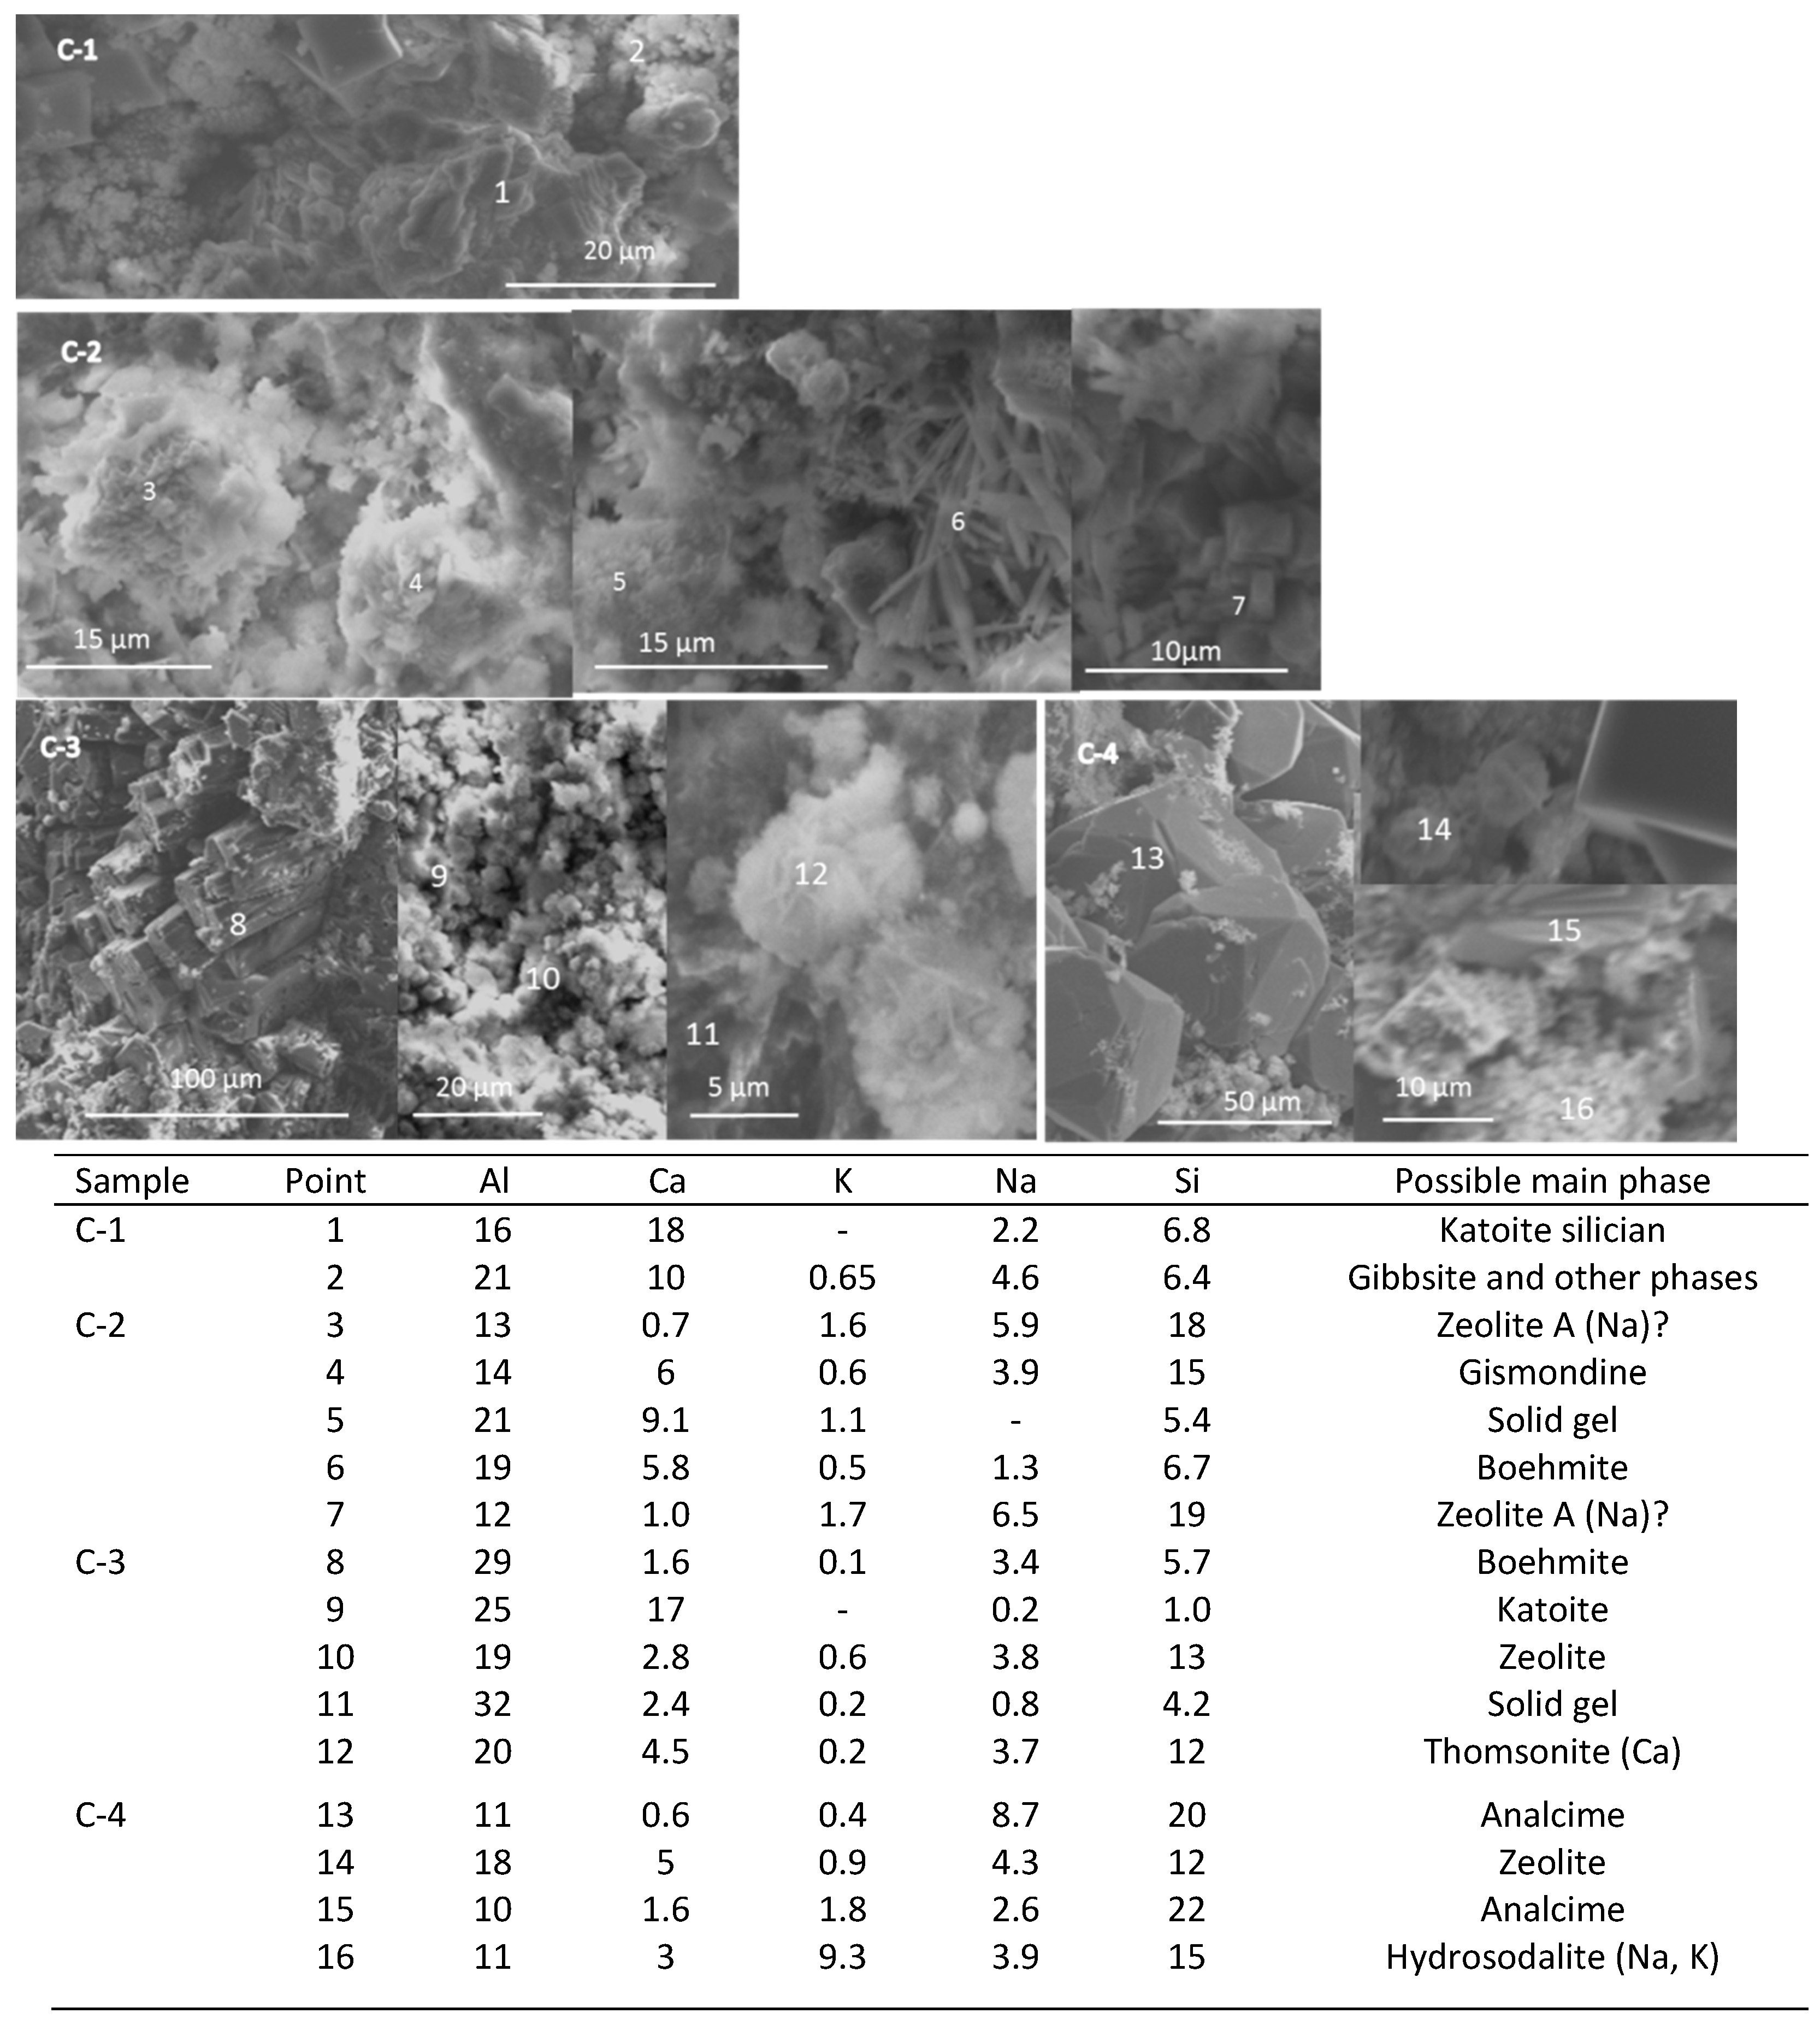
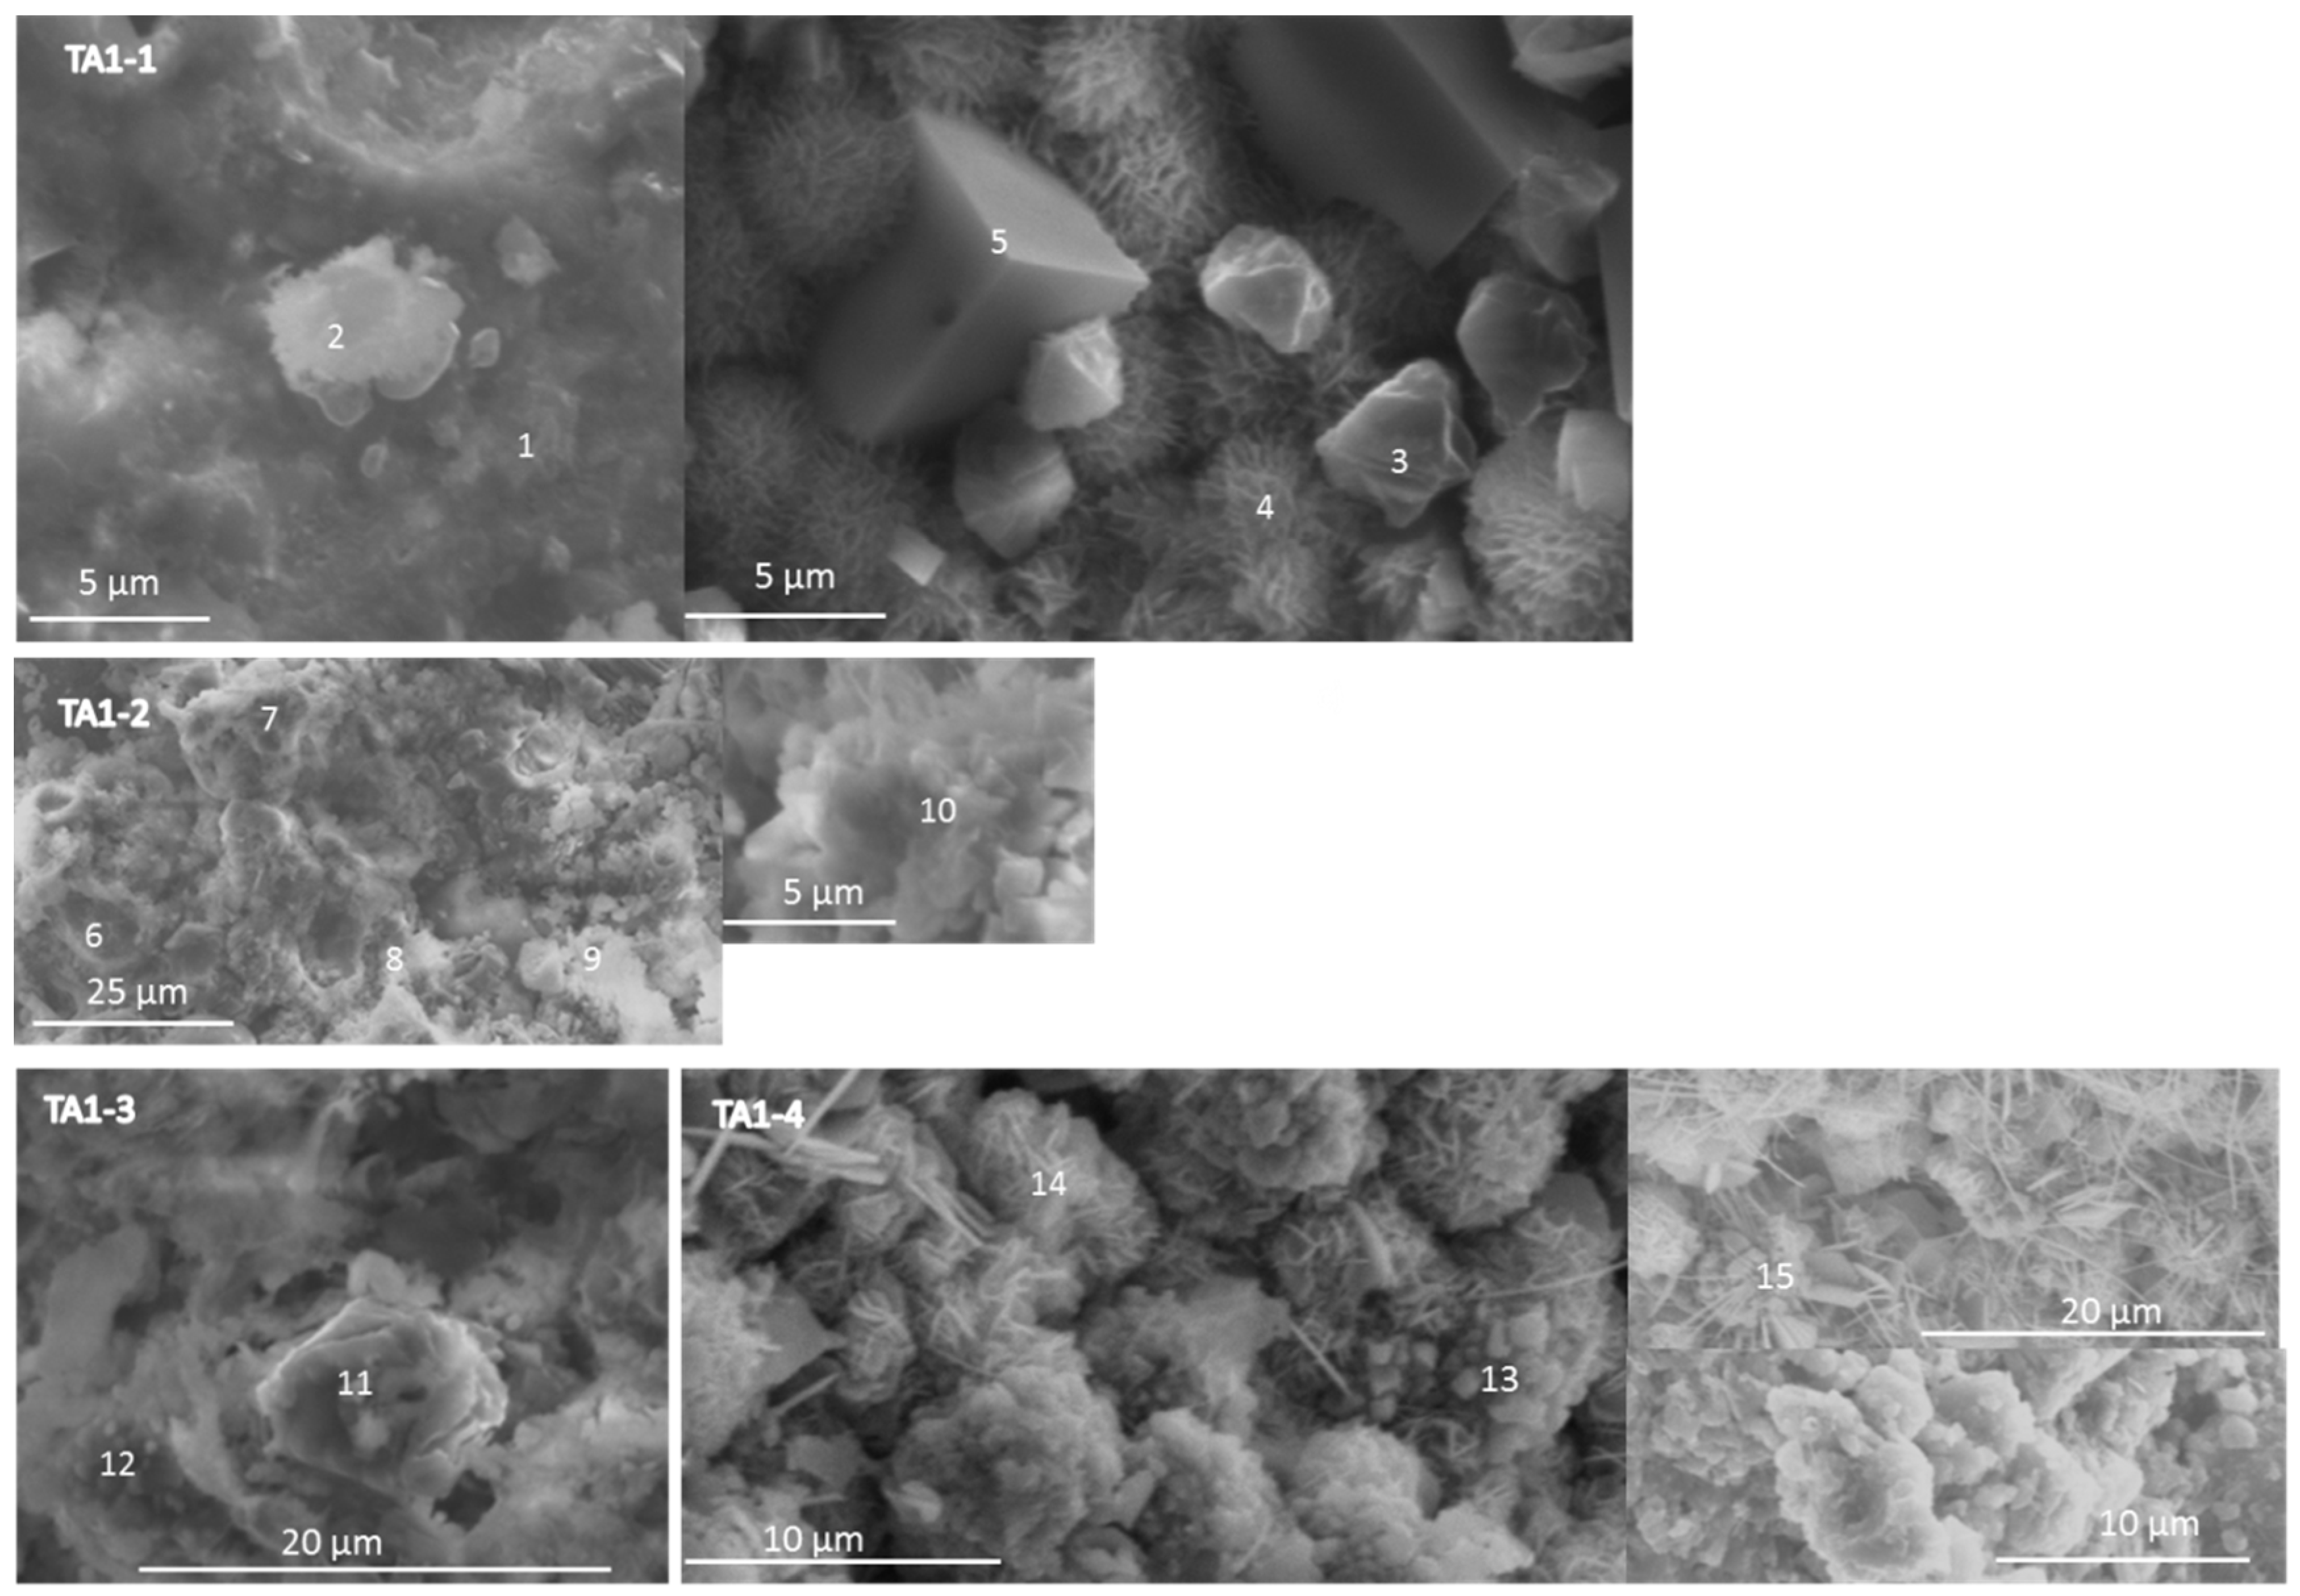
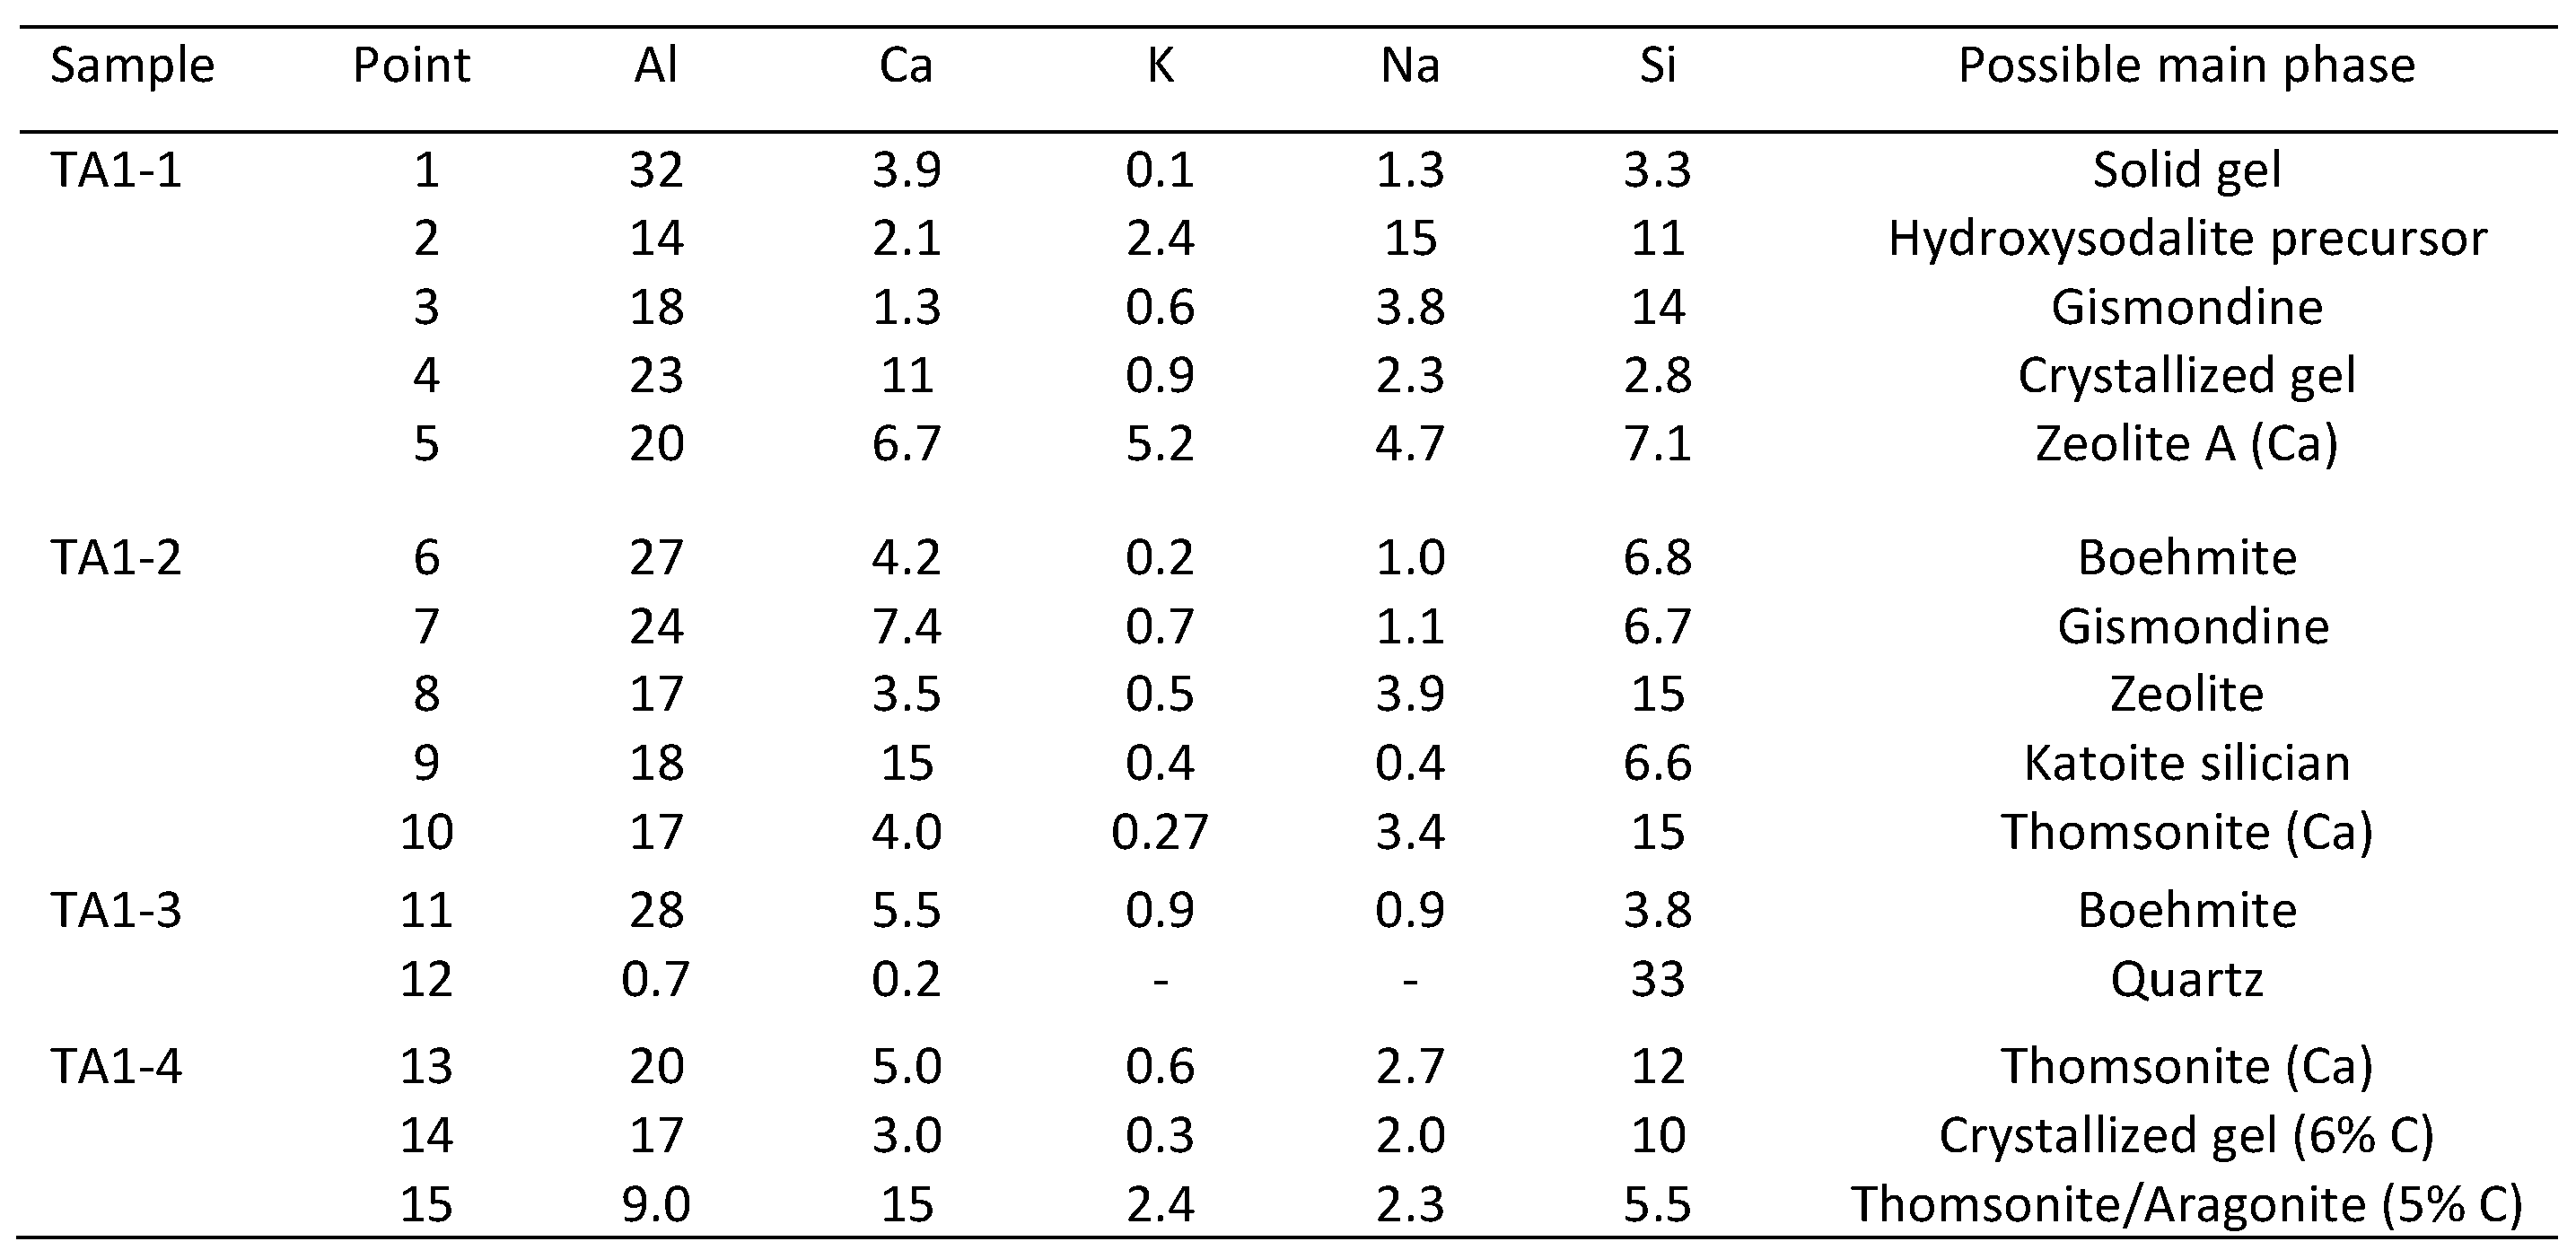
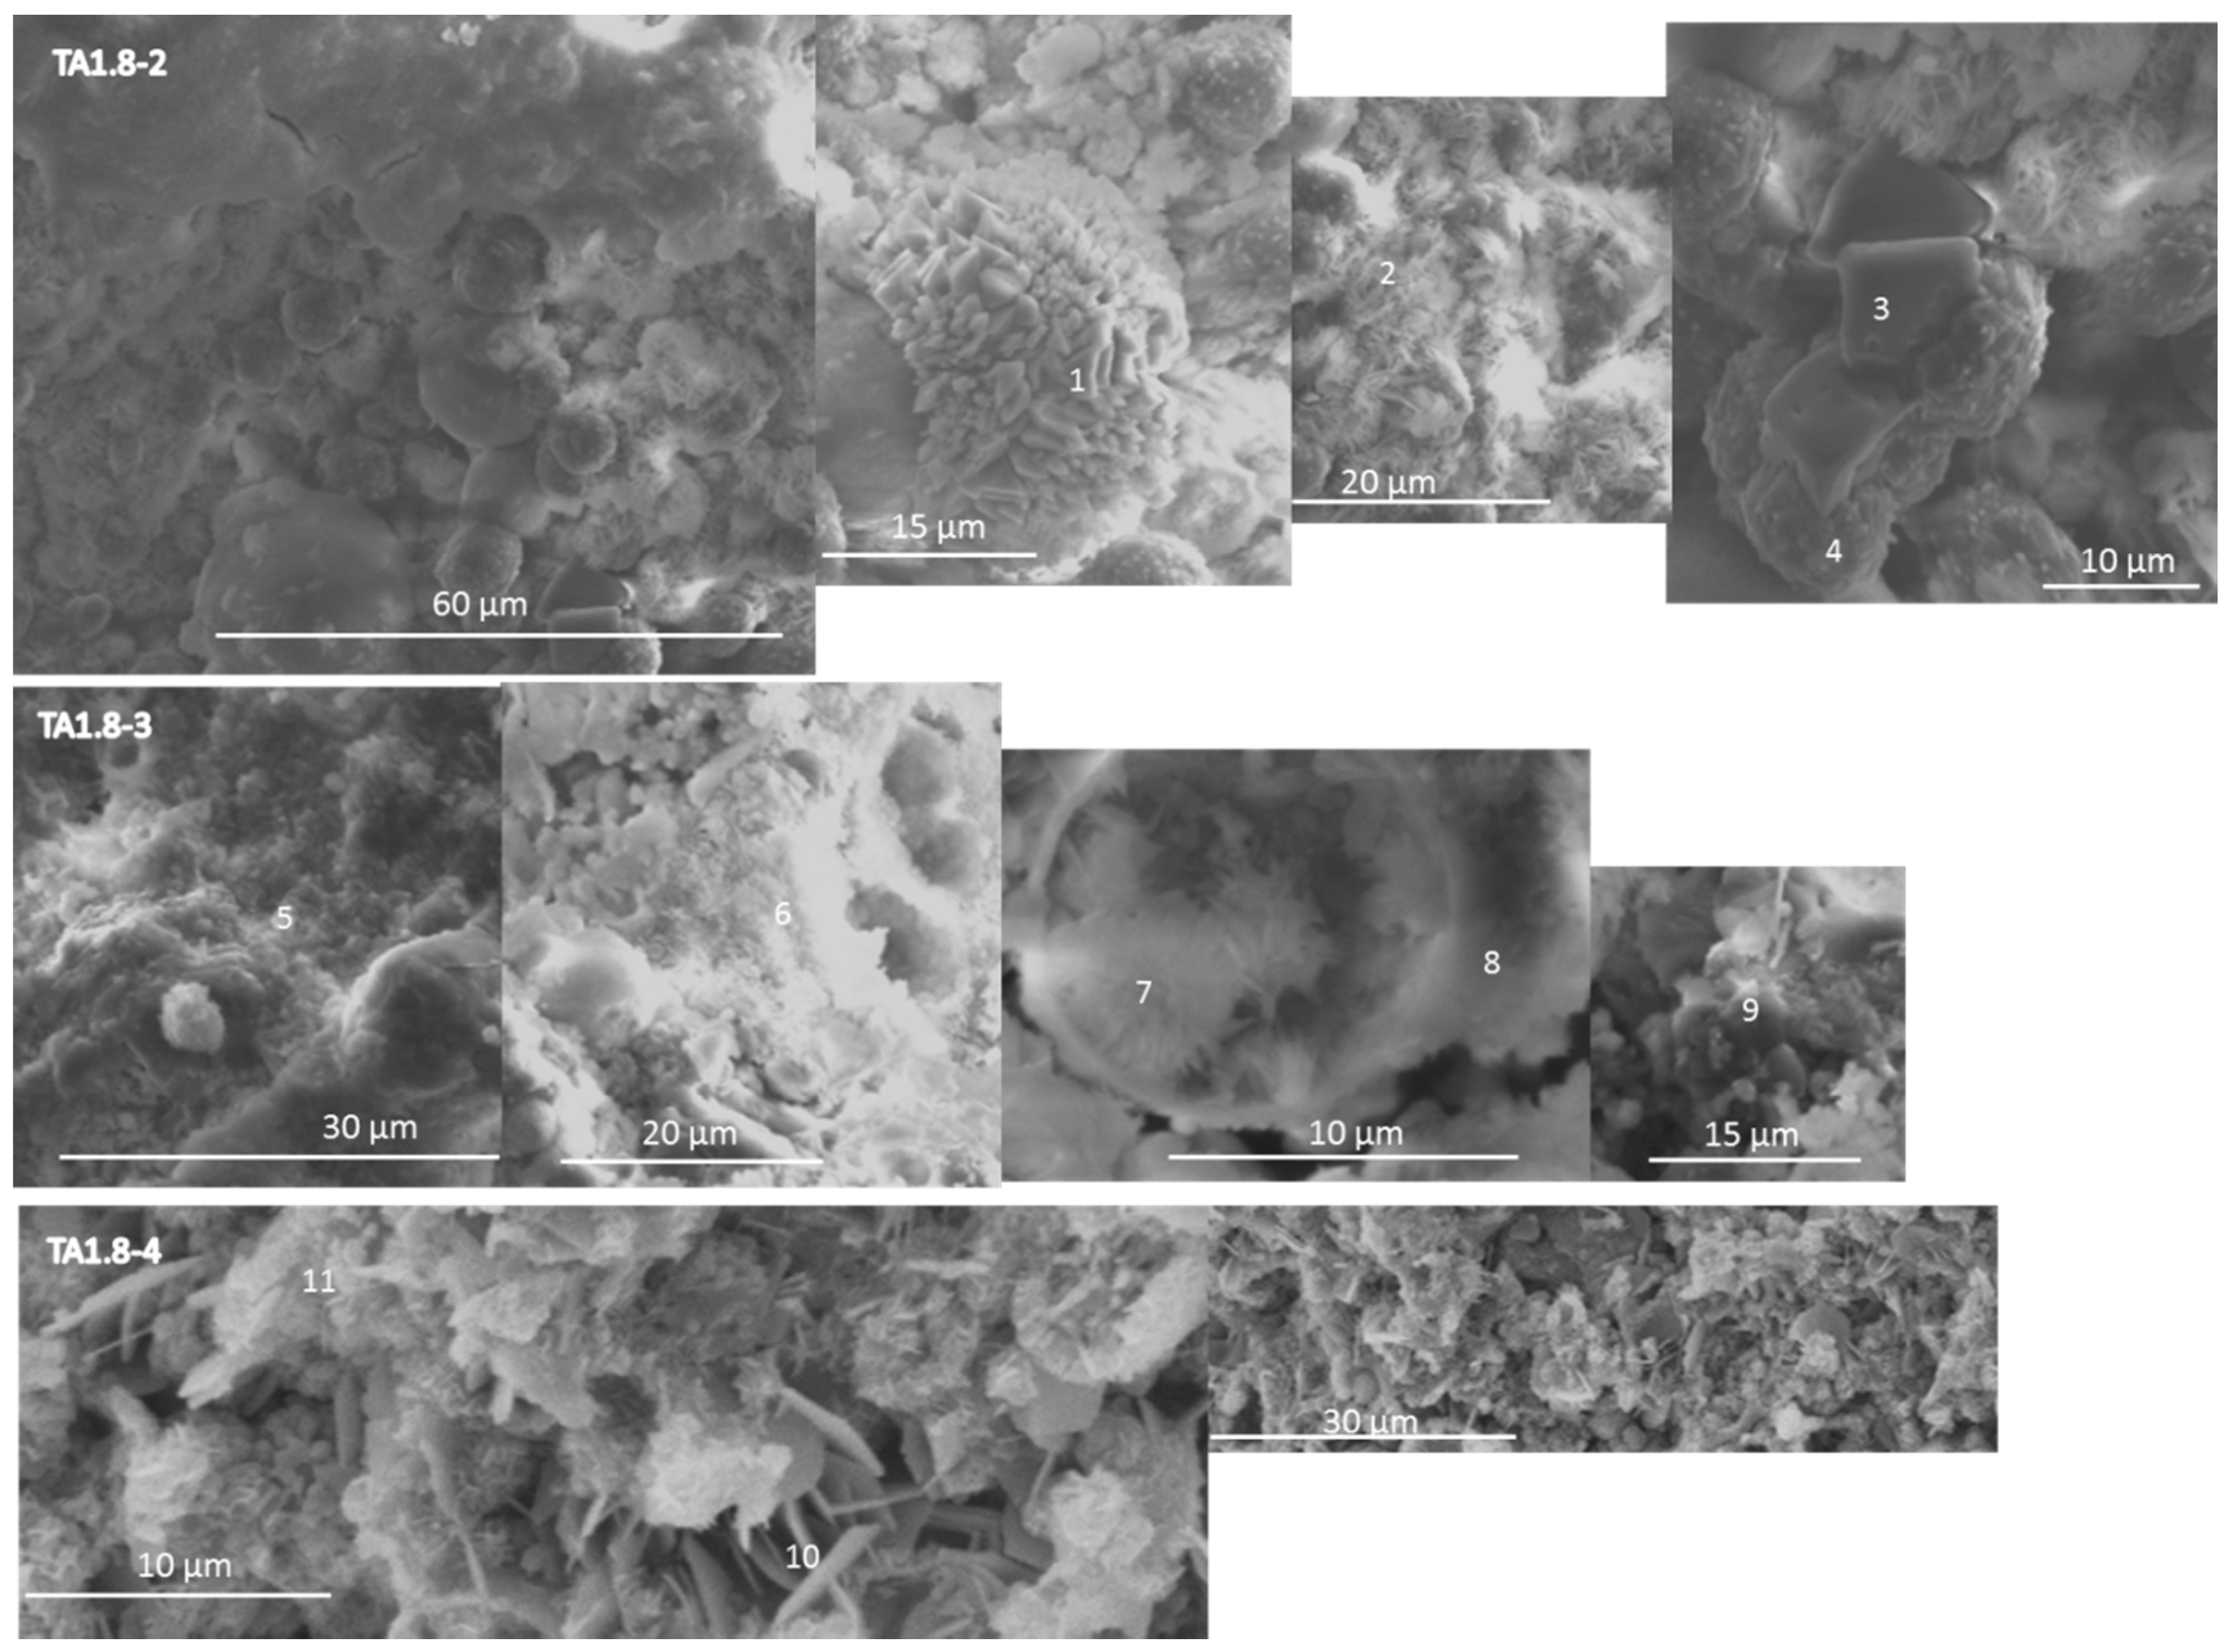
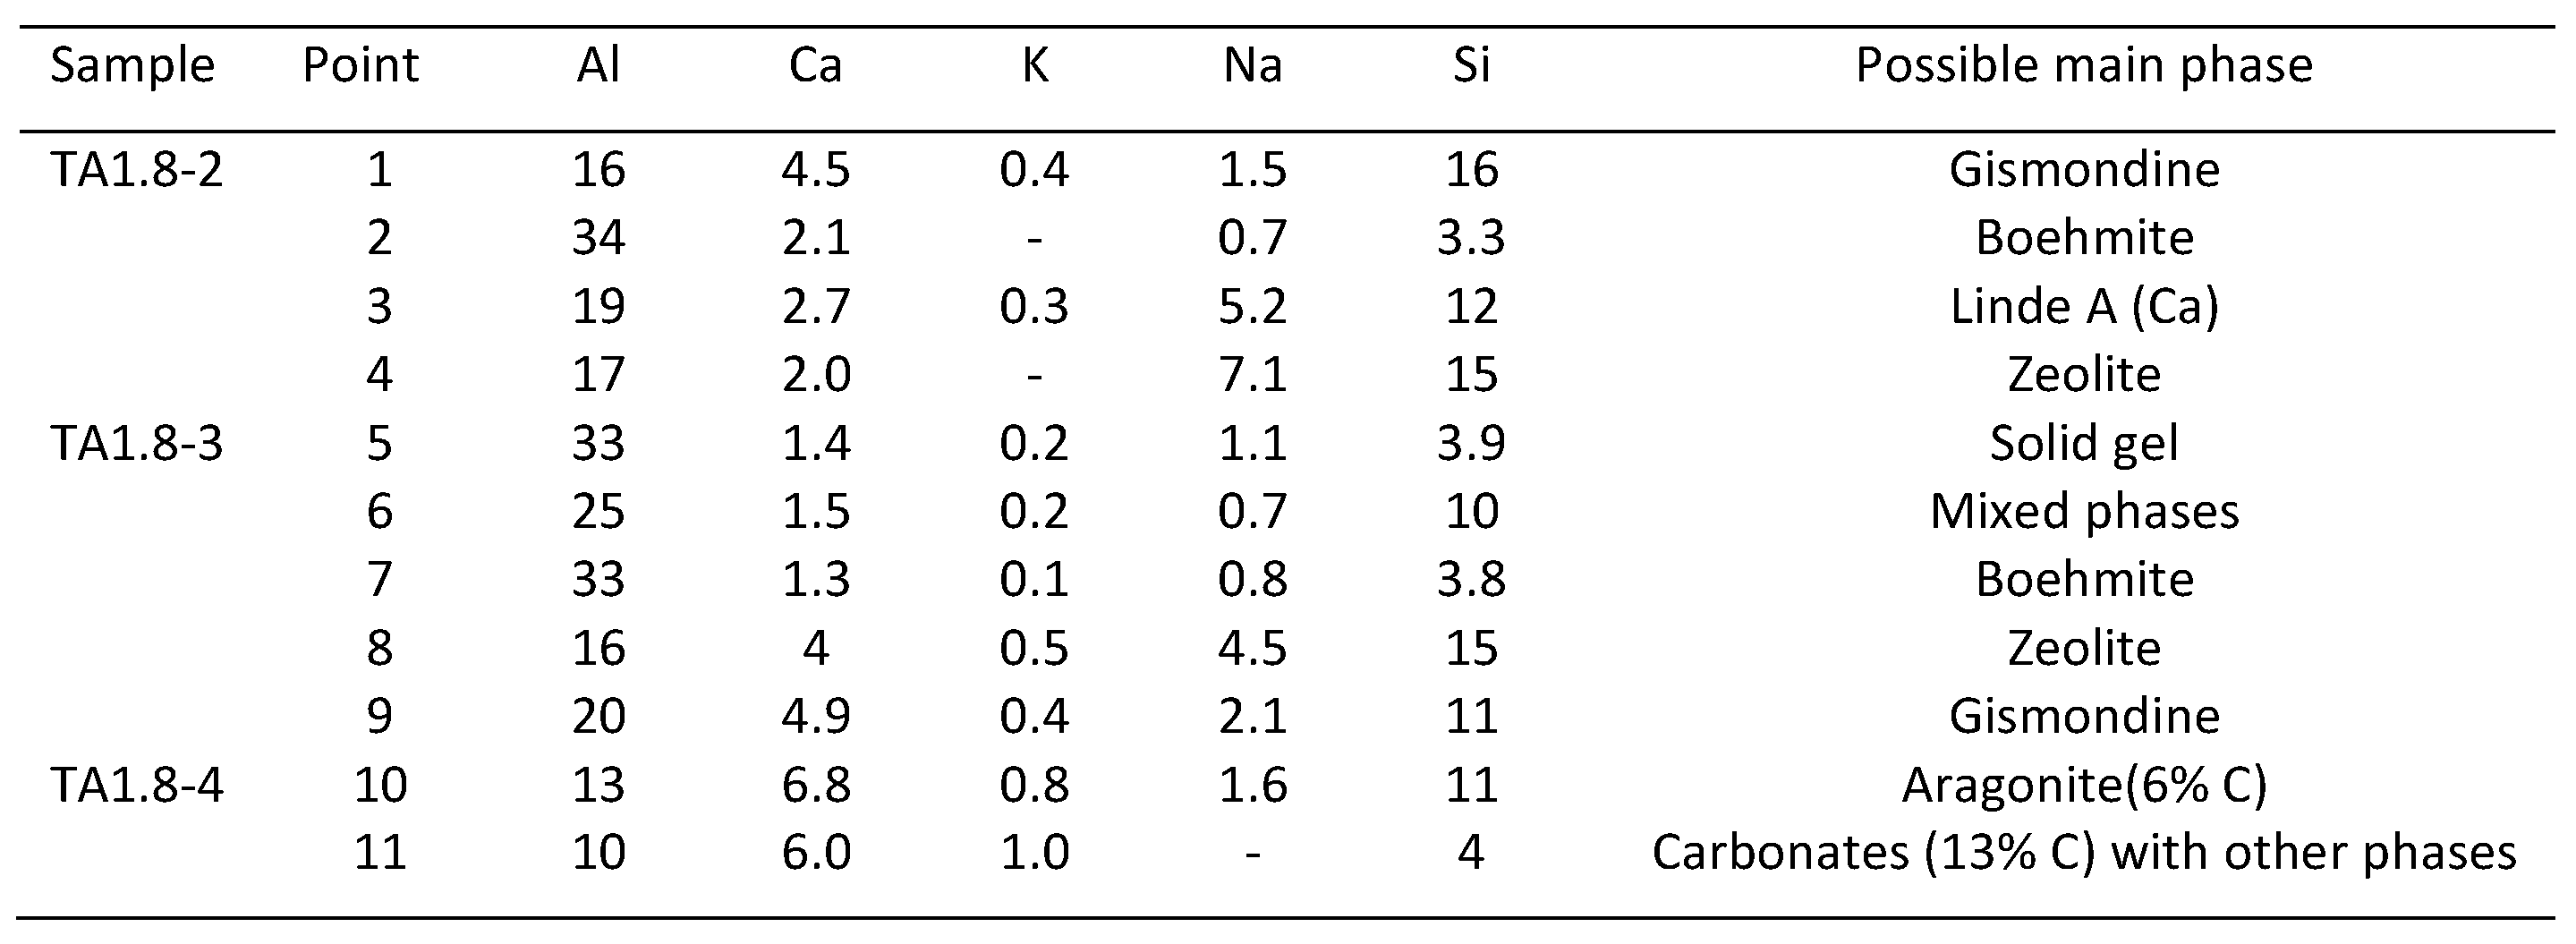
3.4. Microstructural Characterization
4. Discussion
5. Conclusions
- The crystal formation and growth are delayed in the presence of tartaric acid, so the major products of the cement hydration at short curing times at 200 and 300 °C and longer curing times at 85 °C are aluminum-rich calcium aluminosilicate hydrate (C,N–A–S–H) gel along with smaller amounts of boehmite and zeolites.
- In the control sepcimens the calcium-aluminosilicate hydrate gel is still the major product along with gibbsite at 85 °C or boehmite and zeolites as minor products at temperatures up to 200 °C; however, the cement matrix is much more crystallized, especially at 300 °C. Importantly, a number of phase transitions take place as the curing temperature rises. Boehmite, thomsonite, gismondine, and sodalite develop at 200 °C replacing gibbsite, zeolite A, and katoite that form at 85 °C. Analcime becomes the major crystalline phase for the curing temperature of 300 °C.
- Tartaric acid slows down the crystallization of hydration products and affects the composition of the crystalline phase. The retarder delays and/or inhibits crystallization of gibbsite, katoite, and thomsonite, while favoring formation of high-temperature-stable, low-calcium zeolite, sodalite, and hydroxyaluminum oxide, boehmite, limiting phase transitions with the temperature increase.
- Despite the increase in the total porosity the mechanical properties of the retarded cement are comparable to the control after 200 °C curing and improved after 300 °C. The porosity increase is goverened by the pores of less than 500 micron while the volume of the larger pores actually decreases when the retarder is used.
Acknowledgments
Author Contributions
Conflicts of Interest
Abbreviations
| TA | Tartaric Acid |
| CAC | Calcium Aluminate Cement |
| FAF | Flay Ash type F |
| SMS | Sodium Meta-Silicate |
References
- Nelson, E.; Barlet-Gouedard, V. Thermal cements. In Well Cementing, 2nd ed.; Nelson, E., Guillot, D., Eds.; Schlumberger: Sugar Land, TX, USA, 2006; pp. 328–334. [Google Scholar]
- Gill, S.; Pyatina, T.; Sugama, T. Thermal shock-resistant cement. Geotherm. Resour. Counc. Trans. 2012, 36, 445–451. [Google Scholar]
- Palomo, A.; Grutzeck, M.W.; Blanco, M.T. Alkali-activated fly ashes. A cement for the future. Cem. Concr. Res. 1999, 291, 323–1329. [Google Scholar]
- Bakharev, T. Geopolymeric materials prepared using Class F fly ash and elevated temperature curing. Cem. Concr. Res. 2005, 35, 1224–1232. [Google Scholar] [CrossRef]
- Fernandez-Jimenez, A.; Palomo, A.; Criado, M. Microstructure development of alkali-activated fly ash cement: A descriptive model. Cem. Concr. Res. 2005, 35, 1204–1209. [Google Scholar] [CrossRef]
- Criado, M.; Palomo, A.; Fernandez-Jimenez, A. Alkali activation of fly ashes. Part 1: Effect of curing conditions on the carbonation of the reaction products. Fuel 2005, 84, 2048–2054. [Google Scholar] [CrossRef]
- Garcia-Lodeiro, I.; Palomo, A.; Fernandez-Jimenez, A. Alkali-aggregate reaction in activated fly ash systems. Cem. Concr. Res. 2007, 37, 175–183. [Google Scholar] [CrossRef]
- Fernandez-Jimenez, A.; de la Torre, A.G.; Palomo, A.; Lopez-Olmo, G.; Alonso, M.M.; Aranda, M.A.G. Quantitative determination of phases in the alkali activation of fly ash. Part I. Potential ash reactivity. Fuel 2006, 85, 625–634. [Google Scholar] [CrossRef]
- Kumar, S.; Kumar, R.; Mehrotra, S.P. Influence of granulated blast furnace slag on the reaction structure and properties of fly ash based geopolymer. J. Mater. Sci. 2010, 45, 607–615. [Google Scholar] [CrossRef]
- Ryu, G.S.; Lee, Y.B.; Koh, K.T.; Chung, Y.S. The mechanical properties of fly ash-based geopolymer concrete with alkaline activators. Constr. Build. Mater. 2013, 47, 409–418. [Google Scholar] [CrossRef]
- Fernandez-Jimenez, A.; Pastor, J.Y.; Martın, A.; Palomo, A. High-temperature resistance in alkali-activated cement. J. Am. Ceram. Soc. 2010, 93, 3411–3417. [Google Scholar] [CrossRef]
- Donatello, S.; Palomo, A.; Fernandez-Jimenez, A. Durability of very high volume fly ash cement pastes and mortars. Cem. Concr. Compos. 2013, 38, 12–20. [Google Scholar] [CrossRef]
- Fernandez-Jimenez, A.; Palomo, A.; Sobrados, I.; Sanz, J. The role played by the reactive alumina content in the alkaline activation of fly ashes. Microporous Mesoporous Mater. 2006, 91, 111–119. [Google Scholar] [CrossRef]
- Fernandez-Jimenez, A.; Monzo, M.; Vicent, M.; Barba, A.; Palomo, A. Alkaline activation of metakaolin-fly ash mixtures: Obtain of zeoceramics and zeocements. Microporous Mesoporous Mater. 2008, 108, 41–49. [Google Scholar] [CrossRef]
- Palomo, A.; Alonso, S.; Fernandez-Jimenez, A. Alkaline activation of fly ashes: NMR study of the reaction products. J. Am. Ceram. Soc. 2004, 87, 1141–1145. [Google Scholar] [CrossRef]
- Querol, X.; Moreno, N.; Umana, J.C.; Alastuey, A.; Hernandez, E.; Lopez-Soler, A.; Plana, F. Synthesis of zeolites from coal fly ash: An overview. Int. J. Coal Geol. 2002, 50, 413–423. [Google Scholar] [CrossRef]
- Arbi, K.; Palomo, A.; Fernández-Jiménez, A. Alkali-activated blends of calcium aluminate cement and slag/diatomite. Ceram. Int. 2013, 39, 9237–9245. [Google Scholar] [CrossRef]
- Fernández-Jiménez, A.; Palomo, A.; Vazquez, T. Alkaline activation of blends of metakaolin and calcium aluminate. J. Am. Ceram. Soc. 2008, 91, 1231–1236. [Google Scholar] [CrossRef]
- Fernández-Jiménez, A.; Vazquez, T.; Palomo, A. Effect of sodium silicate on calcium aluminate cement hydration in highly alkaline media: A microstructural characterization. J. Am. Ceram. Soc. 2011, 94, 1297–1303. [Google Scholar] [CrossRef]
- Mostafa, N.Y.; Zaki, Z.I.; Abd Elkader, O.H. Chemical activation of calcium aluminate cement composites cured at elevated temperature. Cem. Concr. Compos. 2012, 34, 1187–1193. [Google Scholar] [CrossRef]
- Sanchez-Herrero, M.; Fernandez-Jimenez, A.; Palomo, A. Alkaline hydration of tricalcium aluminate. J. Am. Ceram. Soc. 2012, 95, 3317–3324. [Google Scholar] [CrossRef]
- Fernandez-Jimenez, A.; Palomo, A. Composition and microstructure of alkali activated fly ash binder: Effect of the activator. Cem. Concr. Res. 2005, 35, 1984–1992. [Google Scholar] [CrossRef]
- Pyatina, T.; Sugama, T. Set controlling additive for thermal-shock-resistant cement. GRC TX 2014, 38, 251–257. [Google Scholar]
- Bentsen, S.; Seltveit, A.; Sanderg, B. Effect of microsilica on conversion of high alumina cement. In Calcium Aluminate Cements; Mangabhai, R.J., Ed.; Spon Press: London, UK, 1990; pp. 294–319. [Google Scholar]
- Ding, J.; Fu, Y.; Beaudoin, J.J. Study of hydration mechanism in the high alumina cement-sodium silicate system. Cem. Concr. Res. 1996, 26, 799–804. [Google Scholar] [CrossRef]
- Bensted, J.; Barnes, P. Structure and Performance of Cements; CRC Press: London, UK, 2002; pp. 114–118. [Google Scholar]
- Goberis, S.; Antonovich, V. Influence of sodium silicate amount on the setting time and EXO temperature of a complex binder consisting of high-aluminate cement, liquid glass and metallurgical slag. Cem. Concr. Res. 2004, 34, 1939–1941. [Google Scholar] [CrossRef]
- Winnefeld, F.; Leemann, A.; Lucuk, M.; Svoboda, P.; Neuroth, M. Assessment of phase formation in alkali activated low and high calcium fly ashes in building materials. Constr. Build. Mater. 2010, 24, 1086–1093. [Google Scholar] [CrossRef]
- Young, J. Effect of organic compounds on the interconversions of calcium aluminate hydrates. Hydration of monocalcium aluminate. Cem. Concr. Res. 1971, 1, 113–122. [Google Scholar] [CrossRef]
- Rodger, S.; Double, D. The chemistry of hydration of high alumina cement in the presence of accelerating and retarding admixtures. Cem. Concr. Res. 1984, 14, 73–82. [Google Scholar] [CrossRef]
- Sugama, T.; Carciello, N.R.; Gray, G. Alkali carbonation of calcium aluminate cements: Influence of set-retarding admixtures under hydrothermal conditions. J. Mater. Sci. 1992, 27, 4900–4916. [Google Scholar] [CrossRef]
- Oliveira, I.R.; Ortega, F.S.; Pandolfelli, V.C. Hydration of CAC cement in castable refectory matrix containing processing additives. Ceram. Int. 2009, 35, 1545–1552. [Google Scholar] [CrossRef]
- Emoto, T.; Bier, T.A. Rheological behavior as influenced by plasticizers and hydration kinetics. Cem. Concr. Res. 2007, 37, 647–654. [Google Scholar] [CrossRef]
- Pyatina, T.; Sugama, T.; Gill, S. Retarders effect on some properties of class G cement cured at 80 °C. Adv. Cem. Res. 2014, 26, 205–212. [Google Scholar] [CrossRef]
- Silva, D.A.; Monteiro, P.J.M. The influence of polymer on hydration of Portland cement phases analyzed by soft X-ray transmission microscopy. Cem. Concr. Res. 2006, 36, 1501–1507. [Google Scholar] [CrossRef]
- Knapen, E.; Van Gemert, D. Cement hydration and microstructure formation in the presence of water-soluble polymers. Cem. Concr. Res. 2009, 39, 6–13. [Google Scholar] [CrossRef]
- Brough, A.R.; Katz, A.; Sun, G.K.; Strublea, L.J.; Kirkpatrick, R.J.; Young, J.F. Adiabatically cured, alkali-activated cement-based wasteforms containing high levels of fly ash—Formation of zeolites and Al-substituted C–S–H. Cem. Concr. Res. 2001, 31, 1437–1447. [Google Scholar] [CrossRef]
- Lin, F.; Meyer, C. Hydration kinetics modeling of Portland cement considering the effects of curing temperature and applied pressure. Cem. Concr. Res. 2009, 39, 255–265. [Google Scholar] [CrossRef]
- Wang, X.Y.; Lee, H.S. Modeling of hydration kinectics in cement based materials considering the effects of curing temperature and pressure. Constr. Build. Mater. 2012, 28, 1–13. [Google Scholar] [CrossRef]
- Pang, X.; Jimenez, W.C.; Iverson, B.J. Hydration kinetics modeling of the effect of curing temperature and pressure on the heat evalution of oil well cement. Cem. Concr. Res. 2013, 54, 69–76. [Google Scholar] [CrossRef]
- Moon, J.; Kalb, P.; Milian, L.; Northrup, P. Characterization of a sustainable sulfur polymer concrete using activated fillers. Cem. Concr. Comp. 2016, 67, 20–29. [Google Scholar] [CrossRef]
- Kang, S.; Wang, Z.; Hong, S.; Moon, J. Micro-computed tomography study on the pore structure of ultra-high performance concrete containing water-entraining admixture. In Proceedings of the HiPerMat 2016 4th International Symposium on UHPC and high Performance Construction Materials, Kassel, Germany, 9–11 March 2016.
- Hidalgo, A.; Garcia, J.L.; Alonso, M.C.; Fernandez, L.; Andrade, C. Microstructure development in mixes of calcium aluminate cement with silica fume or fly ash. J. Therm. Anal. Calorim. 2009, 96, 335–345. [Google Scholar] [CrossRef]
- Foldvari, M. Handbook of Thermogravimetric System of Minerals and Its Use in Geological Practice; Occasional papers of the Geological Institute of Hungary: Budapest, Hungary, 2011; p. 213. [Google Scholar]
- Andini, S.; Cioffi, R.; Colangelo, F.; Grieco, T.; Montagnaro, F.; Santoro, L. Coal fly ash as raw material for the manufacture of geopolymer-based products. Waste Manag. 2008, 28, 416–423. [Google Scholar] [CrossRef] [PubMed]
- Garcia-Lodeiro, I.; Palomo, A.; Fernandez-Jimenez, A.; Macphee, D.E. Compatibility studies between N–A–S–H and C–A–S–H gels. Study in the ternary diagram Na2O–CaO–Al2O3–SiO2–H2O. Cem. Concr. Res. 2011, 41, 923–931. [Google Scholar] [CrossRef]
- Omisanya, N.O.; Folayan, C.O.; Aku, S.Y.; Adefila, S.S. Synthesis and characterization of zeolite a for adsorption refrigeration application. Adv. Appl. Sci. Res. 2012, 3, 3746–3754. [Google Scholar]
- Khajavi, S.; Sartipi, S.; Gascon, J.; Jansen, J.C.; Kapteijn, F. Thermostability of hydroxy sodalite in view of membrane applications. Microporous Mesoporous Mater. 2010, 132, 510–517. [Google Scholar] [CrossRef]
- Gosselin, C.; Scrivener, K.L. Microstructure development of calcium aluminate cements accelerated by lithium sulfate. In Proceedings of the Calcium Aluminate Cements, the Centenary Conference, 30 June–2 July 2008; Fentiman, C.H., Mangabhai, R.J., Scrivener, K.L., Eds.; IHS BRE Press: Garston, Watford, UK, 2008; pp. 109–122. [Google Scholar]
- Zeng, W.; Zhou, H.; Chen, Q.; Chen, X. Kinetics of thermal decomposition of synthetic gibbsite. T. NFsoc. 1993, 3, 41–44. [Google Scholar]
- Klimesch, D.S.; Ray, A. DTA-TGA of unstirred autoclaved metakaolin-lime-quartz slurries. Formation of hydrogarnet. Thermochim. Acta 1998, 316, 149–154. [Google Scholar] [CrossRef]
- Klimesch, D.S.; Ray, A. DTA-TGA evaluations of the CaO–Al2O3–SiO2–H2O system treated hydrothermally. Thermochim. Acta 1999, 334, 115–122. [Google Scholar] [CrossRef]
- Tettenhorst, R.; Hofmann, D.A. Crystal chemistry of boehmite. Clays Clay Miner. 1980, 28, 373–380. [Google Scholar] [CrossRef]
- Harada, K.; Tanaka, K.; Nagashima, K. New data on the analcime-wairakite series. Am. Mineral. 1972, 57, 924–931. [Google Scholar]
- Mirzaee, M.; Amini, M.M.; Sedeghi, M.; Mousavi, F.Y.; Sharbatdar, M. Preparation and characterization of boehmite, CuO, TiO2 and NbO5 by hydrothermal assisted sol-gel processing of metal alkoxides. Ceram. Silik. 2005, 49, 40–47. [Google Scholar]
- Mumpton, F.M.; Ormsby, W.C. Morphology of zeolites in sedimentary rocks by scanning electron microscopy. Clays Clay Miner. 1976, 24, 128–136. [Google Scholar] [CrossRef]
- Novotna, M.; Satava, V.; Maixner, J.; Klouzkova, A.; Kostka, P.; Lezal, D. Preparation and characterization of analcime powders. J. Optoelectron. Adv. Mater. 2003, 5, 1405–1409. [Google Scholar]
- Triana, J.M.; Herrera, J.F.; Rios, C.A.; Castellanos, O.M.; Henao, J.A.; Williams, C.D.; Roberts, C.L. Natural zeolites filling amygdales and veins in basalts from the British Tertiary Igneous Province on the Isle of Skye. Scotland Earth Sci. Res. J. 2012, 16, 41–53. [Google Scholar]
- Bermejo, E.; Carballo, R.; Castineiras, A.; Lago, A.B. Coordination of α-hydroxycarboxylic acids with first-row transition ions. Coord. Chem. Rev. 2013, 257, 2639–2651. [Google Scholar] [CrossRef]


| Component | Calcium Aluminate Cement | Flay Ash Class F | Sodium Metasilicate |
|---|---|---|---|
| Al2O3 | 73.8 | 34.8 | - |
| CaO | 26.1 | 2.7 | - |
| SiO2 | - | 50.4 | 46.6 |
| Fe2O3 | 0.1 | 7.1 | - |
| Na2O | - | 0.3 | 50.5 |
| K2O | - | 3.1 | - |
| TiO2 | - | 1.6 | - |
| Specimen | Curing Conditions | |||
|---|---|---|---|---|
| 22 Days 85 °C Atm. Pressure | 3 Days 85 °C, 1 Day 200 °C 6.89 MPa | 3 Days 85 °C, 7 Days 200 °C 6.89 MPa | 3 Days 85 °C, 1 Day 300 °C 8.27 MPa | |
| TSRC without retarder (control) | C-1 | C-2 | C-3 | C-4 |
| TSRC with 1% 1 TA | TA1-1 | TA1-2 | TA1-3 | TA1-4 |
| TSRC with 1.8% 1 TA | - | TA1.8-2 | TA1.8-3 | TA1.8-4 |
| Specimen | Compressive Strength (MPa) | Toughness (N-mm/mm3) | Porosity (%) |
|---|---|---|---|
| 3 days 85 °C, 1 day 200 °C | |||
| C-2 | 9.9 ± 0.8 | 0.08 ± 0.04 | 5.1 |
| TA1-2 | 11.5 ± 2.3 | 0.09 ± 0.03 | n.d. 1 |
| TA1.8-2 | 10.4 ± 0.7 | 0.12 ± 0.05 | 6.1 |
| 3 days 85 °C, 1 day 300 °C | |||
| C-4 | 4.6 ± 0.3 | 0.08 ± 0.04 | 5.4 |
| TA1-4 | 7.5 ± 1.2 | 0.31 ± 0.19 | 6.1 |
| TA1.8-4 | 9.4 ± 1.7 | 0.35 ± 0.25 | n.d. |
© 2016 by the authors; licensee MDPI, Basel, Switzerland. This article is an open access article distributed under the terms and conditions of the Creative Commons Attribution (CC-BY) license (http://creativecommons.org/licenses/by/4.0/).
Share and Cite
Pyatina, T.; Sugama, T.; Moon, J.; James, S. Effect of Tartaric Acid on Hydration of a Sodium-Metasilicate-Activated Blend of Calcium Aluminate Cement and Fly Ash F. Materials 2016, 9, 422. https://doi.org/10.3390/ma9060422
Pyatina T, Sugama T, Moon J, James S. Effect of Tartaric Acid on Hydration of a Sodium-Metasilicate-Activated Blend of Calcium Aluminate Cement and Fly Ash F. Materials. 2016; 9(6):422. https://doi.org/10.3390/ma9060422
Chicago/Turabian StylePyatina, Tatiana, Toshifumi Sugama, Juhyuk Moon, and Simon James. 2016. "Effect of Tartaric Acid on Hydration of a Sodium-Metasilicate-Activated Blend of Calcium Aluminate Cement and Fly Ash F" Materials 9, no. 6: 422. https://doi.org/10.3390/ma9060422