
Use of Natural-Fiber Bio-Composites in Construction versus Traditional Solutions: Operational and Embodied Energy Assessment


Abstract
:1. Introduction
2. Case Study
2.1. Building Description
2.2. Materials Used
2.2.1. Fired Clay Brick Walls (BW)
2.2.2. Concrete Block Walls (CW)
2.2.3. Stabilized Soil Block Walls (SW)
3. Life-Cycle Assessment Goal and Scope
- Manufacturing of the building products phase. For each building material involved in the building every good and service from cradle to grave are considered. The manufacturing of employed machinery and territorial infrastructure processes has been considered.
- Assembly and construction phase. This covers every process aimed at integrating all products and services in the site in each studied dwelling. The transportation of building materials from the factory to the site, the placement of building products has been considered
- Maintenance and repair phase. This includes all repair operations and maintenance of building components. The renewal of those materials which have a lower durability has been considered.
- Dismantling and demolition phase. Every process carried out at the end of the life of the building to remove and demolish the dwelling has been taken into consideration: demolition, removal of building elements, and transportation of demolition materials to recycling or disposal have been included.
- Disposal and recycling phase. This covers all processes suffered by demolition materials after dismantling i.e., the deconstruction of building materials.
- (1)
- Identification and quantification of the initial building products and auxiliary materials—including replacement materials that take part in the life cycle.
- (2)
- Identification and quantification of the basic processes associated with the construction and deconstruction. The determination of the energy consumed during the construction and demolition is obtained as a factor of the total building material volume, following the procedure as described by Kellenberger et al. [44]. The following procedure has been taken:
- (a)
- Basic materials have been grouped into unit processes (Table 3). Construction systems, structural elements, walls and roofs, windows, doors, and finishing materials (from floors, ceiling, and walls) has been considered. The dimensioning of these elements is according to the obtained structural and thermal values (Table 1).
- (b)
- Division into groups and listing product specifications. Each case study has been divided into building elements according to the Building Cost Data Base of Andalusia (BCCA). The materials, the building machinery, and the labor has been related to each building element.
- (c)
- The building elements have been quantified using the construction management software Presto V.8 by RIB Software AG, Stuttgart (Germany).
- (d)
- The basic materials used in each case study has been obtained from the results given by Presto.
- (e)
- Once quantify each basic material and considering its physics properties, its mass and volume has been obtained.
- (3)
- Determination of input and output of each unit process. The ECOINVENT database and published LCA studies have been used to obtain environmental information of unit processes (see Table 3). Final disposal processes for the plastics, metals, bitumen-based and wood materials have been considered. Other materials have been considered inert from the point of view of their final disposal. The quantification of the final disposal processes has been obtained from the quantities the initial basic products (Table 4).
- (4)
- Inventory and assessment. The impact assessment is carried out using the CML 2001 method in relation to the GWP impact category. The “cumulative energy demand” in relation to the embodied primary energy (Table 3).
- (5)
- Operational energy data are considered according to the benchmarks included in the Spanish ministry report SPAHOUSE [45] for houses located in Spain, considering two of the climates mentioned, location 1, corresponding to the warm Mediterranean climate and location 2, corresponding to the inner continental areas of the peninsula. Including insulation, all building envelope U values are considered equal for all three materials and subsequently, the operational energy will be considered to be the same for all three cases. Insulation is placed inside the building envelope so as to minimize the differences of thermal inertia among them.
4. Results
5. Discussion
6. Conclusions
Acknowledgments
Author Contributions
Conflicts of Interest
Abbreviations
| LCA | Life Cycle Assessment |
| OE | Operational energy |
| EE | Embodied Energy |
| BW | Fired clay brick masonry walls |
| CW | Concrete block masonry walls |
| SW | Stabilized soil block masonry walls (SW) |
| GWP | Global Warming Potential |
| PH1 | Manufacturing phase |
| PH2 | Construction & Demolition phase |
| PH3 | Transport phase |
| PH4 | Final Disposal |
| PH5 | Operational energy. 5 years lifespan |
References
- Adoption of the Paris Agreement—Proposal by the President—Draft Decision -/CP.21 2015. Available online: http://unfccc.int/resource/docs/2015/cop21/eng/l09r01.pdf (accessed on 19 April 2016).
- Cabeza, L.F.; Rincón, L.; Vilariño, V.G.; Pérez, G.; Castell, A. Life cycle assessment (LCA) and life cycle energy analysis (LCEA) of buildings and the building sector: A review. Renew. Sustain. Energy Rev. 2014, 29, 394–416. [Google Scholar] [CrossRef]
- Uihlein, A.; Eder, P. Towards Additional Policies to Improve the Environmental Performance of Buildings; EUR 23775 EN—2009; JRC Scientific and Technical Report: Seville, Spain, 2009. [Google Scholar]
- Venkatarama Reddy, B.V.; Jagadish, K.S. Embodied energy of common and alternative building materials and technologies. Energy Build. 2003, 35, 129–137. [Google Scholar] [CrossRef]
- Vázquez, M. Building and Impact on the environment: The case of the earth and other materials (Construcción e impacto sobre el ambiente: El caso de la tierra y otros materlales). Inf. Constr. 2001, 52, 29–43. [Google Scholar]
- Janssen, G.M.T.; Hendriks, C.F. Sustainable use of recycled materials in building construction. Adv. Build. Technol. 2002, II, 1399–1406. [Google Scholar]
- Walker, P. Strength, durability and shrinkage characteristics of cement stabilised soil blocks. Cem. Concr. Compos. 1995, 17, 301–310. [Google Scholar] [CrossRef]
- Fitzmaurice, R. Manual on Stabilised Soil Construction for Housing; United Nations: New York, NY, USA, 1958. [Google Scholar]
- Walker, P.; Venkatarama Reddy, B.V.; Mesbah, A.; Morel, J.C. The case for compressed Earth block construction. In Proceedings of the 6th International Seminar on Structural Masonry for Developing Countries, Bangalore, India, 11–13 October 2000; Allied Publishers Ltd.: New Delhi, India, 2000; pp. 27–35. [Google Scholar]
- Shukla, A.; Tiwari, G.N.; Sodha, M.S. Embodied energy analysis of adobe house. Renew. Energy 2009, 34, 755–761. [Google Scholar] [CrossRef]
- Muneer Asif, M.; Kelley, R. Life cycle assessment: A case study of a dwelling home in Scotland. Build. Environ. 2007, 42, 1391–1394. [Google Scholar] [CrossRef]
- Huberman, N.; Pearlmutter, D. A life-cycle energy analysis of building materials in the Negev desert. Energy Build. 2008, 40, 837–848. [Google Scholar] [CrossRef]
- Thormark, C. A low energy building in a life cycle e its embodied energy, energy need for operation and recycling potential. Build. Environ. 2002, 37, 429–435. [Google Scholar] [CrossRef]
- Blengini, G.A. Life cycle of buildings, demolition and recycling potential: A case study in Turin, Italy. Build. Environ. 2009, 44, 319–330. [Google Scholar] [CrossRef]
- Chen, T.Y.; Burnett, J.; Chau, C.K. Analysis of embodied energy use in the residential building of Hong Kong. Energy 2001, 26, 323–340. [Google Scholar] [CrossRef]
- Yildiz, A.; Güngör, A. Energy and exergy analyses of space heating in buildings. Appl. Energy 2009, 86, 1939–1948. [Google Scholar] [CrossRef]
- Arena, A.P.; Rosa, C. Life cycle assessment of energy and environmental implications of the implementation of conservation technologies in school buildings in Mendoza–Argentina. Build. Environ. 2003, 38, 359–368. [Google Scholar] [CrossRef]
- De Miranda, F. Inventario de ciclo de Vida da Geracao Hidrelectrica no Brasil—Usina de Itaipu: Primeira Aproximacao 2003. Universidade de Sao Paulo. Available online: http://www.maternatura.org.br/hidreletricas/biblioteca_docs/ICV%20Itaipu.pdf (accessed on 7 August 2012).
- Sartori, I.H. Energy use in the life cycle of conventional and low-energy buildings: A review article. Energy Build. 2007, 39, 249–257. [Google Scholar] [CrossRef]
- Ortiz, O.; Castells, F.; Sonnermann, G. Sustainability based on LCM of residential dwellings: A case study in Catalonia, Spain. Build. Environ. 2009, 44, 584–594. [Google Scholar] [CrossRef]
- Ortiz, O.; Castells, F.; Sonnermann, G. Sustainability Operational energy in the life cycle of residential dwellings: The experience of Spain and Colombia. Appl. Energy 2010, 87, 673–680. [Google Scholar] [CrossRef]
- Chung, W.S.; Tohno, S.; Shim, S.Y. An estimation of energy and GHG emission intensity caused by energy consumption in Korea: An energy IO approach. Appl. Energy 2009, 86, 1902–1914. [Google Scholar] [CrossRef]
- Thormark, C. The effect of material choice on the total energy need and recycling potential of a building. Build. Environ. 2006, 41, 1019–1026. [Google Scholar] [CrossRef]
- Stephan, A.; Stephan, L. Life cycle energy and cost analysis of embodied, operational and user-transport energy reduction measures for residential buildings. Appl. Energy 2016, 161, 445–464. [Google Scholar] [CrossRef]
- Koesling, M.; Ruge, G.; Fystro, G.; Torp, T.; Hansen, S. Embodied and operational energy in buildings on 20 Norwegian dairyfarms—Introducing the building construction approach to agriculture. Energy Build. 2015, 108, 330–345. [Google Scholar] [CrossRef]
- Guan, L.; Walmsely, M.; Chen, G. Life Cycle Energy Analysis of Eight Residential Houses in Brisbane, Australia. Procedia Eng. 2015, 121, 653–661. [Google Scholar] [CrossRef]
- Brown, N.; Olsson, S.; Malmqvist, T. Embodied greenhouse gas emissions from refurbishment of residential building stock to achieve a 50% operational energy reduction. Build. Environ. 2014, 79, 46–56. [Google Scholar] [CrossRef]
- Zhu, J.; Chew, D.; Lv, S.; Wu, W. Optimization method for building envelope design to minimize carbon emissions of building operational energy consumption using orthogonal experimental design (OED). Habitat Int. 2013, 37, 148–154. [Google Scholar] [CrossRef]
- Pinky Devi, L.; Sivakumar, P. A case study on life cycle energy use of residential buildingin Southern India. Energy Build. 2014, 80, 247–259. [Google Scholar]
- Praseeda, K.I.; Reddy, B.V.V.; Mani, M. Embodied and operational energy of urban residential buildings in India. Energy Build. 2016, 110, 211–219. [Google Scholar] [CrossRef]
- Stephan, A.; Crawford, R.H.; Myttenaere, K. Towards a comprehensive life cycle energy analysis framework for residential buildings. Energy Build. 2012, 55, 592–600. [Google Scholar] [CrossRef]
- Jollands, M.; Setunge, S.; Iftekhar, A.; Haque, N.; Islama, H. Life cycle assessment and life cycle cost implications of wall assemblages designs. Energy Build. 2014, 84, 33–45. [Google Scholar]
- Iddon, C.R.; Firth, S.K. Embodied and operational energy for new-build housing: A case study of construction methods in the UK. Energy Build. 2013, 67, 479–488. [Google Scholar] [CrossRef]
- Ibn-Mohammed, T.; Greenough, R.; Taylor, S.; Ozawa-Meida, L.; Acquaye, A. Operational vs. embodied emissions in buildings—A review of current trends. Energy Build. 2013, 66, 232–245. [Google Scholar] [CrossRef]
- ISO 14040. Environmental Management—Life Cycle Assessment—Principles and Framework, CEN; ISO: Brussels, Belgium, 2006. [Google Scholar]
- ISO 14044. Environmental Management—Life Cycle Assessment—Requirements and Guidelines, CEN; ISO: Brussels, Belgium, 2006. [Google Scholar]
- CIPECAD. CYPE Ingenieros S.A.; CIPECAD: Madrid, Spain, 2015. [Google Scholar]
- CTE_DB-HE. Código Técnico de la Edificación. Documento Básico de Ahorro de Energía. Available online: http://161.111.13.202/apache2-default/cte/CTE_DB-HE.pdf (accessed on 19 April 2016).
- Galán-Marín, C.; Rivera-Gómez, C.; Petric-Gray, J. Effect of animal fibres reinforcement on stabilized earth mechanical properties. J. Biobased Mater. Bioenergy 2010, 4, 121–128. [Google Scholar] [CrossRef]
- Barber, A.; Pellow, G. Life Cycle Assessment: New Zealand Merino Industry, Merino Wool Total Energy Use and Carbon Dioxide Emissions; The Agribusiness Group: Canterbury, New Zealand, 2006. [Google Scholar]
- Resurreccion, E.P.; Colosi, L.M.; White, M.A.; Clarens, A.F. Comparison of algae cultivation methods for bioenergy production using a combined life cycle assessment and life cycle costing approach. Bioresource Technol. 2012, 126, 298–306. [Google Scholar] [CrossRef] [PubMed]
- ECOINVENT Database; The Ecoinvent Center, A Competence Centre of ETH; PSI; Empa & ART: Switzerland; Available online: http://www.ecoinvent.org (accessed on 19 April 2016).
- Garcia-Martinez, A. Life Cycle Assessment (LCA) of Buildings. Methodological Proposal for the Development of Environmental Declarations of Dwellings in Andalusia. Doctoral Dissertation, Universidad de Sevilla, Sevilla, Spain, 2010. Available online: http://fondosdigitales.us.es/media/thesis/1546/Q_Tesis_AGM.pdf (accessed on 19 April 2016). [Google Scholar]
- Kellenberger, D.; Althaus, H.-J.; Jungbluth, N.; Künniger, T.; Lehmann, M.; Thalmann, P. Life Cycle Inventories of Building Products. Data v1.1. Ecoinvent Report No 7; Swiss Centre for Life Cycle Inventories: Dübendorf, Switzerland, 2004. [Google Scholar]
- SPAHOUSEC PROJECT Análisis del Consumo Energético del Sector Residencial en España INFORME FINAL; IDAE Secretaría General Departamento de Planificación y Estudios: Madrid, Spain, 2011; pp. 1–76. Available online: http://www.idae.es/uploads/documentos/documentos_informe_spahousec_acc_f68291a3.pdf (accessed on 19 April 2016).


| External Wall Type | Building Level | Wall Thickness (m) | Insulation Thickness (m) PUR | |
|---|---|---|---|---|
| LOCATION I | LOCATION II | |||
| Ceramic Brick (BW) | Level 3 | 0.250 | 0.02 | 0.04 |
| Level 2 | 0.250 | 0.02 | 0.04 | |
| Level 1 | 0.375 | 0.01 | 0.03 | |
| Concrete Block (CW) | Level 3 | 0.200 | 0.02 | 0.04 |
| Level 2 | 0.200 | 0.02 | 0.04 | |
| Level 1 | 0.400 | 0.02 | 0.04 | |
| Stabilized Soil (SW) | Level 3 | 0.300 | 0.02 | 0.04 |
| Level 2 | 0.350 | 0.02 | 0.03 | |
| Level 1 | 0.450 | 0.01 | 0.03 | |
| Impact Category | On Farm | Processing | Transport | Total |
|---|---|---|---|---|
| Total energy (MJ/t wool top) | 22,550 | 21,700 | 1490 | 45,730 |
| GWP (T CO2-eq/t wool top) | 1655 | 471 | 103 | 2229 |
| Component | ID | Name (ECOINVENT) | Unit | Global Warming Potential 100a CML 2001 kg CO2-eq | Embodied Energy Cumulative Energy Demand MJ |
|---|---|---|---|---|---|
| Gravel | 464 | gravel, round, at mine | kg | 0,0024 | 0,0576 |
| Limestone | 466 | limestone, at mine | kg | 0,0019 | 0,0283 |
| Concrete | 504 | concrete, normal, at plant | m3 | 265,2200 | 1447,2335 |
| Bricks | 512 | ceramic tiles, at regional storage | kg | 0,7651 | 14,9540 |
| Plaster Board | 517 | gypsum plaster board, at plant | kg | 0,3600 | 6,2652 |
| Mortar | 537 | cement mortar, at plant | kg | 0,1953 | 1,5182 |
| Clay plaster | 538 | clay plaster, at plant | kg | 0,0195 | 0,5181 |
| Glass | 805 | flat glass, coated, at plant | kg | 0,6855 | 15,0414 |
| Aluminium | 1059 | aluminum, secondary, from new scrap, at plant | kg | 0,4102 | 8,4313 |
| Reinforcing steel | 1141 | reinforcing steel, at plant | kg | 1,3442 | 20,9352 |
| Steel | 1154 | steel, low-alloyed, at plant | kg | 1,6294 | 26,1590 |
| Paint | 1670 | alkyd paint, white, 60% in solvent, at plant | kg | 2,5115 | 84,3073 |
| Bitumen | 1814 | bitumen sealing, at plant | kg | 1,0177 | 51,0742 |
| Polyethylene | 1829 | polyethylene, HDPE, granulate, at plant | kg | 1,8921 | 79,8534 |
| Polyurethane | 1838 | polyurethane, flexible foam, at plant | kg | 4,4208 | 101,2692 |
| Polyvinylchloride | 1840 | polyvinylchloride, at regional storage | kg | 2,1625 | 59,0158 |
| Rubber | 1847 | synthetic rubber, at plant | kg | 3,1972 | 101,3493 |
| Water | 2288 | tap water, at user | kg | 0,0003 | 0,0062 |
| Wood | 2507 | sawn timber, softwood, planed, kiln dried, at plant | m3 | 713,1300 | 12792,1890 |
| Sand | 464 | gravel, round, at mine (Tierra) | kg | 0,0024 | 0,0576 |
| Algae * | A001 | Algae, at regional storehouse | kg | 0,0200 | 20,0000 |
| Sheep Wool ** | P001 | Wool mat, at plant | kg | 0,9850 | 13,4200 |
| Electricity (Const-Dem) | 698 | electricity mix | kWh | 0,5004 | 10,9038 |
| Diesel (Const-Dem) | 559 | diesel, burned in building machine | MJ | 0,0910 | 1,3799 |
| Transport (Const-Dem) | 1943 | transport, lorry 32 t | tkm | 0,1663 | 2,8149 |
| Electricity (Operational) | 698 | electricity mix | kWh | 0,5004 | 10,9038 |
| Natural Gas (Operational) | 1327 | natural gas, high pressure, at consumer | MJ | 0,0101 | 1,1359 |
| Brick final disposal | 2005 | disposal, building, brick, to final disposal | kg | 0,0141 | 0,3110 |
| Concrete final disposal | 2007 | disposal, building, cement (in concrete) and mortar, to final disposal | kg | 0,0148 | 0,3217 |
| Glass final disposal | 2019 | disposal, building, glass sheet, to final disposal | kg | 0,0108 | 0,2614 |
| Polyurethane final disposal | 2040 | disposal, building, polyurethane foam, to final disposal | kg | 2,4699 | 1,3770 |
| Polyvinylchloride final disposal | 2043 | disposal, building, polyvinylchloride products, to final disposal | kg | 2,2223 | 12,5207 |
| Steel final disposal | 2048 | disposal, building, reinforcement steel, to final disposal | kg | 0,0678 | 1,1252 |
| Wood final disposal | 2052 | disposal, building, waste wood, untreated, to final disposal | kg | 1,4743 | 0,2038 |
| Aluminium final disposal | 2090 | disposal, aluminium, 0% water, to municipal incineration | kg | 0,0369 | 0,7668 |
| Bitumen final disposal | 2217 | disposal, bitumen, 1.4% water, to sanitary landfill | kg | 0,1079 | 0,3407 |
| Inert material final disposal | 2221 | disposal, inert material, 0% water, to sanitary landfill | kg | 0,0128 | 0,3330 |
| Stage | Component | Unit | BW | CW | SW | |||
|---|---|---|---|---|---|---|---|---|
| LOCATION I | LOCATION II | LOCATION I | LOCATION II | LOCATION I | LOCATION II | |||
| Manufacture PH1 | Gravel | kg | 199.316,16 | 199.316,16 | 199.316,16 | 199.316,16 | 199.316,16 | 199.316,16 |
| Limestone | kg | 776,96 | 776,96 | 776,96 | 776,96 | 776,96 | 776,96 | |
| Concrete | m3 | 158,36 | 158,36 | 185,97 | 185,97 | 158,36 | 158,36 | |
| Bricks | kg | 196.924,82 | 196.924,82 | 83.044,34 | 83.044,34 | 83.044,34 | 83.044,34 | |
| Plaster Board | kg | 10.071,90 | 10.071,90 | 10.071,90 | 10.071,90 | 10.071,90 | 10.071,90 | |
| Mortar | kg | 86.316,30 | 86.316,30 | 20.461,47 | 20.461,47 | 10.446,01 | 10.446,01 | |
| Clay plaster | kg | 19.666,60 | 19.666,60 | 19.666,60 | 19.666,60 | 19.666,60 | 19.666,60 | |
| Glass | kg | 3.583,13 | 3.583,13 | 3.583,13 | 3.583,13 | 3.583,13 | 3.583,13 | |
| Aluminium | kg | 2.329,44 | 2.329,44 | 2.329,44 | 2.329,44 | 2.329,44 | 2.329,44 | |
| Reinforcing steel | kg | 6.550,74 | 6.550,74 | 6.550,74 | 6.550,74 | 6.550,74 | 6.550,74 | |
| Steel | kg | 314,62 | 314,62 | 314,62 | 314,62 | 314,62 | 314,62 | |
| Paint | kg | 8.263,95 | 8.263,95 | 8.263,95 | 8.263,95 | 8.263,95 | 8.263,95 | |
| Bitumen | kg | 258,39 | 258,39 | 258,39 | 258,39 | 258,39 | 258,39 | |
| Polyethylene | kg | 45,81 | 45,81 | 45,81 | 45,81 | 45,81 | 45,81 | |
| Polyurethane | kg | 155,93 | 27,46 | 187,11 | 467,78 | 155,93 | 311,85 | |
| Polyvinylchloride | kg | 27,46 | 27,46 | 27,46 | 27,46 | 27,46 | 27,46 | |
| Rubber | kg | 79,06 | 79,06 | 79,06 | 79,06 | 79,06 | 79,06 | |
| Water | kg | 34.664,05 | 34.664,05 | 26.845,78 | 26.845,78 | 101.112,30 | 101.112,30 | |
| Wood | m3 | 4,11 | 4,11 | 4,11 | 4,11 | 4,11 | 4,11 | |
| Sand | kg | 0,00 | 0,00 | 0,00 | 0,00 | 226.324,80 | 226.324,80 | |
| Algae | kg | 0,00 | 0,00 | 0,00 | 0,00 | 2.715,90 | 2.715,90 | |
| Sheep Wool | kg | 0,00 | 0,00 | 0,00 | 0,00 | 565,81 | 565,81 | |
| Construction and Demolition PH2 | Electricity (Const-Dem) | kWh | 34.058,76 | 34.501,07 | 29.467,66 | 30.131,13 | 31.651,75 | 32.762,28 |
| Diesel (Const-Dem) | MJ | 286.093,61 | 289.808,99 | 247.528,31 | 253.101,48 | 29.737,79 | 275.203,15 | |
| Transport (Const-Dem) | tkm | 111.348,48 | 111.370,00 | 97.721,92 | 97.754,20 | 94.982,97 | 97.186,61 | |
| Operational PH5 | Electricity (Operational) | kWh | 767.477,57 | 814.227,25 | 767.477,57 | 814.227,25 | 767.477,57 | 814.227,25 |
| Natural Gas (Operational) | MJ | 3.867.080,73 | 7.658.781,91 | 3.867.080,73 | 7.658.781,91 | 3.867.080,73 | 7.658.781,91 | |
| Final Disposal PH4 | Brick final disposal | kg | 196.924,82 | 196.924,82 | 83.044,34 | 83.044,34 | 83.044,34 | 83.044,34 |
| Concrete final disposal | kg | 395.893,90 | 395.893,90 | 464.924,50 | 464.924,50 | 395.893,90 | 395.893,90 | |
| Glass final disposal | kg | 3.583,13 | 3.583,13 | 3.583,13 | 3.583,13 | 3.583,13 | 3.583,13 | |
| Polyurethane final disposal | kg | 155,93 | 343,04 | 187,11 | 467,78 | 155,93 | 311,85 | |
| Polyvinylchloride final disposal | kg | 27,46 | 27,46 | 27,46 | 27,46 | 27,46 | 27,46 | |
| Steel final disposal | kg | 6.865,36 | 6.865,36 | 6.865,36 | 6.865,36 | 6.865,36 | 6.865,36 | |
| Wood final disposal | kg | 2.874,80 | 2.874,80 | 2.874,80 | 2.874,80 | 2.874,80 | 2.874,80 | |
| Aluminum final disposal | kg | 2.329,44 | 2.329,44 | 2.329,44 | 2.329,44 | 2.329,44 | 2.329,44 | |
| Bitumen final disposal | kg | 258,39 | 258,39 | 258,39 | 258,39 | 258,39 | 258,39 | |
| Inert material final disposal | kg | 324.671,08 | 324.671,08 | 258.816,25 | 258.816,25 | 478.407,30 | 478.407,30 | |
| Total Results | Global Warming Potential (kg CO2-eq /m2 year | Cumulative Energy Demand (MJ-eq/m2 year) | |||||||
|---|---|---|---|---|---|---|---|---|---|
| PH1, PH4 | PH2, PH3 | Total Embodied | Total Operational PH5 | PH1, PH4 | PH2, PH3 | Total Embodied | Total Operational PH 5 | ||
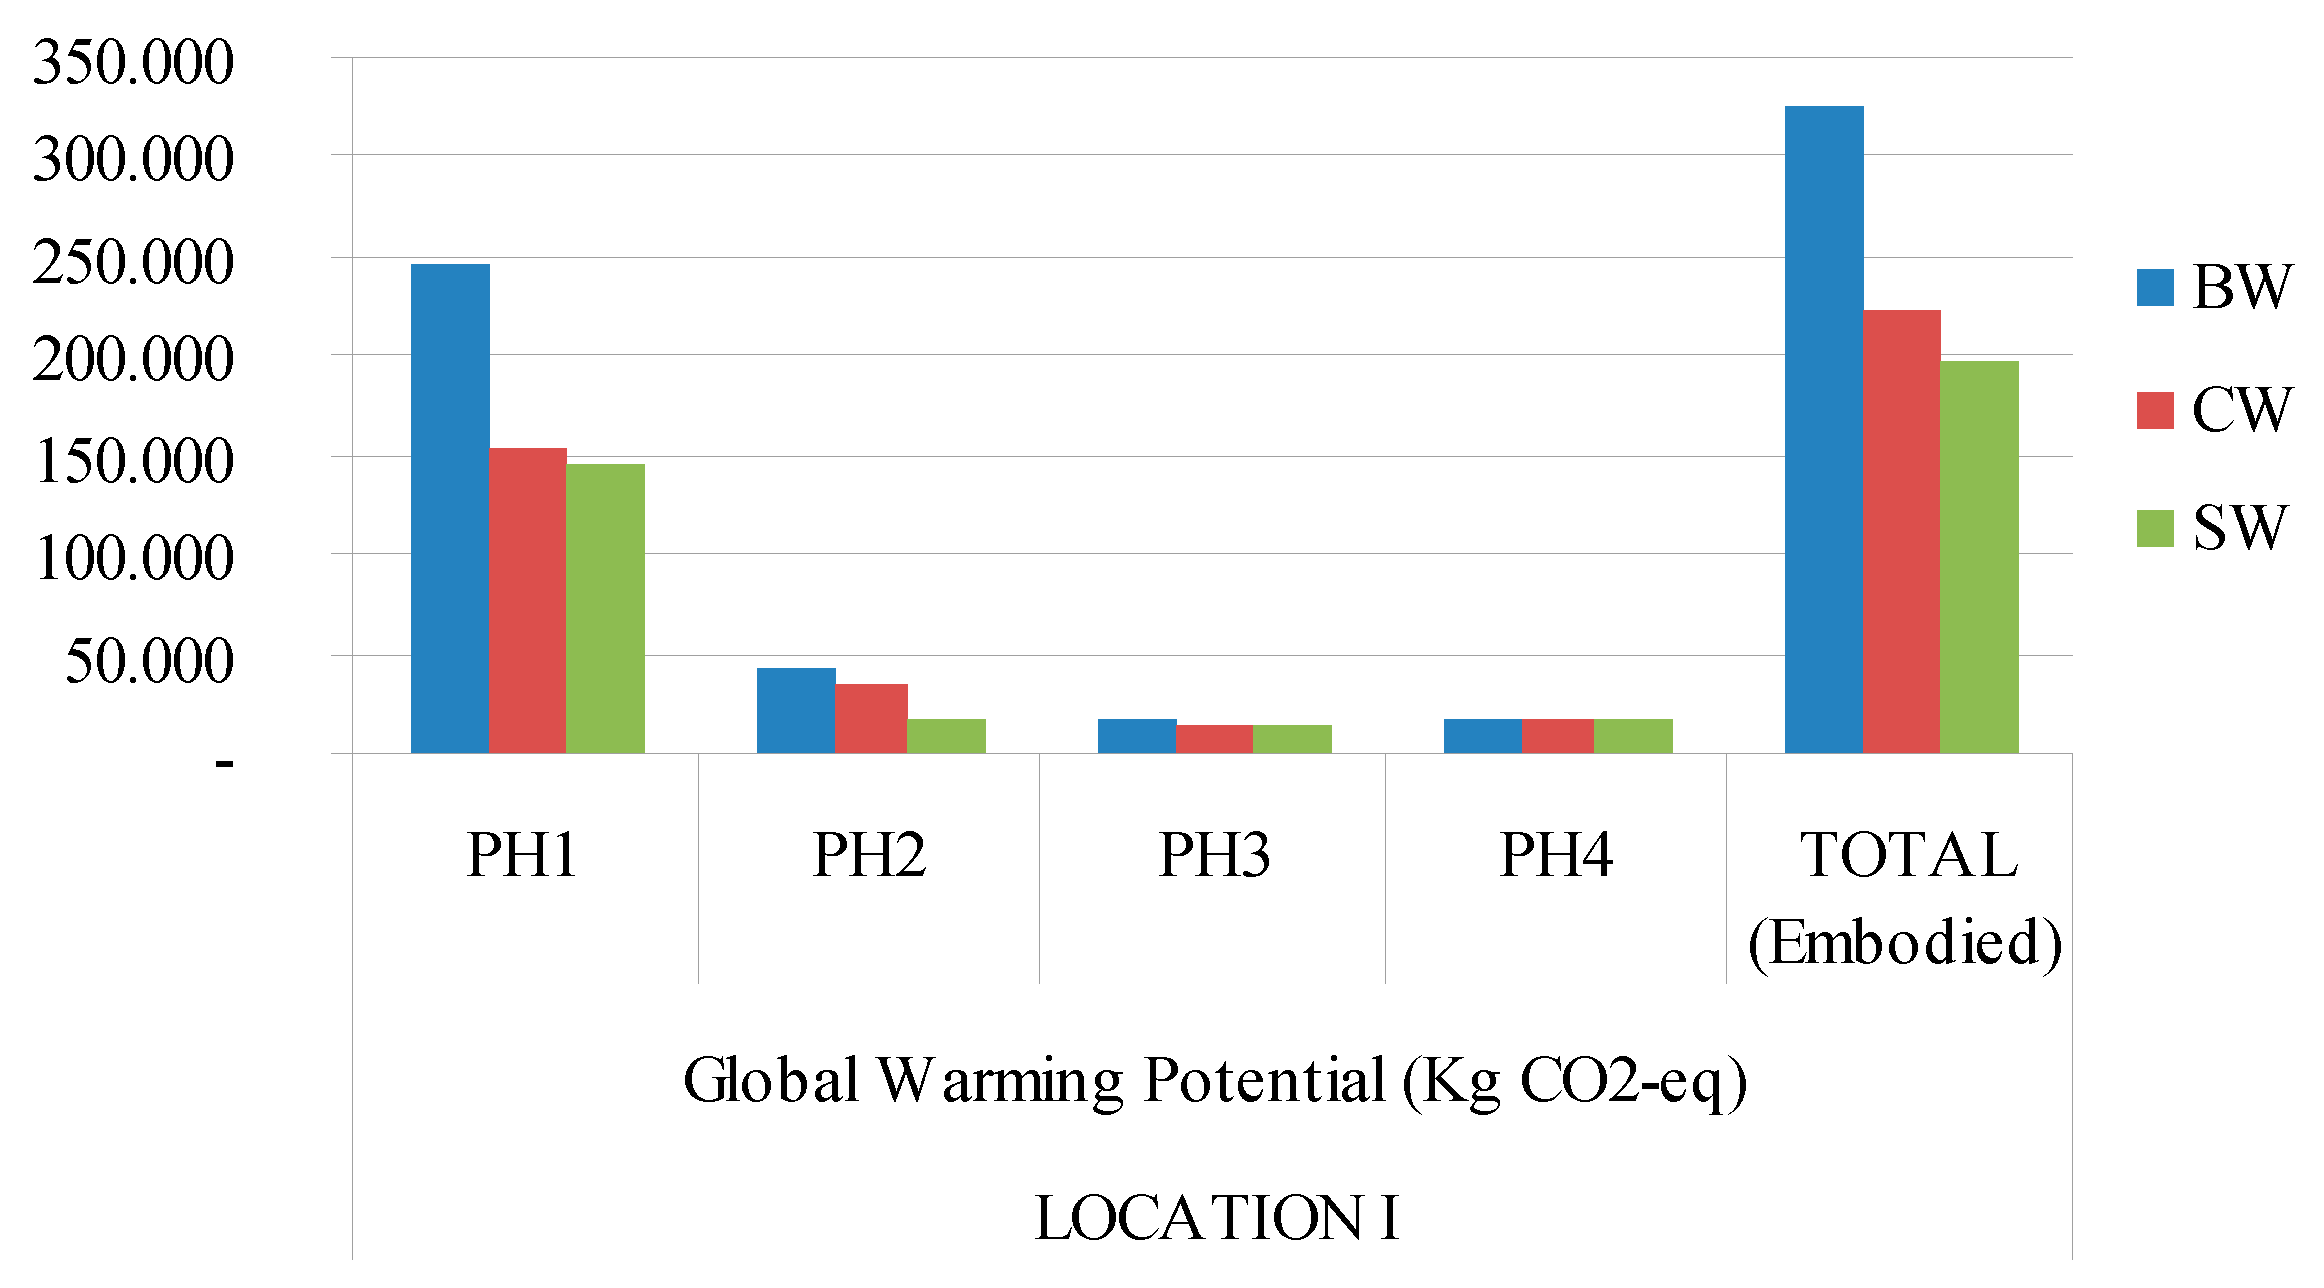
| LOCATION I | Ceramic Bricks Wall (BW) | 264.949,39 | 61.586,88 | 326.536,27 | 422.971,93 | 11.833,84 | 2.447,38 | 14.281,22 | 12.760.933,10 |
| Concrete Blocks Wall (CW) | 171.385,34 | 53.515,04 | 224.900,38 | 422.971,93 | 8.014,74 | 2.104,76 | 10.119,50 | 12.760.933,10 | |
| Stabilized Soil Wall (SW) | 164.542,52 | 34.340,63 | 198.883,15 | 422.971,93 | 8.182,94 | 2.214,66 | 10.397,61 | 12.760.933,10 | |
| LOCATION II | Ceramic Bricks Wall (BW) | 266.238,71 | 63.256,98 | 329.495,69 | 484.546,96 | 16.693,07 | 2.411,88 | 19.104,95 | 17.577.594,30 |
| Concrete Blocks Wall (CW) | 174.206,50 | 54.115,19 | 228.321,69 | 484.546,96 | 8.106,53 | 2.139,21 | 10.245,74 | 17.577.594,30 | |
| Stabilized Soil Wall (SW) | 168.551,38 | 56.449,75 | 225.001,13 | 484.546,96 | 8.219,03 | 2.233,47 | 10.452,50 | 17.577.594,30 | |
| Results per m2 and year | PH1, PH4 | PH2, PH3 | Total Embodied | Total Operational PH5 | PH1, PH4 | PH2, PH3 | Total Embodied | Total Operational PH 5 | |
| LOCATION I | Ceramic Bricks Wall (BW) | 11,95 | 2,78 | 14,73 | 19,07 | 0,53 | 0,11 | 0,64 | 575,48 |
| Concrete Blocks Wall (CW) | 7,73 | 2,41 | 10,14 | 19,07 | 0,36 | 0,09 | 0,46 | 575,48 | |
| Stabilized Soil Wall (SW) | 7,42 | 1,55 | 8,97 | 19,07 | 0,37 | 0,10 | 0,47 | 575,48 | |
| LOCATION II | Ceramic Bricks Wall (BW) | 12,01 | 2,85 | 14,86 | 21,85 | 0,75 | 0,11 | 0,86 | 792,69 |
| Concrete Blocks Wall (CW) | 7,86 | 2,44 | 10,30 | 21,85 | 0,37 | 0,10 | 0,46 | 792,69 | |
| Stabilized Soil Wall (SW) | 7,60 | 2,55 | 10,15 | 21,85 | 0,37 | 0,10 | 0,47 | 792,69 | |
© 2016 by the authors; licensee MDPI, Basel, Switzerland. This article is an open access article distributed under the terms and conditions of the Creative Commons Attribution (CC-BY) license (http://creativecommons.org/licenses/by/4.0/).
Share and Cite
Galan-Marin, C.; Rivera-Gomez, C.; Garcia-Martinez, A. Use of Natural-Fiber Bio-Composites in Construction versus Traditional Solutions: Operational and Embodied Energy Assessment. Materials 2016, 9, 465. https://doi.org/10.3390/ma9060465
Galan-Marin C, Rivera-Gomez C, Garcia-Martinez A. Use of Natural-Fiber Bio-Composites in Construction versus Traditional Solutions: Operational and Embodied Energy Assessment. Materials. 2016; 9(6):465. https://doi.org/10.3390/ma9060465
Chicago/Turabian StyleGalan-Marin, Carmen, Carlos Rivera-Gomez, and Antonio Garcia-Martinez. 2016. "Use of Natural-Fiber Bio-Composites in Construction versus Traditional Solutions: Operational and Embodied Energy Assessment" Materials 9, no. 6: 465. https://doi.org/10.3390/ma9060465
APA StyleGalan-Marin, C., Rivera-Gomez, C., & Garcia-Martinez, A. (2016). Use of Natural-Fiber Bio-Composites in Construction versus Traditional Solutions: Operational and Embodied Energy Assessment. Materials, 9(6), 465. https://doi.org/10.3390/ma9060465