A Real-Time Chinese Traffic Sign Detection Algorithm Based on Modified YOLOv2


1
Hunan Provincial Key Laboratory of Intelligent Processing of Big Data on Transportation, Changsha University of Science and Technology, Changsha 410114, China
2
School of Computer and Communication Engineering, Changsha University of Science and Technology, Changsha 410114, China
*
Authors to whom correspondence should be addressed.
Algorithms 2017, 10(4), 127; https://doi.org/10.3390/a10040127
Submission received: 30 September 2017
/
Revised: 10 November 2017
/
Accepted: 14 November 2017
/
Published: 16 November 2017
Abstract
:Traffic sign detection is an important task in traffic sign recognition systems. Chinese traffic signs have their unique features compared with traffic signs of other countries. Convolutional neural networks (CNNs) have achieved a breakthrough in computer vision tasks and made great success in traffic sign classification. In this paper, we present a Chinese traffic sign detection algorithm based on a deep convolutional network. To achieve real-time Chinese traffic sign detection, we propose an end-to-end convolutional network inspired by YOLOv2. In view of the characteristics of traffic signs, we take the multiple 1 × 1 convolutional layers in intermediate layers of the network and decrease the convolutional layers in top layers to reduce the computational complexity. For effectively detecting small traffic signs, we divide the input images into dense grids to obtain finer feature maps. Moreover, we expand the Chinese traffic sign dataset (CTSD) and improve the marker information, which is available online. All experimental results evaluated according to our expanded CTSD and German Traffic Sign Detection Benchmark (GTSDB) indicate that the proposed method is the faster and more robust. The fastest detection speed achieved was 0.017 s per image.
1. Introduction
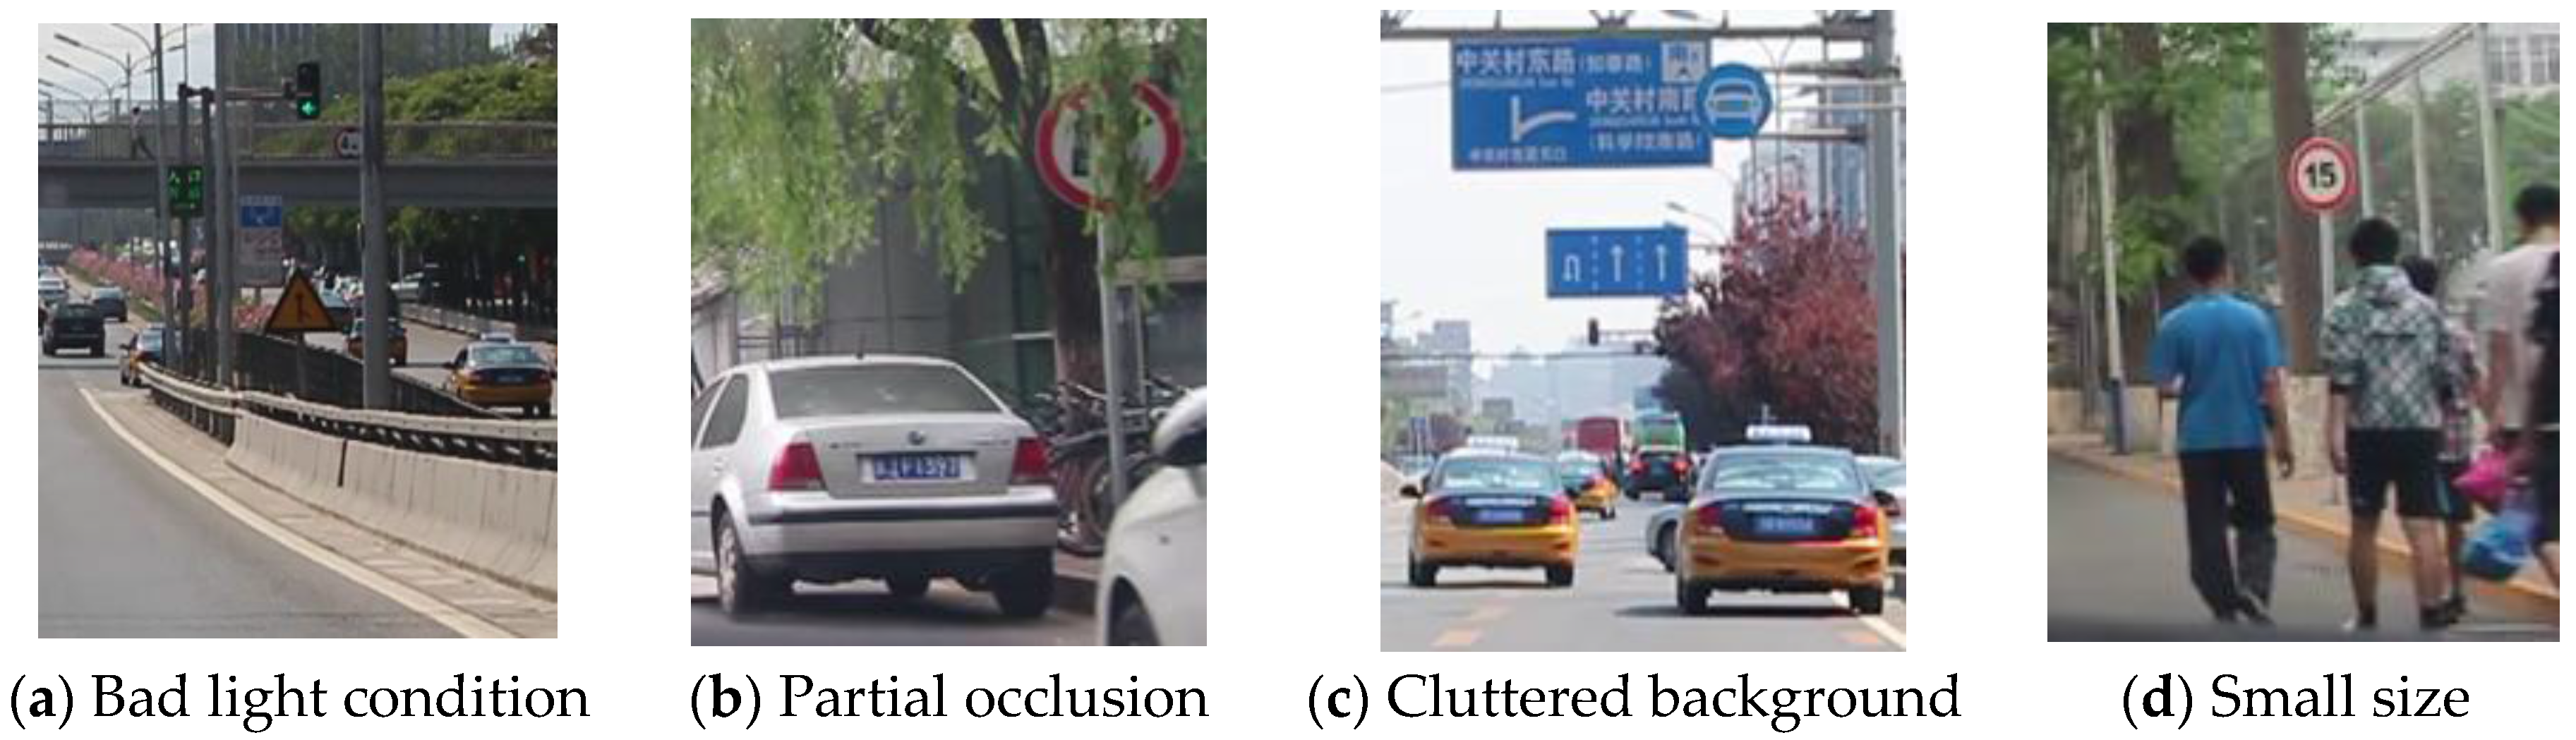
Traffic Sign Recognition Systems (TSRs) are important for highway maintenance, driver-assistance systems, and self-driving cars [1]. In general, the research of traffic sign recognition is divided into sign detection and sign classification, which both have been discussed for a long time; in particular, the latter has achieved greater success on the German Traffic Sign Recognition Benchmark (GTSRB). As one of key technologies of TSR, traffic sign detection faces some difficulties in real traffic scenes due to illumination changes, partial occlusion, cluttered background, and small size, as shown in Figure 1.
In the past, the mainstream methods for traffic sign detection were based on traditional object detection algorithms. The pipeline of traffic sign detection generally uses hand-crafted features to extract region proposals, and then combines classifiers to filter out the negatives. Nowadays, deep convolutional networks are applied to image recognition and object detection, becoming increasingly fast and accurate. Convolutional neural networks (CNNs) can learn features from a large number of samples without preprocessing, which avoids the design difficulty of hand-crafted features and learns more generalized features. CNN has already been presented as a classifier in machine learning and has been used in traffic sign classification. The performance of the CNN-based method is the state-of-the-art on GTSRB [2]. However, for traffic sign detection, the CNN-based method [3] is not superior to real-time performance due to the complex computation. However, the graphics processing unit (GPU) can solve this problem through its high computing performance. Up to now, many new types of convolutional networks for object detection have emerged and been proven to be efficient in relevant fields. The series of methods based on regression exhibits real-time performance; for example, the speed of YOLO [4] can reach above 45 frames per second.
To evaluate the relative methods for traffic sign detection, there are several public traffic sign datasets available, such as GTSDB [5] and LISA traffic sign dataset (LISATSD) [1]. GTSDB is most commonly used by researchers. It is noteworthy that the traffic signs are classified coarsely into mandatory signs, danger signs, and prohibitory signs in GTSDB. The three categories of traffic signs are common and simple, featuring universal design principles compared to other signs.
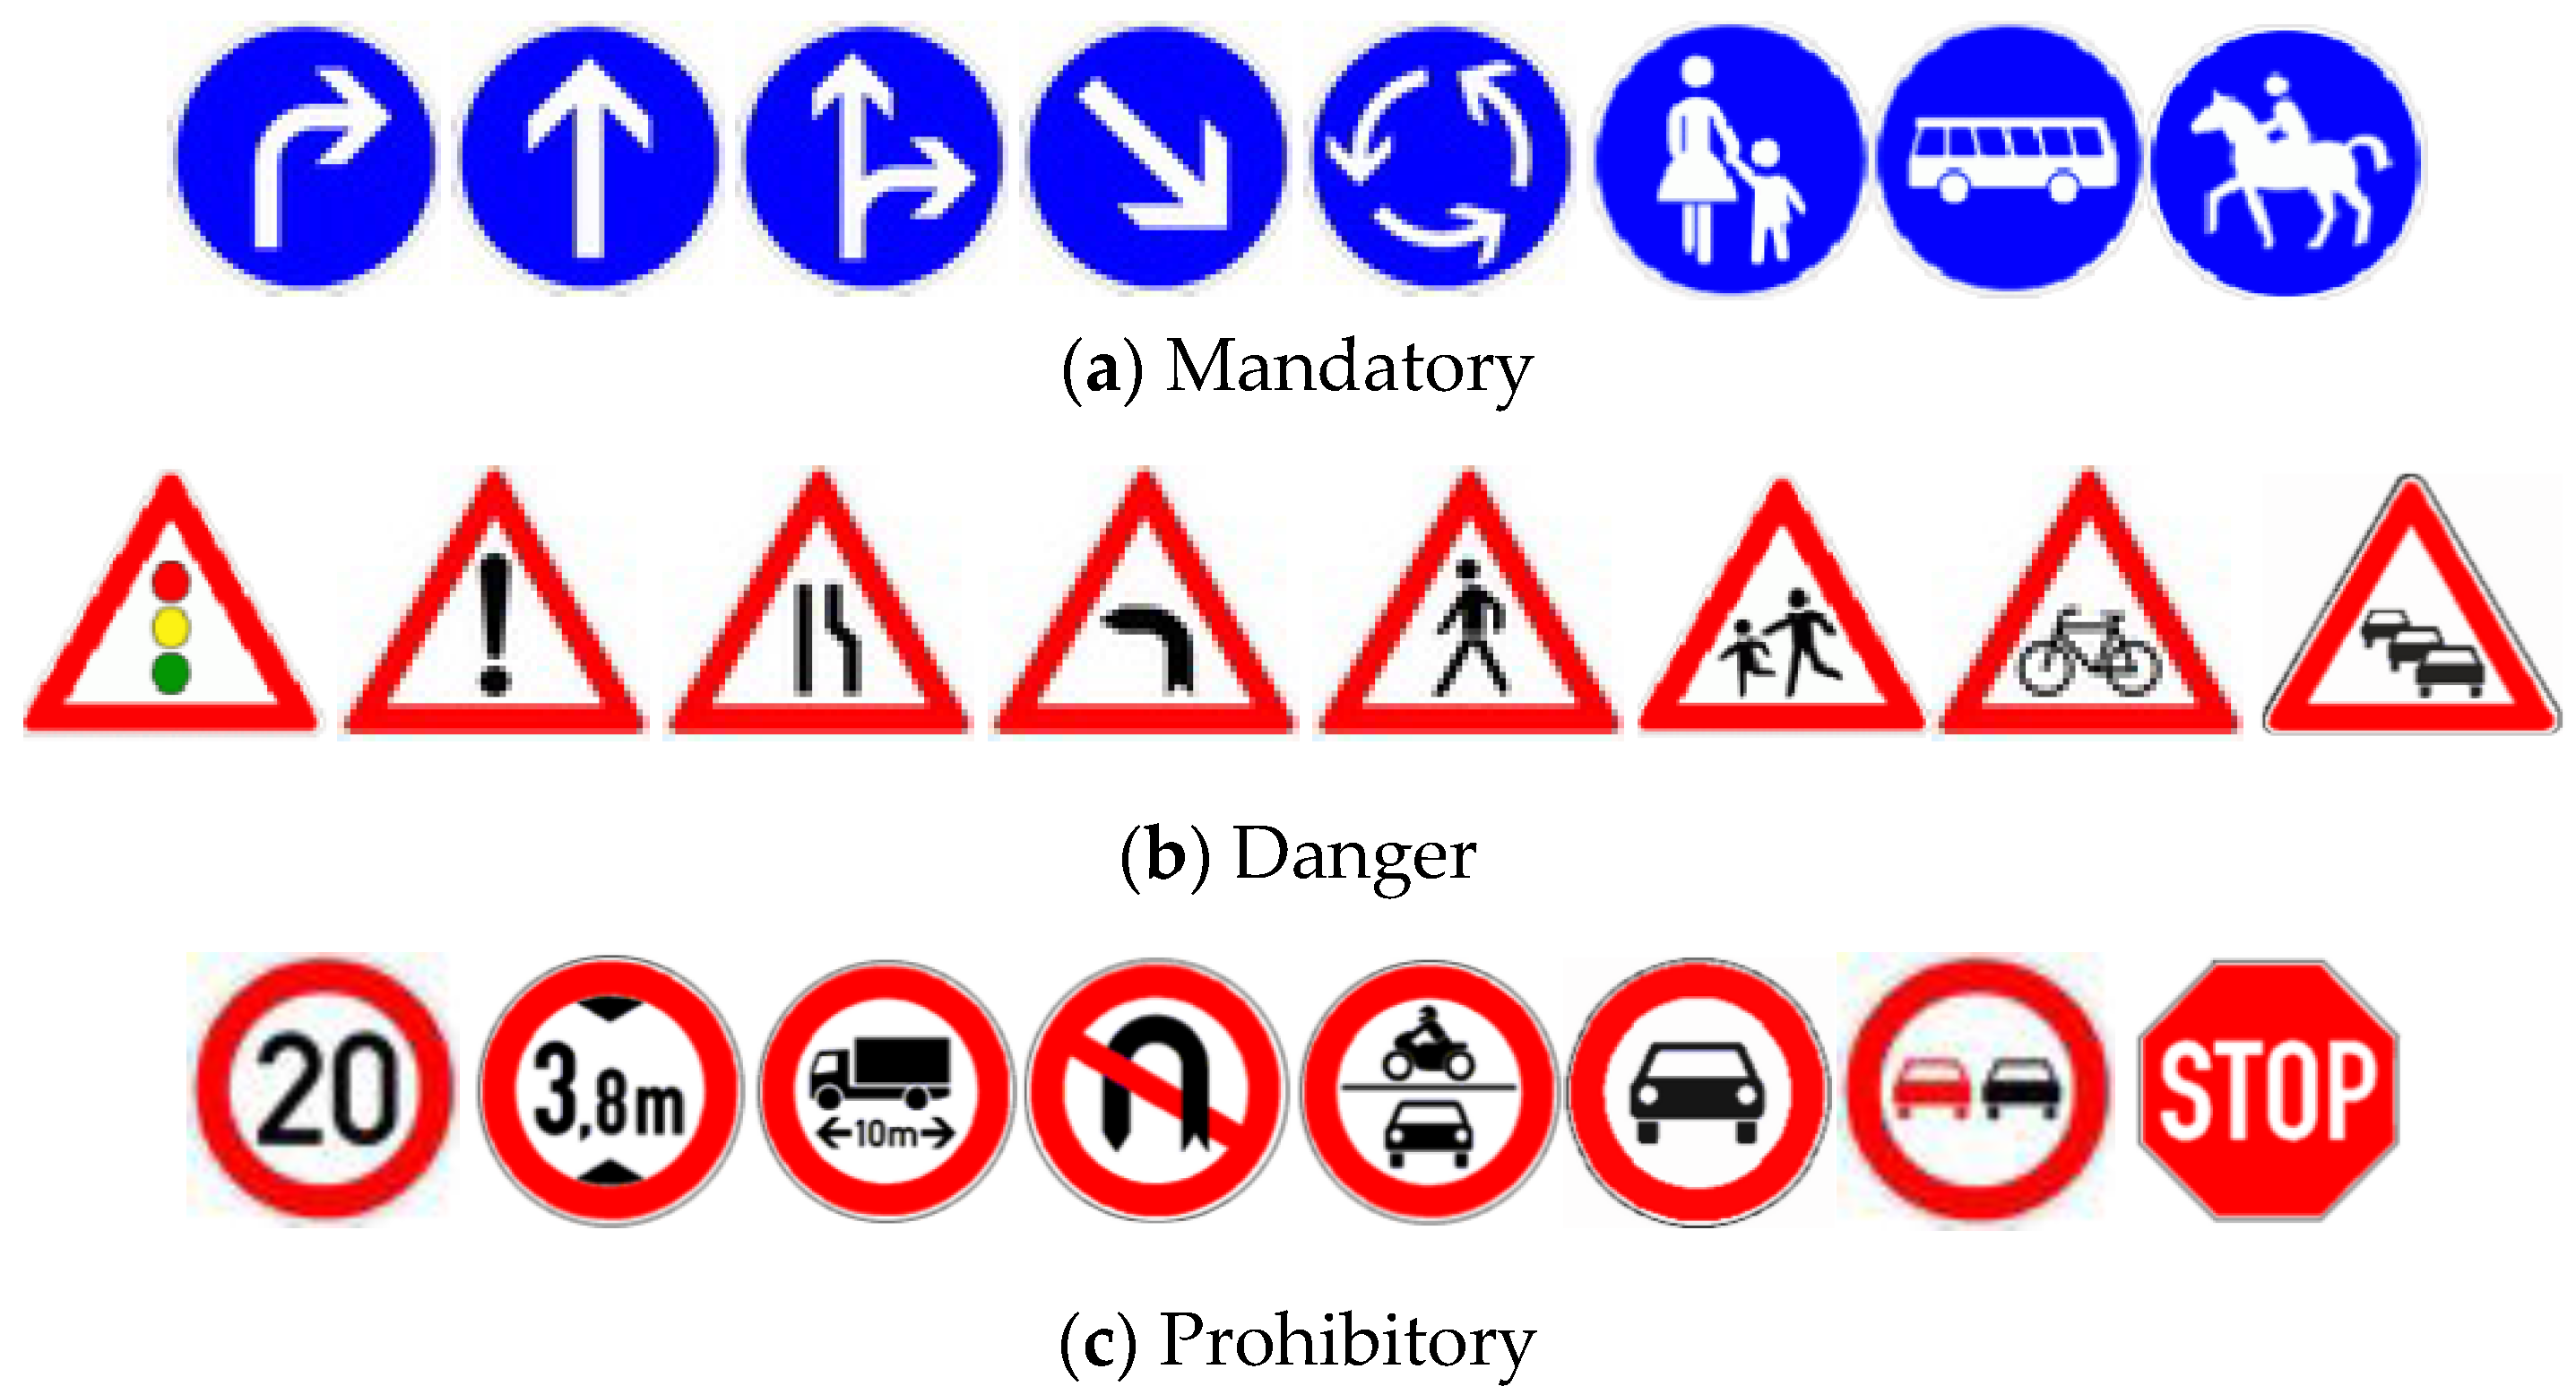
For researching Chinese traffic sign detection methods, there is a recently published Chinese traffic sign dataset (CTSD) [6]. Figure 2 and Figure 3 show some samples of the three super categories in Germany and China, respectively. There are some similarities and differences among the three super categories. Some of Chinese traffic signs contain Chinese characters, not just English characters. We found that there are only slight differences in some traffic signs, but others have completely distinct representation forms, such as the sign prohibiting overtaking. The details should be taken into account when detection methods are applied to Chinese traffic signs.
In this paper, to achieve real-time traffic sign detection on Chinese roads, we expanded the CTSD by adding new images and transforming images. The expanded CTSD is also called Changsha University of Science and Technology Chinese traffic sign detection benchmark (CCTSDB). More importantly, we propose an end-to-end convolutional network for Chinese traffic sign detection inspired by YOLOv2 [7], which is a unified detection model without a complex processing pipeline. Furthermore, we made full use of the convolutional layers and characteristics of traffic signs to construct three kinds of networks. Finally, we selected the Model-B through experiments performed on CCTSDB. This method proved to be faster and more robust than other network structures. In addition, our method was also evaluated on GTSDB and the results compared well with other methods.
The remainder of the paper is organized as follows. Section 2 describes the related work on traffic sign detection. The detailed network architecture and major work are presented in Section 3. Section 4 contains the experimental results on CCTSDB and GTSDB. Finally, the conclusions are drawn in Section 5.
2. Related Work
In retrospect, traffic sign detection methods can be roughly divided into two categories. One is based on traditional object detection algorithms and combines the characteristics of traffic signs. Another is characterized by deep learning-based approaches that have the ability to self-learn different features.
Traditional detection methods mainly depend on the feature extraction algorithms. Regardless of traffic sign detection or traffic sign classification, they always require color features and shape features. With regard to color features, due to the limitation of algorithms based on RGB (Red, Green, Blue) color space for different light conditions on adaptability, the images are usually transformed to other color spaces, such as HSV (Hue, Saturation, Value) [8]. Li et al. presented a color probability model based on Ohta space in Reference [9] to compute probability maps for each color belonging to traffic signs. Considering the shape features, traffic signs are generally circular, triangular, rectangular, or polygonal. The edges are always used to extract contour lines by Hough transforms, radial symmetry, edge-following, etc. Wang et al. proposed a new ellipse-detection method in Reference [10] to detect circular traffic signs deformed by external force or shooting angle. Liang et al. [11] designed a set of templates for each object category of traffic signs to match shape. Besides the features of color and shape, there are some other feature descriptors used in traffic sign detection. Wang et al. employed the histogram of oriented gradient (HOG) feature and SVM classifier [12] to detect traffic signs and obtained great grades in the German Traffic Sign Detection Benchmark competition hosted by the International Joint Conference on Neural Networks (IJCNN) in 2013. The boolean convolutional neural networks (BCNN) in Reference [13] combined the HOG features to detect traffic signs on GTSDB. The integral channel features (ICF) and aggregate channel features (ACF) were applied to USA traffic sign detection separately [14]. The features extraction algorithms are more efficient on linear features than non-linear features. Although hand-crafted features have achieved a higher precision for traffic signs, it is worth noting that the traditional detection methods have stronger pertinence but lack the robustness for the whole system.
Recently, deep learning has been popular in use among computer vision research. There are two approaches to object detection related to deep learning. One is based on region proposal and is also called a two-stage method. As the groundbreaking method in terms of industrial applications solutions, region-based convolutional neural networks (R-CNN) [15] notably improves the average detection precisions on visual object classes challenge (VOC). R-CNN generates 2 k regions of interest (ROI) by selective search and extracts features by CNNs separately. At the last stage, R-CNN employs the SVM classifier to predict the classes of objects. To obtain a better performance, it also adopts linear regression to fine-tune the positions and sizes of detection boxes. Since the spectacular effect of R-CNN, there have been many new ideas implemented on CNN, such as spatial pyramid pooling network (SPP-Net) [16], Fast R-CNN [17], and Faster R-CNN [18]. The precision and speed on object recognition of the above methods improved rapidly and the fastest fame rate could reach 15 fps. The other approach is based on the regression method, which is an end-to-end learning model without classifiers and is also called a one-stage method. Redmon J. et al. successively presented the YOLO algorithm [4] and YOLOv2 [7], which integrate object detection and object classification into a single convolutional network, enhancing the speed remarkably but losing the precision. Subsequently, the single shot multibox detector (SSD) [19] introduces the default boxes and multi-scale feature mapping layers to raise the precision. Most of the traffic sign detection methods are focused on images. Another focus of study can be to analyze traffic videos for traffic sign detection by leveraging the semantic representations [20,21]. Yet another focus could consider mining the correlations between the features of traffic signs by a semi-supervised feature selection framework [22] in traffic videos. Concerning the deep learning-based methods, the two-stage methods have advantages in recognition precision and localization accuracy. However, the efficiency of computation is low and the process requires large amounts of resources. The one-stage methods are much faster because of the unified network structures, although the process precision decreases. Moreover, the amount of data is a key factor for deep learning-based methods.
Conclusively, the traditional detection methods have advantages in accuracy. The deep learning-based methods can achieve the robustness of an algorithm by self-learning when faced with the various problems. Hamed et al. [23] recently proposed a lightweight and accurate ConvNet with a sliding window detector to detect traffic signs on GTSDB. There is also a study [24,25,26] focused on Chinese traffic sign detection based on CNN directly. We present an end-to-end method to detect Chinese traffic sign inspired by YOLOv2. It can be faster and applied to a real-time system. To develop the precision, we take into consideration the characteristics of traffic signs and the CNN to improve the network structure.
3. The Chinese Traffic Sign Detection Algorithm Based on Modified YOLOv2
Convolutional neural networks (CNNs) have exhibited huge success in image recognition. A number of detection networks have been adapted from image recognition networks and further advanced. While such improvements have been remarkable, there is not much consideration of the real-time performance of Chinese traffic sign detection. In this paper, we build on YOLOv2 to construct a single convolutional neural network for Chinese traffic sign detection.
3.1. The Network Architecture of YOLOv2
YOLO employs a single neural network to predict bounding boxes and class probabilities directly from full images in one inference. It divides the input image into S × S grids. Each grid cell predicts k bounding boxes and confidence scores of bounding boxes, as well as C conditional class probabilities. Furthermore, each bounding box is represented by a quintuple (x, y, w, h, cfd). The (x, y) coordinates are the center offset of the bounding box compared to the bounds of the grid cell. The w and h are the width and height predicted relative to the whole image, respectively. The confidence cfd is defined as . The value of Pr (Object) is 1 when a grid cell contains a part of a ground truth box, otherwise it is 0. The IOU is the intersection over union between the predicted bounding box and the ground truth box. By these predictions, we can obtain the class-specific confidence score of each bounding box and finally select the bounding boxes having high scores in each grid cell to predict objects in the image globally. YOLOv2 improves a great deal on the basis of YOLO. One of the improvements is the introduction of the concept of the anchor from Faster R-CNN into the original framework to enhance the network performance. The anchors represent parameterized proposals. Each anchor is associated with a scale and aspect ratio with hand-picked priors acquired from the training set. YOLOv2 exploits those prior anchor boxes to predict bounding boxes and improve the precision of their center locations.
In this paper, we construct a deep convolutional network based on the end-to-end detection algorithm to achieve real-time Chinese traffic sign detection. Figure 4 illustrates the algorithm applied to the Chinese traffic sign detection. Each grid generates k bounding boxes according to the prior anchor boxes. To increase the loss from bounding box coordinate predictions, YOLO adds the parameter when the bounding box covers the object. The best bounding box is decided by the value of IOU. YOLO also adds the parameter to decrease the loss from confidence predictions that the given box does not contain the object.
For the regression method, we can calculate the loss function as follows:
denotes that the grid cell i contains part of a Chinese traffic sign. represents the jth bounding box in grid cell i. Conversely, represents the jth bounding box in grid cell i which does not contain any part of traffic signs. The time complexity of Formula (1) is O ((k + c) × S2), which is calculated for one image.
To accomplish the algorithm on the VOC dataset and common objects in context (COCO) dataset, YOLO and YOLOv2 were used to design a convolutional neural network for each, respectively, which are shown in Table 1. In YOLOv2, the route layer is used as a passthrough layer to extract features from the other layers and combine the feature maps. The reorg layer is used to rescale the feature maps.
3.2. Improved Network Structure for Chinese Traffic Sign Detection
Convolutional networks are powerful models used in computer vision due to the feature hierarchies learned from the stacked convolutional layers. Zeiler et al. [27] indicated that the lower layers can learn some specific features of the object, such as edge, color, or texture information. The higher the layer, the more abstract are the features learned. To construct an effect network, we consider the networks for object classification as a reference. The development of the CNN structure occurred in several stages. LeNet [28] is a typical CNN used for handwritten digital recognition. LeNet only has five layers, which is very plain but quite effective. With the popularity of CNNs, deeper and deeper networks are proposed, such as AlexNet [29], VGGNet [30], GoogLeNet [31], and ResNet [32]. Each of these networks has its own strengths on image recognition and presents many efficient tricks or building blocks for constructing CNNs.
From Table 1, we can see that the network structures of YOLO and YOLOv2 have several stacked convolutional layers, which are inspired by GoogLeNet and VGG models. The 1 × 1 convolutional layers followed by 3 × 3 convolutional layers are reduction layers that can increase the nonlinearity without changing the receptive fields of the convolutional layers. In Reference [33], the 1 × 1 convolutional layer is equivalent to the cross channel parametric pooling layer, which can obtain the complex and learnable interaction information by crossing channels. It is important that the number of 1 × 1 convolutional layers followed by 3 × 3 convolutional layers is not a fixed value.
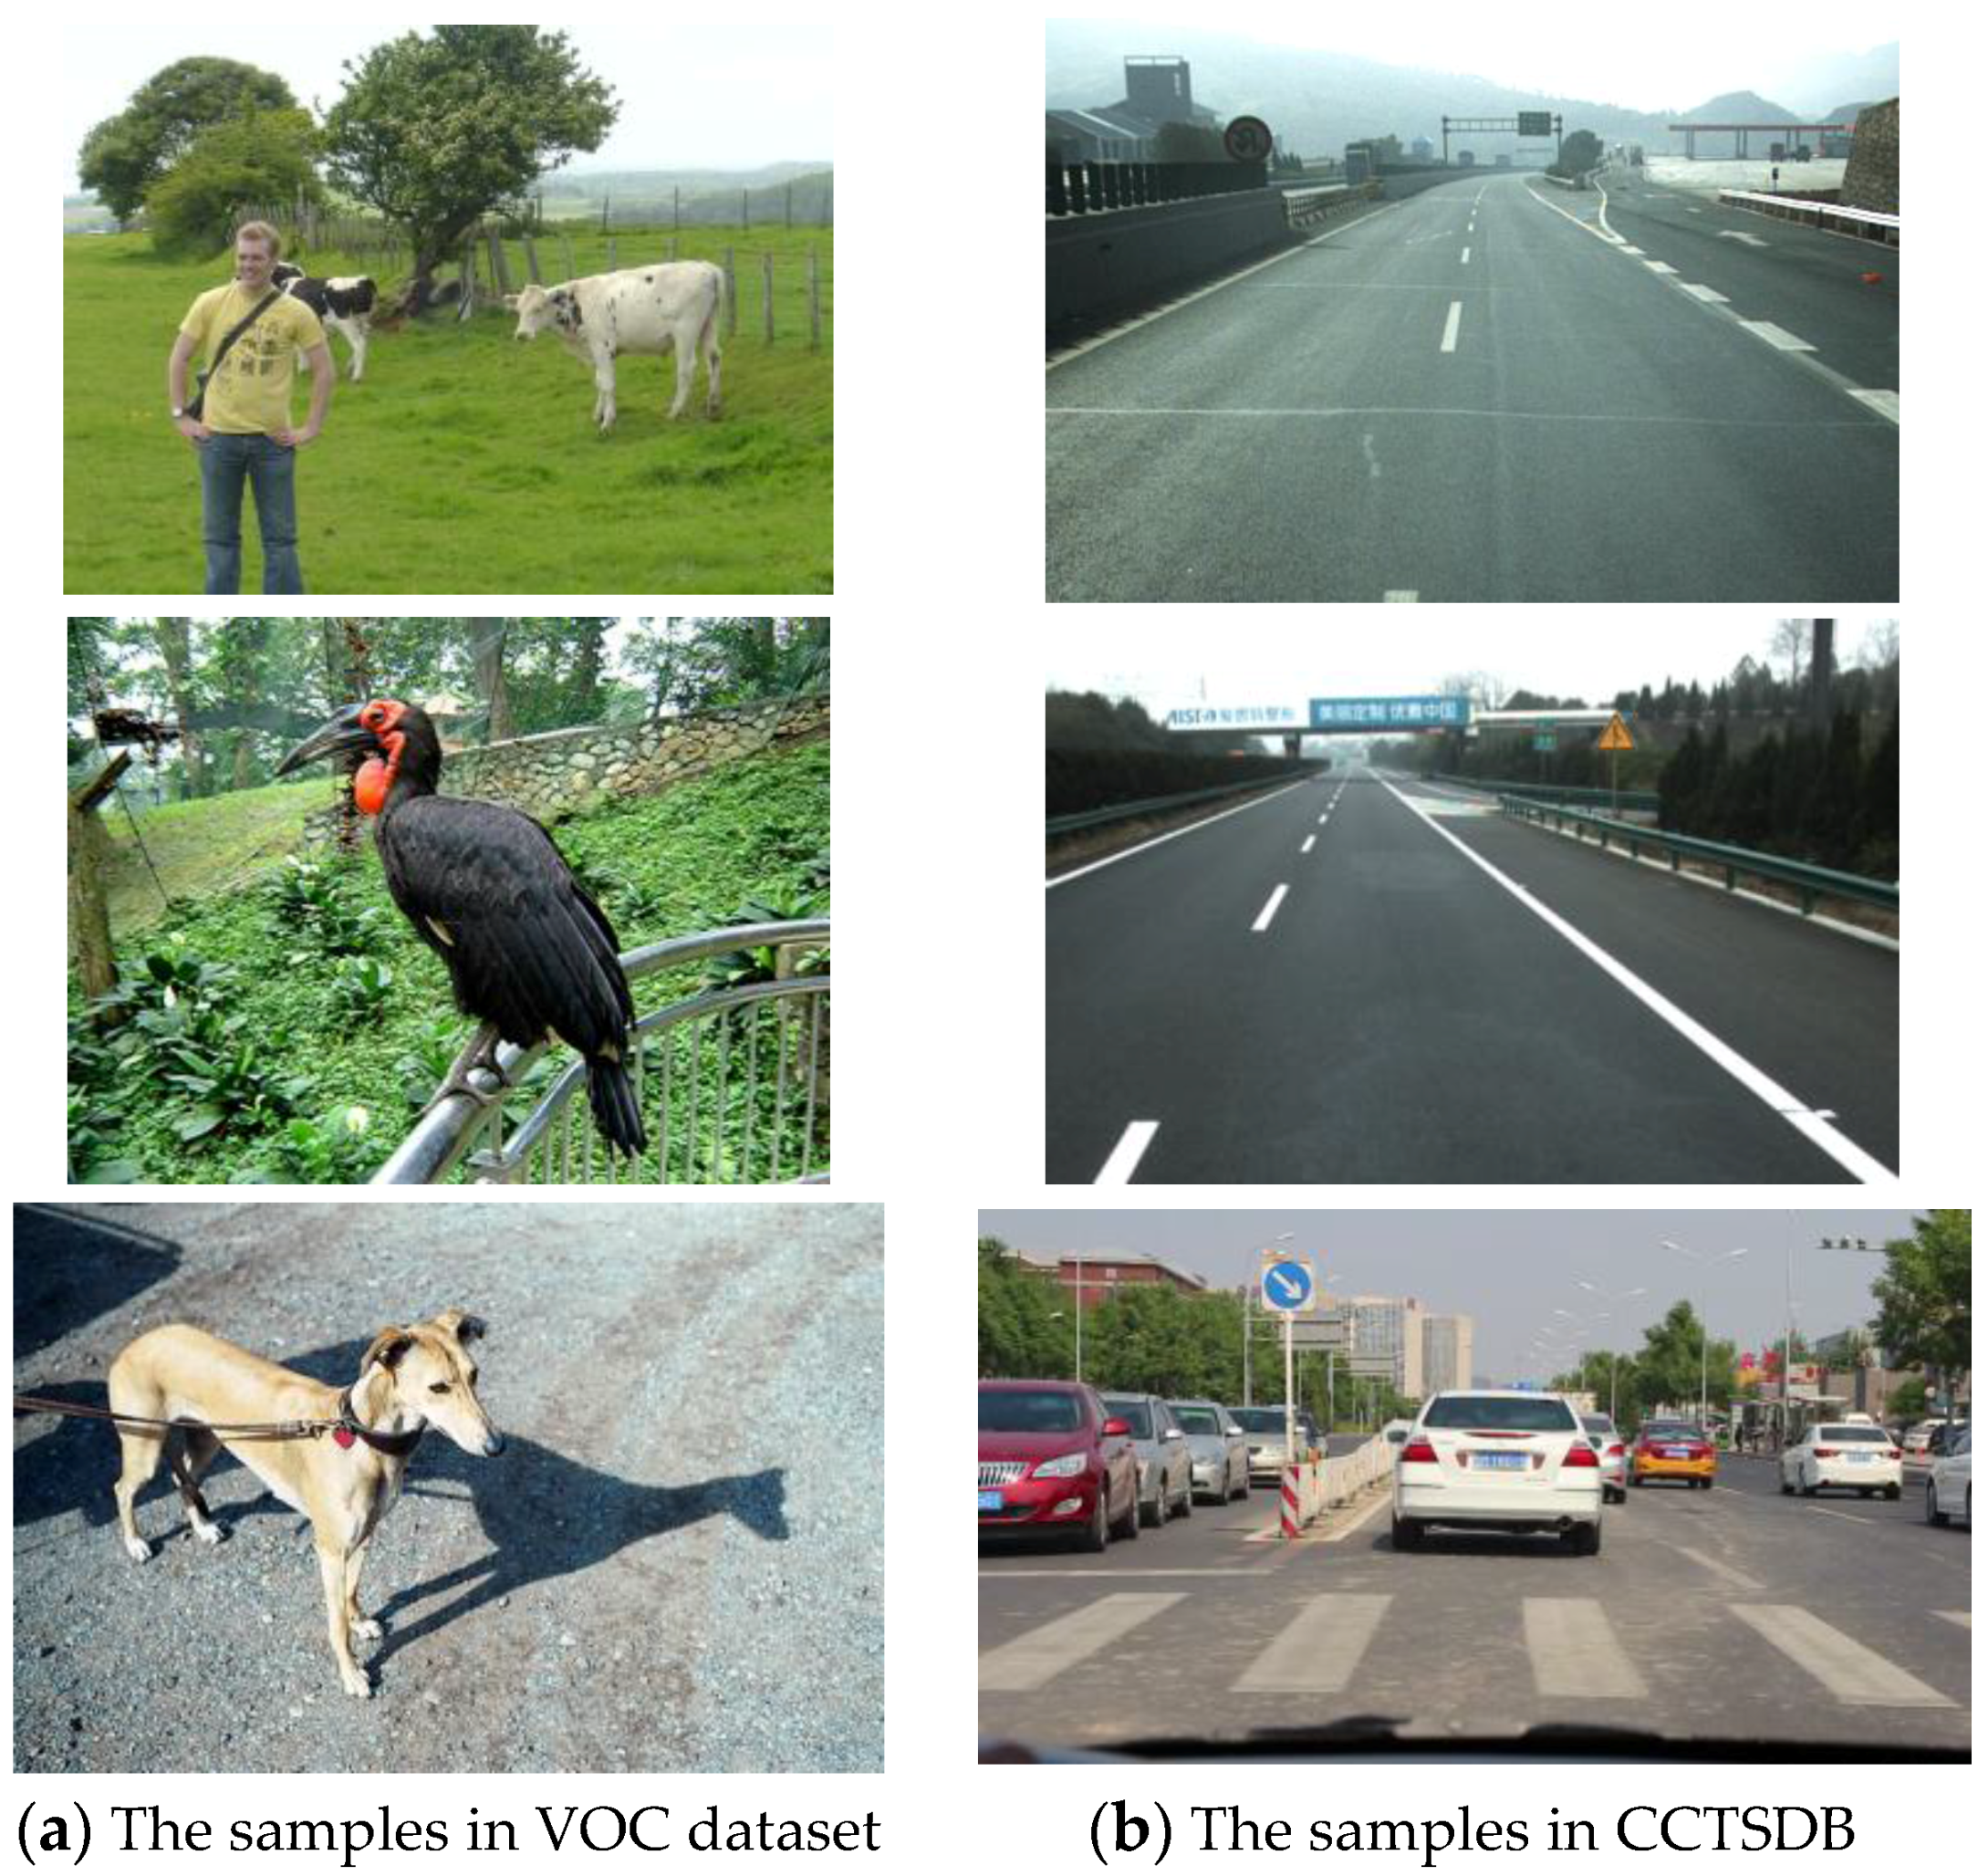
To efficiently enhance the performance of detection framework for Chinese traffic sign, we considered the characteristics of traffic signs to help design the network structure. By analyzing the datasets, we found that the object in VOC is larger compared to the entire image and the background is not very complex. The image sizes are around 500 × 300 and 300 × 500. However, the traffic signs are smaller compared to the entire image; for example, a traffic sign is 32 × 30 pixels in a 1280 × 720 pixel image, just 0.1% of the image. Figure 5 shows some samples in the VOC dataset and CCTSDB. In addition, the final output maps are very small compared to the size of input images through several pooling operations in a deep network model. Considering the small sizes of traffic signs, the features of traffic signs corresponding to output maps are too abstract to predict well. It is thus necessary to design a proper network structure to learn more effective features from shallow layers.
We tried several network models according to the aforementioned CNNs, and finally propose three network models (A, B, and C) in this paper, as shown in Table 1. We found that the networks of YOLO and YOLOv2 pay more attention on the top layers due to the detection of various objects. Compared to YOLO, YOLOv2 simplifies the network by decreasing the stacked convolutional layers in intermediate layers. The detection speed is faster as well.
As a reference, Model-A is used to verify that the repeated convolutional layers in the top layers are not very efficient for Chinese traffic sign detection. This is mainly because the differences among the three categories traffic signs are not obvious, unlike the differences between a person and a ship. We decreased the repeated convolutional layers in the top layers and designed the network with a fine grid in Model-A. As the input images are divided into S × S grid, we encoded the final prediction as an S × S × (k × 5 + C) tensor or S × S × k × (5 + C) tensor in YOLO and YOLOv2, respectively. These variables were explained in Section 3.1. The value of S is smaller, the grid is coarser, and the recall rate is lower. Moreover, the grid size is dependent on the size of the input image and network structure. In YOLO and YOLOv2, the input sizes are 224 × 224 to 544 × 544 and the gird sizes are 7 × 7 to 17 × 17, respectively. The differences between the VOC dataset and CCTSDB can be seen in Figure 5. To avoid losing more information, we determined the input size to be 608 × 608 and the grid to be 19 × 19 according to the characteristics of traffic signs. These sets of variables were applied to all experiments.
Model-B was designed to make full use of the channels information by 1 × 1 convolutional layers. We attempted to add a 1 × 1 convolutional layer followed by another 1 × 1 convolutional layer to learn more features via cross channels. Although the 1 × 1 convolution kernel indicates a linear operation, the multiple 1 × 1 convolutional layers can increase the nonlinear learning ability of Model-B. The filters in half of the 1 × 1 convolutional layer compared to 3 × 3 convolutional layers can obviously reduce the number of parameters and reduce the running time. The number of parameters concerning convolution operations in Model-B was decreased by at least 21 times compared to Model-A and 27 times compared to YOLOv2.
Model-C is combined the features between the intermediate layers and top layers. We know that the feature maps in the intermediate layers contain specific information. In contrast, the top layers contain highly abstract representations. They respond to some area around the object. We combined the fourth and fifth sections of feature maps divided by the max-pooling layers into the final output maps to integrate the features in the response areas.
3.3. Chinese Traffic Sign Dataset
There is little related research on Chinese traffic signs due to the lack of Chinese traffic sign datasets previously available. The German Traffic Sign Detection Benchmark (GTSDB) is generally accepted by researchers, which divides traffic signs into three categories, containing mandatory signs with blue color and circular shape, danger signs with red color and triangular shape, and prohibitory signs with red color and circular shape. There are 900 images with the size of 1360 × 800 in GTSDB (600 for training and 300 for testing). Similar to the GTSDB, the Chinese traffic sign dataset (CTSD) was recently published by the Chinese Academy of Sciences, and was collected from videos of city roads. The CTSD contains 1100 images with the size of 1024 × 768 and 1280 × 720 (700 for training and 400 for testing). It also divides Chinese traffic signs into three categories, including mandatory signs with blue color and circular or rectangular shape, danger signs with yellow color and triangular shape, and prohibitory signs with red color and circular shape.
The network structure is deeper, the more features are learned, and the model performance is superior. With the deepened network structure, the demand for the amount of training data increases greatly. For deep convolutional networks, the number of training images of CTSD is not enough to train the model. So, we decided to acquire, process, and mark new images to expand the CTSD, called the CSUST Chinese traffic sign detection benchmark (CCTSDB). It is available at https://github.com/csust7zhangjm/CCTSDB. In CCTSDB, we added about 5200 images collected from the highway with a size of 1000 × 350. The road condition of highways differs in some attributes compared to city roads, as shown in Table 2. To increase the diversity of the training data, we processed the initial images for data augmentation. For example, we added Gaussian noise to the initial 700 training images. We also transformed the scale by the factor of 1.5 and 0.5 corresponding to weight and height. To learn more features from illumination changes, we darkened the initial 700 training images, while we lightened the data collected from highways due to the poorer light conditions.
In addition, the test set of CTSD in Reference [6] contains 139 mandatory signs, 264 prohibitory signs, and 129 danger signs. Concerning the test set for CCTSDB—excepting tiny traffic signs that are not clear enough to divide into subclasses—we found that the test set contained a total of 209 mandatory signs, 376 prohibitory signs, and 151 danger signs. This observed difference is mainly because the CTSD only marks 10 subclasses of mandatory signs, 23 subclasses of prohibitory signs, and 15 subclasses of danger signs to detect.
4. Experiments
4.1. Training
We used the model pre-trained on the ImageNet 1000-class competition dataset from YOLOv2 to train our detection networks. The pre-trained model could reduce the training time obviously. For the CCTSDB, the images were acquired from different devices so that the sizes of images were not unified, such as 1000 × 300, 1024 × 768, and 1280 × 720. In addition, some images were changed to 513 × 999 and 641 × 936 due to the scale transformation. Considering the fixed size of input demanded by the YOLO algorithm, we resized the different scales of images to uniform dimensions of 608 × 608.
In the loss function, the CCTSDB has three labeled classes, so C = 3. In our experiments, we set the number of bounding boxes k = 5, S = 19. Finally, we obtained the prediction of a 19 × 19 × 40 tensor. It is worth mentioning that the index of C classes should start from 0 to 2, otherwise the problem of NaN (Not a Number) will occur during the training.
In the process of training, the initial value of the learning rate was 0.0001. We observed the downward trend of loss and changed the learning rate to 0.001 if the loss was found to be stable at a value greater than 1. This could accelerate the speed of convergence. The training time was about 45 h on average. Our experiments were performed on a Linux PC with an Intel Core i7-6700K, CPU (4.0 GHz), 16 GB DDR3 and an NVIDIA GTX980Ti, 6 GB memory.
4.2. Experimental Analysis
4.2.1. Evaluations on CCTSDB
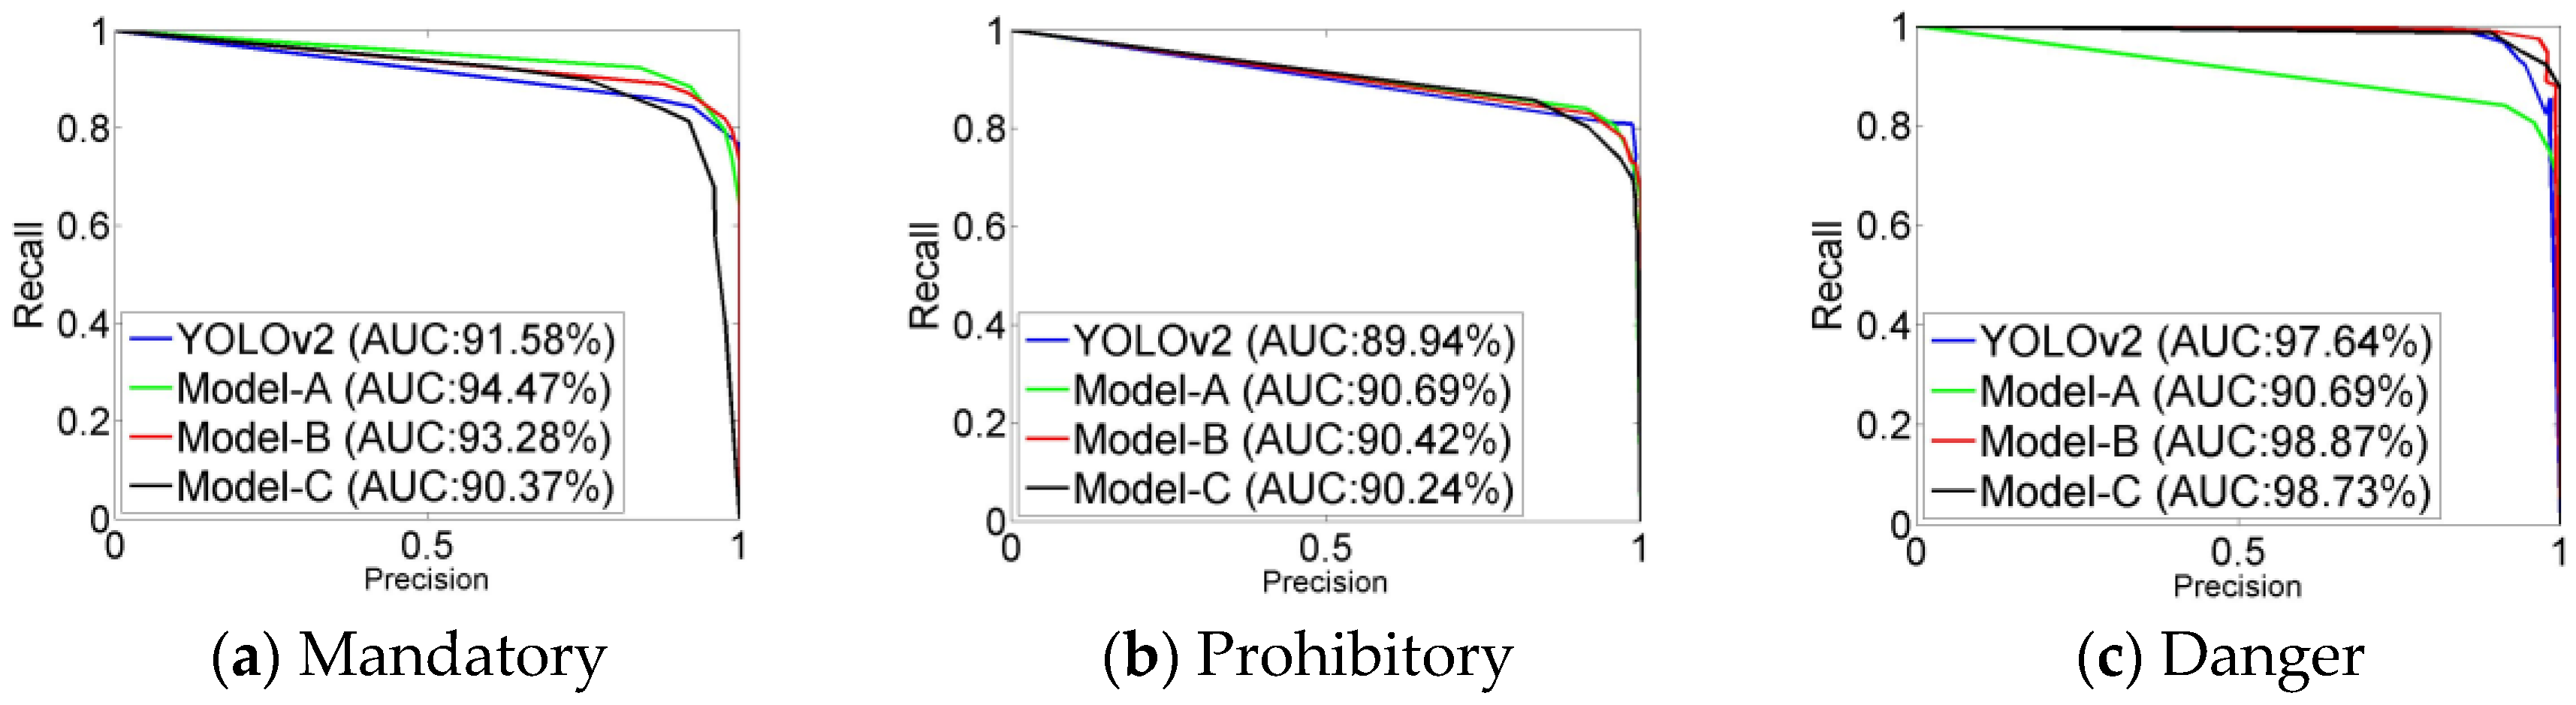
To analyze the test results, we set a threshold t, which is the class-specific confidence score. When the confidence scores of traffic signs were below the threshold t, we filtered those candidate regions of traffic signs. We set t = 0.5 to ensure the high precision of detection. Table 3 shows the rates of precision (P) and recall (R) of our presented three models (A, B, C) and YOLOv2 on CCTSDB. Figure 6 shows the precision-recall curves of the three super categories. The precision is the ratio of true positives to the sum of true positives and false positives. The recall is the ratio of true positives to the sum of true positives and false negatives. The time is the average running time of each image processed. The AUC is the area under the curve of precision and recall. In addition, the best experimental results in all tables are bold.
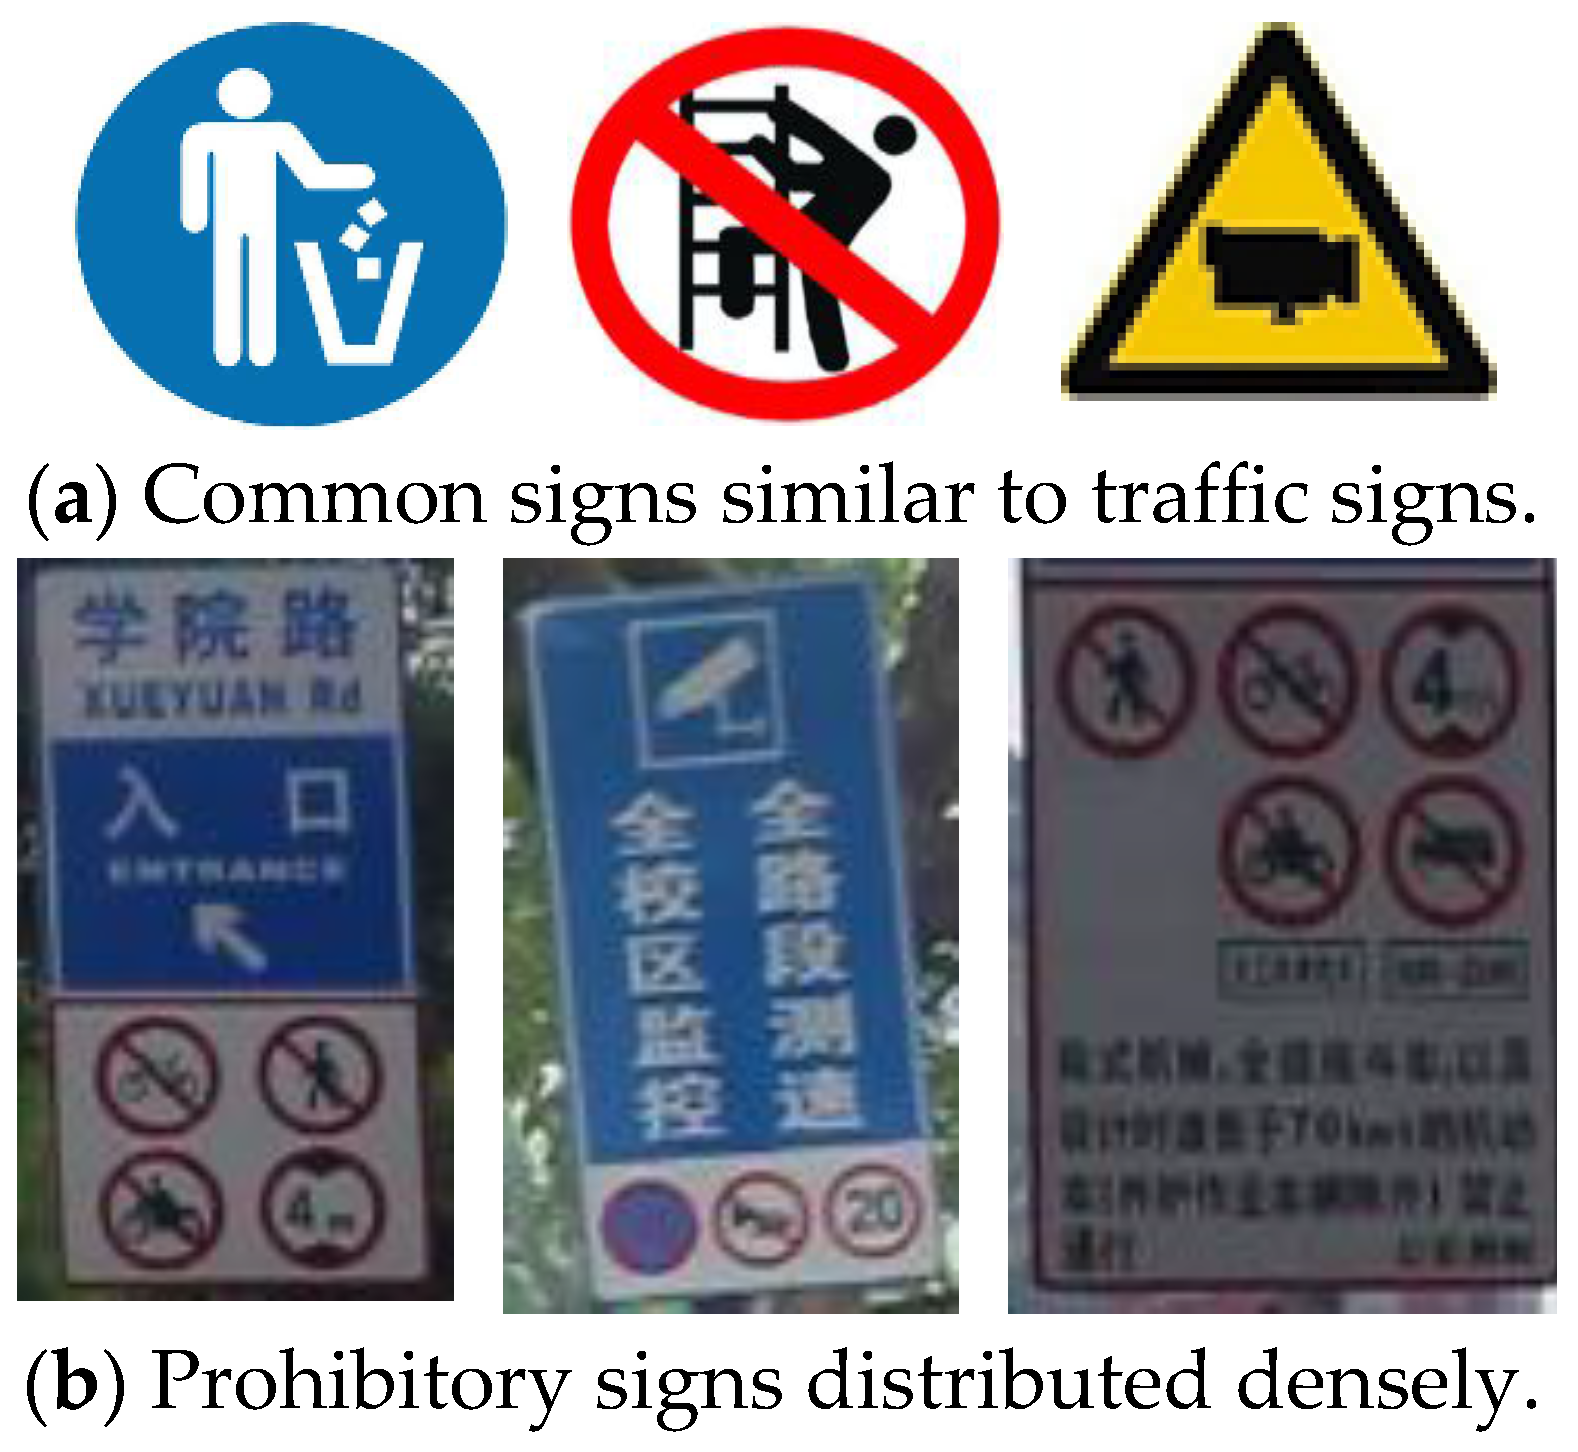
From Table 3, we can see that the improved models were faster than the YOLOv2. Overall, Model-B performed better than others. Model-B was fastest; only 0.02 s per image. When t = 0.5, the recall rates of prohibitory signs and danger signs predicted by Model-B were the best. The precision rates of the three categories signs predicted by Model-B were the second. The higher recall rates indicated that there were a few traffic signs missed. The higher precision rates indicated that there were a few negatives predicted as traffic signs. The values of AUC in Figure 6 show that Model-B was more robust than Model-A. The values of AUC for mandatory signs and prohibitory signs in Model-A were slightly higher than those in Model-B, but the value of AUC for danger signs was significantly lower than others. The experimental results indicated that the multiple 1 × 1 convolutional layers in the intermediate layers and fewer convolutional layers in the top layers could increase the detection rate and reduce the time consumption. In contrast to CTSD, our Model-B detected more subclasses of traffic signs that were not marked. This shows the better generalization ability of Model-B. Compared to mandatory signs and danger signs, the recall rates of prohibitory signs were lower. This is mainly because prohibitory signs are distributed densely and their sizes are too small in some situations. Figure 7 shows some examples that are difficult to identify in traffic scenes.
4.2.2. Evaluations on GTSDB
We also evaluated our Model-B on GTSDB and compared it with other methods. Table 4 illustrates the numerical values of precision and recall for our method. With the increasing threshold, the precision rate was higher and the recall rate was lower. When t = 0.4 or t = 0.5, the whole performance of Model-B was more efficient and robust.
Table 5 shows the comparison between Model-B and other methods. The other studied methods are based on CNNs. It should be stressed that results of other methods are referenced directly. From Table 5, it can be seen that Model-B was faster than other CNN-based methods, and the average running time was found to be the fastest at 0.017 s. The precision rate was the second highest, whether t = 0.4 or t = 0.5. The recall rate was inferior to other methods.
The AUC values for the three super categories of traffic sign and running times are shown in Table 6. The methods of References [6,9,11,12] are based on the traditional detection algorithms. As shown in Table 6, although our method was only better than the method in Reference [9], the running time proved to be fastest. It is worth mentioning that the method in Reference [11] performed best on prohibitory signs and the method in Reference [12] performed best on prohibitory signs and mandatory signs in the GTSDB competition hosted by IJCNN 2013. However, the methods based on CNNs have stronger robustness in complex traffic scenes and better generalization abilities for other subclasses. The GTSDB is mainly focused on the small size and illumination conditions, lacking other challenges. The strength of CNN-based methods is not fully shown. In addition, because the codes are undisclosed, the above methods could not be evaluated according to the CCTSDB, and thus we could not further analyze and compare their performance.
5. Conclusions
In this paper, we proposed a real-time Chinese traffic sign detection algorithm based on modified YOLOv2, and we also constructed the CCTSDB. We employed the end-to-end learning model to achieve the fast detection. Specifically, we used multiple 1 × 1 convolutional layers in the intermediate layers and fewer convolutional layers in the top layers to construct a single convolutional network. We also used a fine grid to divide the images, aiming to detect the small sizes of traffic signs. The results evaluated on CCTSDB and GTSDB demonstrated that our method was the fastest and more robust in real-world environments. For future work, we plan to improve the CCTSDB for further research. Moreover, we will incorporate more high resolution images and videos with the development of high definition devices. We plan to change the network structure appropriately to solve the problem of small traffic sign detection in high resolution images.
Acknowledgments
The research work was supported by National Natural Science Foundation of China (61402053), the Scientific Research Fund of Hunan Provincial Education Department (16A008), the Scientific Research Fund of Hunan Provincial Transportation Department (201446), the Postgraduate Scientific Research Innovation Fund of Hunan Province (CX2017B486), and the Postgraduate Course Construction Fund of Changsha University of Science and Technology (KC201611).
Author Contributions
Jianming Zhang and Manting Huang conceived and designed the algorithm; Manting Huang performed the experiments; Manting Huang and Xiaokang Jin analyzed the data; Xudong Li contributed experiment tools; Manting Huang wrote the paper. All authors have read and approved the final manuscript.
Conflicts of Interest
The authors declare no conflict of interest.
References
- Mogelmose, A.; Trivedi, M.M.; Moeslund, T.B. Vision-based traffic sign detection and analysis for intelligent driver assistance systems: Perspectives and survey. IEEE Trans. Intell. Transp. Syst. 2012, 13, 1484–1497. [Google Scholar] [CrossRef]
- Zhang, J.M.; Huang, Q.Q.; Wu, H.L.; Liu, Y.K. A shallow network with combined pooling for fast traffic sign recognition. Information 2017, 8, 45. [Google Scholar] [CrossRef]
- Wu, Y.; Liu, Y.; Li, J.; Liu, H.; Hu, X. Traffic sign detection based on convolutional neural networks. In Proceedings of the International Joint Conference on Neural Networks, Dallas, TX, USA, 4–9 August 2013. [Google Scholar]
- Redmon, J.; Divvala, S.; Girshick, R.; Farhadi, A. You only look once: Unified, real-Time object detection. In Proceedings of the IEEE Conference on Computer Vision and Pattern Recognition, Las Vegas, NV, USA, 27–30 June 2016; pp. 779–788. [Google Scholar]
- Stallkamp, J.; Schlipsing, M.; Salmen, J.; Schlipsing, M. The German traffic sign recognition benchmark: A multi-class classification competition. In Proceedings of the IEEE International Joint Conference on Neural Networks, San Jose, CA, USA, 31 July–5 August 2011; pp. 1453–1460. [Google Scholar]
- Yang, Y.; Luo, H.L.; Xu, H.R.; Wu, F.C. Towards real-time traffic sign detection and classification. IEEE Trans. Intell. Transp. Syst. 2016, 17, 2022–2031. [Google Scholar] [CrossRef]
- Redmon, J.; Farhadi, A. YOLO9000: Better, faster, stronger. arXiv 2016, arXiv:1612.08242. [Google Scholar]
- Wang, G.Y.; Ren, G.H.; Quan, T.F. A traffic sign detection method with high accuracy and efficiency. In Proceedings of the 2nd International Conference on Computer Science and Electronics Engineering (ICCSEE), Hangzhou, China, 22–23 March 2013; pp. 1426–1429. [Google Scholar]
- Yang, Y.; Wu, F.C. Real-time traffic sign detection via color probability model and integral channel features. In Proceedings of the 6th Chinese Conference on Pattern Recognition (CCPR), Changsha, China, 17–19 November 2014; pp. 545–554. [Google Scholar]
- Wang, G.Y.; Ren, G.H.; Wu, Z.L. A fast and robust ellipse-detection method based on sorted merging. Sci. World J. 2014. [Google Scholar] [CrossRef] [PubMed]
- Liang, M.; Yuan, M.; Hu, X. Traffic sign detection by ROI extraction and histogram features-based recognition. In Proceedings of the International Joint Conference on Neural Networks, Dallas, TX, USA, 4–9 August 2013. [Google Scholar]
- Wang, G.Y.; Ren, G.H.; Wu, Z.L.; Zhao, Y.Q.; Jiang, L.H. A robust, coarse-to-fine traffic sign detection method. In Proceedings of the 2013 International Joint Conference on Neural Networks, Dallas, TX, USA, 4–9 August 2013; pp. 754–758. [Google Scholar]
- Xiao, Z.T.; Yang, Z.J.; Geng, L. Traffic sign detection based on histograms of oriented gradients and boolean convolutional neural networks. In Proceedings of the International Conference on Machine Vision and Information Technology (CMVIT), Singapore, 17–19 February 2017; pp. 111–115. [Google Scholar]
- Mogelmose, A.; Liu, D.R.; Trivedi, M.M. Detection of U.S. traffic signs. IEEE Trans. Intell. Transp. Syst. 2015, 16, 3116–3125. [Google Scholar] [CrossRef]
- Girshick, R.; Donahue, J.; Darrell, T.; Malik, J. Rich feature hierarchies for accurate object detection and semantic segmentation. In Proceedings of the IEEE Conference on Computer Vision and Pattern Recognition, Columbus, OH, USA, 23–28 June 2014; pp. 580–587. [Google Scholar]
- He, K.M.; Zhang, X.Y.; Ren, S.Q.; Sun, J. Spatial pyramid pooling in deep convolutional networks for visual recognition. IEEE Trans. Pattern Anal. Mach. Intell. 2015, 37, 1904–1916. [Google Scholar] [CrossRef] [PubMed]
- Girshick, R. Fast R-CNN. In Proceedings of the IEEE International Conference on Computer Vision, Santiago, Chile, 11–18 December 2015; pp. 1440–1448. [Google Scholar]
- Ren, S.Q.; He, K.M.; Girshick, R.; Sun, J. Faster R-CNN: Towards real-time object detection with region proposal networks. IEEE Trans. Pattern Anal. Mach. Intell. 2017, 39, 1137–1149. [Google Scholar] [CrossRef] [PubMed]
- Liu, W.; Anguelov, D.; Erhan, D.; Szegedy, C. SSD: Single shot multibox detector. In Proceedings of the 14th European Conference on Computer Vision (ECCV), Amsterdam, The Netherlands, 11–14 October 2016; pp. 21–37. [Google Scholar]
- Chang, X.J.; Ma, Z.G.; Yang, Y.; Zeng, Z.Q. Bi-level semantic representation analysis for multimedia event detection. IEEE Trans. Cybern. 2017, 47, 1180–1197. [Google Scholar] [CrossRef] [PubMed]
- Chang, X.J.; Yu, Y.L.; Yang, Y. Semantic Pooling for Complex Event Analysis in Untrimmed Videos. IEEE Trans. Pattern Anal. Mach. Intell. 2017, 39, 1617–1632. [Google Scholar] [CrossRef] [PubMed]
- Chang, X.J.; Yang, Y. Semi-supervised feature analysis by mining correlations among multiple tasks. IEEE Trans. Neural Netw. Learn. Syst. 2017, 28, 2294–2305. [Google Scholar] [CrossRef] [PubMed]
- Hamed, H.A.; Elnaz, J.H.; Domenec, P. A practical approach for detection and classification of traffic signs using Convolutional Neural Networks. Robot. Autom. Syst. 2016, 84, 97–112. [Google Scholar] [CrossRef]
- Qian, R.Q.; Zhang, B.L.; Yue, Y. Robust Chinese traffic sign detection and recognition with deep convolutional neural network. In Proceedings of 11th International Conference on Natural Computation, Zhangjiajie, China, 15–17 August 2015; pp. 791–796. [Google Scholar]
- Zhu, Z.; Huang, X.L.; Liang, D. Traffic-Sign detection and classification in the wild. In Proceedings of the IEEE Conference on Computer Vision and Pattern Recognition, Las Vegas, NV, USA, 27–30 June 2016; pp. 2110–2118. [Google Scholar]
- Xiong, C.Z.; Wang, C.; Ma, W.X.; Shan, Y.M. A traffic sign detection algorithm based on deep convolutional neural network. In Proceedings of the IEEE International Conference on Signal and Image Processing, Beijing, China, 13–15 August 2016; pp. 676–679. [Google Scholar]
- Zeiler, M.D.; Fergus, R. Visualizing and understanding convolutional networks. In Proceedings of the 13th European Conference on Computer Vision (ECCV), Zurich, Switzerland, 6–12 September 2014; pp. 818–833. [Google Scholar]
- Lecun, Y.; Bottou, L.; Bengio, Y.; Haffner, P. Gradient-based learning applied to document recognition. Proc. IEEE 1998, 86, 2278–2324. [Google Scholar] [CrossRef]
- Krizhevsky, A.; Sutskever, I.; Hinton, G.E. ImageNet classification with deep convolutional neural networks. Commun. ACM 2017, 60, 84–90. [Google Scholar] [CrossRef]
- Simonyan, K.; Zisserman, A. Very deep convolutional networks for large-scale image recognition. arXiv 2015, arXiv:1409.1556. [Google Scholar]
- Szegedy, C.; Liu, W.; Jia, Y.Q. Going deeper with convolutions. In Proceedings of the IEEE Conference on Computer Vision and Pattern Recognition, Boston, MA, USA, 7–12 June 2015. [Google Scholar]
- He, K.M.; Zhang, X.Y.; Ren, S.Q.; Sun, J. Deep residual learning for image recognition. In Proceedings of the IEEE Conference on Computer Vision and Pattern Recognition, Las Vegas, NV, USA, 27–30 June 2016; pp. 770–778. [Google Scholar]
- Lin, M.; Chen, Q.; Yan, S.C. Network in network. arXiv 2013, arXiv:1312.4400. [Google Scholar]
Figure 1.
Problems of traffic sign detection.

Figure 2.
Samples of the three super categories in Germany.

Figure 3.
Samples of the three super categories in China.
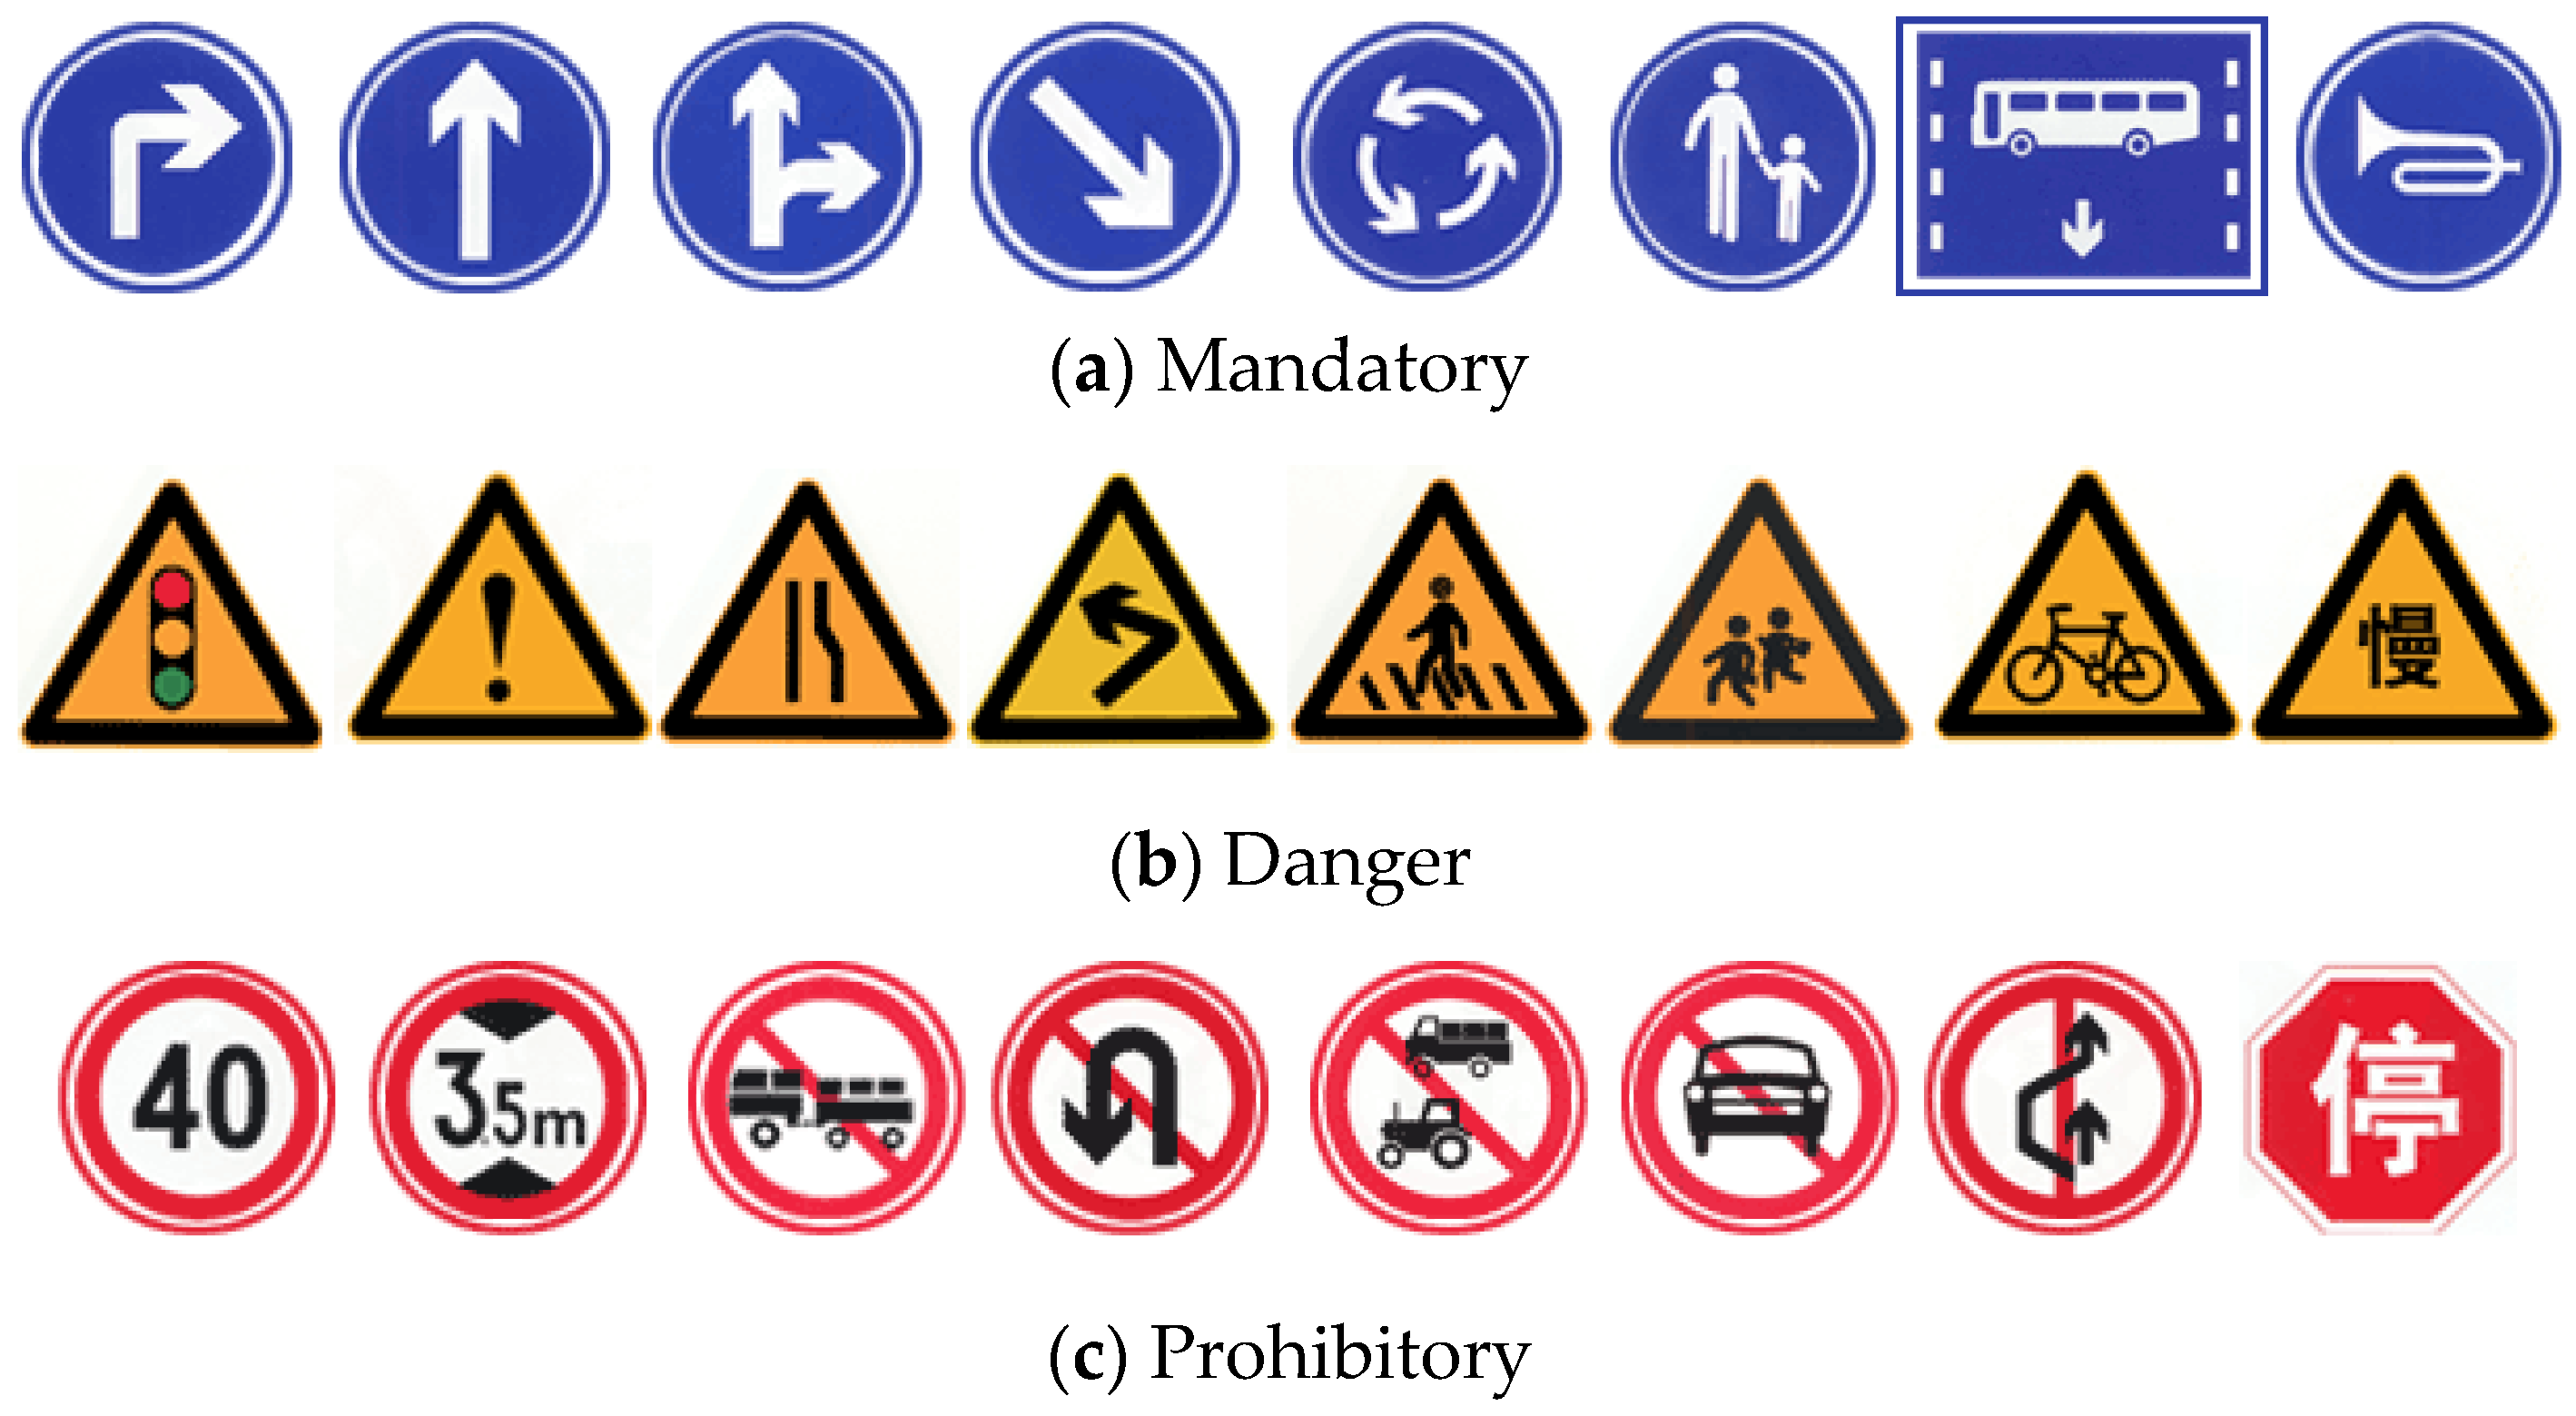
Figure 4.
The Chinese traffic sign detection algorithm.
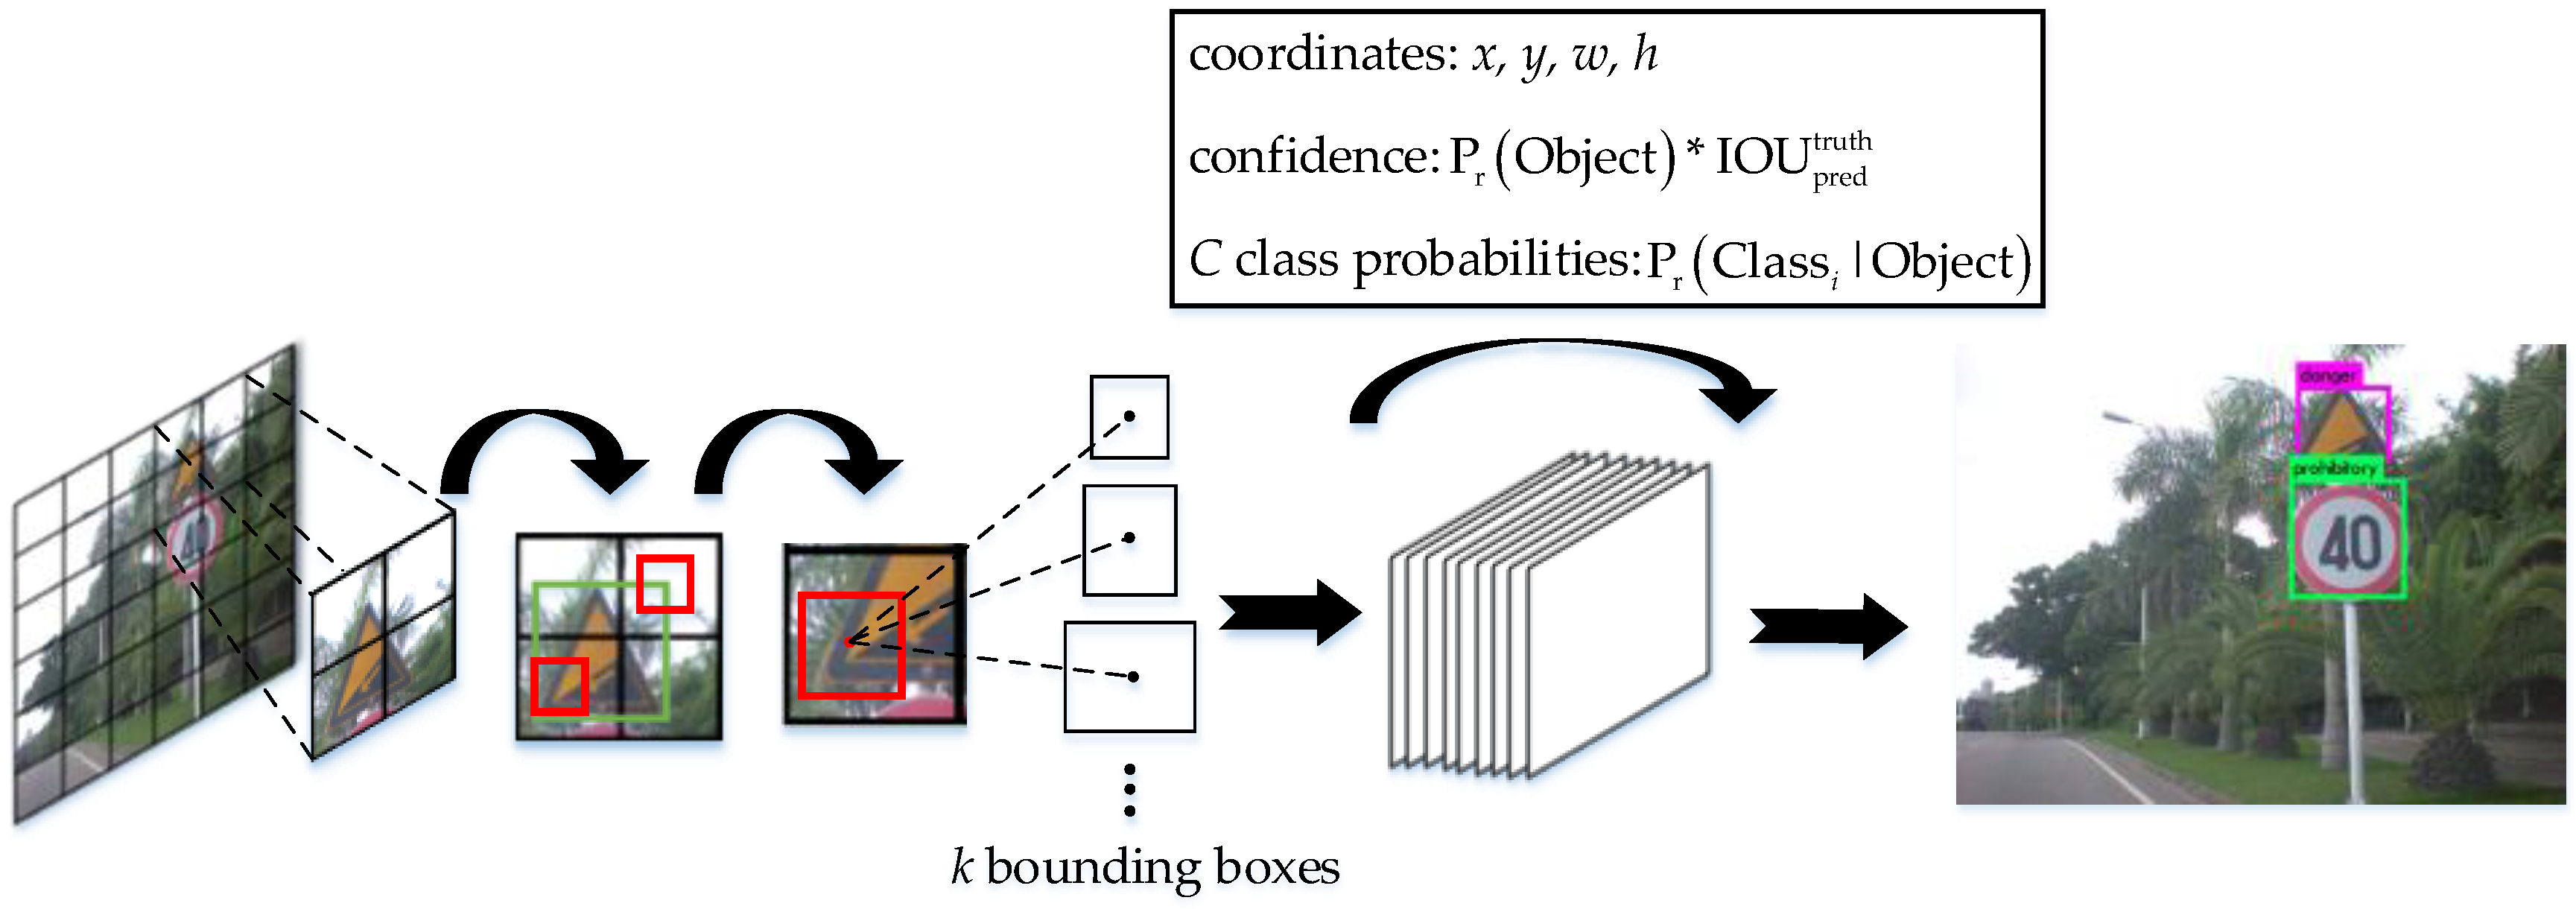
Figure 5.
Some samples in the VOC and CCTSDB.

Figure 6.
The precision-recall curves of the three super categories.

Figure 7.
Examples that are difficult to identify.


Table 1.
ConvNet configurations.
| YOLO | YOLOv2 | Model-A | Model-B | Model-C | |
|---|---|---|---|---|---|
| Bottom | Conv7/2-64 | Conv3-32 | Conv3-32 | Conv3-32 | Conv3-32 |
| Maxpool/2 | Maxpool/2 | Maxpool/2 | Maxpool/2 | Maxpool/2 | |
| Conv3-192 | Conv3-64 | Conv3-64 | Conv3-64 | Conv3-64 | |
| Maxpool/2 | Maxpool/2 | Maxpool/2 | Conv1-32 | Conv1-32 | |
| Conv1-128 | Conv3-128 | Conv3-128 | Maxpool/2 | Maxpool/2 | |
| Conv3-256 | Conv1-64 | Conv1-64 | Conv3-64 | Conv3-64 | |
| Conv1-256 | Conv3-128 | Conv3-128 | Conv1-32 | Conv1-32 | |
| Conv3-512 | Maxpool/2 | Maxpool/2 | Conv1-32 | Conv1-32 | |
| Maxpool/2 | Conv3-256 | Conv3-256 | Conv3-64 | Conv3-64 | |
| Conv1-256 | Conv1-128 | Conv1-128 | Maxpool/2 | Maxpool/2 | |
| Conv3-512 | Conv3-256 | Conv3-256 | Conv3-128 | Conv3-128 | |
| Conv1-256 | Maxpool/2 | Maxpool/2 | Conv1-64 | Conv1-64 | |
| Conv3-512 | Conv3-512 | Conv3-512 | Conv1-64 | Conv1-64 | |
| Conv1-256 | Conv1-256 | Conv1-256 | Conv3-128 | Conv3-128 | |
| Conv3-512 | Conv3-512 | Conv3-512 | Maxpool/2 | Maxpool/2 | |
| Conv1-256 | Conv1-256 | Conv1-256 | Conv3-256 | Conv3-256 | |
| Conv3-512 | Conv3-512 | Conv3-512 | Conv1-128 | Conv1-128 | |
| Conv1-512 | Maxpool/2 | Maxpool/2 | Conv1-128 | Conv1-128 | |
| Conv3-1024 | Conv3-1024 | Conv3-1024 | Conv3-256 | Conv3-256 | |
| Maxpool/2 | Conv1-512 | Conv1-512 | Maxpool/2 | Maxpool/2 | |
| Conv1-512 | Conv3-1024 | Conv3-1024 | Conv3-512 | Conv3-512 | |
| Conv3-1024 | Conv1-512 | Conv1-512 | Conv1-256 | Conv1-512 | |
| Conv1-512 | Conv3-1024 | Conv3-1024 | Route | Route | |
| Conv3-1024 | Conv3-1024 | Route | Conv3(256) | Conv3(128) | |
| Conv3-1024 | Conv3-1024 | Conv3(512) | Conv1-64 | Conv1-64 | |
| Conv3/2-1024 | Route | Conv1-64 | Reorg/Route | Route | |
| Conv3-1024 | Conv1(64) | Reorg/Route | Conv3-512 | Conv3(256) | |
| Conv3-1024 | Reorg/Route | Conv3-1024 | Conv1-40 | Conv1-64 | |
| Local | Conv3-1024 | Conv1-40 | Detection | Reorg | |
| Dropout | Conv1 | Detection | Conv1(512) | ||
| Conn | Detection | Reorg/Route | |||
| Detection | Conv3-1024 | ||||
| Conv1-40 | |||||
| Top | Detection |
Table 2.
The differences between city roads and highways.
| City Road | Highway |
|---|---|
| Varieties of traffic signs | Mainly focus on the prohibitory signs and danger signs |
| Influenced by trees and advertising signs easily | Hard to shelter due to the wide view |
| Color deterioration and distortion because of long-term usage | Bright color and good protection |
| Distributed densely, main focus on the intersection | Distributed sparsely |
| Complex background | Plain background |
| Slow vehicle speed for acquiring data | Fast vehicle speed for acquiring data |
Table 3.
The results of improved models in the CCTSDB (t = 0.5).
| Mandatory | Prohibitory | Danger | Time (s) | ||
|---|---|---|---|---|---|
| YOLOv2 | P | 100% | 98.88% | 95.92% | 0.04 |
| R | 76.56% | 70.48% | 92.16% | ||
| Model-A | P | 98.73% | 99.61% | 99.26% | 0.0325 |
| R | 74.16% | 68.62% | 88.82% | ||
| Model-B | P | 98.81% | 99.27% | 98.63% | 0.02 |
| R | 79.43% | 72.74% | 94.74% | ||
| Model-C | P | 91.89% | 98.86% | 98.59% | 0.025 |
| R | 81.34% | 69.41% | 92.11% |
Table 4.
The numerical values of precision and recall.
| Threshold (t) | 0.1 | 0.2 | 0.4 | 0.5 | 0.6 | 0.65 | 0.7 |
|---|---|---|---|---|---|---|---|
| Precision | 0.7544 | 0.8729 | 0.9531 | 0.9669 | 0.9779 | 0.9950 | 1 |
| Recall | 0.9556 | 0.9407 | 0.9037 | 0.8667 | 0.8222 | 0.7407 | 0.6185 |
© 2017 by the authors. Licensee MDPI, Basel, Switzerland. This article is an open access article distributed under the terms and conditions of the Creative Commons Attribution (CC BY) license (http://creativecommons.org/licenses/by/4.0/).
Share and Cite
MDPI and ACS Style
Zhang, J.; Huang, M.; Jin, X.; Li, X. A Real-Time Chinese Traffic Sign Detection Algorithm Based on Modified YOLOv2. Algorithms 2017, 10, 127. https://doi.org/10.3390/a10040127
AMA Style
Zhang J, Huang M, Jin X, Li X. A Real-Time Chinese Traffic Sign Detection Algorithm Based on Modified YOLOv2. Algorithms. 2017; 10(4):127. https://doi.org/10.3390/a10040127
Chicago/Turabian StyleZhang, Jianming, Manting Huang, Xiaokang Jin, and Xudong Li. 2017. "A Real-Time Chinese Traffic Sign Detection Algorithm Based on Modified YOLOv2" Algorithms 10, no. 4: 127. https://doi.org/10.3390/a10040127
Note that from the first issue of 2016, this journal uses article numbers instead of page numbers. See further details here.