Utility Distribution Strategy of the Task Agents in Coalition Skill Games


School of Computers and Information, Hefei University of Technology, Hefei 230009, China
*
Author to whom correspondence should be addressed.
Algorithms 2018, 11(5), 64; https://doi.org/10.3390/a11050064
Submission received: 27 March 2018
/
Revised: 24 April 2018
/
Accepted: 2 May 2018
/
Published: 5 May 2018
Abstract
:This paper focuses on the rational distribution of task utilities in coalition skill games, which is a restricted form of coalition game, where each service agent has a set of skills and each task agent needs a set of skills in order to be completed. These two types of agents are assumed to be self-interested. Given the task selection strategy of service agents, the utility distribution strategies of task agents play an important role in improving their individual revenues and system total revenue. The problem that needs to be resolved is how to design the task selection strategies of the service agents and the utility distribution strategies of the task agents to make the self-interested decisions improve the system whole performance. However, to the best of our knowledge, this problem has been the topic of very few studies and has not been properly addressed. To address this problem, a task allocation algorithm for self-interested agents in a coalition skill game is proposed, it distributes the utilities of tasks to the needed skills according to the powers of the service agents that possess the corresponding skills. The final simulation results verify the effectiveness of the algorithm.
1. Introduction
The coalition skill game is a typical model of task allocation problem for self-interested agents, the studies on which may help provide new thoughts for solving other cooperation problems of self-interested agents. Coalitional skill games were first proposed by Bachrach et al. [1,2]. As a restricted form of coalition generating problem, a coalitional skill game model includes three sets: service agent set, skill set, and task agent set. Each service agent and each task agent have their respective skill set, which will ensure that a task can be accomplished by some service agents. Each task agent has a utility value. If a set of service agents cover the skills needed by one task agent, we say that the task can be completed. Given an allocation of task agents to service agents, the system revenue is defined as the sum of the utilities of those task agents that can be completed.
It is unnatural, perhaps, that task agents are assumed to be self-interested. The coalition skill game can be viewed as an agency recruiting market, where the service agent represents an applicant, each applicant has different skills, and the task agent represents the company that intends to recruit employees. Each company needs some employees to provide the skills they need. Only when all the needed skills are provided can the company operate and make profit. The company distributes its utility to the needed skills, and the expected wage of an applicant is the utility share of the skill it provides. Applicants are self-interested and will choose the companies that will bring them the greatest benefits. The companies are also self-interested, with the goal of recruiting all the employees needed to make the company operate and get benefits.
In this paper, the following question for coalition skill games is considered: Given the task selection strategies of self-interested service agents, how do the task agents distribute their utilities to the service agents so that it can get all the skills they needed? A simple example is given in Figure 1 to illustrate the influences of the utility distribution strategies on the individual revenues and the system total revenue. In Figure 1, the line between ri ∈ {r1, r2} and sj ∈ {s1, s2} indicates that the service agent ri possesses skill sj. The line between sj ∈ {s1, s2} and tk ∈ {t1, t2, t3} indicates that the task agent tk needs skill sj. Numbers next to task agents indicate their utilities.
For task agents t1 and t3, because they only need one skill, there is no need for them to adjust their utility distribution schemes. For task agent t2, if its utility is distributed averagely, the shares of s1 and s2 are both 4. The resulted payoff matrix is shown in Table 1 whose Nash equilibrium is (2, 5) (underlined in Table 1). This means that no matter which tasks are selected by r1 and r2 on initialization, the end results are: r1 selects t1 and receives individual revenue 2, r2 selects t3 and receives individual revenue 5, the system total revenue is 7. However, in the ideal case, both r1 and r2 should select t2, and system total revenue is 8. Because of the unreasonable distribution of u2, the self-interested service agents are not willing to cooperate to complete t2. Therefore, for the task allocation problem of the self-interested agent coalition skill game, the utility distribution strategies of task agents affect the individual revenues and the system total revenue to a certain extent. Based on this point, this paper studies the utility distribution strategies of the task agents. An algorithm, the Task Allocation Algorithm, which is based on the Utility Distribution Adjustment (TAAUDA), is proposed to allocate tasks to service agents. The final simulation results verified the effectiveness of TAAUDA.
The remainder of this paper is structured as follows. Section 2 introduces some related works on the task allocation for self-interested agent coalition skill game. Section 3 gives a formal definition of the problem model. Section 4 describes the basic thoughts of TAAUDA, and analyzes its convergence and time complexity. The simulation results in Section 5 show that our proposed algorithm can allocate tasks to self-interested service agents effectively. Finally, the conclusion of our work is presented in Section 6.
2. Related Work
An important problem of the coalitional skill games studied in the available literature is the optimal coalition structure generating problem, the time complexity of which is given in [3], and it is proved that in general, coalitional skill games, as well as in very restricted versions, computing the optimal coalition structure is hard. At the same time, an algorithm to compute the optimal coalition structure is given in [3], and it was proved to have polynomial time complexity if the number of tasks and the tree-width of the corresponding hyper graph are both bounded within a constant, but this restrictive condition is very strict. At the same time, the problem model studied in [3] belongs to characteristic function games [4], in which the coalition value of each possible agent coalition is given in advance, but it is not given in the problem model studied in this paper; other similar models include the Resource Model and Service Model [5,6]. The key difference between the resource model and coalition skill games is that the resources in the resource model are transferable, but the skills owned by the service agents in coalitional skill games are not. The difference between the coalitional skill game and service model is that the former assumes that the service agents can use more than one skill when they are performing tasks, but only one service can be provided in service model. Another important difference between the three models is that the service agents and task agents considered in this paper are self-interested.
As for the task allocation for self-interested agents, [7] proposed an algorithm based on game theory negotiation for multiple robots task allocation, which assumed that all the robots are self-interested and always select the tasks which can maximize their own individual revenues and each task need only one robot. It means that the problem solved in [7] belongs to the task allocation problem of single-agent tasks [8], but the task agents in this paper belongs to multi-agent tasks. Game theory is a powerful tool to study the strategy selection problems of self-interested agents. Game theory based learning algorithms include Best Response, Fictitious Play, sampled Fictitious Play, and Computationally Efficient Sampled Fictitious Play (CESFP) [9].
When the self-interested agents cannot communicate with each other, they only have their own historic actions and the corresponding individual revenues, the algorithms proposed in [10] can be used to allocate the task agents to the service agents in identical interest games and weakly acyclic games [10,11]. In this paper, it is assumed that the task agent selected by each service agent and the utility distribution scheme are known to all service and task agents, but all the historic information is not known.
The problem of coalition formation in task oriented domains was researched in [12], where the self-interested agent has a set of resources and wants to perform a set of tasks, and the completion of each task requires a set of corresponding resources. The differences between the problems in [12] and this paper are that (1) the former belongs to the resource model, but the latter belongs to the serve model; (2) the goal of the service agent in [12] is to perform a set of interested tasks, but the goal of the service agent in this paper is to get maximal individual revenue. The resource consumers and providers are also considered self-interested in [13]. Where the subtasks in the proposed problem model can be seen as skills, however, the tasks do not have utilities; utilities correspond to the skills of the service agents, which sometimes is inconsistent with the actual application.
The task selection strategy, based on market economy or auction, can also be used as the task selection strategy of self-interested agents in coalition skill games [14,15,16]. In [14], robots negotiate their respective assignments in order to optimize task distribution according to their own utility function. It is assumed that robots may execute different type of tasks, and that they have the goal of maximizing the number of tasks to be executed according to the resources they have. But in our scenario, the goals of service agents and task agents are to maximize their own individual revenues. In the auction-based task allocation method of a coalition skill game, the task agent can be seen as the auction commodity, and the self-interested service agent is regarded as the buyer. Of course, the skills of the service agent can also be seen as auction commodities, and the task agent who needs the skills is seen as the buyer. Combinatorial auction theory was used to solve the multi-robot coalition formation problem [17], this method can effectively allocate tasks to self-interested robots, but in which the individual revenues were not considered, which partly reflects the powers of robots in the system.
Two different computational intelligence algorithms are proposed in [18] to solve the coalition structure generation problem of coalition skill game, namely the binary particle swarm optimization and binary differential evolution. The difference between the problem models in [19] and this paper is that the former belongs to the characteristic function game, and the later belongs to the partition function game [4]. In the characteristic function coalition skill games, the worth of any service agent coalition can be represented using a single, real number, and the value is only determined by the identities of the service agents in the coalition. However, in partition function coalition skill games, the value of a service agent coalition depends not only on the identities of its members, but also on the identities of non-members and the tasks selected by the coalition. Many computational questions surrounding characteristic function coalition skill games have been studied [1,2,3,4,18,19,20]. However, as far as we know, there are few studies about partition function coalition skill games.
3. Definition of the Problem Model
The formal definition of the problem model, the multiple self-interested agent coalition skill game, is given in Definition 1.
Definition 1.
A multiple self-interested agent coalition skill game includes three sets: service agent set R: = {r1, r2, ··, rn}, skill set S: = {s1, s2,···, sl} and task agent set T: = {t1, t2,···, tm}, where n = |R|, l = |S|, and m = |T|, |*| denotes the cardinality of the set *. For i ∈ {1, 2,···, n}, j ∈ {1, 2,···, l}, RSi,j = 1 (RSi,j = 0) indicates service agent ri possesses (does not possess) skill sj. For j ∈ {1, 2,···, l}, k ∈ {1, 2,···, m}, STj,k = 1 (STj,k = 0) indicates task agent tk needs (does not need) skill sj. Utilities of all task agents are denoted by a vector of U: = {u1,u2,···,um}.
Utility distribution schemes of all the task agents are denoted with TS. For k ∈ {1, 2,···, m}, j ∈ {1, 2,···, l}, TSk,j(τ) denotes the share distributed to sj by tk at time τ, if STj,k = 0, TSk,j(τ) = −1. RTSi,0(τ) denotes the serial number of the task agent selected by ri ∈ R at time τ. If ri ∈ R does not select any task agent, RTSi,0(τ) = 0. For I ∈ {1, 2,···, n} and j ∈ {1, 2,···, l}, RTSi,j(τ) = 1 (RTSi,j(τ) = 0) denotes ri provides (does not provide) the selected task agent with skill sj at time τ. If RTSi,0(τ) = 0, for j∈{1, 2,···, l}, RTSi,j(τ) = 0. RTS(τ) denotes the allocation of task agents to service agents at time τ.
Task agent tk can be completed if all needed skills are provided. Given RTS(τ), the system revenue is defined as the sum of the utilities of the tasks that can be completed. The optimal task allocation to a multiple self-interested agent coalition skill game is an allocation of task agents to service agents which maximizes its system revenue.
In this paper, it is assumed that: (1) each service agent is allowed to select at most one task at any time, but it can use multiple skills when performing a task. (2) A service agent is willing to abandon the currently selected task and select a new task only if the new one can bring it a higher individual revenue.
The states of service agents and task agents are defined in Definitions 2 and 3 respectively.
Definition 2.
(State of service agent) The state of service agent ri ∈ R at time τ is denoted by ri(τ): = <RSi,, RTSi,·(τ)>, where RSi,· is the ith row of RS and RTSi,·(τ): = {RTSi,0(τ), RTSi,1(τ),···, RTSi,l(τ)}.
Definition 3.
(State of task agent): The state of tk ∈ T at time τ is denoted by tk(τ): = <ST·,k, TSNk, uk, TSk,·(τ)>, where ST·,k is the kth column of ST. TSNk ∈ Z+ denotes the number of skills needed by tk (It is assumed that at most one unit of each skill is needed). uk corresponds to the utility of tk representing the value that completing the task is worth. TSk,·(τ) is the kth row of TS(τ).
4. The Task Selection Strategies of Service Agents and the Utility Distribution Strategies of Task Agents
Section 4.1 describes the task selection strategies of the service agents. Section 4.2 describes the utility distribution strategies of the task agents. The whole frame of TAAUDA is given in Section 4.3, and its convergence and time complexity are also demonstrated. In Section 4.4, the example given in Section 1 is used to further illustrate the basic thoughts of TAAUDA.
4.1. Task Selection Strategy of Service Agent
To facilitate the description of the algorithm, some notations are given first:
- (1)
- HiR(τ) = 1 indicates that ri is still in the system and waiting to select a task at time τ. HiR(τ) = 0 indicates that ri is deleted from the system at time τ. HkT(τ) = 1 (HkT(τ) = 0) indicates that tk is still (is not) in the system.
- (2)
- P(i,k,τ) denotes the set of skills that can be provided to tk by ri at time τ, that is:P(i,k,τ): = {sj ∈ S|RSi,j = 1˄STj,k = 1˄¬∃ri’∈R/{ri}(RTSi’,0(τ) = k˄RTSi’,j(τ) = 1)}
- (3)
- complete(i,k,τ) = 1 (complete(i,k,τ) = 0) indicates that tk can (cannot) be completed if ri selects tk at time τ.
- (4)
- Ni(τ) denotes the set of task agents which need the skills possessed by ri ∈ R at time τ:Ni(τ): = {tk ∈ T|HkT(τ) = 1˄P(i,k,τ) ≠ Φ}
- (5)
- Ci(τ): = {tk∈T|HkT(τ) = 1˄complete(i,k,τ) = 1}.
- (6)
- f(i,k,τ) denotes the share of utility ri ∈ R can get if it selected tk ∈ T at time τ without considering whether it can be completed or not:
It is assumed that f(i,0,τ) = 0, which means that the individual revenue of ri is 0 if it does not select any task at time τ.
- (7)
- R1(k,j,τ): = {ri ∈ R|HiR(τ) = 1˄RSi,j = 1˄STj,k = 1˄RTSi,0(τ) = k˄RTSi,j(τ) = 1}.
- (8)
- R2(k,j,τ): = {ri ∈ R|HiR(τ) = 1˄RSi,j = 1˄STj,k = 1˄RTSi,0(τ) ≠ k˄f(i,k,τ) > f(i,RTSi,0(τ),τ)}.
- (9)
- R3(k,j,τ): = {ri ∈ R|HiR(τ) = 1˄RSi,j = 1˄complete(i,k,τ) = 1˄j ∈ P(i,k,τ)}.
- (10)
- R4(k,j,τ): = {ri ∈ R|HiR(τ) = 1˄RSi,j = 1}.
- (11)
- T1(j,τ): = {tk ∈ T|HkT(τ) = 1˄STj,k = 1˄R1(k,j,τ)∪R2(k,j,τ) = Φ}.
Sub-procedure 1 describes the task selection strategy of service agent ri ∈ R at time τ. The output is t(i,τ + 1), which denotes ri’s next-step selection.
| Sub-Procedure 1 Task selection strategy of service agent ri ∈ R |
| 1: IF Ni(τ)∩Ci(τ)≠Φ THEN 2: ; 3: ELSE IF Ni(τ)≠Φ˄Ci(τ) = Φ THEN 4: ; 5: ELSE 6: t(i,τ+1)←0; 7: END IF |
4.2. Utility Distribution Strategy of Task Agent
As for the utility distribution scheme of task agent tk ∈ T, it is assumed that , and if STj,k = 1, TSk,j(τ) ≥ 0. At initialization, the utility of the task agent is averagely distributed among the required skills, and then the task agent adjusts its utility distribution scheme according to the inadequacy degree of the skills. If the task agent only needs one skill, the adjustment is not needed. To understand how tk ∈ T adjusts its utility distribution scheme, it is only need to answer the following 4 questions:
- (1)
- Among the skills needed by tk ∈ T, whose share of utility needs to be increased? Let Skneed(τ) denote the set of skills of this type:sj ∈ Skneed(τ) must satisfy the following three conditions: (1) STj,k = 1, (2) R1(k,j,τ) = Φ and (3) R2(k,j,τ) = Φ.
- (2)
- For sj ∈ Skneed(τ), what is the minimum increase? It is denoted with fmin(k,j,τ), whose computing method is given in Sub-procedure 2, where , if , otherwise ).
Sub-Procedure 2 Compute the value of fmin(k,j,τ) 1: IF R3(k,j,τ)≠Φ THEN
2: ;
3: ELSE IF R4(k,j,τ)≠Φ THEN
4: ;
5: ELSE
8: fmin(k,j,τ)←-1;
9: END IF - (3)
- From which skills can tk adjust shares of utility to sj ∈ Skneed(τ)? Let Slend(k,j,τ) denote the set of skills of this type:Slend(k,j,τ) ← {sj’ ∈ S|j’ ≠ j˄STj’,k = 1˄(R1(k,j,τ)∪R2(k,j,τ)) ≠ Φ}.
- (4)
- For sj’ ∈ Slend(k,j,τ), what is the maximum decrease? It is denoted with fmax(k,j,j’), whose computing method is shown in Sub-procedure 3. Where ksec denotes the serial number of the task agents which will be selected by ri if tk was out of consideration. The method to compute the values of ξ1 and ξ2 is: if , ξ1 ← 1, otherwise, ξ1 ← 0. If , ξ2 ← 1, otherwise, ξ2 ← 0. If , , .
Sub-Procedure 3 Compute the value of fmax(k,j,j’) 1: IF R1(k,j,τ)≠Φ˄R2(k,j,τ)≠Φ THEN
2: ;
3: ELSE IF R1(k,j’,τ)≠Φ THEN
4: ;
5: ELSE IF R2(k,j’,τ)≠Φ THEN
6: ;
7: ELSE
8: fmax(k,j,j’)←0;
9: END IF
10: fmax(k,j,j’)←min(fmax(k,j,j’),TSk,j’(τ)).
4.3. The Whole Frame of TAAUDA
The whole frame of TAAUDA is shown in Algorithm 1, where DRS denotes the maximum number of times the order of service agent selecting task is changed, DN denotes the maximum number of times the task selection state is disturbed, and IN denotes the maximum number of times the task agent adjusts the utility distribution scheme.
| Algorithm 1 TAAUDA |
| Inputs: RS, ST, U, DRS, DN, IN; Outputs: the maximal system total revenue and the corresponding RTS. 1: FORdrs∈{1,2,···,DRS} 2: Disturb the order in which the service agents select the most satisfied task agents; 3: Initialize TS(0): the utilities of task agents are distributed averagely.
4: FORdn∈{1,2,···,DN} 5: oldRTS←RTS(τ); 6: WHILE ∃tk∈T(HkT(τ) = 1) 7: in←0; 8: WHILE TS(τ)≠oldTS˄in<IN 9: in++; 10: oldTS←TS(τ); 11: FOR tk∈{tk’∈T|Hk’T(τ) = 1} 12: FOR sj ∈Skneed(τ) 13: Increase TSk,j(τ) through decreasing TSk,j’(τ)(sj’ ∈Slend(k,j,τ)). If the minimum increase fmin(k,j,τ) is reached, success←true, otherwise, success←false; 14: WHILE success 15: For tk’∈T1(j,τ), increase TSk’,j(τ)(sj ∈Sk’need(τ)) through decreasing TSk’,j’(τ)(sj’ ∈Slend(k’,j,τ)). If the minimum increase fmin(k’,j,τ) is satisfied, success←true, otherwise, success←false. 16: END WHILE 17: END FOR 18: END FOR 19: END WHILE 20: Delete the task agents who have all the needed skills and their corresponding service agents. 21: Delete the task agents that cannot be completed. 22: If there is not any task agent is deleted in line 20 and 21, delete . A set of service agents needed by td are chosen with a Greedy Strategy and deleted. 23: END WHILE 24: ri∈{ri’∈R|Hi’R(τ) = 1} selects task agent tei according to oldRTS, where . 25: Record the maximum system total revenue and its corresponding RTS. Disturbing oldRTS: each service agent randomly selects a task that requires its skills. 26: END FOR 27: END FOR |
The following texts explain why lines 14–16 of TAAUDA will end in finite steps. The minimum adjusting step size is assumed to be 1. If T1 (j,τ) ≠ Φ, for any task agent tk’ ∈ T1(j,τ), the value of TSk’,j(τ) is increasing, and is a strictly monotone increasing function, whose upper bound is . So lines 14–16 of TAAUDA will end in finite steps.
If the minimum adjusting step size is ±1, the time complexity of TAAUDA is O(n2m3l3). TAAUDA is polynomial, inexact algorithm.
4.4. Further Analyses of the Example in Section 1
Considering the example from Section 1, t2 distributes its utility to s1 and s2 averagely at the initializing time. r2 will select t3 and r1 will select t1. The system total revenue is 7. t2 needs to adjust its utility distribution scheme: (1) Among the skills needed by t2, because R2(2,1,τ) = {r1} is not empty, there is no need to increase the value of TS2,1(τ). For s2, because R1(2,2,τ) = Φ and R2(2,2,τ) = Φ, it is needed to increase the value of TS2,2(τ). (2) What is the minimum increase for s2? Because R3(2,2,τ) = Φ, R4(2,2) = {r2}, RTS2,0(τ) = 3, and u3 < u2, fmin(2,2) = f(i,3,τ) − f(i,2,τ) = 5 − 4 = 1. (3) Compute Slend(2,2,τ). Except for s2, s1 is another skill needed by t2. Because s1 ∈ S˄s1≠s2˄ST1,2 = 1˄R2(2,1,τ) = {r1}, Slend(2,2,τ) ← {s1}. (4) Compute fmax(2,2,1). Because R1(2,1,τ) = Φ˄R2(2,1,τ) = {r1} ≠ Φ, RTS1,0(τ) = 1 and u1 < u2, fmax(2,2,1) = f(1,2,τ) − f(1,1,τ) = 4 − 2 = 2. So t2 adjusts “1” to s2 from s1 successfully. The last utility distribution scheme of t2 is 3 to s1 and 5 to s2. The payoff matrix of the game after t2 adjusted its utility distribution scheme is shown in Table 2, in which there are 2 Nash equilibriums (2, 5) and (3, 5) (underlined in Table 2). The latter is system optimal. It can be seen that the method proposed in this paper not only distributes the utilities of task agents rationally but also increases the individual revenues and the system total revenue. The utility distribution scheme, to a certain extent, reflects the powers of service agents in the system. As the example showing, if r1 does not select t2, it can select and receive individual revenue 2. If r2 does not select t2, it can select t3 and receive individual revenue 5. This means that the “power” of r2 is bigger than that of r1 in the bargaining process, so (3, 5) is better than (4, 4).
5. Simulation Results
In simulation 1–4, of the 4 groups of data sets, the runtime and average system revenue of TAAUDA were compared with the results of the other 5 algorithms. Simulation 5 verifies the influences of the utility distribution schemes of task agents on the system total revenue. Simulation environment: internal memory capacity, 3.34 GB; CPU, Intel(R) Core(TM) i3-3240; main frequency, 3.40 GHz; operating system, Win 7.
For the data set, as far as we know, there is currently no standard database for the coalition skill game system. For the resource-constrained project scheduling problem, the project scheduling problem library [21] is a benchmark data set, but in which the resources do not possess multiple skills. Another similar data set is iMOPSE [22,23], the resources in which have multiple skills (where the resources can be seen as service agents in coalition skill games), but the task in iMOPSE needs only one skill. There are some other data sets that are generated artificially [24,25,26]. Analogously, in this work, the data sets 1, 2, and 3 were generated randomly. Data set 4 is generated based on iMOPSE. The generation methods will be described in detail later. To establish a standard database is our future work.
Simulation 1: In this simulation, the results of TAAUDA were compared with those of General Genetic Algorithm (GGA), Service and Adams Algorithm (SAA) [6], Combinatorial Bids based Algorithm (CBA) [17], Computationally Efficient Sampled Fictitious Play, and the Vig and Adams Algorithm (VAA) [27]. The service agents in the Combinatorial Bids based Algorithm and Computationally Efficient Sampled Fictitious Play are self-interested and those in the General Genetic Algorithm, Service and Adams Algorithm, and Vig and Adams Algorithm are not. The service agents and task agents in TAAUDA are all self-interested.
In order to get the optimal parameters of General Genetic Algorithm and Combinatorial Bids based Algorithm, a group of data sets, the size of which were n = 30, l = 15, and m = 30, were generated randomly. The number of skills possessed by each service agent is random(1, 5), and the number of skills needed by each task agent is random(1, 5). Where random(a, b) denotes a random integer between a and b (a and b are included). For this data set, with different values of crossover probability (CP) and mutation probability (MP), the General Genetic Algorithm ran 20 times, the average system revenues are shown in Table 3 (rows represent mutation probability and columns represent crossover probability). From the simulation results, it can be seen that the largest average system revenue is achieved when the crossover probability is 0.6 and the mutation probability is 0.1. In simulations 1–4, the parameters of the General Genetic Algorithm were set as: the crossover probability is 0.6, the mutation probability is 0.1, the size of the population was 150, and the maximal number of iteration was 10,000. For the same data set, with different values of λ(ρ(t) = t−λ), the Computationally Efficient Sampled Fictitious Play algorithm ran 20 times, and the average system revenues are shown in Table 4. It can be seen that the largest average system revenue is got when λ = 0.8(ρ(t) = t−0.8). So in simulations 1–4, the parameters of Computationally Efficient Sampled Fictitious Play algorithm were set to λ = 0.8. In simulation 1, the parameters of TAAUDA were set to DRS = 2, DN = 6, and IN = 105.
In Simulation 1, 15 groups of data sets numbered 1.1 to 1.15 (named data set 1) and were generated by the following methods: The size of which were n = 30, l = 15, and m = 30. Each service agent in group d ∈ {1, 2,···, 15} possesses d skills, which skill is possessed is random. Each task agent in all the 15 groups of data sets needs random(1,5) skills, which skill is needed is random. For tk ∈ T, uk ← TSNk×random(1,m/2). The average system revenues of TAAUDA, the General Genetic Algorithm, Vig and Adams Algorithm, and Service and Adams Algorithm (the agents in the latter three algorithms are not self-interested) are shown in Table 5. Figure 2 displays the average system revenues of TAAUDA, the Combinatorial Bids based Algorithm, and Computationally Efficient Sampled Fictitious Play, the agents in which are all self-interested. The average run time of the 6 algorithms is shown in Figure 3. In simulations 1–5, all the algorithms ran 100 times, and the average system revenues and average run time were computed.
From the results in Table 5 and Figure 2, show that in most cases the average system revenues obtained by TAAUDA are better than those of other 5 algorithms. It can also be concluded from Figure 3 that the run time of TAAUDA is shorter than that of the General Genetic Algorithm and Vig and Adams Algorithm.
Simulation 2: In this simulation, 15 groups of data sets numbered 2.1 to 2.15 (named data set 2) were generated by the following methods: The size of which were n = 30, l = 15, and m = 30. Each service agent in all the 15 groups of data sets possesses random(1,5) skills, which skill is possessed is random. Each task agent in group d ∈ {1, 2,···, 15} needs d skills, which skill is needed is random. For t ∈ T, uk ← TSNk × random(1,m/2). The average system revenues of TAAUDA, the General Genetic Algorithm, Vig and Adams Algorithm, and Service and Adams Algorithm are shown in Table 6. Figure 4 displays the average system revenues of TAAUDA, the Combinatorial Bids based Algorithm, and Computationally Efficient Sampled Fictitious Play. The average run time of the 6 algorithms is shown in Figure 5. The parameters of TAAUDA in Simulation 2 were set as: DRS = 2, DN = 3, and IN = 105.
From the results in Table 6 and Figure 4, it can be seen that in most cases the average system revenues obtained by TAAUDA were better than those of the other 5 algorithms. Because each task agent in data set 2.1 needs only one skill, the utility distribution scheme of the task agents will not work, its average system total revenue is smaller than that of the General Genetic Algorithm. It can also be concluded from Figure 5 that the run time of TAAUDA is shorter than that of the General Genetic Algorithm but is longer than that of the rest 4 algorithms. Because TAAUDA is polynomial, it is acceptable for the most practical applications.
Simulation 3: In this simulation, 15 groups of data sets numbered 3.1 to 3.15 (named data set 3) were generated by the following methods: The size of which were n = 30, l = 15, and m = 30. Each service agent in group possesses d skills, which skill is possessed is random. Each task agent in group d ∈ {1, 2,···, 15} needs d skills, which skill is needed is random. For tk ∈ T, uk ← TSNk × random(1,m/2). The average system revenues of TAAUDA, the General Genetic Algorithm, Vig and Adams Algorithm, and Service and Adams Algorithm are shown in Table 7. Figure 6 displays the average system revenues of TAAUDA, the Combinatorial Bids based Algorithm, and Computationally Efficient Sampled Fictitious Play. The average run time of the 6 algorithms is shown in Figure 7. The parameters of TAAUDA in Simulation 3 were set as: DRS = 4, DN = 7, and IN = 105.
It can be seen from the results in Table 7, Figure 6, and Figure 7, that in most cases, the average system revenues obtained by TAAUDA are better than those of the other 5 algorithms and the run time of TAAUDA is shorter than that of the General Genetic Algorithm, which is similar to the results of Simulation 2. The effectiveness of TAAUDA is further verified.
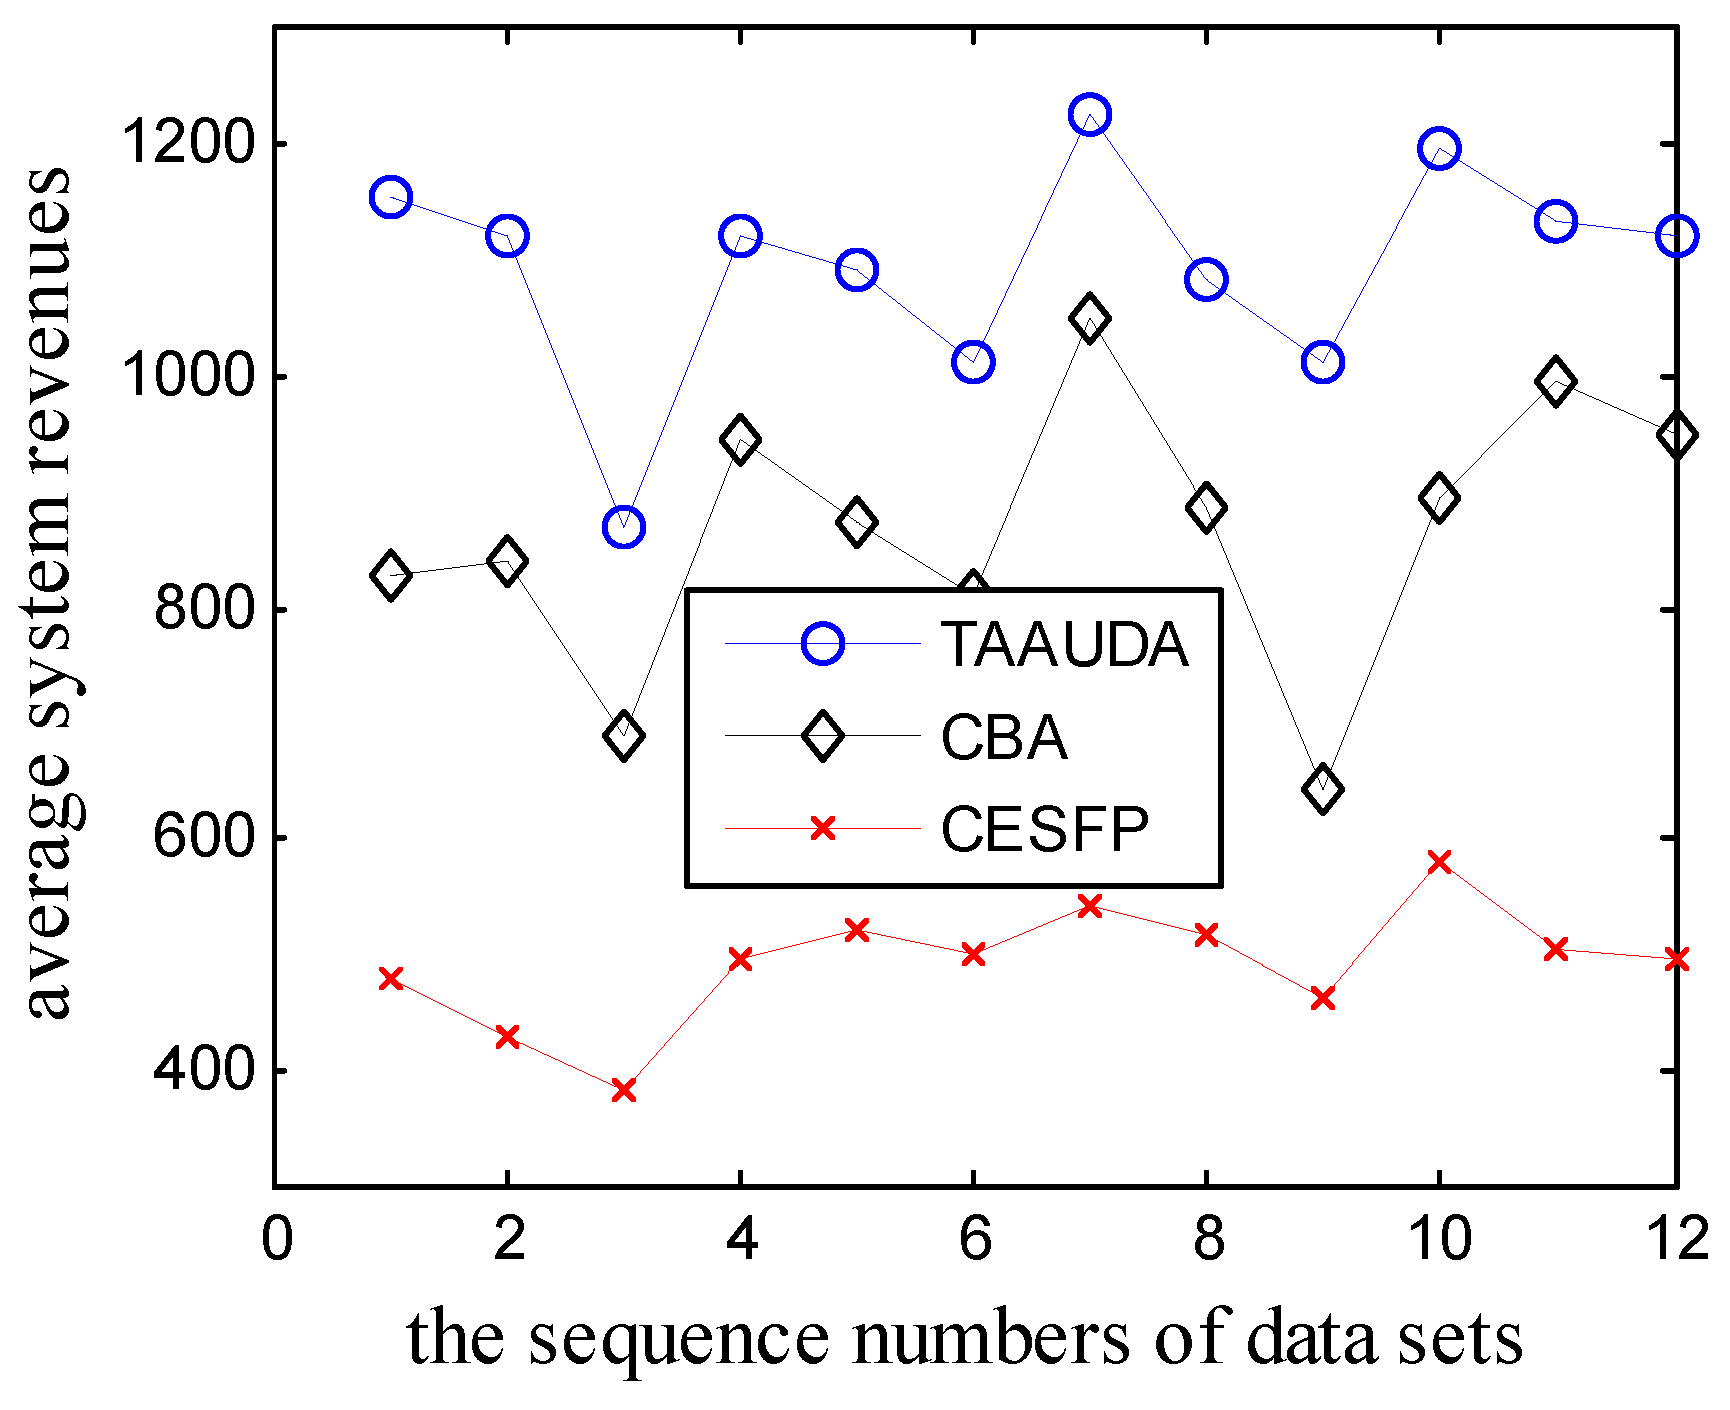
Simulation 4: In this simulation, 12 groups of data sets numbered 4.1 to 4.12 (named data set 4) were generated based on iMOPSE, which was created based on the real-life project instances received from international enterprise (Volvo IT): Data 4.1–4.4 were extracted from data set 200-40-133-15, 4.5–4.8 were extracted from data set 200-40-45-15, and 4.9–4.12 were extracted from data set 200-40-91-15. Resources in iMOPSE can be seen as service agents, a total of 30 service agents and a total of 30 tasks were extracted randomly from the corresponding data sets. Some modifications were made on the extracted data: the salaries of resources and the durations of the tasks were ignored. A total of random(1,11) skills were added to each task, this is because each task in iMOPSE needs only one skill, which is inconsistent with the case of this paper. For tk ∈ T, uk ← TSNk×random(1,m/2). The average system revenues of TAAUDA, the General Genetic Algorithm, Vig and Adams Algorithm and Service, and Adams Algorithm are shown in Table 8. Figure 8 displays the average system revenues of TAAUDA, the Combinatorial Bids based Algorithm, and Computationally Efficient Sampled Fictitious Play. The average run time of the 6 algorithms is shown in Figure 9. The parameters of TAAUDA in Simulation 4 were set as: DRS = 4, DN = 7, and IN = 105.
It can be seen from the results of Table 8 and Figure 8 and Figure 9 that in most cases, the average system revenues obtained by TAAUDA are better than those of the other 5 algorithms and that the run time of TAAUDA is shorter than that of the General Genetic Algorithm. The effectiveness of TAAUDA is further verified.
Simulation 5: This simulation checks the influences of the utility distribution scheme on the system revenue. The comparison algorithm assumes that each task agent always distributes its utility equally to the needed skills. Other settings are exactly the same as TAAUDA. The comparison algorithm is called the task allocation through distributing utilities averagely (TADUA). With different data, we ran TAAUDA and TADUA 100 times, the average system revenues are shown in Table 9, Table 10, Table 11 and Table 12 (Table 9 for data set 1, Table 10 for data set 2, Table 11 for data set 3, and Table 12 for data set 4). The parameters of TAAUDA and TADUA were both set as: DRS = 3, DN = 6, and IN = 105. It can be concluded from the simulation results, that in most cases, adjusting the utility distribution schemes of the task agents can improve the system total revenue, although in a few cases it is not the case, this is partly due to the randomness of these two algorithms.
6. Conclusions
This paper studies the task allocation problem of self-interested agents in coalition skill games. The service agent and task agent in this game are self-interested. It is assumed that the self-interested service agent always selects the task agents that can bring them the maximum individual revenues. The goal of each self-interested task agent is to obtain all the needed skills. To achieve this goal, it needs to distribute its utility reasonably. Based on this idea, the algorithm TAAUDA was proposed, whose effectiveness is verified by the simulation results. Future works are divided into four main aspects: Firstly, this paper only considers the allocation of static tasks, the actual task allocation problems can be divided to static and dynamic [28]. There are many dynamic task allocation problems in practical applications [29], so the next work could invest in the utility’s reasonable distribution in the dynamic task allocation environment. Secondly, when the service agents and the task agents are connected via a network and their communication is limited by the network structure, what is the best way to design the service agent’s task selection strategy and the task agent’s utility distribution strategy to ensure high system revenue? Thirdly, applying TAAUDA to some practical applications such as multi-robot pursuit-evasion problems [30,31], multi-robot patrolling [32,33], etc. The last is to establish the standard data base for the coalition skill game.
Author Contributions
H.W. conceived and designed the experiments; M.F. performed the experiments and wrote the paper; B.F. analyzed the data.
Acknowledgments
This work is supported by the National Natural Science Foundation of China under grant 61175051 and 61175033 by the National High Technology Research and Development Program of China (863 Program) and under grant 2012AA011005 by the Natural Science Foundation of Anhui Province (1308085QF108), and the Doctorate personnel special fund of Hefei University.
Conflicts of Interest
The authors declare no conflicts of interest.
References
- Bachrach, Y.; Rosenschein, J.S. Coalitional skill games. In Proceedings of the 7th International Joint Conference on Autonomous Agents and Multiagent Systems, Estoril, Portugal, 12–16 May 2008; pp. 1023–1030. [Google Scholar]
- Bachrach, Y.; Parkes, D.C.; Rosenschein, J.S. Computing cooperative solution concepts in coalitional skill games. Artif. Intell. 2013, 204, 1–21. [Google Scholar] [CrossRef]
- Bachrach, Y.; Meir, R.; Jung, K.; Kohli, P. Coalitional Structure Generation in Skill Games. In Proceedings of the Twenty-Fourth AAAI Conference on Artificial Intelligence (AAAI-10), Atlanta, GA, USA, 11 July 2010; Volume 10, pp. 703–708. [Google Scholar]
- Rahwan, T.; Michalak, T.P.; Wooldridge, M.; Jennings, N.R. Coalition structure generation: A survey. Artif. Intell. 2015, 229, 139–174. [Google Scholar] [CrossRef]
- Vig, L.; Adams, J.A. Coalition formation: From software agents to robots. J. Intell. Robot. Syst. 2007, 50, 85–118. [Google Scholar] [CrossRef]
- Adams, J.A. Coalition formation for task allocation: Theory and algorithms. Auton. Agents Multi Agent Syst. 2011, 22, 225–248. [Google Scholar]
- Cui, R.; Guo, J.; Gao, B. Game theory-based negotiation for multiple robots task allocation. Robotica 2013, 31, 923–934. [Google Scholar] [CrossRef]
- Gerkey, B.P.; Matarić, M.J. A formal analysis and taxonomy of task allocation in multi-robot systems. Int. J. Robot. Res. 2004, 23, 939–954. [Google Scholar] [CrossRef]
- Swenson, B.; Kar, S.; Xavier, J. A computationally efficient implementation of fictitious play for large-scale games. arXiv, 2015; arXiv:1506.04320. [Google Scholar]
- Marden, J.R.; Arslan, G.; Shamma, J.S. Cooperative control and potential games. IEEE Trans. Syst. Man Cybern. Part B 2009, 39, 1393–1407. [Google Scholar] [CrossRef] [PubMed]
- Marden, J.R.; Arslan, G.; Shamma, J.S. Regret based dynamics: Convergence in weakly acyclic games. In Proceedings of the 6th International Joint Conference on Autonomous Agents and Multiagent Systems, Honolulu, Hawaii, 14–18 May 2007; p. 42. [Google Scholar]
- Genin, T.; Aknine, S. Coalition formation strategies for self-interested agents in task oriented domains. In Proceedings of the 2010 IEEE/WIC/ACM International Conference on Web Intelligence and Intelligent Agent Technology (WI-IAT), Toronto, ON, Canada, 31 August–3 September 2010; pp. 205–212. [Google Scholar]
- Kong, Y.; Zhang, M.; Ye, D.; Zhu, J.; Choi, J. An intelligent agent-based method for task allocation in competitive cloud environments. Concurr. Comput. Pract. Exp. 2017, 30, e4178. [Google Scholar] [CrossRef]
- Barile, F.; Rossi, A.; Staffa, M.; Napoli, C.D.; Rossi, S.A. Market Mechanism for QoS-aware Multi-Robot Task Allocation. In Proceedings of the 16th Workshop “From Objects to Agents” (WOA15), Naples, Italy, 17–19 June 2015; pp. 129–134. [Google Scholar]
- Kong, Y.; Zhang, M.; Ye, D. An auction-based approach for group task allocation in an open network environment. Comput. J. 2016, 59, 403–422. [Google Scholar] [CrossRef]
- Service, T.C.; Sen, S.D.; Adams, J.A. A simultaneous descending auction for task allocation. In Proceedings of the 2014 IEEE International Conference on Systems, Man, and Cybernetics (SMC), San Dieg, CA, USA, 5–8 October 2014; pp. 379–384. [Google Scholar]
- Lin, L.; Zheng, Z. Combinatorial bids based multi-robot task allocation method. In Proceedings of the IEEE International Conference on Robotics and Automation, Barcelona, Spain, 18–22 April 2005; pp. 1145–1150. [Google Scholar]
- Liu, Y.; Zhang, G.F.; Su, Z.P.; Yue, F.; Jiang, J.G. Using Computational Intelligence Algorithms to Solve the Coalition Structure Generation Problem in Coalitional Skill Games. J. Comput. Sci. Technol. 2016, 31, 1136–1150. [Google Scholar] [CrossRef]
- Aziz, H.; De Keijzer, B. Complexity of coalition structure generation. In Proceedings of the 10th International Conference on Autonomous Agents and Multiagent Systems, TaiPei, Taiwan, 2–6 May 2011; pp. 191–198. [Google Scholar]
- Tran-Thanh, L.; Nguyen, T.D.; Rahwan, T.; Rogers, A.R.; Jennings, N. An efficient vector-based representation for coalitional games. In Proceedings of the IJCAI’13, Twenty-Third International Joint Conference on Artificial Intelligence, Beijing, China, 3–9 August 2013; pp. 383–389. [Google Scholar]
- Kolisch, R.; Sprecher, A. PSPLIB—A project scheduling problem library: OR software-ORSEP operations research software exchange program. Eur. J. Op. Res. 1997, 96, 205–216. [Google Scholar] [CrossRef]
- Myszkowski, P.B.; Skowronski, M.E.; Sikora, K. A new benchmark dataset for Multi-Skill Resource-Constrained Project Scheduling Problem. In Proceedings of the 2015 Federated Conference on Computer Science and Information Systems (FedCSIS), Lodz, Poland, 13–16 September 2015; pp. 129–138. [Google Scholar]
- Myszkowski, P.B.; Skowroński, M.E.; Olech, Ł.P.; Oślizło, K. Hybrid ant colony optimization in solving multi-skill resource-constrained project scheduling problem. Soft Comput. 2015, 19, 3599–3619. [Google Scholar] [CrossRef]
- Hegazy, T.; Shabeeb, A.K.; Elbeltagi, E.; Cheema, T. Algorithm for scheduling with multiskilled constrained resources. J. Constr. Eng. Manag. 2000, 126, 414–421. [Google Scholar] [CrossRef]
- Santos, M.A.; Tereso, A.P. On the multi-mode, multi-skill resource constrained project scheduling problem—A software application. In Soft Computing in Industrial Applications; Gaspar-Cunha, A., Takahashi, R., Schaefer, G., Costa, L., Eds.; Springer: Berlin/Heidelberg, Germany, 2011; pp. 239–248. [Google Scholar]
- Hooshangi, N.; Alesheikh, A.A. Agent-based task allocation under uncertainties in disaster environments: An approach to interval uncertainty. Int. J. Disaster Risk Reduct. 2017, 24, 150–171. [Google Scholar] [CrossRef]
- Vig, L.; Adams, J.A. Multi-robot coalition formation. IEEE Trans. Robot. 2006, 22, 637–649. [Google Scholar] [CrossRef]
- Elango, M.; Nachiappan, S.; Tiwari, M.K. Balancing task allocation in multi-robot systems using K-means clustering and auction based mechanisms. Expert Syst. Appl. 2011, 38, 6486–6491. [Google Scholar] [CrossRef]
- Kong, Y.; Zhang, M.; Ye, D. A group task allocation strategy in open and dynamic grid environments. In Recent Advances in Agent-based Complex Automated Negotiation. Studies in Computational Intelligence; Fukuta, N., Ito, T., Zhang, M., Fujita, K., Robu, V., Eds.; Springer: Cham, Switzerland, 2016; Volume 638, pp. 121–139. ISBN 978-3-319-30305-5. [Google Scholar]
- Tian, Y.; Sarkar, N. Game-based pursuit evasion for nonholonomic wheeled mobile robots subject to wheel slips. Adv. Robot. 2013, 27, 1087–1097. [Google Scholar] [CrossRef]
- Zadeh, L.A. Stochastic finite-state systems in control theory. Inf. Sci. 2013, 251, 1–9. [Google Scholar] [CrossRef]
- Kawamura, A.; Soejima, M. Simple strategies versus optimal schedules in multi-agent patrolling. In Algorithms and Complexity. CIAC 2015. Lecture Notes in Computer Science; Paschos, V., Widmayer, P., Eds.; Springer: Cham, Switzerland, 2015; Volume 9079, pp. 261–273. [Google Scholar]
- Hernández, E.; Cerro, J.; Barrientos, A. Game theory models for multi-robot patrolling of infrastructures. Int. J. Adv. Robot. Syst. 2013, 10, 1–10. [Google Scholar] [CrossRef] [Green Version]
Figure 1.
A simple example of coalition skill game.

Figure 2.
The average system revenues of TAAUDA, CBA, and CESFP.

Figure 3.
The average runtime of the 6 algorithms.

Figure 4.
The average system revenues of TAAUDA, CBA, and CESFP.

Figure 5.
The average runtime of the 6 algorithms.

Figure 6.
The average system revenues of TAAUDA, CBA, and CESFP.

Figure 7.
The average runtime of the six algorithms.

Figure 8.
The average system revenues of TAAUDA, CBA, and CESFP.

Figure 9.
The average runtime of the six algorithms.


Table 1.
Pay matrix when the utilities of task agents are distributed averagely.
| r2,t1 | r2,t2 | r2,t3 | |
| r1,t1 | (2,0) | (2,0) | (2,5) |
| r1,t2 | (0,0) | (4,4) | (0,5) |
| r1,t3 | (0,0) | (0,0) | (0,5) |
Table 2.
The payoff matrix when is distributed with Utility Distribution Adjustment (TAAUDA).
| r2,t1 | r2,t2 | r2,t3 | |
| r1,t1 | (2,0) | (2,0) | (2,5) |
| r1,t2 | (0,0) | (3,5) | (0,5) |
| r1,t3 | (0,0) | (0,0) | (0,5) |
Table 3.
The average system revenues of GGA with different values of CP and MP.
| 0.01 | 0.05 | 0.1 | 0.15 | 0.2 | 0.3 | 0.4 | 0.6 | 0.8 | 0.9 | 0.95 | |
| 0.01 | 415.1 | 440.0 | 441.8 | 474.3 | 508.3 | 515.8 | 543.8 | 552.3 | 566.0 | 584.0 | 581.3 |
| 0.05 | 483.3 | 506.5 | 524.0 | 563.5 | 558.5 | 568.8 | 595.8 | 634.5 | 637.8 | 632.3 | 627.3 |
| 0.1 | 513.3 | 551.5 | 566.5 | 553.0 | 598.3 | 628.5 | 606.5 | 668.0 | 656.5 | 645.0 | 642.0 |
| 0.15 | 505.5 | 534.5 | 577.5 | 592.0 | 601.5 | 623.8 | 629.8 | 577.0 | 529.3 | 518.0 | 535.3 |
| 0.2 | 534.3 | 538.8 | 574.0 | 598.0 | 574.5 | 544.8 | 502.5 | 462.5 | 437.3 | 411.0 | 421.8 |
| 0.3 | 433.8 | 424.3 | 428.3 | 415.0 | 405.8 | 382.3 | 361.0 | 348.0 | 347.5 | 340.5 | 335.5 |
| 0.4 | 328.0 | 331.3 | 328.5 | 341.5 | 341.3 | 323.3 | 327.5 | 288.5 | 288.5 | 288.8 | 279.8 |
| 0.6 | 226.3 | 230.0 | 228.3 | 240.0 | 247.3 | 234.8 | 229.0 | 231.0 | 210.8 | 213.3 | 217.3 |
| 0.8 | 201.3 | 201.3 | 202.5 | 179.5 | 199.3 | 183.5 | 203.3 | 186.8 | 191.3 | 185.3 | 177.8 |
Table 4.
The average system revenues of CESFP with different values of λ.
| λ | 0.1 | 0.2 | 0.3 | 0.4 | 0.5 | 0.6 | 0.7 | 0.8 | 0.9 | 0.95 |
| average system revenues | 313.3 | 338.5 | 368.3 | 373.7 | 374.9 | 373.5 | 375.1 | 392.9 | 358.2 | 337.2 |
Table 5.
The average system revenues of TAAUDA, GGA, VAA, and SAA.
| TAAUDA | GGA | VAA | SAA | |
| 1.1 | 220.52 | 157.43 | 230.0 | 206 |
| 1.2 | 344.51 | 291.10 | 322.0 | 322 |
| 1.3 | 511.19 | 444.12 | 482.0 | 506 |
| 1.4 | 534.55 | 443.08 | 516 | 503 |
| 1.5 | 601.67 | 552.42 | 588 | 599 |
| 1.6 | 613.37 | 593.28 | 612 | 601 |
| 1.7 | 650.32 | 636.84 | 632 | 625 |
| 1.8 | 790.2 | 781.14 | 775 | 747 |
| 1.9 | 826.86 | 820.5 | 818 | 817 |
| 1.10 | 563.54 | 562.92 | 554 | 564 |
| 1.11 | 604.36 | 602.12 | 597 | 601 |
| 1.12 | 699.0 | 697.72 | 699 | 693 |
| 1.13 | 837.85 | 835.32 | 835 | 836 |
| 1.14 | 646.0 | 642.86 | 646 | 646 |
| 1.15 | 880.0 | 875.86 | 880 | 880 |
Table 6.
The average system revenues of TAAUDA, GGA, VAA, and SAA.
| TAAUDA | GGA | VAA | SAA | |
| 2.1 | 270.29 | 276.04 | 263.0 | 263.0 |
| 2.2 | 341.9 | 334.0 | 340.0 | 340.0 |
| 2.3 | 468.3 | 432.6 | 399.0 | 429.0 |
| 2.4 | 389.48 | 315.12 | 368.0 | 328.0 |
| 2.5 | 458.5 | 348.9 | 435.0 | 405.0 |
| 2.6 | 504.66 | 316.8 | 504.0 | 384.0 |
| 2.7 | 526.75 | 263.76 | 448.0 | 392.0 |
| 2.8 | 710.88 | 380.36 | 560.0 | 424.0 |
| 2.9 | 661.95 | 333.36 | 477.0 | 594.0 |
| 2.10 | 817.9 | 359.4 | 620.0 | 520.0 |
| 2.11 | 503.47 | 169.77 | 429.0 | 429.0 |
| 2.12 | 538.2 | 227.6 | 348.0 | 348.0 |
| 2.13 | 664.3 | 104.9 | 663.0 | 663.0 |
| 2.14 | 762.16 | 88.2 | 770.0 | 602.0 |
| 15 | 1002.3 | 19.4 | 870.0 | 870.0 |
Table 7.
The average system revenues of TAAUDA, GGA, VAA, and SAA.
| TAAUDA | GGA | VAA | SAA | |
| 3.1 | 221.00 | 221.0 | 221.0 | 221.0 |
| 3.2 | 350.08 | 326.2 | 348.0 | 328.0 |
| 3.3 | 435.84 | 392.16 | 384.0 | 372.0 |
| 3.4 | 652.88 | 595.60 | 620.0 | 600.0 |
| 3.5 | 734.3 | 642.1 | 695.0 | 710.0 |
| 3.6 | 1051.62 | 941.04 | 1038.0 | 984.0 |
| 3.7 | 1336.51 | 1210.86 | 1288.0 | 1232.0 |
| 3.8 | 1448.88 | 1347.04 | 1392.0 | 1368.0 |
| 3.9 | 1508.08 | 1423.8 | 1413.0 | 1422.0 |
| 3.10 | 1719.50 | 1657.00 | 1650.0 | 1630.0 |
| 3.11 | 2265.23 | 2208.14 | 2244.0 | 2145.0 |
| 3.12 | 1857.48 | 1819.44 | 1776.0 | 1776.0 |
| 3.13 | 2597.66 | 2542.8 | 2379.0 | 2314.0 |
| 3.14 | 3329.2 | 3277.12 | 3318.0 | 3318.0 |
| 3.15 | 3900.0 | 3885.9 | 3900.0 | 3900.0 |
Table 8.
The average system revenues of TAAUDA, GGA, VAA, and SAA.
| TAAUDA | GGA | VAA | SAA | |
| 3.1 | 1157.1 | 890.8 | 1099.0 | 1070.0 |
| 3.2 | 1120.86 | 809.83 | 1092.0 | 1055.0 |
| 3.3 | 867.82 | 595.77 | 866.0 | 888.0 |
| 3.4 | 1121.79 | 831.8 | 1060.0 | 1072.0 |
| 3.5 | 1092.54 | 844.12 | 1033.0 | 1041.0 |
| 3.6 | 1010.29 | 806.23 | 939.0 | 967.0 |
| 3.7 | 1226.82 | 896.08 | 1223.0 | 1123.0 |
| 3.8 | 1082.19 | 880.92 | 1116.0 | 1051.0 |
| 3.9 | 1011.25 | 756.03 | 1056.0 | 1020.0 |
| 3.10 | 1195.9 | 966.22 | 1194.0 | 1133.0 |
| 3.11 | 1132.27 | 836.15 | 1088.0 | 1024.0 |
| 3.12 | 1121.52 | 710.1 | 1114.0 | 1083.0 |
Table 9.
Average system revenues under data set 1.
| 1.1 | 1.2 | 1.3 | 1.4 | 1.5 | 1.6 | 1.7 | 1.8 | 1.9 | 1.10 | 1.11 | 1.12 | 1.13 | 1.14 | 1.15 | |
| TAAUDA | 220.5 | 344.5 | 511.2 | 534.5 | 601.7 | 609.5 | 650.3 | 790.2 | 826.9 | 563.6 | 604.4 | 698.3 | 837.9 | 646.0 | 880.0 |
| TADUA | 179.2 | 335.2 | 498.6 | 526.4 | 600.5 | 605.6 | 649.3 | 787.0 | 825.6 | 563.0 | 603.4 | 698.1 | 836.8 | 645.9 | 880.0 |
Table 10.
Average system revenues under data set 2.
| 2.1 | 2.2 | 2.3 | 2.4 | 2.5 | 2.6 | 2.7 | 2.8 | 2.9 | 2.10 | 2.11 | 2.12 | 2.13 | 2.14 | 2.15 | |
| TAAUDA | 272.6 | 343.4 | 477.9 | 396.2 | 468.2 | 521.8 | 552.0 | 724.7 | 693.0 | 839.3 | 526.1 | 583.7 | 668.9 | 769.2 | 1056.0 |
| TADUA | 272.8 | 336.3 | 466.9 | 379.4 | 450.2 | 500.1 | 503.3 | 693.2 | 653.3 | 793.7 | 486.2 | 407.3 | 667.3 | 749.8 | 917.7 |
Table 11.
Average system revenues under data set 3.
| 3.1 | 3.2 | 3.3 | 3.4 | 3.5 | 3.6 | 3.7 | 3.8 | 3.9 | 3.10 | 3.11 | 3.12 | 3.13 | 3.14 | 3.15 | |
| TAAUDA | 221.0 | 348.3 | 430.8 | 649.6 | 729.4 | 1042.5 | 1328.1 | 1444.9 | 1505.2 | 1717.4 | 2263.5 | 1853.4 | 2589.5 | 3327.4 | 3900 |
| TADUA | 221.0 | 341.3 | 417.7 | 637.6 | 708.3 | 1027.6 | 1309.5 | 1440.9 | 1500.5 | 1715.5 | 2262.8 | 1853.2 | 2583.6 | 3323.6 | 3900 |
Table 12.
Average system revenues under data set 4.
| 4.1 | 4.2 | 4.3 | 4.4 | 4.5 | 4.6 | 4.7 | 4.8 | 4.9 | 4.10 | 4.11 | 4.12 | |
| TAAUDA | 1149.7 | 1116.07 | 856.46 | 1114.9 | 1078.16 | 1003.1 | 1219.91 | 1075.19 | 1007.04 | 1184.45 | 1126.19 | 1101.03 |
| TADUA | 1142.89 | 1095.52 | 834.09 | 1098.04 | 1078.68 | 991.6 | 1204.39 | 1064.53 | 965.1 | 1151.04 | 1105.65 | 1097.76 |
© 2018 by the authors. Licensee MDPI, Basel, Switzerland. This article is an open access article distributed under the terms and conditions of the Creative Commons Attribution (CC BY) license (http://creativecommons.org/licenses/by/4.0/).
Share and Cite
MDPI and ACS Style
Fu, M.L.; Wang, H.; Fang, B.F. Utility Distribution Strategy of the Task Agents in Coalition Skill Games. Algorithms 2018, 11, 64. https://doi.org/10.3390/a11050064
AMA Style
Fu ML, Wang H, Fang BF. Utility Distribution Strategy of the Task Agents in Coalition Skill Games. Algorithms. 2018; 11(5):64. https://doi.org/10.3390/a11050064
Chicago/Turabian StyleFu, Ming Lan, Hao Wang, and Bao Fu Fang. 2018. "Utility Distribution Strategy of the Task Agents in Coalition Skill Games" Algorithms 11, no. 5: 64. https://doi.org/10.3390/a11050064
Note that from the first issue of 2016, this journal uses article numbers instead of page numbers. See further details here.