A Combined Syntactical and Statistical Approach for R Peak Detection in Real-Time Long-Term Heart Rate Variability Analysis


1
Department of Human and Environmental Informatics, Graduate School of Science and Technology, Kumamoto University, Kumamoto 860-8555, Japan
2
Field of Biomedical and Welfare Engineering, Division of Informatics and Energy, Faculty of Advanced Science and Technology, Kumamoto University, Kumamoto 860-8555, Japan
*
Author to whom correspondence should be addressed.
Algorithms 2018, 11(6), 83; https://doi.org/10.3390/a11060083
Submission received: 30 November 2017
/
Revised: 23 May 2018
/
Accepted: 5 June 2018
/
Published: 7 June 2018
Abstract
:Long-term heart rate variability (HRV) analysis is useful as a noninvasive technique for autonomic nervous system activity assessment. It provides a method for assessing many physiological and pathological factors that modulate the normal heartbeat. The performance of HRV analysis systems heavily depends on a reliable and accurate detection of the R peak of the QRS complex. Ectopic beats caused by misdetection or arrhythmic events can introduce bias into HRV results, resulting in significant problems in their interpretation. This study presents a novel method for long-term detection of normal R peaks (which represent the normal heartbeat in electrocardiographic signals), intended specifically for HRV analysis. The very low computational complexity of the proposed method, which combines and exploits the advantages of syntactical and statistical approaches, enables real-time applications. The approach was validated using the Massachusetts Institute of Technology–Beth Israel Hospital Normal Sinus Rhythm and the Fantasia database, and has a sensitivity, positive predictivity, detection error rate, and accuracy of 99.998, 99.999, 0.003, and 99.996%, respectively.
1. Introduction
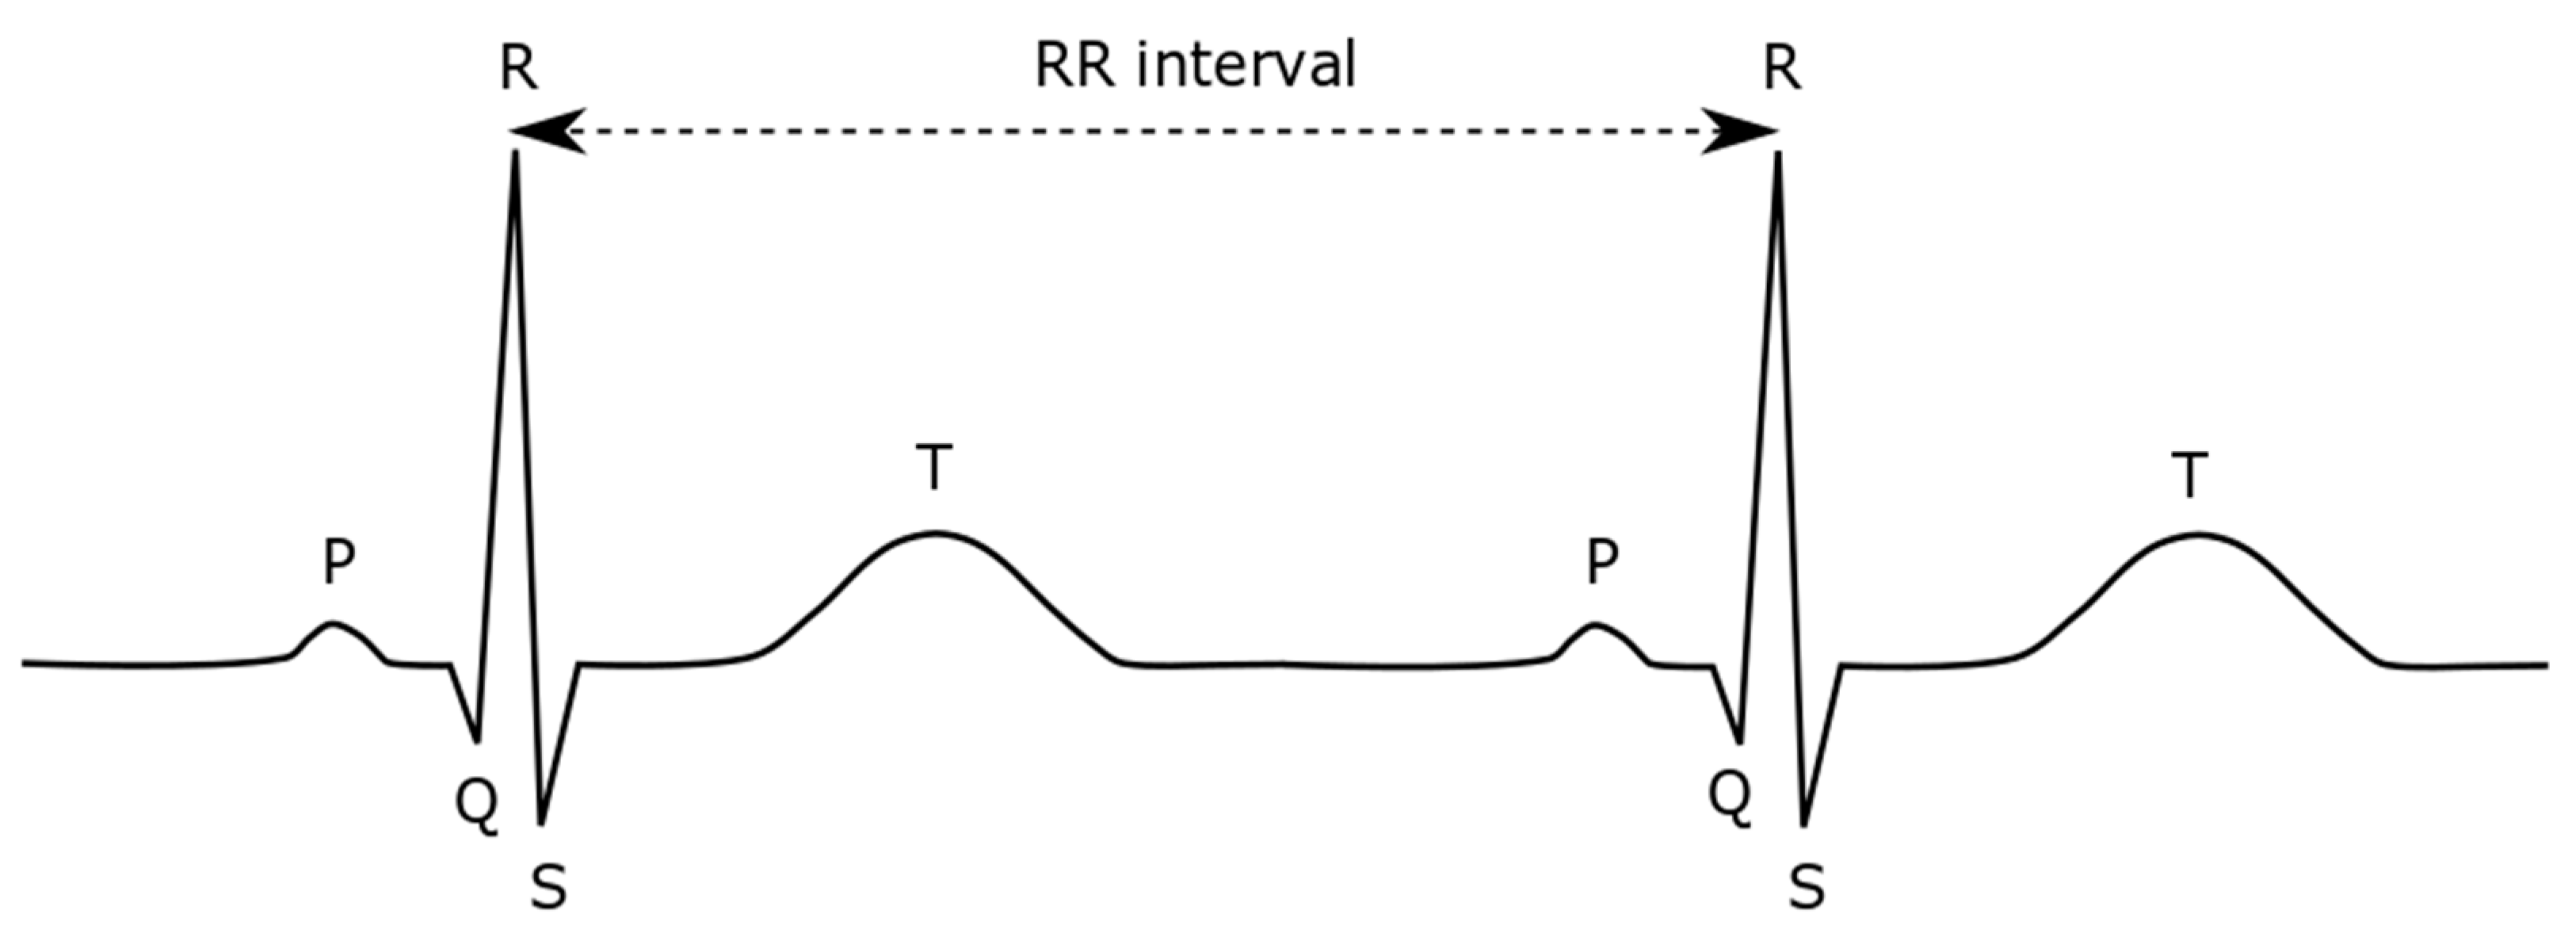
Electrocardiography (ECG) is the graphical representation of the electrical activity of the heart over periods of time. ECG signals can generally be acquired through simple noninvasive recordings and manifest as a series of waves characterized by three main wave types: P, QRS, and T. The QRS complex is the most distinctive feature in ECG signals indicating the heartbeat, and its fiducial marker is the peak of the R wave (Figure 1).
Heartbeat regulation is performed by the autonomic nervous system (ANS), which influences many vital organs in the body [1]. Thus, inter-heartbeat intervals, which are usually measured using the RR intervals in an ECG, are constantly fluctuating. The heart rate variability (HRV) reflects the ANS activity, a relationship that provides considerable insight into many physiological and pathological factors that influence the normal heart rhythm [2,3,4]. Long-term HRV analysis has been proven helpful for clinical professionals in identifying autonomic impairment and providing prognoses of patient condition. The analysis can support the delivery of suitable medical treatments and prevent the development of diseases.
Because of its usefulness, our goal is to develop a system for a real-time long-term HRV analysis that can be embedded into a bedside monitor for use in intensive care units or high care units to provide a quantitative assessment of long-term outcomes for patients [5]. Such analysis requires that the analyzed HRV only reflects the ANS activity. Accordingly, ensuring that processed beats are normal beats is essential for an effective analysis. In addition, the presence of arrhythmic events, in which beat rhythms are not directly caused by the ANS, significantly affects HRV analysis. To eliminate such events from tracked data, some authors proposed excluding signals containing more than 10 ectopic beats per hour [6], while others recommended accepting ectopic beats comprising up to 5 [7], 8 [8], 10 [9,10], or even 15% [11] of all RR intervals. The study reported herein represents a specific component of our work on HRV analysis systems, for which we intend to detect only the normal heartbeat and exclude ectopic or arrhythmic heartbeats [5].
In long-term R peak detection, noises that can distort the ECG signal, such as muscle noise, some artefacts arising from electrode and body motion, and baseline wander caused by perspiration and respiration, have an increased probability of occurrence. Such noises make long-term R peak detection more difficult in terms of both accuracy and effect on the physiological variability of the QRS complex itself. A long-term HRV analysis requires a reliable and customized R peak detector to provide information on an uninterrupted series of normal RR intervals. In fact, a single misdetection of an R peak can undermine the results of further analyses (e.g., time-domain, frequency-domain, or nonlinear analysis). In this work, we propose a new method designed to accurately detect in real time the R peak of normal heartbeats from long-term ECG signals specifically intended for HRV analysis.
A useful criterion in long-term ECG monitoring is the energy consumption efficiency. The proposed method meets this criterion and that of computational efficiency. Moreover, it is much faster than most existing methods. For instance, finite impulse response (FIR) filters are typically used in the ECG preprocessing stage and have computational costs of at least (m × n), where m and n are the kernel and data sizes, respectively. Cascades of more than one FIR filter are commonly used, as is done in bandpass or band-reject filters. Depending on the method, the detection stage can employ even more complex computations or, at least, computations that are not less complex than O(n). In contrast, the proposed method has a computational cost proportional to n at the preprocessing stage and a cost proportional to k at the detection stage, where k is a fraction of n. This reduced computational complexity has been proven useful in our implementation of a client-based HRV detector [5]. It is also appropriate for other applications, in which energy consumption is a concern, or implementations that present limited processing resources (e.g., portable embedded devices).
2. Materials and Methods
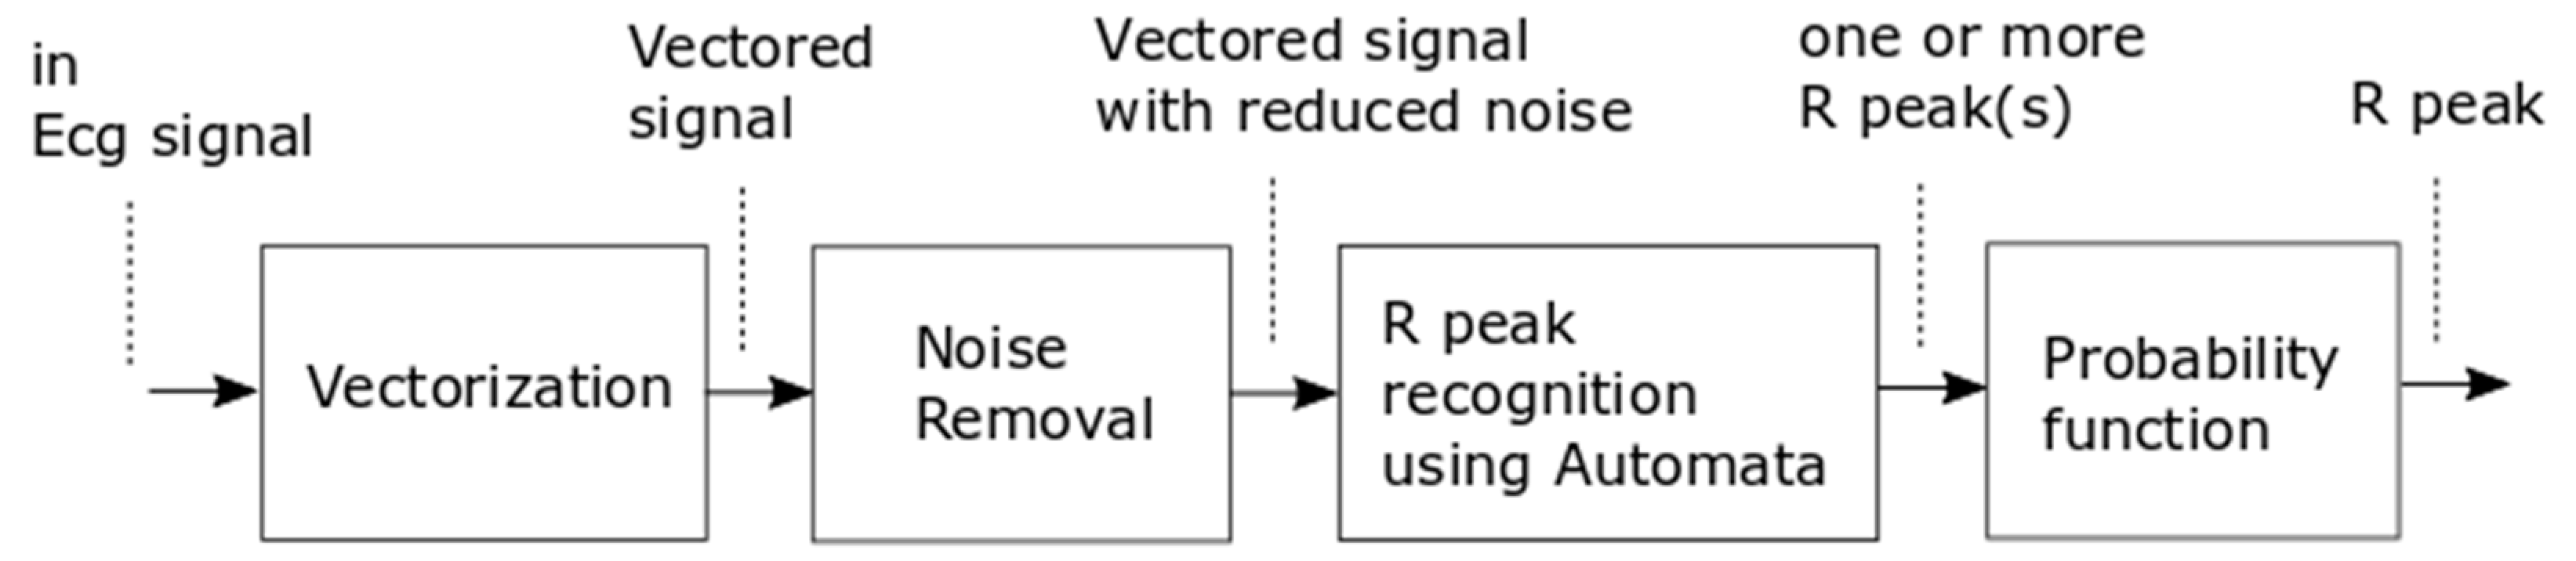
Figure 2 shows the proposed method comprising a preprocessing stage followed by a detection stage. The preprocessing stage has two internal phases involving vectorization and noise removal. This stage is meant to perform signal conditioning while reducing the amount of data, thereby making the succeeding step simpler and faster. After a signal suitable for processing is obtained, automata recognize the candidate R peaks from which a probability function selects the correct peak.
2.1. Vectorization Process
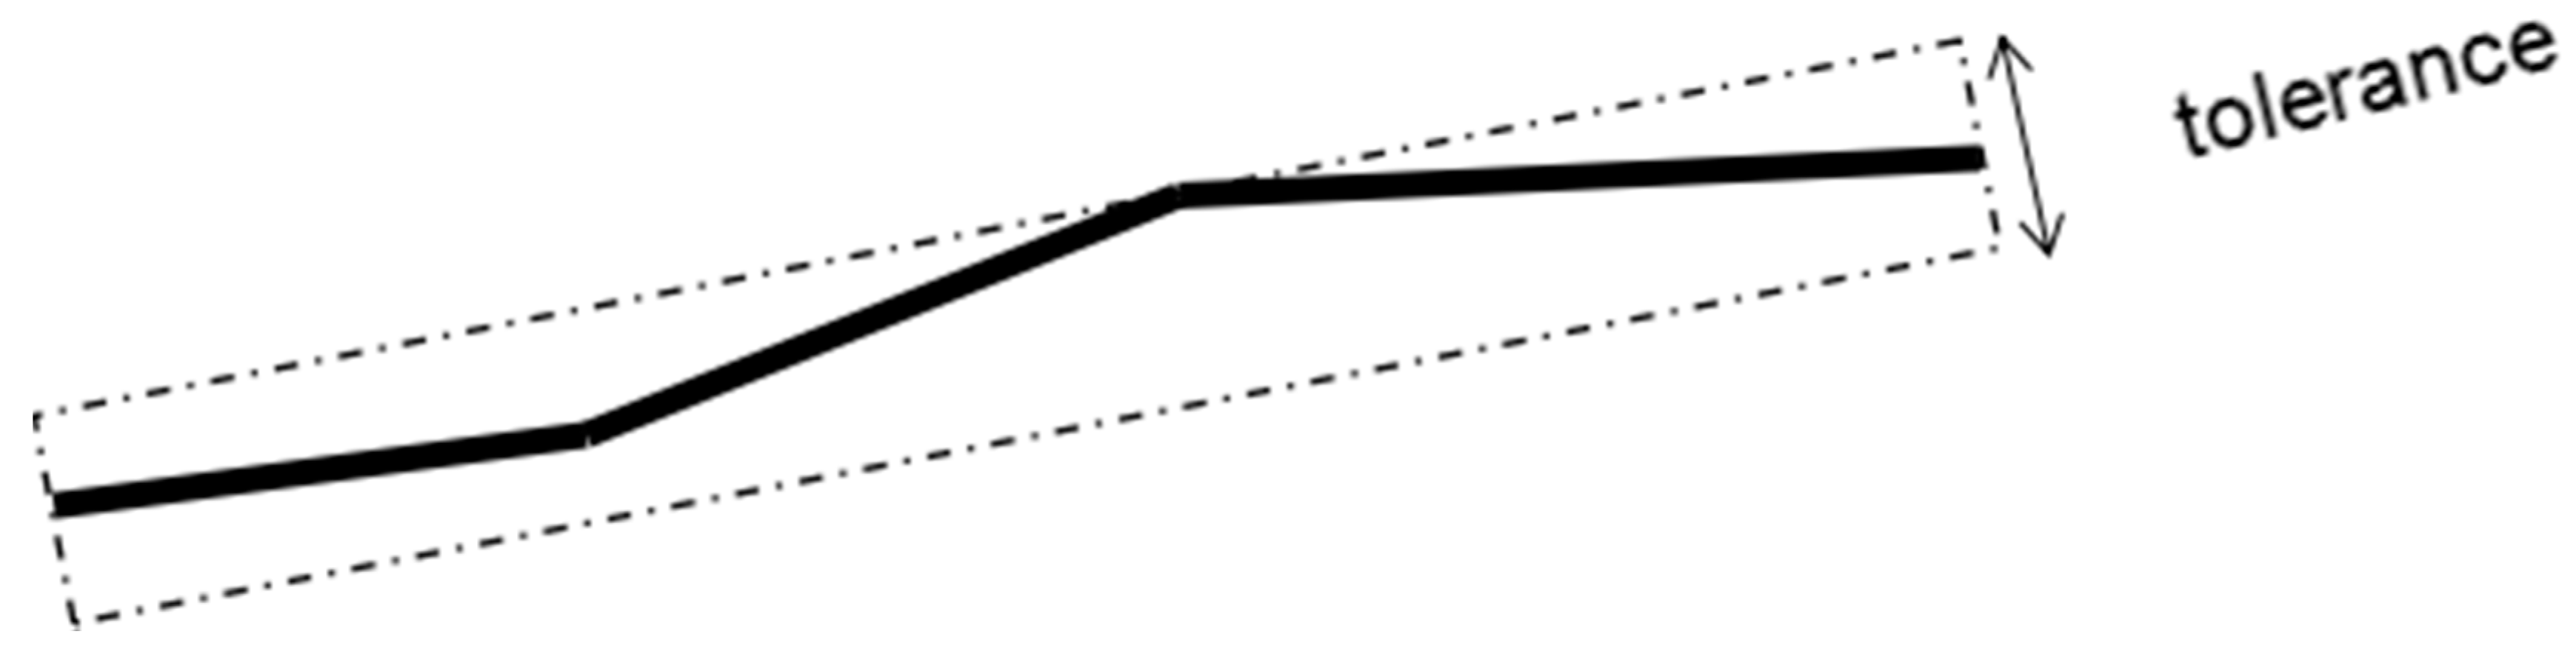
FIR filters are commonly used in the first signal processing stage; however, such filters have several drawbacks. For instance, their implementation can introduce a phase shift and modify the morphology of the signal in a manner unsuitable for the succeeding process. Moreover, they have a computational cost at least proportional to (m × n) for kernel and data sizes m and n, respectively. Considering that an ECG is essentially a graphical representation of the electrical activity in the heart, we apply common simplification methods from computer graphics, such as polyline simplification, which has a computational complexity of O(n) and reduces the amount of data to a fraction of n. We call this the vectorization process because it employs a concept similar to that of converting bitmap images to vector images in computer graphics. Figure 3 illustrates the vectorization process.
In vectorizing the signal data, we first define 11 slope ranges (Table 1), each having a threshold based on the peak-to-peak voltage of the ECG signal as follows:
where Vppt is the maximum peak-to-peak voltage of the ECG signal over 2 s, and Vppt−1 is the previous value of Vppt.
The vectorization algorithm combines consecutive lines with the same slope range into a single straight line (Figure 3). This method results in a reduced number of data points and a reduction of unnecessary signal fluctuations while preserving the data features. The resulting lines are encoded using 11 alphabetic symbols.
2.2. Noise Removal
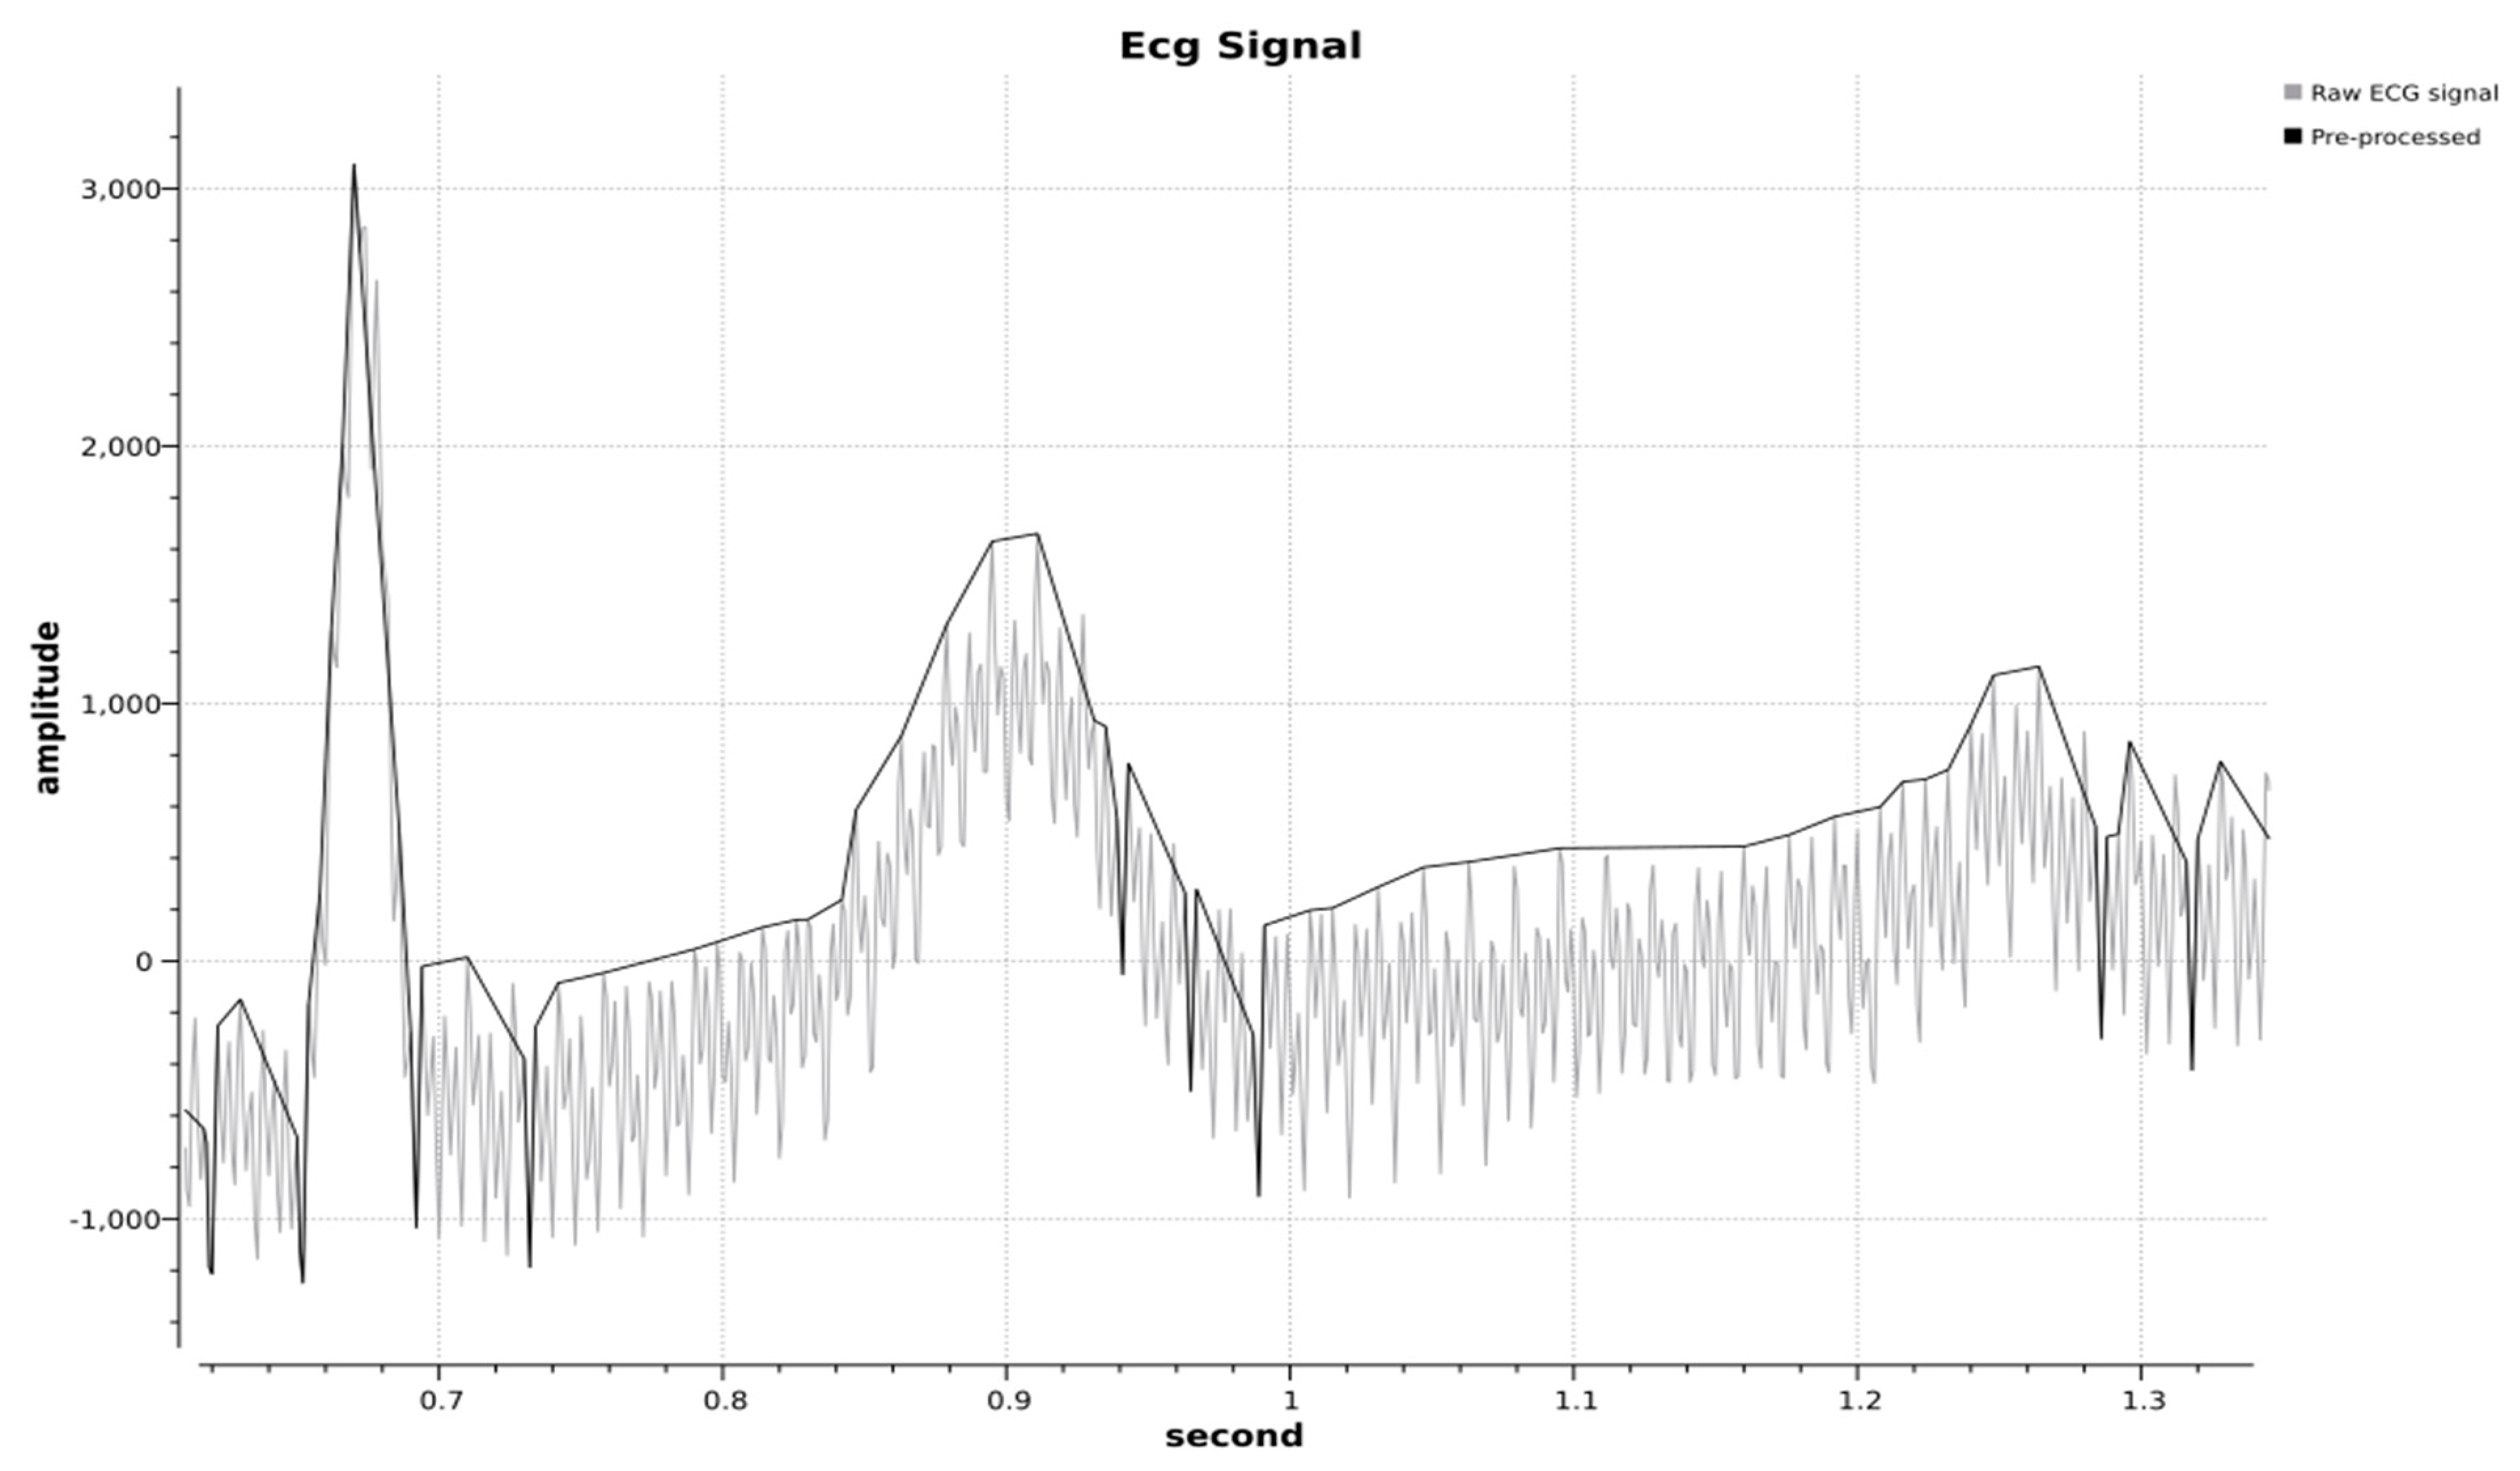
The vectorization process results in consecutive points containing both voltage and time data, which are stored in a linked list data structure. One benefit of the vectorization process is that it reduces noise based on the slope fluctuation. After vectorization, noise is further removed in a process that eliminates all small fluctuations that can be considered noise based on their amplitude and duration. All spikes of amplitude below 0.06Vpp and duration below 25 ms are eliminated by deleting all the corresponding data points within each spike period. Figure 4 presents the combined result of vectorization and noise removal.
2.3. Automata Recognizer
An ECG signal is reduced to 11 slope types after it is vectored. Then, the signal sequence of slopes is treated as a sequence of alphabetic symbols that can be recognized by a finite automata recognizer. Finite automata are abstract algorithms used to recognize sequences using a process commonly known as syntactic recognition. In this process, other ECG signal parameters (e.g., voltage level and time interval) become additional inputs. Figure 5 illustrates the automata transition diagram, and Table 2 shows the transition function.
The automata recognizer attempts to extract an R wave from an ECG signal. The automata remain in state N until suspecting to have detected an R wave. The automata enter the QR state once they begin to detect the high slope of an R wave. The signal slope would normally tend to decrease just after the peak of the R wave, at which point the automata enter the Ru state. The automata enter the Rd state when the slope of the signal becomes negative. The signal might oscillate between Ru and Rd near the peak of an R wave. An ECG signal will normally sharply decrease after reaching the R peak until it reaches a minimum (most negative) value, at which point the automata enter the RS state, following which they will finally switch into the Sp state, representing the acceptance of the R wave.
The transition function shows that the slope range analyzed over the wave segment in Figure 5a is sufficient for detection. The range could be reduced to make the process even faster; however, at present, we use the abovementioned range aiming for future developments. Furthermore, reducing the range might lead to a loss of signal features that would be useful for other applications. The number of automata states can also be simplified by combining Rd and Ru into one state; however, our development of the syntactic recognition method was simplified by keeping the states separate.
2.4. Probability Function
The automata recognizer produces one or more R peak candidate points. We apply the following probability function to eliminate any false positives:
where
- P = probability function of the next R peak;
- tn = time interval of the next R peak;
- = mean of the RR interval; and
- σ = standard deviation of the RR interval.
The final scores of each candidate are calculated as follows after obtaining a probability value for each R peak candidate:
The R peak candidate with the highest score is then selected as the detected R peak.
2.5. Evaluation Setup
We examined modified limb lead II (MLII) ECG signals necessary for long-term ECG recording to validate the proposed method. The MLII signals were obtained by placing the ground electrode at the left infraclavicular fossa, the negative electrode at the right infraclavicular fossa, and the positive electrode on the left lower abdomen or just beneath the last rib. We obtained the signal data from the Massachusetts Institute of Technology–Beth Israel Hospital Normal Sinus Rhythm (MIT–BIH NSR) database [12,13], which is an Open Data Commons Public Domain database. This database included 18 long-term ECG recordings of subjects referred to the Arrhythmia Laboratory at Boston’s Beth Israel Hospital. The subjects in the database had no significant arrhythmias and included five men aged 26 to 45 and 13 women aged 20 to 50.
We also tested the proposed method with the Fantasia database [12,13,14]. This database comprised 20 young (21–34 years old) and 20 elderly (68–85 years old) rigorously screened healthy subjects, who underwent 120 min of continuous ECG recording digitized at 250 samples per second. All subjects remained in a resting state in a sinus rhythm while watching the movie Fantasia (Disney, 1940) to help maintaining wakefulness.
We implemented the proposed method using C++ coding. We originally intended to feed the ECG data through an analog-to-digital converter into our long-term HRV monitoring system at 1000 samples per second; however, we developed a separate program for validation purposes. The input data of the validation program was formatted as a comma-separated value (CSV) format file generated from the MIT-BIH NSR and the Fantasia databases. To simulate the real implementation, we resampled the original signals from the datasets to 1000 samples per second using linear interpolation. The implementation was included in the real-time HRV analysis system, where the data were serialized. The client received the serial data, detected the R peak, sent the results to the server, and deleted the data. Hence, the client memory did not store a large amount of ECG data, and the computation time was not affected by the data serialization. We consider that the two evaluated datasets, which were resampled, can be considered as representative because a 1000-Hz sampling rate is commonly used for practical ECG recording.
We then tested the proposed method on the first 10,000 s of each record in the MIT-BIH NSR database and compared the results with the existing results from other studies. We excluded records #f1o07, #f2o05, #f2o08, #f2o10, and #f2y09 from the Fantasia database because they contained many arrhythmic beats with the negative peak deflection, which are considered as outliers for HRV analysis. The proposed method was tested on a 2.4 GHz Intel Core i7-4700HQ CPU, 12 GB-memory Windows 8.1 notebook. Windows 8.1 is a multi-tasking operating system that processes multiple tasks in addition to our program. Hence, we measured the elapsed time of our proposed method five times per record and calculated the mean value for each record. We also set our program to have the highest priority in the task manager of the operating system.
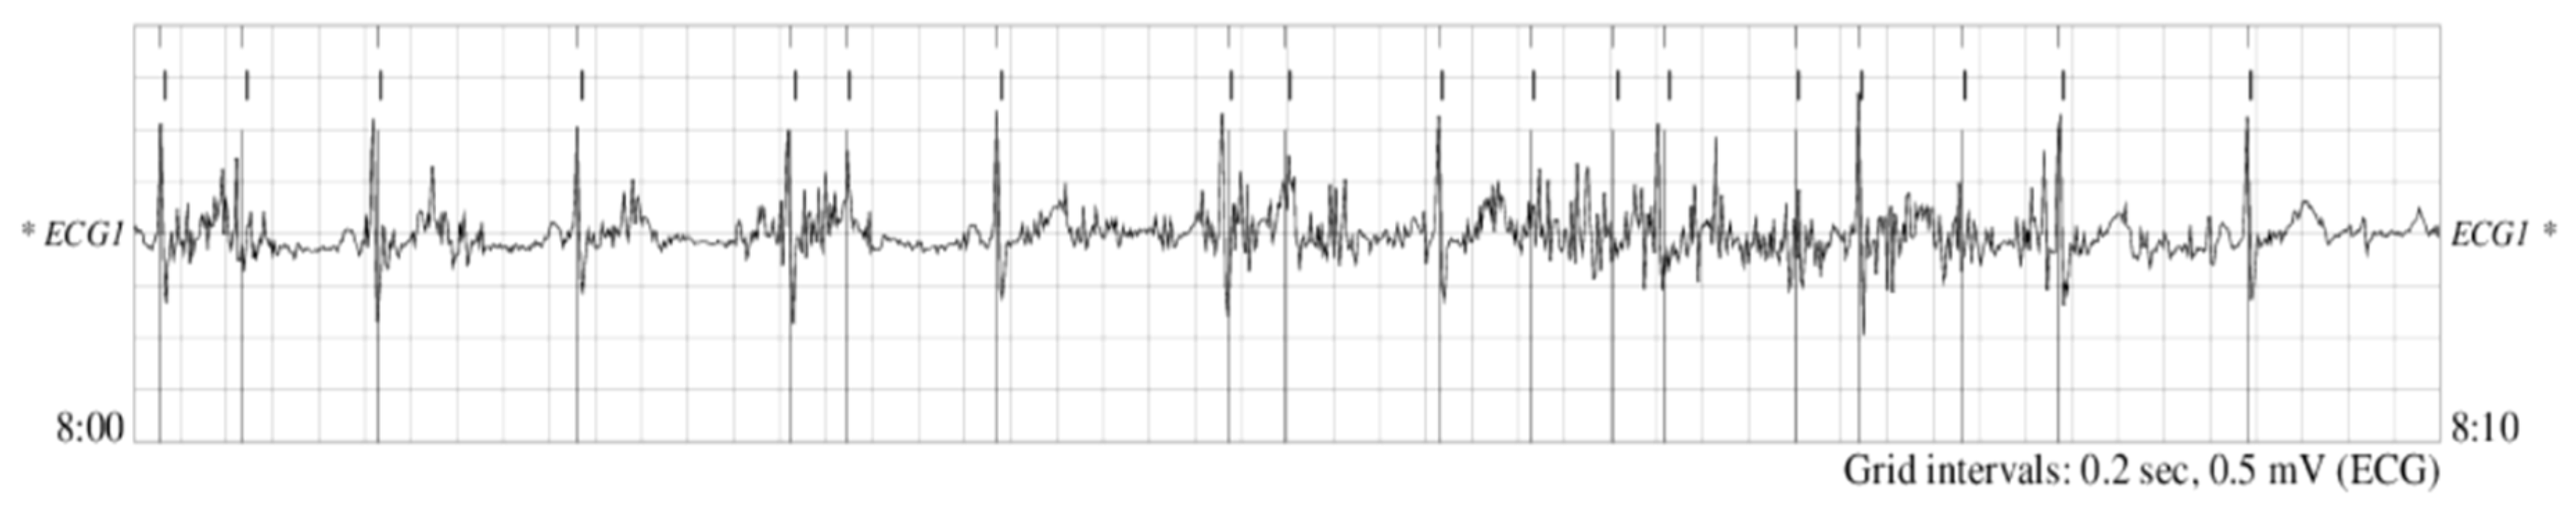
We focused on obtaining uninterrupted beats from the acquired ECG data. Thus, we included all signal series for the test with no exceptions. This allowed us to judge the detector’s ability to recognize unreadable signals caused by very-high amplitude noise, very-low signal amplitude, loss of signal, or a combination of these factors [15]. Such error signals were noted as “isolated QRS-like artefacts” instead of R peaks (Figure 6). We manually marked the R peaks and analyzed both signal types.
We evaluated the performance of the proposed method using four performance metrics: sensitivity (Se), which represents the ability of the algorithm to detect true R peaks; positive predictivity rate (PPR), which represents the ability of the algorithm to discriminate between true and false R peaks; detection error rate (DER), which is used to evaluate the total detection error over all R peaks; and accuracy (Ac), which is calculated as the proportion of correctly identified R peaks over all cases.
A true-positive (TP) occurred when an R peak was correctly detected by the proposed algorithm, whereas a false-negative (FN) occurred when an R peak was missed, and a false-positive (FP) occurred when noise was detected as an R peak.
3. Results
Table 5 and Table 6 present a comparison of the results obtained by the proposed method and other methods [16,17,18], from which the proposed method obtained the highest performance.
The average elapsed time for the R peak detection on the MIT-BIH NSR database was approximately 385 ms per 10,000 s at 1000 samples per second, resulting in a processing time per sample of approximately 38.5 ns. When tested using the Fantasia database, the total time for R peak detection over 249,746 s of recording was 12,672 ms at 1000 samples per second, resulting in a processing time per sample of approximately 36.2 ns.
4. Discussion
We propose a new method of detecting R peaks from acquired long-term ECG data for use in HRV analysis. The proposed method combines a syntactical with a statistical approach to address the problem of signal recognition. The use of a preprocessing step reduces the complexity of the syntactical recognition step, thereby making this inherently fast process even faster, and resulting in an overall process that is very fast and computationally efficient.
The performance of the method was verified using the MIT–BIH NSR and Fantasia databases. The results from the MIT–BIH NSR database showed that it had a sensitivity, positive predictivity rate, detection error rate, and accuracy of 99.998, 99.999, 0.003, and 99.996%, respectively. Meanwhile, the Fantasia database showed that it had a sensitivity, positive predictivity rate, detection error rate, and accuracy of 99.957, 99.991, 0.053, and 99.947%, respectively. The Fantasia database showed poorer results than the MIT–BIH NSR database because the proposed method failed to recognize the typical waveform that sometimes occurred in the database annotated as beats (Figure 7).
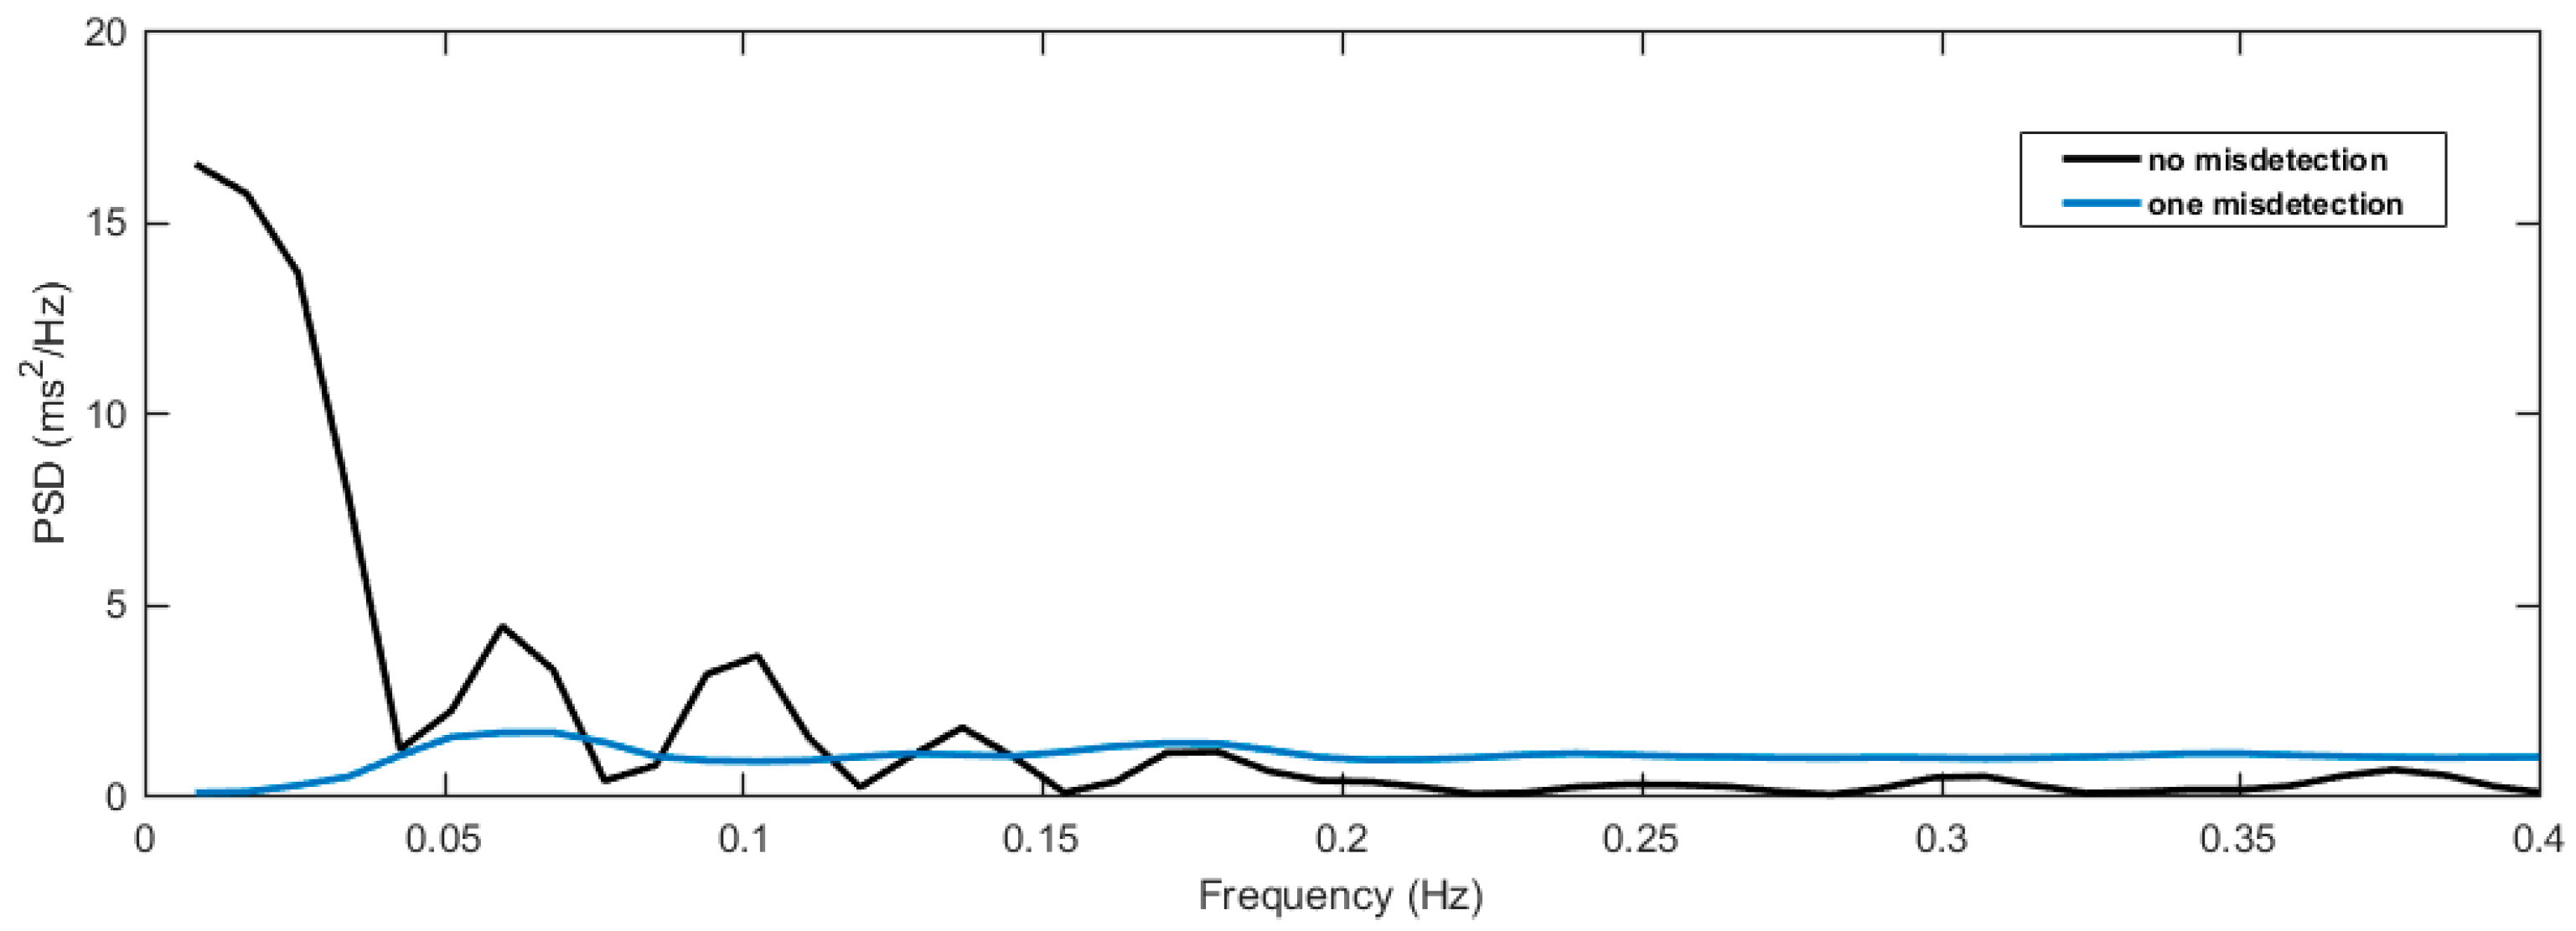
Figure 8 demonstrates a real example of the effect of R peak misdetection from the proposed method compared to the actual R peaks during HRV analysis. The misdetection occurred once in MIT–BIH NSR database record #19830 from 2670 s to 2700 s. We used a windows length of 30 s to show the difference of the HRV analysis with a single misdetection compared to that with no misdetection in the HRV frequency domain analysis. The misdetection greatly changed the frequency component compared to the actual NN interval without misdetection. Hence, the misdetection of the R peaks must be minimized in the HRV analysis.
The method needed 33.6 and 38.5 ns processing time per sample when tested with the MIT–BIH NSR and Fantasia databases, respectively. The records needed different processing times, but were evaluated with the same duration. Although the computation time needed in the preprocessing stage was proportional to the number n of data points, it had variations related to noise. In fact, a change in the signal slope can lead to a different branch in the preprocessing algorithm, which has a slightly different processing time compared to other branches.
The preprocessing stage resulted in m data points for the next stage, where m was lower than n. The computation time needed by the automata in the recognition stage was proportional to m. When evaluated with the MIT–BIH NSR and Fantasia databases, the average time needed for the preprocessing stage was approximately 86% of the total processing time, whereas the average of recognition stage needed approximately 14% of the total processing time. This observation confirmed that the preprocessing method reduced the time needed for the recognition of the R peaks. As a comparison, other methods use cascading FIR filters, each with a computation time of (m × n), where m is the kernel size and n is the data size. Such filters result in n data points for the next stage, followed by a relatively complex algorithm for R peak detection. A faster processing time means that the proposed method can be implemented on a more limited processor when compared to other methods.
The proposed R peak detection method was designed to exclusively measure the normal RR interval (or NN interval) for HRV analysis. Hence, using this method to detect arrhythmic beats presents limitations, especially when a negative deflection of the QRS complex occurs. Any improvement for recognizing all types of beat would, therefore, be challenging. As mentioned earlier, using other details to classify types of arrhythmias would be possible in future works because we preserved many ECG signal features during the preprocessing stage.
Author Contributions
T.I. conceived the experiments and contributed the analysis tools. D.P. designed and performed the experiments, analyzed the data, and drafted the manuscript. Both D.P. and T.I. approved the final manuscript.
Acknowledgments
The authors would like to express our gratitude to Jun-ichi Maehara and Saiseikai Kumamoto Hospital for cooperation and guidance in this study.
Conflicts of Interest
The authors declare no conflict of interest.
References
- Robinson, B.F.; Epstein, S.E.; Beiser, G.D.; Braunwald, E. Control of the heart rate by the autonomic nervous system in man on the interrelation between baroreceptor mechanisms & exercise. Circulation 1966, 19, 400–411. [Google Scholar]
- Camm, A.J.; Malik, M.; Bigger, J.T.; Breithardt, G.; Cerutti, S.; Cohen, R.J.; Coumel, P.; Fallen, E.L.; Kennedy, H.L.; Kleiger, R.E.; et al. Heart rate variability: Standards of measurement, physiological interpretation, and clinical use. Task for of the European society of cardiology and the North American society for pacing and electrophysiology. Circulation 1996, 93, 1043–1065. [Google Scholar]
- Acharya, U.R.; Joseph, K.P.; Kannathal, N.; Lim, C.M.; Suri, J.S. Heart rate variability: A review. Med. Biol. Eng. Comput. 2006, 44, 1031–1051. [Google Scholar] [CrossRef] [PubMed]
- Acharya, R.; Krishnan, S.M.; Spaan, J.A.; Suri, J.S. Advances in Cardiac Signal Processing; Springer: Berlin/Heidelberg, Germany, 2007. [Google Scholar]
- Pang, D.; Igasaki, T.; Maehara, J. Long-term monitoring of heart rate variability toward practical use in intensive/high care unit. In Proceedings of the 9th Biomedical Engineering International Conference (BMEiCON), Luang Prabang, Laos, 7–9 December 2016; pp. 1–6. [Google Scholar]
- Kleiger, R.E.; Stein, P.K.; Bosner, M.S.; Rottman, J.N. Time domain measurements of heart rate variability. Cardiol. Clin. 1992, 10, 487–498. [Google Scholar] [PubMed]
- Pruvot, E.; Thonet, G.; Vesin, J.M.; van-Melle, G.; Seidl, K.; Schmidinger, H.; Brachmann, J.; Jung, W.; Hoffmann, E.; Tavernier, R.; et al. Heart rate dynamics at the onset of ventricular tachyarrhythmias as retrieved from implantable cardioverter-defibrillators in patients with coronary artery disease. Circulation 2000, 101, 2398–2404. [Google Scholar] [CrossRef] [PubMed]
- Lombardi, F.; Porta, A.; Marzegalli, M.; Favale, S.; Santini, M.; Vincenti, A.; De Rosa, A. Implantable Cardioverter Defibrillator-Heart Rate Variability Italian Study Group. Heart rate variability patterns before ventricular tachycardia onset in patients with an implantable cardioverter defibrillator. Participating Investigators of ICD-HRV Italian Study Group. Am. J. Cardiol. 2000, 86, 959–963. [Google Scholar] [PubMed]
- Meyerfeldt, U.; Wessel, N.; Schütt, H.; Selbig, D.; Schumann, A.; Voss, A.; Kurths, J.; Ziehmann, C.; Dietz, R.; Schirdewan, A. Heart rate variability before the onset of ventricular tachycardia: Differences between slow and fast arrhythmias. Int. J. Cardiol. 2002, 84, 141–151. [Google Scholar] [CrossRef]
- Tsuji, H.; Venditti, F.J.; Manders, E.S.; Evans, J.C.; Larson, M.G.; Feldman, C.L.; Levy, D. Determinants of heart rate variability. J. Am. Coll. Cardiol. 1996, 28, 1539–1546. [Google Scholar] [CrossRef]
- Ozdemir, O.; Soylu, M.; Demir, A.D.; Topaloglu, S.; Alyan, O.; Geyik, B.; Kutuk, E. Increased sympathetic overactivity as cause of exercise-induced ventricular tachycardia in patients with normal coronary arteries. Texas Heart Inst. J. 2003, 30, 100–104. [Google Scholar]
- Goldberger, A.L.; Amaral, L.A.N.; Glass, L.; Hausdorff, J.M.; Ivanov, P.C.; Mark, R.G.; Mietus, J.E.; Moody, G.B.; Peng, C.K.; Stanley, H.E. PhysioBank, PhysioToolkit, and PhysioNet: Components of a New Research Resource for Complex Physiologic Signals. Circulation 2000, 101, e215–e220. [Google Scholar] [CrossRef] [PubMed]
- PhysioBank ATM. Available online: https://physionet.org/cgi-bin/atm/ATM (accessed on 30 November 2017).
- Iyengar, N.; Peng, C.K.; Morin, R.; Goldberger, A.L.; Lipsitz, L.A. Age-related alterations in the fractal scaling of cardiac interbeat interval dynamics. Am. J. Physiol. 1996, 271, 1078–1084. [Google Scholar] [CrossRef] [PubMed]
- PhysioBank Annotations. Available online: https://physionet.org/physiobank/annotations.shtml#noise (accessed on 30 November 2017).
- Sharma, L.D.; Sunkaria, R.K. A robust QRS detection using novel pre-processing techniques and kurtosis based enhanced efficiency. Measurement 2016, 87, 194–204. [Google Scholar] [CrossRef]
- Elgendi, M. Revisiting QRS detection methodologies for portable, wearable, battery-operated, and wireless ECG systems. PLoS ONE 2014, 9, e84018. [Google Scholar] [CrossRef] [PubMed] [Green Version]
- Pan, J.; Tompkins, W. A real-time QRS detection algorithm. IEEE Trans. Biomed. Eng. 1985, 32, 230–236. [Google Scholar] [CrossRef] [PubMed]
Figure 1.
A typical electrocardiography (ECG) waveform and RR interval.

Figure 2.
Block diagram of ECG signal processing.

Figure 3.
Vectorization process.

Figure 4.
Final result of the vectorization and noise-removal processes.

Figure 5.
(a) Relation of the ECG signal sequence to the automata states and other ECG parameters and (b) the automata’s state transition diagram.
Figure 5.
(a) Relation of the ECG signal sequence to the automata states and other ECG parameters and (b) the automata’s state transition diagram.

Figure 6.
Occurrence of the signal noted as an “isolated QRS-like artefact” in record #16272 [12,13,15].

Figure 7.
(a, b, and c) Typical waveforms, which sometimes occurred and were annotated as beats in the Fantasia database, but cannot be recognized by the automata as heartbeats [12,13,14,15].

Figure 8.
A single misdetection of the R peak results in wrong NN intervals, which can greatly modify the result of the frequency analysis of the HRV as compared to the actual analysis without misdetection.
Figure 8.
A single misdetection of the R peak results in wrong NN intervals, which can greatly modify the result of the frequency analysis of the HRV as compared to the actual analysis without misdetection.


Table 1.
Slope ranges used to vectorize the ECG data points.
| Symbol | Slope Range |
|---|---|
| Slope11 | slope ≥ 0.007Vpp |
| Slope10 | 0.007Vpp > slope ≥ 0.0056Vpp |
| Slope09 | 0.0056Vpp > slope ≥ 0.0042Vpp |
| Slope08 | 0.0042Vpp > slope ≥ 0.0021Vpp |
| Slope07 | 0.0021Vpp > slope ≥ 0.0007Vpp |
| Slope06 | 0.0007Vpp > slope ≥ −0.0009Vpp |
| Slope05 | −0.0009Vpp > slope ≥ −0.0027Vpp |
| Slope04 | −0.0027Vpp > slope ≥ −0.0054Vpp |
| Slope03 | −0.0054Vpp > slope ≥ −0.0072Vpp |
| Slope02 | −0.0072Vpp > slope ≥ −0.009Vpp |
| Slope01 | slope < −0.009Vpp |
Table 2.
Automata recognizer transition functions.
| Symbol | Function |
|---|---|
| a | |
| b | |
| c | |
| d | |
| e | |
| f | |
| g | |
| h | |
| i | |
| j |
Table 3.
Performance evaluation of the proposed method using the Massachusetts Institute of Technology–Beth Israel Hospital Normal Sinus Rhythm (MIT–BIH NSR) database. PPR: positive predictivity rate; DER: detection error rate; Se: sensitivity; Ac: accuracy.
Table 3.
Performance evaluation of the proposed method using the Massachusetts Institute of Technology–Beth Israel Hospital Normal Sinus Rhythm (MIT–BIH NSR) database. PPR: positive predictivity rate; DER: detection error rate; Se: sensitivity; Ac: accuracy.
| Record # | Total Beats | Se (%) | PPR (%) | DER (%) | Ac (%) | Processing Time (ms) |
|---|---|---|---|---|---|---|
| 16265 | 14,809 | 100 | 100 | 0 | 100 | 310 |
| 16272 | 10,485 | 100 | 100 | 0 | 100 | 413 |
| 16273 | 13,629 | 100 | 100 | 0 | 100 | 269 |
| 16420 | 13,555 | 100 | 100 | 0 | 100 | 253 |
| 16483 | 15,638 | 99.994 | 99.994 | 0.013 | 99.987 | 407 |
| 16539 | 11,952 | 100 | 100 | 0 | 100 | 383 |
| 16773 | 12,464 | 99.984 | 100 | 0.016 | 99.984 | 331 |
| 16786 | 12,222 | 100 | 100 | 0 | 100 | 296 |
| 16795 | 13,819 | 100 | 100 | 0 | 100 | 501 |
| 17052 | 11,496 | 100 | 100 | 0 | 100 | 338 |
| 17453 | 14,463 | 100 | 100 | 0 | 100 | 283 |
| 18177 | 14,900 | 100 | 100 | 0 | 100 | 510 |
| 18184 | 13,876 | 100 | 100 | 0 | 100 | 377 |
| 19088 | 15,332 | 100 | 100 | 0 | 100 | 527 |
| 19090 | 13,350 | 100 | 100 | 0 | 100 | 417 |
| 19093 | 11,663 | 100 | 100 | 0 | 100 | 286 |
| 19140 | 14,436 | 100 | 100 | 0 | 100 | 480 |
| 19830 | 18,925 | 99.903 | 99.995 | 0.103 | 99.898 | 47 |
| Mean | 13,272 | 99.993 | 99.999 | 0.007 | 99.993 | 385 |
Table 4.
Performance evaluation of the proposed method using the Fantasia database.
| Record # | Total Beats | Se (%) | PPR (%) | DER (%) | Ac (%) | Processing Time (ms) |
|---|---|---|---|---|---|---|
| f1o01 | 7169 | 100 | 100 | 0 | 100 | 386 |
| f1o02 | 6823 | 100 | 100 | 0 | 100 | 492 |
| f1o03 | 7728 | 100 | 100 | 0 | 100 | 545 |
| f1o04 | 6230 | 99.952 | 99.968 | 0.080 | 99.920 | 253 |
| f1o05 | 5730 | 100 | 100 | 0 | 100 | 341 |
| f1o06 | 6231 | 99.968 | 100 | 0.032 | 99.968 | 377 |
| f1o08 | 8488 | 99.976 | 99.976 | 0.047 | 99.953 | 325 |
| f1o09 | 4925 | 99.959 | 100 | 0.041 | 99.959 | 391 |
| f1o10 | 8241 | 100 | 100 | 0 | 100 | 369 |
| f1y01 | 8709 | 100 | 100 | 0 | 100 | 549 |
| f1y02 | 7035 | 100 | 100 | 0 | 100 | 493 |
| f1y03 | 7643 | 100 | 100 | 0 | 100 | 514 |
| f1y04 | 5511 | 100 | 100 | 0 | 100 | 248 |
| f1y05 | 6965 | 99.986 | 99.986 | 0.029 | 99.971 | 272 |
| f1y06 | 7086 | 99.958 | 99.972 | 0.071 | 99.930 | 262 |
| f1y07 | 5947 | 100 | 99.983 | 0.017 | 99.983 | 247 |
| f1y08 | 7289 | 100 | 100 | 0 | 100 | 541 |
| f1y09 | 8021 | 100 | 100 | 0 | 100 | 522 |
| f1y10 | 8693 | 100 | 100 | 0 | 100 | 412 |
| f2o01 | 7234 | 99.986 | 100 | 0.014 | 99.986 | 543 |
| f2o02 | 6372 | 99.984 | 99.953 | 0.063 | 99.937 | 548 |
| f2o03 | 6541 | 100 | 100 | 0 | 100 | 274 |
| f2o04 | 6902 | 100 | 100 | 0 | 100 | 441 |
| f2o06 | 5249 | 100 | 100 | 0 | 100 | 264 |
| f2o07 | 5891 | 100 | 100 | 0 | 100 | 202 |
| f2o09 | 6072 | 99.951 | 99.967 | 0.082 | 99.918 | 276 |
| f2y01 | 8042 | 99.923 | 100 | 0.037 | 99.963 | 333 |
| f2y02 | 6574 | 100 | 100 | 0 | 100 | 215 |
| f2y03 | 6807 | 100 | 100 | 0 | 100 | 230 |
| f2y04 | 8603 | 99.977 | 99.988 | 0.035 | 99.965 | 540 |
| f2y05 | 9244 | 99.838 | 99.989 | 0.173 | 99.827 | 278 |
| f2y06 | 6851 | 100 | 100 | 0 | 100 | 167 |
| f2y07 | 6506 | 100 | 100 | 0 | 100 | 214 |
| f2y08 | 7249 | 99.724 | 99.917 | 0.360 | 99.642 | 368 |
| f2y10 | 7113 | 99.859 | 99.972 | 0.169 | 99.831 | 240 |
| Mean | 13,272 | 99.957 | 99.991 | 0.053 | 99.947 | 362 |
© 2018 by the authors. Licensee MDPI, Basel, Switzerland. This article is an open access article distributed under the terms and conditions of the Creative Commons Attribution (CC BY) license (http://creativecommons.org/licenses/by/4.0/).
Share and Cite
MDPI and ACS Style
Pang, D.; Igasaki, T. A Combined Syntactical and Statistical Approach for R Peak Detection in Real-Time Long-Term Heart Rate Variability Analysis. Algorithms 2018, 11, 83. https://doi.org/10.3390/a11060083
AMA Style
Pang D, Igasaki T. A Combined Syntactical and Statistical Approach for R Peak Detection in Real-Time Long-Term Heart Rate Variability Analysis. Algorithms. 2018; 11(6):83. https://doi.org/10.3390/a11060083
Chicago/Turabian StylePang, David, and Tomohiko Igasaki. 2018. "A Combined Syntactical and Statistical Approach for R Peak Detection in Real-Time Long-Term Heart Rate Variability Analysis" Algorithms 11, no. 6: 83. https://doi.org/10.3390/a11060083
Note that from the first issue of 2016, this journal uses article numbers instead of page numbers. See further details here.