
Exploring Virtual Environments to Assess the Quality of Public Spaces

1
COSYS-GRETTIA, University Gustave Eiffel, F-77447 Marne-la-Vallée, France
2
Department of Civil, Chemical, Environmental, and Materials Engineering (DICAM), University of Bologna, 40126 Bologna, Italy
*
Author to whom correspondence should be addressed.
Algorithms 2024, 17(3), 124; https://doi.org/10.3390/a17030124
Submission received: 31 January 2024
/
Revised: 13 March 2024
/
Accepted: 15 March 2024
/
Published: 16 March 2024
(This article belongs to the Special Issue Algorithms for Virtual and Augmented Environments)
Abstract
:Human impression plays a crucial role in effectively designing infrastructures that support active mobility such as walking and cycling. By involving users early in the design process, valuable insights can be gathered before physical environments are constructed. This proactive approach enhances the attractiveness and safety of designed spaces for users. This study conducts an experiment comparing real street observations with immersive virtual reality (VR) visits to evaluate user perceptions and assess the quality of public spaces. For this experiment, a high-resolution 3D city model of a large-scale neighborhood was created, utilizing Building Information Modeling (BIM) and Geographic Information System (GIS) data. The model incorporated dynamic elements representing various urban environments: a public area with a tramway station, a commercial street with a road, and a residential playground with green spaces. Participants were presented with identical views of existing urban scenes, both in reality and through reconstructed 3D scenes using a Head-Mounted Display (HMD). They were asked questions related to the quality of the streetscape, its walkability, and cyclability. From the questionnaire, algorithms for assessing public spaces were computed, namely Sustainable Mobility Indicators (SUMI) and Pedestrian Level of Service (PLOS). The study quantifies the relevance of these indicators in a VR setup and correlates them with critical factors influencing the experience of using and spending time on a street. This research contributes to understanding the suitability of these algorithms in a VR environment for predicting the quality of future spaces before occupancy.
1. Introduction
This article focuses on the research of a practical application that combines the human perspective with virtual reality technology to assess and understand public spaces for the purpose of enhancing their design and functionality. By public spaces we mean two types of urban realm: sidewalks—which are often contiguous to a road network and mixed with cycling infrastructure—and public places—which include gathering places and parks.
User experience and perception assessment involves capturing and analyzing how users perceive and experience public spaces; it includes factors such as aesthetics, safety, accessibility, and overall satisfaction. A human-centric approach considers the experiences, perceptions, and needs of individuals who use or interact with public spaces. It is traditionally conducted through surveys with an on-street questionnaire, which asks people walking and spending time on a street about how they perceive the street. It is a more reliable method since the participants are inside the physical environment but it can be costly and time-consuming.
It can also be done through the exploitation of street view imagery, such as Google Street View, which can be panoramic, or through the use of more personalized videos or still image acquisitions of the scene to be assessed. These types of methods of public space auditing cannot be done for prospective projects not yet constructed, but their methodology can be useful to assess future designs based on 2D drawings or VR setups. The utilization of VR technology suggests a forward-looking and technologically advanced approach to public space assessment. This can provide a more immersive and interactive experience for participants compared to traditional assessment methods.
The study may involve collecting data on user interactions and preferences within the virtual environment. Analysis of this data, through algorithms leading to high-level indicators, can contribute to insights into how people respond to different elements of public spaces. Findings from such assessments could have implications for the design and planning of public spaces, influencing decisions related to architecture, landscaping, and overall urban design. Indeed, the use of VR for public space assessment allows for potential applications in pre-occupancy evaluations, allowing planners and designers to anticipate the impact of proposed designs before physical implementation.
2. Literature Review
2.1. Related Works
Various approaches have been developed to evaluate the suitability of public areas for walking or cycling, primarily focusing on built environments like sidewalks and public places, which are the two main categories of “Public Spaces”. Insights gained from research on these subjects have been employed to create assessment methods intended to assist in developing strategies to promote non-motorized transportation and improve the overall quality of life. Previous studies have demonstrated that the design of built environments and people’s perceptions of them significantly influence individuals’ walking habits, a crucial aspect of neighborhood residents’ active lifestyles [1,2]. Table 1 provides a classification of our literature review based on five modalities: traditional field surveys, static virtual environments, static street view panoramic images, dynamic virtual environments (i.e., with traveler flows), and recorded panoramic videos of real environments.
The majority of research in this field employs subjective measurements to understand individuals’ perceptions of walkability at the neighborhood level. Broadly speaking, these methods consider various factors related to the streetscape that contribute to categorizing a specific road section or area as safe and comfortable for walking or cycling, often represented by a numerical score. In the context of walking, this evaluation is commonly referred to as “walkability”, while terms such as “bikeability” or “cyclability” are found in the existing literature when assessing cycling suitability.
One common method for assessing the comfort and safety of pedestrians is the Pedestrian Level of Service (PLOS) derived from the Highway Capacity Manual. Originating from the vehicular Level of Service (LOS), PLOS treats walking as a mode of transport and correlates pedestrian traffic characteristics with network capacity.
Jaskiewicz [3] computes walkability indicators, including the complexity of spaces and paths, buffering between pedestrians and traffic, presence of shade, and overhangs. We used his method, called the PLOS Trip Quality Method, as a reference in this article, but other PLOS algorithms exist in the literature.
Karatas and Tuydes-Yaman [4] investigated the variability in sidewalk Pedestrian Level of Service measures and ratings. Their paper highlights the lack of consensus and consistency in PLOS methods, comparing 29 different methods used in summarizing sidewalk PLOS studies. The assessments, based on pedestrian opinion and traveler perceptions, focus on traffic, safety/comfort, land use, infrastructure, and user/trip. The study evaluates 81 walkway locations on a campus in Ankara, Turkey, using two trained raters who assessed the campus as if it were a city street to minimize bias.
Another important aspect of urban streetscape is bikeability as walking and cycling are often mixed in urban areas. To optimize cycling facilities, an accurate representation of the bicycle system is essential. The Bicycle Level of Service (BLOS) serves as a quantitative measure, categorizing users’ perspectives on bicycle facilities and services. Assessing BLOS is complex, primarily due to the significant role of comfort, which necessitates a delicate balance between individuals and their environment. This balance is shaped by physical, psychological, and sociological factors, resulting in a highly personalized evaluation dependent on individual characteristics. Key considerations in defining BLOS include bikeability, suitability, bicycle friendliness, bicycle flow, and bicycle comfort [5].
For example, Beura et al. [6] proposed a BLOS approach that incorporates factors such as effective road width, crossing pedestrian volume, volume of turning vehicular traffic across cyclists’ paths, average stopped time delay for through cyclists, on-street parking turnover, surrounding developmental patterns, and peak-hour volume.
Resch et al. [7] proposed an interdisciplinary mixed-methods approach to analyze urban spaces, focusing on walkability and bikeability. The study emphasizes the importance of understanding people’s perceptions and reactions to their environments, considering factors such as traffic volume, noise, safety, urban configuration, and greenness. The methodology involves using objective data from wearable physiological sensors, an e-diary app, first-person perspective videos from a chest-mounted camera, referenced interviews, and post-hoc surveys. The approach focuses on identifying and geolocating moments of stress and relaxation for pedestrians and cyclists in city centers.
Ewing et al. [8] addresses the challenging dimension of street design/landscape in walkability assessment. The book categorizes features into imaginability, visual enclosure, human scale, transparency, and complexity. Ewing et al.’s research evaluates the impact of street landscape on walkability compared to other dimensions, including diversity, density, destination accessibility, distance to transit, and demography.
Others study some aspects at a smaller scale within neighborhoods, employing various assessment tools to understand how neighborhood characteristics influence people’s perceptions of walkability in empirical studies [9].
Existing tools for auditing public spaces often require time-consuming onsite fieldwork, surveys, focus groups, and document analysis, making them labor-intensive. The use of images has become a common and cost-effective approach to assess the aesthetic qualities of built environments. Compared to traditional methods, VR environments offer more dynamic and integral impressions, allowing respondents to perceive walkability dynamically with a sense of realism and experience [10].
Liao et al. [11] opted to gauge users’ perceptions of walkability through recorded videos simulating neighborhood environments at the pedestrian’s eye level. Belaroussi et al. [12] also used recorded videos of the virtual environment created under two scenarios, the current situation and the future situation after the redevelopment of a sidewalk, in order to assess possible improvements in walkability and bikeability. An advantage of this approach is that participants can gain an integrated view of the environment from the comfort of their homes, as videos do not require the complex setup necessary for a head-mounted display. The chosen scale for measurement is a street block, deemed an appropriate unit for mapping urban structures [13].
Oselinsky et al. [14] explored the acceptability of virtual reality assessment for walking in a virtual environment, particularly for pre-occupancy urban designs impacting walking. The study employed a wearable VR head-mounted display with a backpack computer, allowing young adults () to freely walk through a large indoor gymnasium while virtually navigating a model of a modifiable urban streetscape. Participants strolled through a modifiable VR model of four city blocks in the historic downtown area of a mid-sized city in the western US at their chosen speed. Following the VR session, participants completed a survey covering VR adjustment, cybersickness, virtual realism, equipment comfort, controller usability, immersion, perceived safety, environment attractiveness, and perceived task difficulty.
Keil et al. [15] investigated the utilization of electrodermal activity wristband sensors with an HMD to measure skin conductance level and correlate it with specific urban planning scenarios, including trucks passing by, traffic noise levels, and traffic density. The study involved a small sample of six participants in a virtual environment.
The 360-degree video represents a relatively innovative technology for environmental observation, auditing, and modeling [16]. Previous studies, such as [17,18], have employed recorded real environments in the form of 360° panoramic videos. Participants were guided through virtual tours using a head-mounted display. The advantage of VR audits becomes more pronounced with the size of the study area. However, conducting research with HMDs can pose challenges when dealing with a large number of participants. For example, Kim et al. [17] involved a 10-person expert panel, and Mouratidis et al. [18] included 28 students who audited four streets and four public places. While Mouratidis’ findings on perceptions of architectural styles are relatively straightforward, conclusions regarding perceptions of public space design, overall perceptions of public space, and affective appraisals of public space suggest dependencies on various factors rather than specific design features.

Table 1.
Studies of public space quality classified by modality of audit.
| Ref | Modalities | Methodology | Objectives |
|---|---|---|---|
| [3] | Onsite inspection of comfort and safety | Nine PLOS measures are proposed based upon aesthetics, safety, and ease of movement | Account for aesthetics and safety in addition to volume and capacity |
| [8] | Onsite field survey | Visual assessment of urban design qualities | Provide operational definitions and measurement protocols |
| [7] | Onsite physiological measurements and georeferenced interviews | Combine geospatial analytics and analysis of physiological signals | Localization of stress and relaxation hotspot in urban areas |
| [6] | Onsite bicyclist survey | Functional method to model BLOS based on infrastructure geometry and traffic flow | Analyze bicycle service quality at intersections |
| [11,12,19] | Recorded video of static Virtual Environments | Analysis of online questionnaires on perception of walkability | Study of infrastructure attributes and identification of best designs |
| [14] | HMD walkable visit of static Virtual Environments | Post-experience survey on acceptability of VR | Determine the suitability of VR setup: cybersickness, realism |
| [20] | Street view panoramic images and field audit | Intraclass correlation coefficient of field visits and street view questionnaire surveys | Compare assessments using Google Street View and field visits |
| [21] | HMD with panoramic images of real environment and Street view panoramic images | Statistical analysis of questionnaires on streetscape satisfaction | Compare landscape evaluation based on HMD or 2D-screen panoramic images |
| [10] | Dynamic Virtual Environments in HMD on a bicycle simulator or still images | Participants rating of cycling infrastructures based on aesthetic, safety and mode choice | Test cyclists’ environmental preferences in HMD versus still images |
| [15] | HMD visit of dynamic Virtual Environments with physiological measurement | Analysis of skin conductance level | Fear and stress response to scenarios (traffic density and noise) |
| [18] | HMD with recorded 360° panoramic videos of real environment | Questionnaire survey on affective appraisal and environmental perception | Evaluations of contemporary versus traditional design styles in architecture and urban design |
| [17] | HMD with recorded 360° panoramic videos of real environment, street view images and field audit | Post hoc interview and questionnaire survey of experts analyzed by intraclass correlation coefficient | Examines whether immersive visits can replace field audits |
| [22] | HMD of recorded real environments in 360° panoramic videos and recorded videos of real environments | Questionnaire on infrastructures and walking willingness of diverse street environments in multiple nations | Characteristics of 360° cameras and HMD for streetscape evaluation |
| [23] | HMD with recorded 360° panoramic videos of real environment and field audit | Questionnaire related to aesthetic preference and landscape cognition | Agreement of on-site observation and VR stimulus in terms of public perception |
2.2. Contributions of the Research
Although it is increasingly used to assess natural or urban landscapes, the validity of virtual reality in this particular case has been little explored. Few comparative studies exist. The oldest [20] compares the assessment of walkability using Google Street View, the point of view of local residents, and field visits based on 90 participants. The authors conclude that these three methods provide correlated results for traffic safety, aesthetics, sidewalk quality, and physical barriers, but that the Google Street View assessment is the most correlated with the assessment by locals. This result suggests that video is a good evaluation tool that deserves to be compared with immersive virtual reality.
Nakamura et al. [22] compared dynamic video with a fixed view to a 360° immersive dynamic video viewed through a headset. The same 50 individuals were confronted with both conditions but the order of presentation was counterbalanced. His results show a more favorable evaluation of walkability in the immersive condition.
Shi et al. [23] compared the immersive virtual reality condition () with the site visit condition () but the evaluation carried out focused more on the beauty and other appearance attributes of 11 landscapes. In this protocol, different people were placed in each of the conditions. The very similar results obtained in the two conditions prompted the authors to propose replacing the gold-standard on-site visit with virtual reality for reasons of efficiency. Finally, ref. [21] compared Google Street View images for a web-based administration of streetscape evaluation to an evaluation following an immersive virtual reality visit. In this study, 25 participants evaluated the two situations 7 days apart. They concluded that the VR-based streetscape evaluation method has better explanatory power than the web-based streetscape evaluation method. We aim to scrutinize this assertion using dynamic scenes and virtual environments.
Sustainable development issues encourage the design of spaces conducive to the use of active modes, which are defined in the literature as having good walkability and cyclability. Research has shown that these two characteristics are closely linked to how the spaces are perceived by their users [1,2]. It is therefore entirely appropriate to look at ways of taking users’ points of view into account, both in the indicators to be used and in the methods of visualizing the spaces to be assessed. In this research, we use existing indicators (SUMI and PLOS), which we combine with other indicators such as the feeling of safety and relaxation, the perception of activities to be carried out in the space, and overall perceptions of the suitability of these spaces for walking and cycling in general and a behavioral intention to walk or cycle in these spaces.
One of the central challenges associated with the evaluation of spaces by their likely users is to get as close as possible to an evaluation following an on-site visit or by local people, which is the gold standard [23]. There is no longer any need to prove that these methods are costly and impossible in the case of the rehabilitation of a site that does not yet exist in reality. Virtual reality is, therefore, a promising alternative since the visual information in VR corresponds to that experienced in the real world, where the visual scene is updated with head movements.
Unfortunately, research into the validity of virtual reality in the assessment of landscapes or streetscapes has been reduced to very little. The literature has shown that video can advantageously replace on-site visits [21], particularly when they are offered with the possibility of a 360° view using virtual reality headsets [22]. As can be seen in Table 1, virtual visits to real environment have already been compared to on-site visits [23] or to static images via Google Street View [20] but public space auditing of real places was never compared to immersive visits in virtual environments. Our aim is therefore to test and compare two ways of visualizing a space that have never been compared. Specifically, we will compare on-screen videos in which the participant does not control image rotation by head movements, with dynamic virtual reality scenes in an HMD. We will seek to answer the following questions.
- How relevant of a tool is Virtual Reality-Immersive Visit (VR-IV) for prospective public space auditing?
- Is the order in which the proposed urban areas are classified according to the various indicators selected the same when the spaces are viewed with video or VR?
- Are there any significant differences between the qualification of a public space in a real video and VR-IV?
These answers will enable us to formulate recommendations for designers and evaluators concerning the use of virtual reality in the case of new projects to ensure that a space meets sustainability expectations.
3. Materials and Methods
3.1. Case Study
Figure 1 illustrates the map of the future district of interest with its building’s footprint, its road network, and the location of various activities: Home, Work, Education, Shopping, Leisure, and a public transportation hub. The figure shows the urban and landscape framework planned for LaVallée; the site has all the assets for experimenting with a form of town planning attentive to the nature/city relationship, producing an exemplary living environment a few minutes from Paris, France. Three urban identities are present in the district: The outdoor Shopping mall with a more intense and active life, a Public place as an entry point to the district, and Living in a green environment with more leisure places. All these urban fabrics form as many identities as the neighborhood will reveal.
A portion of the neighborhood that has already been developed is the focus of this experiment. This includes the public space situated to the south of the district, serving as the primary entrance due to the presence of the tram station. Additionally, the shopping street, lined with stores primarily along the main road extending from the north to the south of the district, is examined. Perpendicular to the shopping street, there is a pedestrian walkway known as LaVallée’s Garden—a public area mainly designated for recreational activities, marked by green circles, featuring abundant vegetation and children’s playground activities.
These three points of interest will be investigated through two different modalities: real-time video footage portraying the current state of the built environment, and immersive visits displayed on a head-mounted display, such as the HTC VIVE, allowing for virtual reality exploration of these public spaces.
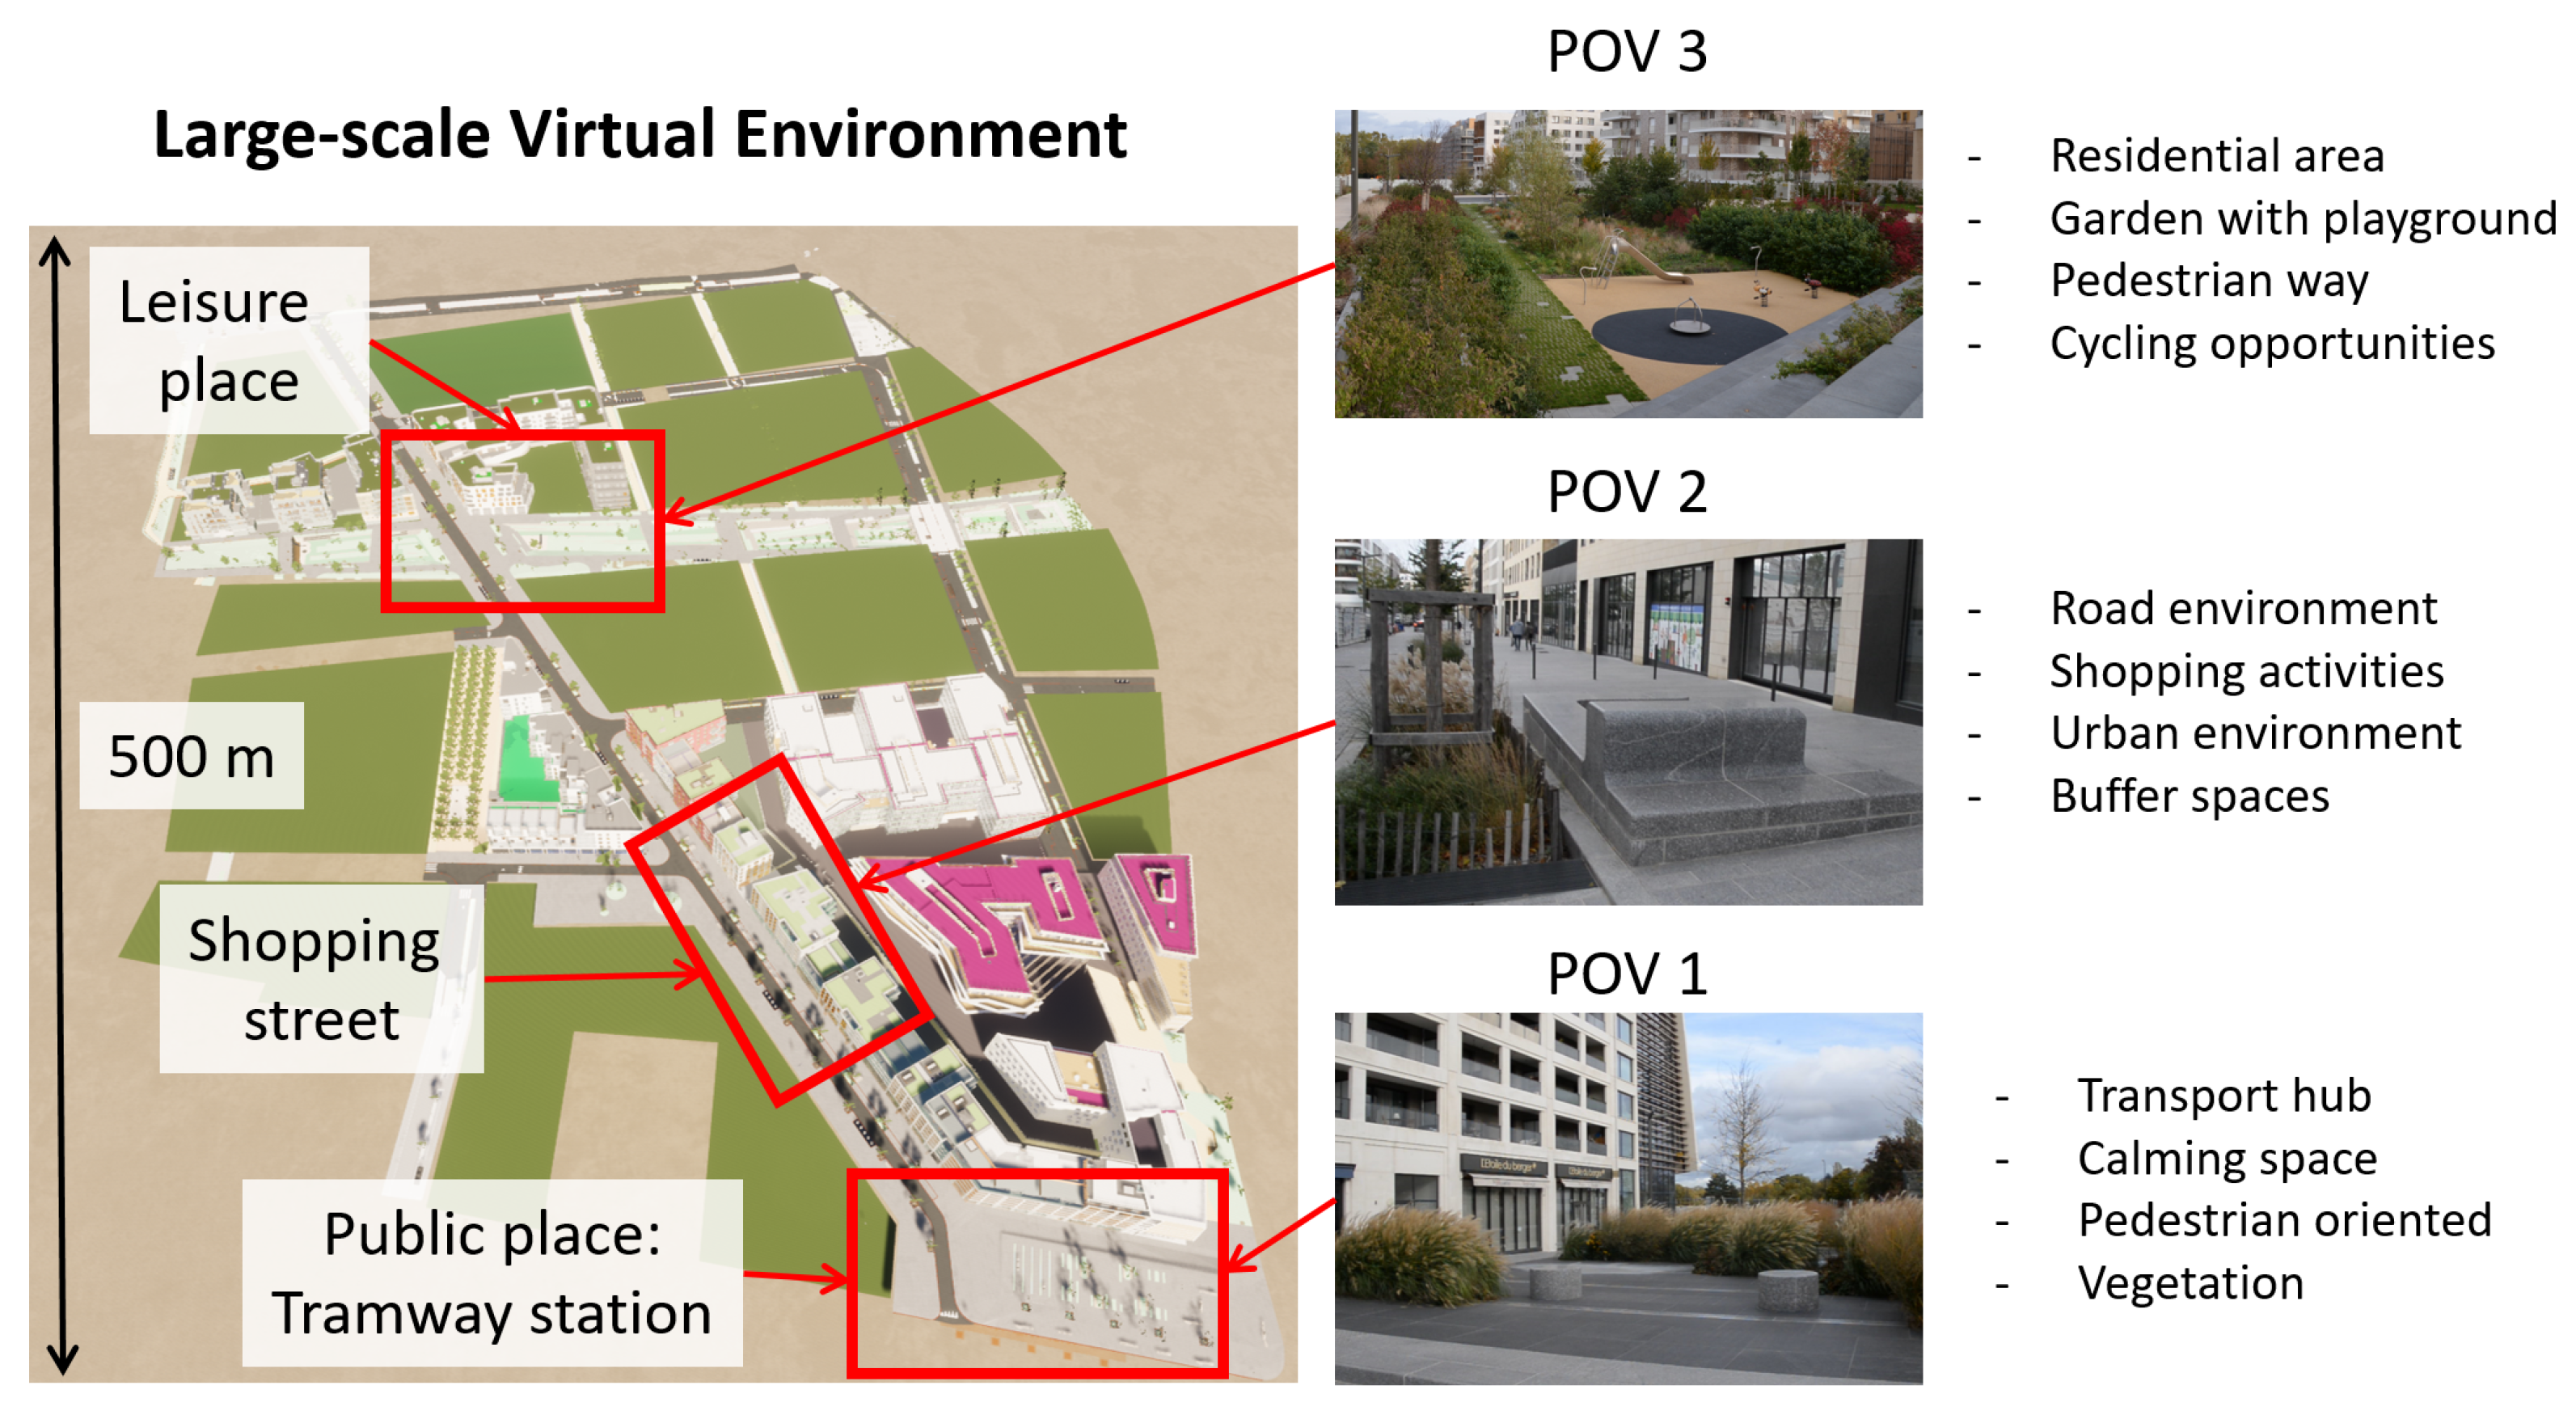
Three Points Of View (POV) were selected in this digital twin of LaVallée, representing various aspects of urban areas. POV 1 is a public place and is the main entry point to the district. It includes a tramway station and a pedestrian walking space with vegetation.
POV 2 is a strip mall. It is the central artery of LaVallée and the main line to the majority of shopping activity. Along this stretch of boulevard are stores and restaurants in adjacent spaces in one long building with a narrow parking area directly in front of the stores and a central road for vehicles limited at 30 km/h.
POV 3 is a green space with a children’s playground in the middle of the pedestrian way surrounded by some residential buildings. It is one of the leisure places of the district with a lot of vegetation and, to some extent, includes cycling opportunities.
The attention paid to the ground floors is essential in the constitution of an animated and lively district. Since we are collaborating with the real-estate programmer, we have access to the BIM data of the buildings: from them, a 3D city model was built. The 3D city models depict both natural and man-made spatial elements, such as buildings, roads, and vegetation, in the three-dimensional space. Key factors determining the quality of a 3D city model include its completeness, the precision of object locations in space, and the level of detail (LOD). The LOD measures the accuracy with which 3D objects represent intricate visual details of the corresponding spatial elements [24]. We used static BIM data with a high LOD for buildings, streets, vegetation, and urban furniture, complemented by GIS data to model the urban context and non-yet-existing buildings and for the tramway station. We populated the 3D scenes with dynamic elements such as non-playing characters: walkers, cyclists, and vehicles. Details about this 3D city model can be found in [25], which was built using Revit 2020 for BIM data integration, Infraworks 2022 for the GIS data, and TwinMotion 2022.2.3 for the visualization and addition of dynamic elements.
3.2. Methodology
3.2.1. Procedure
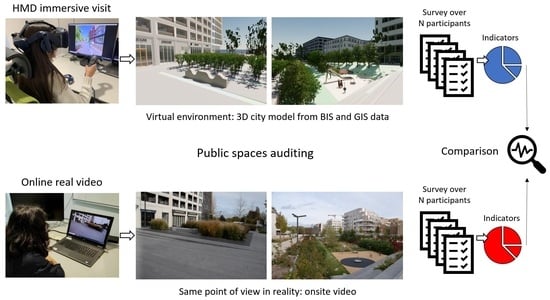
For each POV, participants perform an immersive visit with an HTC VIVE head-mounted device followed by an online questionnaire, which they can access from a provided computer. Then, they watch the video of the real POV and answer the same set of questions. The experimental protocol is illustrated by Figure 2.
The experiment begins with the following simple explanations and instructions:
“In this study we are focused on the auditing of an urban district through selected scenes. The scenes are provided using videos of the district and the same scenes will be displayed through a head mounted device (Virtual reality glasses). The participation is anonymous and the whole survey will take you about 30 min.
You will be shown three scenes of areas in the district and will then be asked questions related to the quality, walkability and liveability of the area.
This opinion survey may be published in a research paper: by completing it, you voluntarily consent to the processing and publication of your data.”
We have chosen to follow the experimental protocol proposed in [26] without providing specific definitions of urban space auditing to the participants. They have not been trained in the various subjective characterizations of urban spaces presented in the questionnaire, to avoid biasing their judgments.
The questionnaire consists of three identical parts, one for each POV, each featuring a VR-Immersive Visit (VR-IV) and a 1 min video of the same real scene acquired on-site. Participants are asked to imagine visiting the depicted space and respond to a set of questions. In our study, these questions are related to the real scene and the VR-IV of a 3D city model created from professional BIM data. Participants are encouraged to reflect on their feelings and evaluate the public nature of the urban space, the intended usage of the public space, and their impressions of walkability and cyclability during these virtual visits and during the display of real videos.
3.2.2. Sample
The voluntary participants consist of adults from the University Gustave Eiffel (France) not involved in the LaVallée real estate project. A total of non-expert participants were included in this study with the only inclusion criteria being to be an adult. They all completed both the survey using the HMD and the reality videos. The participants are equally balanced in terms of gender: half male, half female. Most of them were aged between 22 and 30 years old; 73% were students, the remaining 27% being researchers. Personal questions were limited to age, gender, and occupation as the questionnaire was anonymous.
3.3. Measures: Indicators of Public Spaces Quality
To draw a comparison between the quality of the public spaces assessed by the users, a qualitative survey would only act to provide a surface understanding. To investigate a comparison between videos of the existing spaces and immersive visits of their digital models, a quantitative approach would allow for a more holistic statistical analysis. Many indicators can be used to assess the quality of public spaces, focusing on prime aspects such as the use of public transport, the driving experience in the areas, the bicycle level of service, etc. Due to our focus being primarily on the pedestrian experience in public spaces, and our points of view both virtually and in the videos placing participants at a pedestrian level, the indicators chosen had to coincide with this and assess the overall pedestrian experience within these areas. Thus, the indicators chosen for the assessment were the Pedestrian Level of Service (PLOS)—Trip Quality Method [3,4] and the Sustainable Urban Mobility Indicator (SUMI) for public space assessment [27].
3.3.1. Pedestrian Level of Service PLOS—Trip Quality Method
In general, the pedestrian level of service is a quantifiable measure that is typically prioritized in the assessment of public spaces and their pedestrian–environment interaction. PLOS can be measured both qualitatively and quantitatively using a multitude of methods and permits quantifying comfort and safety levels of existing and planned walkways allowing objective and sound evaluations of pedestrians’ perception and response to roadway environment. Although the methods to analyze the pedestrian level of service are vast, a limitation is that it had to match the prompt of the experiment and thus had to be applicable to both a virtual environment and a static video of the real environment. The Trip Quality Method (TQM) [3] was thus chosen.
The method allows raters to qualitatively rate a walkway from a pedestrian’s perspective in regards to pleasantness, safety, and comfort using nine measures: enclosure/definition, complexity of the path network, building articulation, complexity of spaces, transparency, buffer, shade trees, overhands/awnings/varied roof lines, and the physical component/condition. For each of these factors, a score between 1 (very poor) and 5 (excellent) was assessed; afterward, the arithmetic average was taken to obtain a final score on the pedestrian level of service [4]. Additionally, [3] specified that the method is best served for city streets, shopping areas, and working spaces, all of which characterize the three points of view selected for the experiment.
Unfortunately, not all nine measures are relevant to the experiment, as the experiment’s static nature does not allow for the sufficient testing of certain factors. Due to the method’s simplistic arithmetic nature, we were able to effectively manipulate by extracting the four most relevant characteristics and having our participants rate those on the same scale previously mentioned, and then calculating their arithmetic average to obtain a final score out of five, considered the pedestrian level of service. This score is later weighed with a letter grade based on the following conversion table.
- LOS A = 4.0 to 5.0 = Very Pleasant;
- LOS B = 3.4 to 3.9 = Comfortable;
- LOS C = 2.8 to 3.3 = Acceptable;
- LOS D = 2.2 to 2.7 = Uncomfortable;
- LOS E = 1.6 to 2.1 = Unpleasant;
- LOS F = 1.1 to 1.5 = Very Unpleasant.
The four factors studied in the experiment are the complexity of the path network, complexity of spaces, buffer areas, and shade and trees. In terms of complexity in the path network, the factor focuses on the path network being complete and easy to understand. This means that from being in a static position, the user is not confused by the path network and does not feel as though it is poorly connected. Thus, to quantify this factor in a way that is easily comprehensible for the general participant (as the participants are not required to have a level of prior knowledge in the subject), the question used was “How simple is it to understand the pedestrian path network in the area?”.
The second factor complexity of spaces is quite similar as it studies the completeness of the public space and its contribution to inducing simplicity in the comprehension of the functions of the space. The more complete the space is in terms of including all necessary features for its function, the more simple it is to understand said function. Spaces that can be studied with this factor include commercial districts, residential neighborhoods, courtyards, plazas, parks, and playgrounds. Objects that heavily influence the function of the public space include water features, trees, geometry, signs, street furniture, and any unique physical quantities of a public space. Places that miss these defining features are typically more difficult to understand, making them more complex. To best assess this factor, the question used in the questionnaire is “How simple is it to understand the function of the surrounding public spaces in the area?”.
Thirdly, buffer areas were also used to obtain the pedestrian level of service indicator. Buffer areas are spaces in which people can stop to rest or converse with others while being at a sufficient distance from vehicular traffic without interrupting the pedestrian flow on sidewalks or public spaces. The presence of this buffer zone between a pedestrian and the flow of moving vehicles enhances pedestrian safety and comfort. If the distance is accompanied by solid objects between pedestrians and traffic, this physically improves safety as it reduces the likelihood of a pedestrian-involving accident occurrence. Additionally, perceived safety, which goes hand-in-hand with perceived comfort, is proportional to the size of buffer areas, as pedestrians feel safer when they feel further away from traffic. Objects that increase the feeling of safety in buffer zones include large trees, on-street parking spots, and other large street furniture elements. To assess this, the question used was “Rate the availability of buffer areas* for pedestrians to wait or converse in the space”.
The last factors used to compute the PLOS-TQM indicator were shade and trees. The presence of shade within the walkway creates an atmosphere of comfort for pedestrians on summer days. In addition to protecting pedestrians from excess heat, it also adds a green aesthetic to the walkways and contributes to the concept of solid objects in the buffer space. This is found in the questionnaire through the question “Rate the sufficiency of shade and shelter provided along the area”.
The questions were asked for each of the three POVs for both their real videos and their immersive virtual environment through our mandated questionnaire.
To summarize, the questions compiled in this indicator were the following.
- How simple is it to understand the pedestrian path network in the area?
- How simple is it to understand the function* of the surrounding public spaces in the area?
- Rate the availability of buffer areas* for pedestrians to wait or conversate in the space.
- Rate the sufficiency of shade and shelter provided along the area.
A description of what is meant by “function” and “buffer area” was given as follows.
Examples of functions are: commercial, residential, educational, leisure, and touristic. Buffer areas: Spaces in which people can stop to rest or conversate while being at a sufficient distance from vehicular traffic without interrupting pedestrian flow.
3.3.2. Sustainable Mobility Indicators SUMI
The Sustainable Urban Mobility Indicator Quality of the public space was the second indicator used for the quantification of our analysis. According to [27], indicators are used to offer technical assistance in assessing urban areas and their urban mobility. The indicators are endorsed and used by the European Commission and are developed based on the “SMP2.0 Sustainable Mobility Indicators” developed by the World Business Council for Sustainable Development. The European Commission through the indicators prioritizes supporting European cities in evaluating their mobility system and its sustainability. They also aid cities in tracking the impact of their policies through a widely accepted and harmonized approach.
The indicators present in the document include the following.
- Accessibility of public transport for mobility-impaired groups;
- Air pollutant emissions;
- Opportunity for active mobility;
- Multi-modal integration;
- Satisfaction with public transport;
- Traffic safety active modes;
- Quality of public spaces;
- Mobility space usage.
Between the predeceasing options, only a few were suitable for the premise of our experiment, which is based on the human sensation of public areas such as places, parks, and sidewalks. The most suitable and feasible link between the indicators was the quality of the public spaces indicator. The indicator was designed originally to analyze results from the European Commission’s urban audit, a perception survey on the quality of life in European cities which is being conducted by Eurostat based on telephone interviews on a regular basis. The parameter is an averaged score of survey responses conducted by the designer about the perception of satisfaction with public and green spaces.
The formulation used to compute the indicator from the aforementioned input is the following:
being the weighted average of respondents ratings for aspect k, computed as follow:
To calculate the indicator, two questions were asked: “Rate your overall satisfaction with the public spaces available in the area presented” and “Rate your overall satisfaction with the green spaces available in the area presented”. In general, public spaces are composed of markets, squares, and pedestrians. While green spaces include parks and gardens. For each of the two questions, the participant had to provide a ranking between 1 and 4, 1 insinuating satisfied and 4 insinuating not at all satisfied; this constitutes the agreement scale. Each possibility was given a fractional weight of ten. For each of the two questions, the number of surveyed participants was input and so was the number of responses for each option (satisfied, rather satisfied, rather unsatisfied, not at all satisfied). Then, based off of this input, two indicator values were computed, one for the public space satisfaction and the other for the green space satisfaction. Then, the average of the two was taken to obtain the final SUMI quality of the public space indicator.
4. Results
4.1. Virtual Environment Credibility
To the question “Overall, how realistic did you find the shown spaces?”, 91% chose the answers “Realistic” or “Very realistic”. They ranked characteristics according to the realism they give the space, with the scale being the most important, followed by the environment size of the model. The size of the buildings in comparison to the real ones was deemed convincing by 95% of the participants. Wall and roof material, as well as the possibility to look everywhere, were ranked as the third characteristic, giving realism to the VR-IV visits. Light and shadows were ranked last.
The virtual environment allowing immersive visits of the three urban identities was therefore deemed appropriate to lead a public space audit, but the question remained as to whether such an audit would be consistent with an audit based on inspecting the reality of the urban space or not.
4.2. Pedestrian Level of Service: Trip Quality Model
The PLOS-TQM integrates notions relative to the complexity of the path network, the complexity of the place, the presence of the buffer area, and the shades from trees.
The results of the PLOS-TQM can be seen in Figure 3. The two modalities of the experiment, VR and reality, agree in terms of ranking the POVs. Not surprisingly, POV 3 exhibits the highest PLOS; it is a place designed to enhance the walking experience of the public, a quality perceived both in VR and in reality. However, the difference with POV 2 is less pronounced in VR-IV than in reality.
POV 1 has a lower level of PLOS, but in this case, the difference is more noticeable in the VR-IV setup than in the reality videos. For example, the PLOS-TQM varies from 3.7 to 3.85 when computed from real scenes between POV 1 and POV 2. In the VR-IV setup, it varies from 3.9 to 4.34, indicating a larger difference.
Table 2 illustrates the relative difference in the computation of the PLOS-TQM between the VR-IV setup and the real scenes. The scores are systematically higher in the VR-IV from 5 to 13%. Indeed, both in VR and in reality, the ranking of public spaces from the pedestrian level of service is POV3 > POV2 > POV1.
4.3. SUMI Quality of Public Space
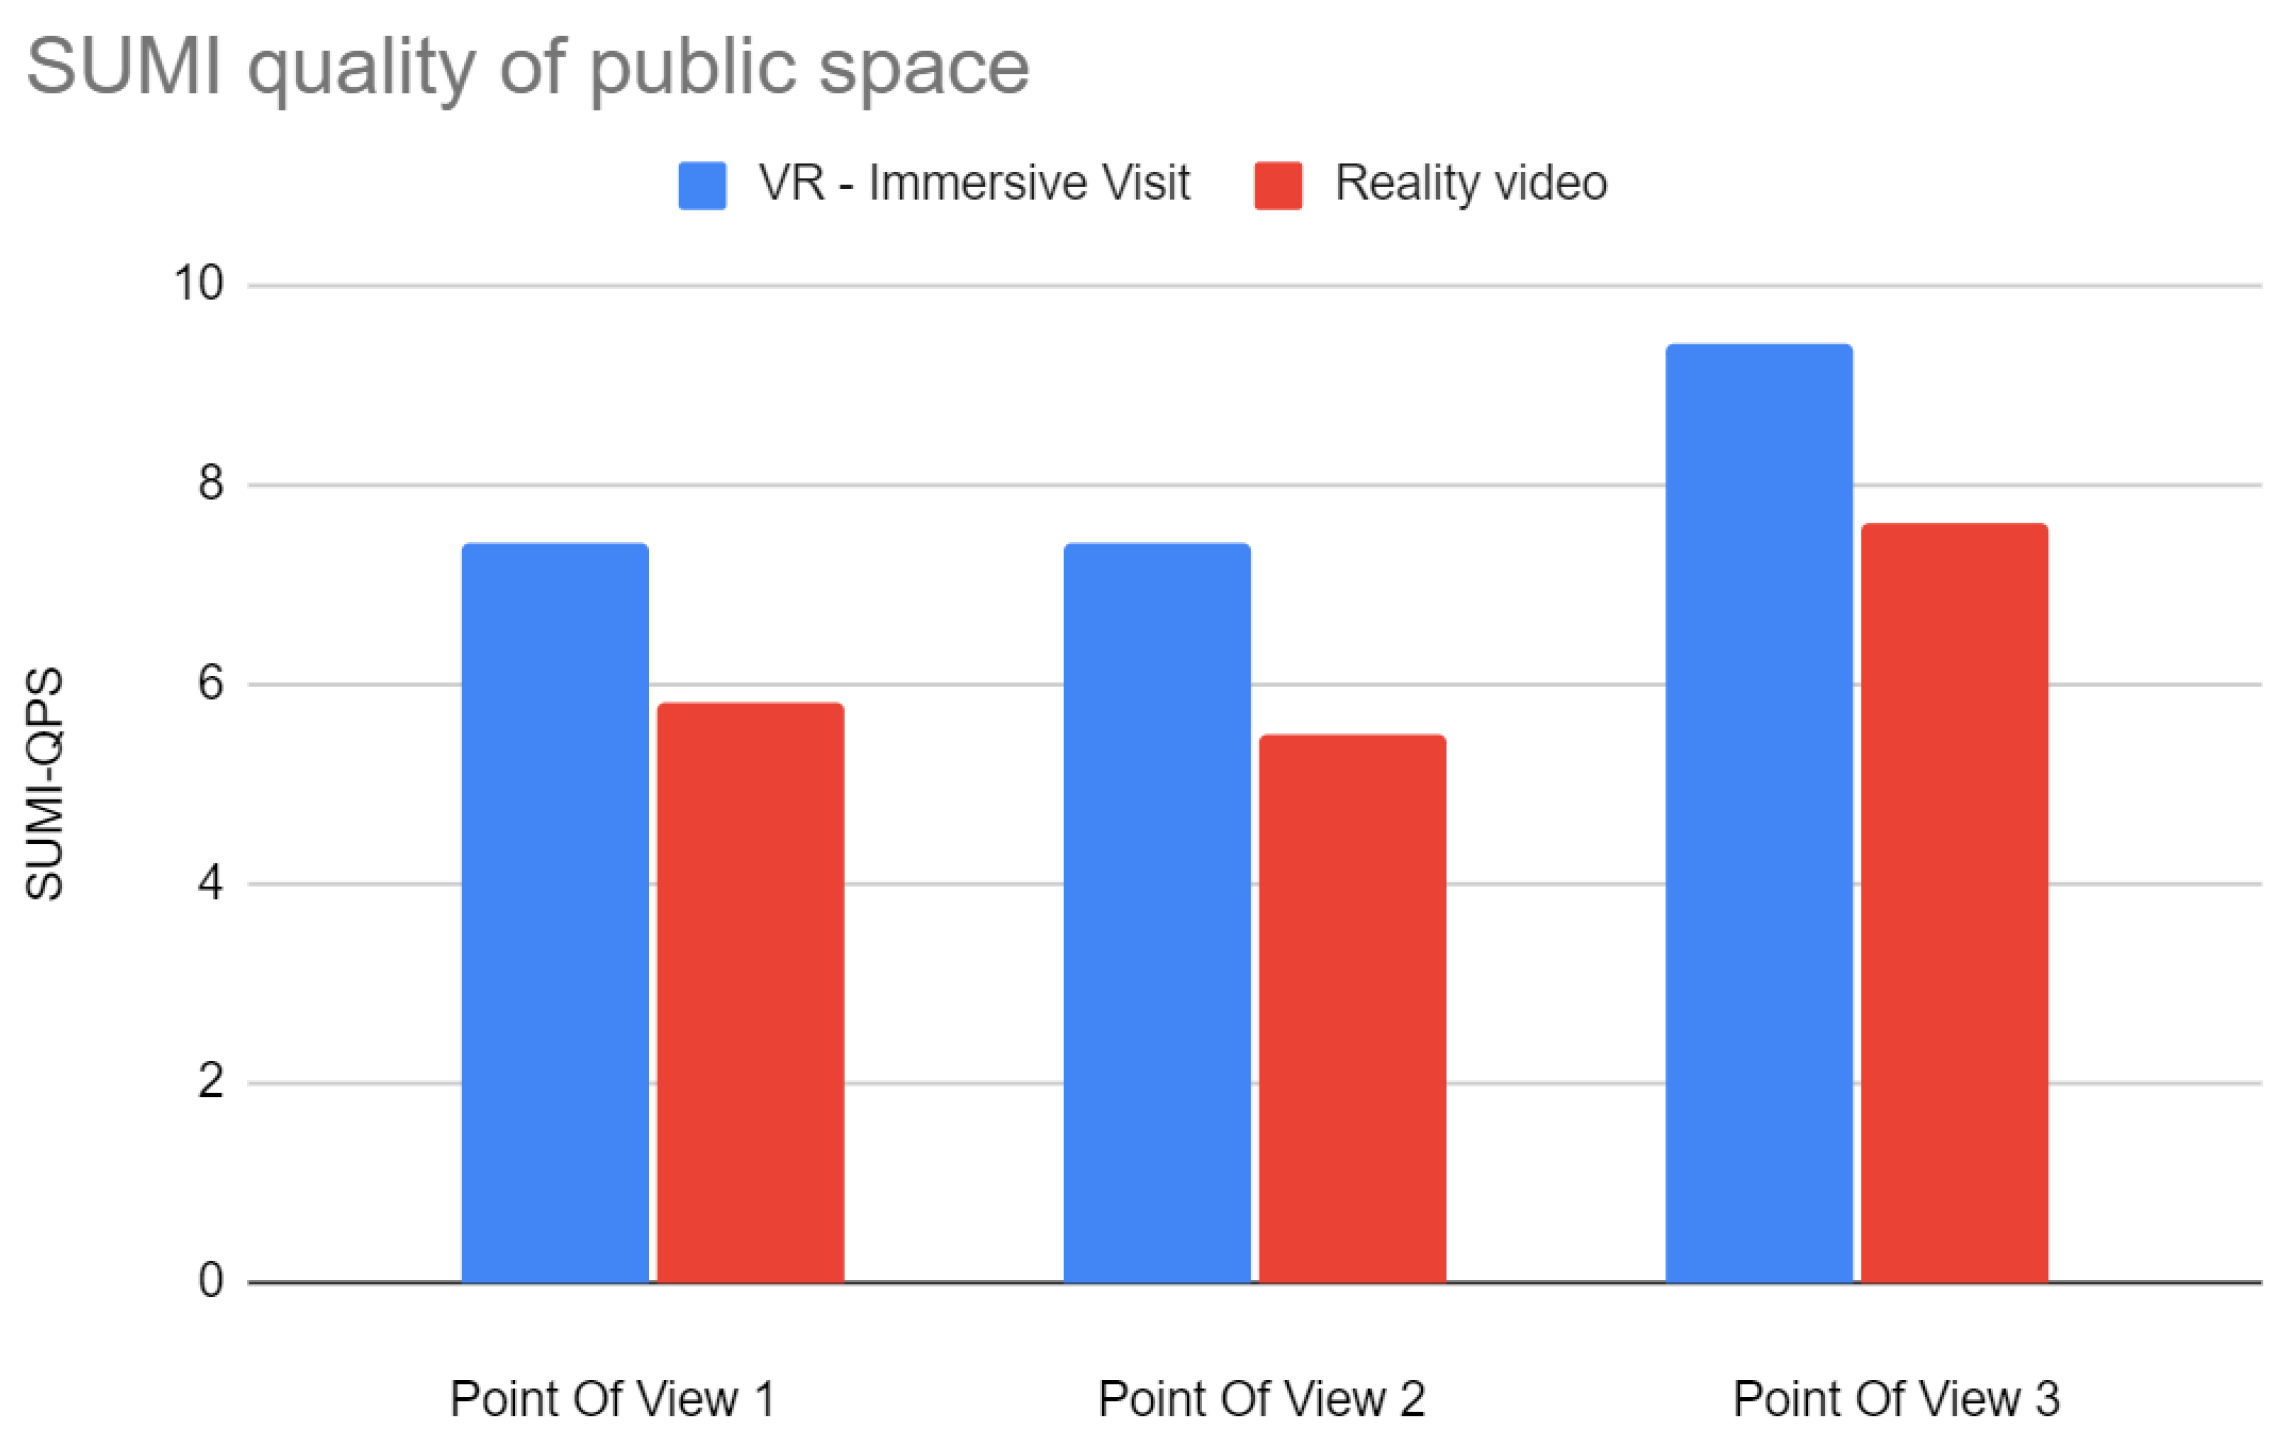
From the perspective of the SUMI-QPS metric, the overall quality of public and green spaces was deemed more satisfactory for POV 3 compared to POV 1 or POV 2, as illustrated in Figure 4. This holds true for both the VR-IV and reality setups, where POV 1 and POV 2 elicited similar responses from participants. The superior quality of POV 3 is expected, given its incorporation of essential elements for a successful walking environment: pedestrian pathways, vegetation, parks, and recreational amenities.
However, the relative difference in SUMI-QPS between the VR-IV and reality setups is more pronounced than that observed with the PLOS-TQM indicator. Table 3 displays the relative difference in SUMI-QPS computation between the VR-IV setup and real scenes. A systematic overestimation of public space quality can be anticipated when using a VR-IV setup, ranging from 30% for urban scenes like the public space in POV 1 or the shopping street in POV 2, to 24% for the leisure area in POV 3.
Therefore, the predictive capability of virtual reality is somewhat challenged for this indicator, with a significant positive bias of up to 30%.
4.4. Other Independent Indicators
4.4.1. Safety and Sense of Relaxation
Safety and relaxation are two feelings closely related in a public space.
Figure 5 gives a visual indication of data from respondents in the form of boxplots; in blue are the answers after the VR-IV visit, and in red are the answers after watching the reality of a POV in a video. These graphics show how the values of each indicator are spread out on a 5-point Likert scale of (1) to (5). To the instruction “Rate the sense of relaxation promoted by the surrounding area”, the scale for relaxation goes from (1) for very stressful to (5) for very relaxing. To the instruction “Rate the sense of safety promoted by the surrounding area”, the scale for the safety indicator goes from (1) for very unsafe to (5) for very safe. The cross inside each boxplot represents the mean answer for each category of the experiment, the points shows the outlier data hat lie either below the lower whisker line or above the upper whisker line.
Figure 5a shows that for POV 1, most of the participants chose a rating between 4 and 5 after the VR immersive visit. After watching the reality of POV 1, they rated it mostly between 3 and 5. POV 2 was deemed less relaxing than the other POVs, which is consistent with an area with a lot of shopping activity and so a lot of foot traffic. The VR-IV setup also promotes an overall greater sense of relaxation, and it is also the case with POV 3. As it is a green recreational area, POV 3 stimulates more relaxation in participants both in VR and reality.
The same type of corroboration can be made for the safety indicator, with a systematic bias of +1 for the responses after performing the VR immersive visit, as illustrated by Figure 5b.
4.4.2. Things to Do and Things to See
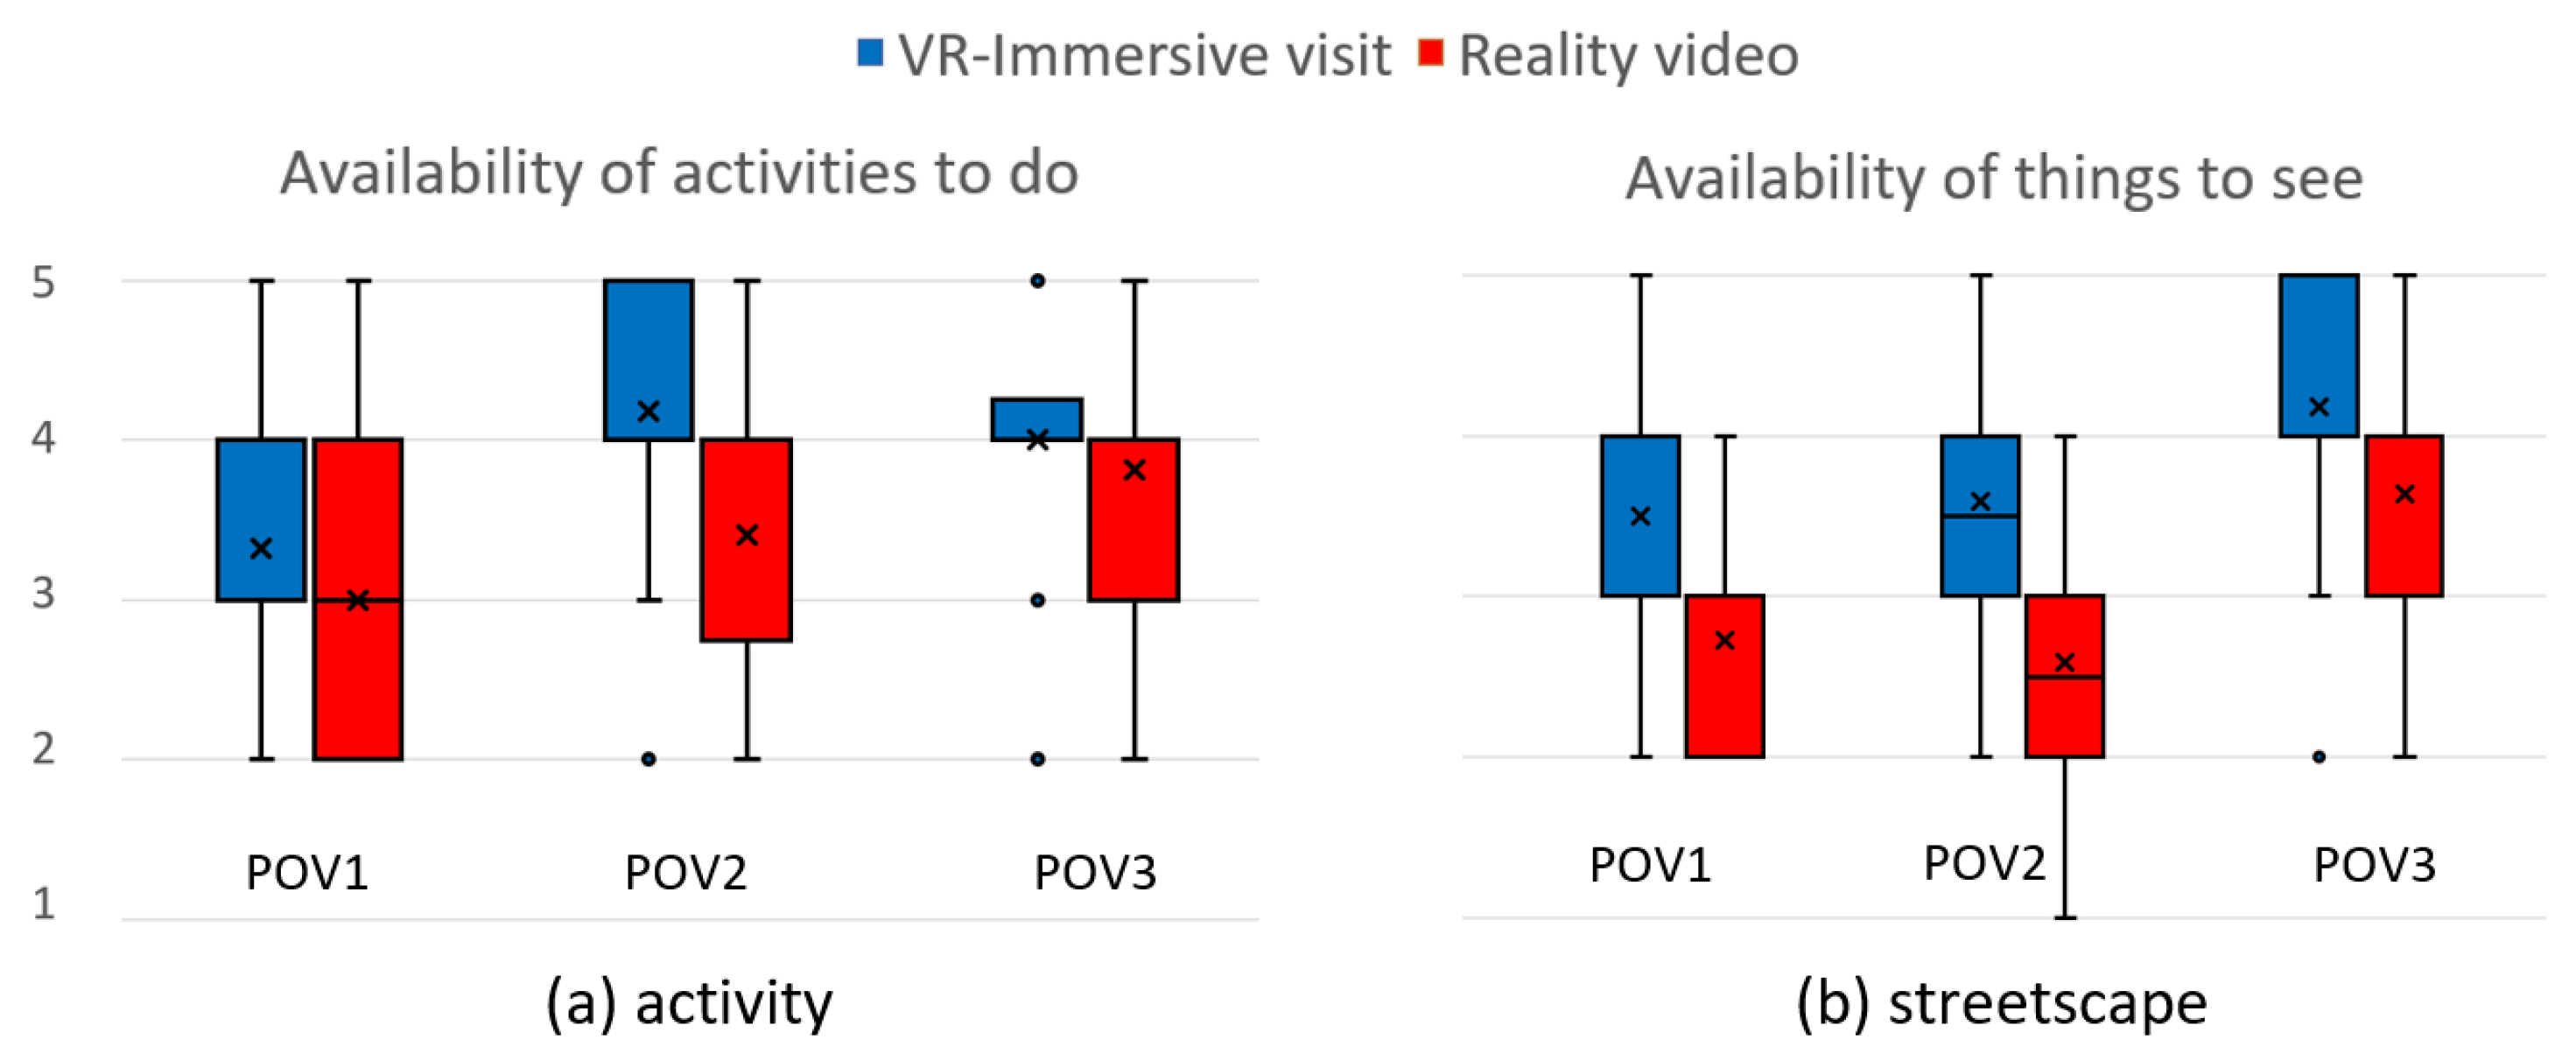
A diversity of street activities is often perceived positively for the walking experience while street isolation impels negative feelings; it is a fundamental perceived environmental quality. Activities are the reasons why people visit a place and why they continue to return. If there is nothing to do in a place, it will sit empty and unused in the long term leading to an unsafe area.
POV 1 is a central place with not much to do except as a meeting point and a commute place. POV 2 is a shopping street that has more amenities and is the center of urban activities in the district. It is reflected in the responses plotted in Figure 6a. The specificity of POV 3 falls into four categories: green surrounding environment, perceived safety, children’s sports and play opportunities, and aesthetic/comfort of the environment. Basically, it is a more social space, and there are more things to see in POV 3, as can be seen in Figure 6b.
Figure 6b shows a systematic bias of +1 in the scores given to the indicator related to the things to see in the area in the VR-IV setup, compared to the real video scenes.
4.4.3. Walkability and Bikeability
Walkability and bikeability are indicators usually computed from geometrical features and traffic flow of the road, but we asked participants to rate these qualities based on the following description of these attributes.
Walkability: Walkability is the extent to which the built environment supports and encourages walking as a means of transport by providing pedestrian comfort and safety.
Bikeability: The extent to which it is convenient and safe to use biking as a means of transport in an area.
The scale of answers proposed ranged from (1) for “Not walkable” or “Not bikeable” to (5) for “Highly walkable” or “Highly bikeable”. We also asked the participants their overall impression of the POVs, and if they would be willing to walk or cycle to move around the areas.
Figure 7 summarizes the result of this study. Figure 7a,b shows the perceived walkability and bikeability for the three POVs. As previously stated, the blue boxplots show the distribution of answers after performing the VR-IV experiments, and in red are the indicators perceived from the real videos. Table 4 reports the mean walkability and mean bikeability of the POVs given by participants, both in VR-IV and after watching the real videos. Walkability is rated sensitively the same in VR-IV and from the real videos, around 4.5/5 except for POV 3 which is slightly higher. The three areas are deemed less bikeable with a mean bikeability rate of around 3.5/5 in all POVs, except for the VR-IV setup of POV 2 where it reached 4.4/5.
Figure 7c,d illustrate the propensity to choose walking or cycling as a means of transportation in the area. A Likert scale was used from (1) for unlikely to (5) for very likely. People would likely choose walking in the three POVs whether the experiment is in VR or in reality. In POV 3 the choice was more marked in the VR-IV setup, but there is almost no bias between VR-IV and real videos. For the cycling choice, a positive bias can be noticed in POV 2, but the answers were the same for the two other POVs whether the experiment was performed in VR or in reality.
5. Discussion
In an experiment involving human participants, we evaluated three POVs on the basis of existing (PLOS [3,4], SUMI [27]) and independent indicators following a video viewing or a VR-IV. As in Chiang et al. [20], we were able to identify strong similarities in the evaluations carried out under the two conditions, which seems to endorse the validity of VR visits for assessing the walkability [28] or cyclability of a public place.
In particular, we were able to observe that on almost all indicators, the two modalities agree on the ranking of POVs. The SUMI indicator is more divided, with POV 1 and 2 equivalent in VR-IV, but POV 1 superior in video. Nevertheless, in both cases, POV 3 comes out on top. This result prompts us to support the use of VR to gather the opinions of likely future users of a site by proposing several design solutions for comparison. The trends are sufficiently accurate for evaluating a real estate project in a pre-occupancy phase. When comparing two distinct urban scenes, the resulting algorithm can be employed in VR-IV to assess the improvement in quality following modifications to an area, particularly in a pre-occupancy scenario. This result is in line with the opinion of the participants about the realism of the visited spaces. The proposed virtual environments were deemed realistic enough to conduct our study. Other studies obtained the same result [29,30].
Even if the realism of the VR-IV setup was found satisfactory by most of the participants, our results show a strong trend towards a more favorable evaluation of VR-IR compared with video, with variations between POVs and indicators. This trend has already been shown in the literature [22]. In our case, this is likely due to the clarity of the 3D scenes in representing the functionalities of a place but lacking photorealism, especially in terms of urban ambiance, which is present in a real environment. Also, satisfaction stimulated by the virtual environment is heightened by the flawless and pristine appearance of the scenes, as depicted in some samples of scenery illustrated in Figure 8.
Moreover, the fact that a POV scene seems more relaxing and safer in virtual reality than in videos of reality can be explained by a lack of performance of graphical engines when it comes to the influx of an urban ambiance, but also by the non-playing characters, which have a neutral or cheerful demeanor in their body language and their facial expression and also their dynamic, while in reality, people are often less open and walk fast to perform their daily routines. Finally, the VR graphical engine enhances the beauty of the scene and makes it more extra-ordinary than reality, which has a more habitual look of routine urban scenes. An interpretation of the difference can be the fact that, as can be seen in Figure 8, the VR views are less standard than reality, and as participants are accustomed to 3D gaming realism they are more curious, which makes it seems like there is more things to see in the VR-IV setup.
Practitioners or urban planners should be mindful, akin to the PLOS-TQM and SUMI, that VR tends to augment the positive perception of an area about mobility infrastructures, shades, streetscape, safety, sense of relaxation, activities, and things to see. However, it is interesting to note that the behavioral indicators relating to walkability in general, or to the participant’s intention to walk in particular, are relatively independent of the viewing modality. The results are a little less robust with bikeability, which is not surprising since one has to keep in mind that the experiments were performed from the point of view of a pedestrian. The virtual reality immersive visit is therefore a good predictive tool to predict if an urban setup is fitted for walking or cycling. This result encourages the use of pre-construction VR assessments as a reliable way of ensuring high levels of active mode use in a neighborhood [21] and indicates improvements for the municipalities [31].
The evaluations formulated by the participants also allow us to propose recommendations on the design of VR visualizations. According to our participants, realism is essentially linked with scale, followed by the size of the environment and the model.
6. Conclusions
In this paper, the attempt to implement methods used to characterize public space elements for public auditing of urban places in a future district was investigated. A professional BIM software to build a 3D city model of a large district still under construction was used, focusing on three POVs. For each POV, a VR-immersive visit displayed on an HTC Vive HMD and a real video of one minute each was proposed to participants, followed by a set of questions. The results support the valid use of VR-IV to assess the walkability and cyclability of a neighborhood based on several architectural proposals, especially because the ability of the place to be walked or cycled is fairly consistent between video and VR-IV. However, an overestimation of place quality is associated with VR-IV. This overestimation could be reduced by improving VR photorealism. Given the paucity of studies in this area, we can only hope that more research will be carried out in the near future. While the results of the study were quite promising, illustrating clear indications of feasibility on some fronts and potential for improvements on others, there are clearly some extensions that could be made for added value.
The first limitation of the work presented here is methodological. We have kept the same participants for the two conditions in order to limit the effect of inter-subjective differences but we were not able, for technical reasons, to counterbalance the order of presentation of the conditions. In a new experiment, we would take care to leave some time between the video and VR-IV in order to limit the possible impact of one visualization on another.
A first perspective to this study would be to enrich the set of questions to allow for a more explanatory characterization of urban streetscapes. Indeed, it has been found in [26] that direct questioning of participants about the emotion brought by various environments was not discriminative of places.
A second perspective could be to use a more diverse sample. Our study only included young participants with no particular mobility difficulties. Interviewing people who were less comfortable walking or cycling, such as the elderly, would no doubt alter the assessments made. Experimenting with a wider range of people would help to ensure more inclusive walkability.
Another interesting perspective for this work would be to include data relating to other sensory modalities in the evaluation. At present, the VR-IVs and the videos have been designed solely from a visual point of view. Numerous studies have highlighted the importance of bodily, auditory [32,33,34], and olfactory sensations [35,36] in the evaluation of an urban landscape. The auditory modality remains the easiest to integrate initially.
Future research could investigate the extension of the protocol for the comparison of two kinds of immersive environments: panoramic videos of the reality of a built environment in an HMD versus a virtual environment of the same streetscape in an HMD. It would be an opportunity to compare immersive 3D setups and to evaluate the eventual gains and drawbacks of the virtual environment versus the real environment. This could explain whether the differences observed in our study are linked to the lack of realism of virtual reality representations or to its more immersive nature.
Finally, a last perspective of this work is to compare the virtual visit with the reality tours once the district is built by asking questions to real residents. Previous studies compared reality scenes in street view images versus audits by local residents and onsite inspection [20]. We would like to compare the virtual environment in an HMD versus an onsite survey (instead of reality videos). It would be the opportunity to validate more extensively and enhance the use of immersive environments for the public auditing of existing or future built environments.
Author Contributions
Conceptualization, R.B. and E.I.; methodology, R.B., S.A., L.C. and E.I.; software, R.B., L.C. and E.I.; validation, R.B. and S.A.; formal analysis, R.B. and E.I.; investigation, R.B. and E.I.; resources, R.B.; writing—original draft preparation, R.B.; writing—review and editing, R.B., E.I. and S.A.; visualization, R.B. and E.I.; supervision, R.B. and C.L.; project administration, R.B.; funding acquisition, R.B. All authors have read and agreed to the published version of the manuscript.
Funding
This research was funded by the E3S project, a partnership between Eiffage and the I-SITE FUTURE consortium. FUTURE bénéficie d’une aide de l’État gérée par l’Agence Nationale de la Recherche (ANR) au titre du programme d’Investissements d’Avenir (référence ANR-16-IDEX-0003) en complément des apports des établissements et partenaires impliqués.
Institutional Review Board Statement
Not applicable.
Informed Consent Statement
Not applicable.
Data Availability Statement
The dataset that supports the findings of this study is available on request from the corresponding author upon reasonable request.
Conflicts of Interest
The authors declare no conflicts of interest.
Abbreviations
The following abbreviations are used in this manuscript:
| BIM | Building Information Model |
| HMD | Head-Mounted Display |
| PLOS | Pedestrian Level Of Service |
| PLOS-TQM | Pedestrian Level Of Service-Trip Quality Model |
| SUMI | SUstainable Mobility Indicator |
| SUMI-QPS | SUstainable Mobility Indicator-Quality of Public Space |
| VR | Virtual Reality |
| VR-IV | Virtual Reality-Immersive Visit |
References
- Koschinsky, J.; Talen, E.; Alfonzo, M.; Lee, S. How walkable is Walker’s paradise? Environ. Plan. Urban Anal. City Sci. 2017, 44, 343–363. [Google Scholar] [CrossRef]
- Liao, B.; van den Berg, P.E.W.; van Wesemael, P.J.; Arentze, T.A. How does walkability change behavior? A comparison between different age groups in the Netherlands. Int. J. Environ. Res. Public Health 2020, 17, 540. [Google Scholar] [CrossRef] [PubMed]
- Jaskiewicz, F. Pedestrian level of service based on trip quality. Transp. Res. Circ. TRB 2000. E-C019: Urban Street Symposium. Available online: https://onlinepubs.trb.org/onlinepubs/circulars/ec019/Ec019_g1.pdf (accessed on 1 January 2012).
- Karatas, P.; Tuydes-Yaman, H. Variability in sidewalk pedestrian level of service measures and rating. J. Urban Plan. Dev. 2018, 144, 04018042. [Google Scholar] [CrossRef]
- Kazemzadeh, K.; Laureshyn, A.; Winslott Hiselius, L.; Ronchi, E. Expanding the scope of the bicycle level-of-service concept: A review of the literature. Sustainability 2020, 12, 2944. [Google Scholar]
- Beura, S.K.; Kumar, K.V.; Suman, S.; Bhuyan, P.K. Service quality analysis of signalized intersections from the perspective of bicycling. J. Transp. Health 2020, 16, 100827. [Google Scholar] [CrossRef]
- Resch, B.; Puetz, I.; Bluemke, M.; Kyriakou, K.; Miksch, J. An interdisciplinary mixed-methods approach to analyzing urban spaces: The case of urban walkability and bikeability. Int. J. Environ. Res. Public Health 2020, 17, 6994. [Google Scholar] [CrossRef] [PubMed]
- Ewing, R.; Clemente, O.; Neckerman, K.M.; Purciel-Hill, M.; Quinn, J.W.; Rundle, A. Measuring Urban Design: Metrics for Livable Places; Springer: Berlin/Heidelberg, Germany, 2013; Volume 200. [Google Scholar] [CrossRef]
- Talen, E.; Koschinsky, J. The walkable neighborhood: A literature review. Int. J. Sustain. Land Use Urban Plan. 2013, 1, 42–63. [Google Scholar] [CrossRef]
- Birenboim, A.; Dijst, M.; Ettema, D.; de Kruijf, J.; de Leeuw, G.; Dogterom, N. The utilization of immersive virtual environments for the investigation of environmental preferences. Landsc. Urban Plan. 2019, 189, 129–138. [Google Scholar] [CrossRef]
- Liao, B.; van den Berg, P.E.; van Wesemael, P.; Arentze, T.A. Individuals’ perception of walkability: Results of a conjoint experiment using videos of virtual environments. Cities 2022, 125, 103650. [Google Scholar] [CrossRef]
- Belaroussi, R.; Pazzini, M.; Issa, I.; Dionisio, C.; Lantieri, C.; González, E.D.; Vignali, V.; Adelé, S. Assessing the Future Streetscape of Rimini Harbor Docks with Virtual Reality. Sustainability 2023, 15, 5547. [Google Scholar] [CrossRef]
- Bochow, M.; Taubenböck, H.; Segl, K.; Kaufmann, H. An automated and adaptable approach for characterizing and partitioning cities into urban structure types. In Proceedings of the 2010 IEEE International Geoscience and Remote Sensing Symposium, Honolulu, HI, USA, 25–30 July 2010; IEEE: New York, NY, USA, 2010; pp. 1796–1799. [Google Scholar]
- Oselinsky, K.; Spitzer, A.N.; Yu, Y.; Ortega, F.R.; Malinin, L.H.; Curl, K.A.; Leach, H.; Graham, D.J. Virtual reality assessment of walking in a modifiable urban environment: A feasibility and acceptability study. Sci. Rep. 2023, 13, 5867. [Google Scholar] [CrossRef]
- Keil, J.; Weißmann, M.; Korte, A.; Edler, D.; Dickmann, F. Measuring Physiological Responses to Visualizations of Urban Planning Scenarios in Immersive Virtual Reality. KN-J. Cartogr. Geogr. Inf. 2023, 73, 117–126. [Google Scholar] [CrossRef]
- Cinnamon, J.; Jahiu, L. 360-degree video for virtual place-based research: A review and research agenda. Comput. Environ. Urban Syst. 2023, 106, 102044. [Google Scholar] [CrossRef]
- Kim, S.N.; Lee, H. Capturing reality: Validation of omnidirectional video-based immersive virtual reality as a streetscape quality auditing method. Landsc. Urban Plan. 2022, 218, 104290. [Google Scholar] [CrossRef]
- Mouratidis, K.; Hassan, R. Contemporary versus traditional styles in architecture and public space: A virtual reality study with 360-degree videos. Cities 2020, 97, 102499. [Google Scholar] [CrossRef]
- Batista, M.; Berghoefer, F.L.; Friedrich, B. Exploring pedestrian and cyclist preferences for shared space design: A video-based online survey. Transp. Res. Interdiscip. Perspect. 2023, 22, 100976. [Google Scholar] [CrossRef]
- Chiang, Y.C.; Sullivan, W.; Larsen, L. Measuring neighborhood walkable environments: A comparison of three approaches. Int. J. Environ. Res. Public Health 2017, 14, 593. [Google Scholar] [CrossRef]
- Han, J.; Lee, S. Verification of Immersive Virtual Reality as a Streetscape Evaluation Method in Urban Residential Areas. Land 2023, 12, 345. [Google Scholar] [CrossRef]
- Nakamura, K. Experimental analysis of walkability evaluation using virtual reality application. Environ. Plan. Urban Anal. City Sci. 2021, 48, 2481–2496. [Google Scholar] [CrossRef]
- Shi, J.; Honjo, T.; Zhang, K.; Furuya, K. Using virtual reality to assess landscape: A comparative study between on-site survey and virtual reality of aesthetic preference and landscape cognition. Sustainability 2020, 12, 2875. [Google Scholar] [CrossRef]
- Keil, J.; Edler, D.; Schmitt, T.; Dickmann, F. Creating Immersive Virtual Environments Based on Open Geospatial Data and Game Engines. KN-J. Cartogr. Geogr. Inf. 2021, 71, 53–65. [Google Scholar] [CrossRef]
- Issa, E.; Belaroussi, R. Designing an Immersive Visit for Public Space Assessment. Edelweiss Appl. Sci. Technol. 2024, 8. [Google Scholar]
- Belaroussi, R.; González, E.D.; Dupin, F.; Martin-Gutierrez, J. Appraisal of Architectural Ambiances in a Future District. Sustainability 2023, 15, 13295. [Google Scholar] [CrossRef]
- Rupprecht Consult-Forschung & Beratung GmbH. Technical Support Related to Sustainable Urban Mobility Indicars (SUMI); Rupprecht Consult-Forschung & Beratung GmbH: Köln, Germany, 2020. [Google Scholar]
- Holth, J.; Schnabel, M.A. Immersive Virtual Environments as a Tool to Explore Perceptional Space. Int. J. Parallel Emergent Distrib. Syst. 2016, 31, 21–29. [Google Scholar] [CrossRef]
- Newman, M.; Gatersleben, B.; Wyles, K.; Ratcliffe, E. The use of virtual reality in environment experiences and the importance of realism. J. Environ. Psychol. 2022, 79, 101733. [Google Scholar] [CrossRef]
- Luo, Y.; Ahn, S.; Abbas, A.; Seo, J.; Cha, S.H.; Kim, J.I. Investigating the impact of scenario and interaction fidelity on training experience when designing immersive virtual reality-based construction safety training. Dev. Built Environ. 2023, 16, 100223. [Google Scholar] [CrossRef]
- Kadali, B.R.; Vedagiri, P. Evaluation of pedestrian crosswalk level of service (LOS) in perspective of type of land-use. Transp. Res. Part Policy Pract. 2015, 73, 113–124. [Google Scholar] [CrossRef]
- Jaszczak, A.; Pochodyła, E.; Kristianova, K.; Małkowska, N.; Kazak, J.K. Redefinition of park design criteria as a result of analysis of well-being and soundscape: The case study of the Kortowo Park (Poland). Int. J. Environ. Res. Public Health 2021, 18, 2972. [Google Scholar] [CrossRef]
- Jiang, L.; Masullo, M.; Maffei, L.; Meng, F.; Vorländer, M. How do shared-street design and traffic restriction improve urban soundscape and human experience?—An online survey with virtual reality. Build. Environ. 2018, 143, 318–328. [Google Scholar] [CrossRef]
- Sanchez, G.M.E.; Van Renterghem, T.; Sun, K.; De Coensel, B.; Botteldooren, D. Using Virtual Reality for assessing the role of noise in the audio-visual design of an urban public space. Landsc. Urban Plan. 2017, 167, 98–107. [Google Scholar] [CrossRef]
- Jiang, L.; Masullo, M.; Maffei, L. Effect of odour on multisensory environmental evaluations of road traffic. Environ. Impact Assess. Rev. 2016, 60, 126–133. [Google Scholar] [CrossRef]
- Ziani, A.; Biara, R.W. Walkable Urban Environment: Sensory Experiencing in Bechar City (Algeria). Environ. Res. Eng. Manag. 2022, 78, 105–116. [Google Scholar] [CrossRef]
Figure 1.
Overview of the points of view of interest and their interest: street views and 3D model.

Figure 2.
Experimentalprotocol: each participant is shown a POV in an HMD or in a video of the real built environment. After each virtual visit, they fill out a questionnaire. Based on the response of all participants, a set of indicators is computed for each modality: audit based on VR-IV visit is compared to audit based on real video.

Figure 3.
Pedestrian level of service. Trip quality model for the three points of view based on VR-immersive visit and video of the real scenery.
Figure 3.
Pedestrian level of service. Trip quality model for the three points of view based on VR-immersive visit and video of the real scenery.

Figure 4.
Overall satisfaction of public space and green space for the three points of view. Indicators are derived from the feelings of the same participants after VR immersive visits and based on real videos inspections.
Figure 4.
Overall satisfaction of public space and green space for the three points of view. Indicators are derived from the feelings of the same participants after VR immersive visits and based on real videos inspections.

Figure 5.
Sense of safety and relaxation from the three points of view. Compared to reality (in blue), raters tend to overestimate these feelings in a VR setup (in red).
Figure 5.
Sense of safety and relaxation from the three points of view. Compared to reality (in blue), raters tend to overestimate these feelings in a VR setup (in red).

Figure 6.
Things to do and things to see in the three scenarios. Comparison between reality (in blue) and the Virtual Reality-Immersive Visit (VR-IV) setup (in red).
Figure 6.
Things to do and things to see in the three scenarios. Comparison between reality (in blue) and the Virtual Reality-Immersive Visit (VR-IV) setup (in red).

Figure 7.
Perceived walkability (a) and bikeability (b) in the three points of view. (c) The willingness to walk. (d) The willingness to use a bicycle. VR scenes are in blue and real video scenes are in red.
Figure 7.
Perceived walkability (a) and bikeability (b) in the three points of view. (c) The willingness to walk. (d) The willingness to use a bicycle. VR scenes are in blue and real video scenes are in red.

Figure 8.
The three selected points of view of LaVallée. The first line is the virtual environment, second line is the reality scene.
Figure 8.
The three selected points of view of LaVallée. The first line is the virtual environment, second line is the reality scene.

Table 2.
Relative difference in Pedestrian Level of Service (PLOS)-Trip Quality Method (TQM) between Virtual Reality-Immersive Visit (VR-IV) and reality.
Table 2.
Relative difference in Pedestrian Level of Service (PLOS)-Trip Quality Method (TQM) between Virtual Reality-Immersive Visit (VR-IV) and reality.
| POV 1 | POV 2 | POV 3 | |
|---|---|---|---|
| Difference in PLOS-TQM | 5.4% | 12.7% | 7.8% |
Table 3.
Relative difference in Sustainable Mobility Indicators (SUMI)-Quality of Public Space (QPS) between Virtual Reality-Immersive Visit (VR-IV) and reality.
Table 3.
Relative difference in Sustainable Mobility Indicators (SUMI)-Quality of Public Space (QPS) between Virtual Reality-Immersive Visit (VR-IV) and reality.
| POV 1 | POV 2 | POV 3 | |
|---|---|---|---|
| Difference in SUMI-QPS | 30% | 32% | 24% |
Table 4.
Mean walkability and bikeability in Virtual Reality-Immersive Visit (VR-IV) and reality, on a scale out of 5.
Table 4.
Mean walkability and bikeability in Virtual Reality-Immersive Visit (VR-IV) and reality, on a scale out of 5.
| POV 1 | POV 2 | POV 3 | |
|---|---|---|---|
| Walkability in VR-IV | 4.6 | 4.6 | 4.9 |
| Walkability in real | 4.4 | 4.4 | 4.6 |
| Bikeability in VR-IV | 3.4 | 4.4 | 3.8 |
| Bikeability in real | 3.5 | 3.6 | 3.5 |
Disclaimer/Publisher’s Note: The statements, opinions and data contained in all publications are solely those of the individual author(s) and contributor(s) and not of MDPI and/or the editor(s). MDPI and/or the editor(s) disclaim responsibility for any injury to people or property resulting from any ideas, methods, instructions or products referred to in the content. |
© 2024 by the authors. Licensee MDPI, Basel, Switzerland. This article is an open access article distributed under the terms and conditions of the Creative Commons Attribution (CC BY) license (https://creativecommons.org/licenses/by/4.0/).
Share and Cite
MDPI and ACS Style
Belaroussi, R.; Issa, E.; Cameli, L.; Lantieri, C.; Adelé, S. Exploring Virtual Environments to Assess the Quality of Public Spaces. Algorithms 2024, 17, 124. https://doi.org/10.3390/a17030124
AMA Style
Belaroussi R, Issa E, Cameli L, Lantieri C, Adelé S. Exploring Virtual Environments to Assess the Quality of Public Spaces. Algorithms. 2024; 17(3):124. https://doi.org/10.3390/a17030124
Chicago/Turabian StyleBelaroussi, Rachid, Elie Issa, Leonardo Cameli, Claudio Lantieri, and Sonia Adelé. 2024. "Exploring Virtual Environments to Assess the Quality of Public Spaces" Algorithms 17, no. 3: 124. https://doi.org/10.3390/a17030124
Note that from the first issue of 2016, this journal uses article numbers instead of page numbers. See further details here.