
An Overview of Demand Analysis and Forecasting Algorithms for the Flow of Checked Baggage among Departing Passengers


1
School of Mechanical Engineering, Southwest Jiaotong University, Chengdu 610031, China
2
Chengdu Shuangliu International Airport Co., Ltd., Chengdu 610225, China
*
Author to whom correspondence should be addressed.
Algorithms 2024, 17(5), 173; https://doi.org/10.3390/a17050173
Submission received: 6 March 2024
/
Revised: 7 April 2024
/
Accepted: 22 April 2024
/
Published: 23 April 2024
Abstract
:The research on baggage flow plays a pivotal role in achieving the efficient and intelligent allocation and scheduling of airport service resources, as well as serving as a fundamental element in determining the design, development, and process optimization of airport baggage handling systems. This paper examines baggage checked in by departing passengers at airports. The crrent state of the research on baggage flow demand is first reviewed and analyzed. Then, using examples of objective data, it is concluded that while there is a significant correlation between airport passenger flow and baggage flow, an increase in passenger flow does not necessarily result in a proportional increase in baggage flow. According to the existing research results on the influencing factors of baggage flow sorting and classification, the main influencing factors of baggage flow are divided into two categories: macro-influencing factors and micro-influencing factors. When studying the relationship between the economy and baggage flow, it is recommended to use a comprehensive analysis that includes multiple economic indicators, rather than relying solely on GDP. This paper provides a brief overview of prevalent transportation flow prediction methods, categorizing algorithmic models into three groups: based on mathematical and statistical models, intelligent algorithmic-based models, and combined algorithmic models utilizing artificial neural networks. The structures, strengths, and weaknesses of various transportation flow prediction algorithms are analyzed, as well as their application scenarios. The potential advantages of using artificial neural network-based combined prediction models for baggage flow forecasting are explained. It concludes with an outlook on research regarding the demand for baggage flow. This review may provide further research assistance to scholars in airport management and baggage handling system development.
1. Introduction
Baggage-related challenges are escalating in civil aviation transportation. According to the “Baggage IT Insights 2023” by the society international de telecommunications aeronautiques (SITA), global civil aviation transported 3.42 billion passengers in 2022 [1]. This marks a 24.7% decline from 2019 due to the COVID-19 epidemic but shows a significant recovery with a 50.2% increase over 2021. As the industry moves into the post-epidemic era, the potential for further growth and development in civil aviation remains substantial. Despite not reaching pre-COVID passenger levels of 2019, the incidence of mishandled baggage per 1000 passengers surged by 35.7%. Delayed baggage, constituting 80% of mishandled cases, underscores the inefficiencies in baggage handling. These inefficiencies, costing the industry billions annually, stem from a mismatch between baggage flow and check-in resources, inadequate capacity in the baggage handling system, and unoptimized transportation processes. Baggage-related issues have gradually become the key issues restricting the efficient development of the civil aviation industry. Thus, how to accurately grasp the change in law and mechanism of baggage-related demand and reasonably schedule the relevant service resources of baggage handling has become a practical problem that needs to be solved urgently in the current civil aviation industry.
This paper examines the baggage checked in by departing passengers at airports. Section 1 discusses the need for a focus on baggage flow demand, highlighting the mismatch between demand and service resources at airports. Section 2 provides a concise analysis of the current state of the research on baggage flow demand, compiles representative research findings, and illustrates the limitations of existing studies with objective data examples. Section 3 identifies and categorizes the main factors affecting baggage flow based on existing studies. Section 4 introduces common transportation flow prediction models, and discusses their structure, strengths, weaknesses, and application scenarios. It argues for the potential advantages of combined prediction models in baggage flow forecasting. Finally, Section 5 provides a summary and outlook for this paper.
2. The Current Research Status on Airport Baggage Demand
Existing research on air transportation flow mainly focuses on flight flow, passenger flow, and cargo flow, and there are few studies on baggage flow. In the study of the intelligent system of terminal baggage safety inspection, Yfantis mentioned that the baggage of departing passengers should be quantified to facilitate classification research [2]. Meanwhile, the quantity, quality, and size of the baggage were quantified through software development, and the baggage location was calibrated for convenient and quick extraction. However, this study focused on software development and should have discussed the specific indicators of baggage in depth. Brunettal et al. established a model to evaluate the time behavior characteristics of passenger flow and baggage flow in terminal buildings [3]. Meanwhile, they proposed reducing passenger checked baggage queuing time by controlling the number of check-in counters. Takakuwa et al. believed that baggage flow is strongly related to airport passenger flow and presents a certain proportion [4]. They believed the baggage demand prediction method could adopt the forecasting model of passenger flow. Then, a scientific forecasting model of passenger baggage was obtained through the test and simulation verification of actual data. When Zeinaly et al. studied the control scheme of the baggage handling system, they briefly introduced the passenger and baggage requirements in the precise time optimization method of the baggage coding trolley [5]. Yang studied the demand characteristics of checked baggage and its influencing factors based on flights through the artificial neural network (ANN) method [6]. Therefore, it was found that the baggage flow was significantly related to the passenger flow, and the baggage demand was random and periodic. However, the research mainly obtained sample data using a sampling and questionnaire survey, and the granularity was large. Cheng et al. analyzed the baggage flow of an international airport in May 2012 using two prediction models, the back-propagation neural network (BPNN) and multiple regression [7]. Through cross-comparison of three flight data (all flight data, single flight data, and flight data of the same destination), it was found that the flight data of the same destination can more accurately predict the baggage flow. However, this study only made a simple prediction of the outbound checked baggage flow at the airport. Because of its data limitations, the stability of the prediction model could not be guaranteed, including influencing factors and sample sets. Meuter et al. analyzed the security inspection performance with the baggage security inspector as the research object [8]. They found that the shift length of the security inspector was directly proportional to the baggage flow and inversely proportional to the security inspection performance. Li et al. established a baggage weight distribution model and a time distribution model based on the number of baggage by mathematical statistics [9]. His research showed that the time required for baggage check-in obeyed the Burr distribution, and the number of checked baggage was positively correlated with the choice rate of the check-in counter. Liu et al. conducted a field survey on the passenger flow characteristics of the departure and arrival terminals at a hub airport in China [10]. They evaluated the overall passenger flow of the terminal through the probability distribution of passenger flow intensity and residence time. Meanwhile, it was mentioned that the check-in time of baggage accounts for about one-third of the total time of departure passengers, and the passenger flow and baggage volume in the arrival area were closely related to the size of the aircraft model. Li analyzed the time distribution characteristics of the baggage demand of departing passengers through sample data such as manual check-in passenger flow, flight volume, and flight schedule [11]. Meanwhile, Li found a correlation and time lag between passenger checked baggage demand and planned departure passenger flow in different day periods. At the same time, the short-term baggage demand model was established by the seasonal autoregressive integrated moving average (SARIMA) and gradient boosting decision tree. However, this study did not consider the impact of essential indicators such as holidays, working days, and winter and summer holidays on the baggage flow, nor did it consider the impact factors such as self-service baggage check-in. The lack of feature vector diversity led to the incomplete mapping relationship of the prediction model. Xie proposed establishing prediction mechanisms for passenger check-in baggage demand to provide data support for fully tapping the passenger aircraft belly cabin carrying capacity [12]. This study used k-nearest neighbor (KNN) and density-based spatial clustering of applications with noise to interpolate the missing part of actual data. At the same time, particle swarm optimization (PSO) was used to find the optimal parameters to establish a baggage demand prediction model based on support vector machine regression (SVR). The results showed that the demand for checked baggage had the characteristics of daily similarity. On the one hand, the sample size needed to be larger. Two months of data from the self-service baggage check-in system and the departure area of the terminal were not considered. On the other hand, there needed to be more diversity in the selection of baggage-related feature vectors, which might not entirely reflect the scientific prediction of baggage demand. Xu used the check-in baggage data and exploratory data and used the SVR algorithm to establish a baggage flow prediction model [13]. The comparison and verification of KNN and random forest algorithms concluded that the prediction result of SVR was the best among the three models.
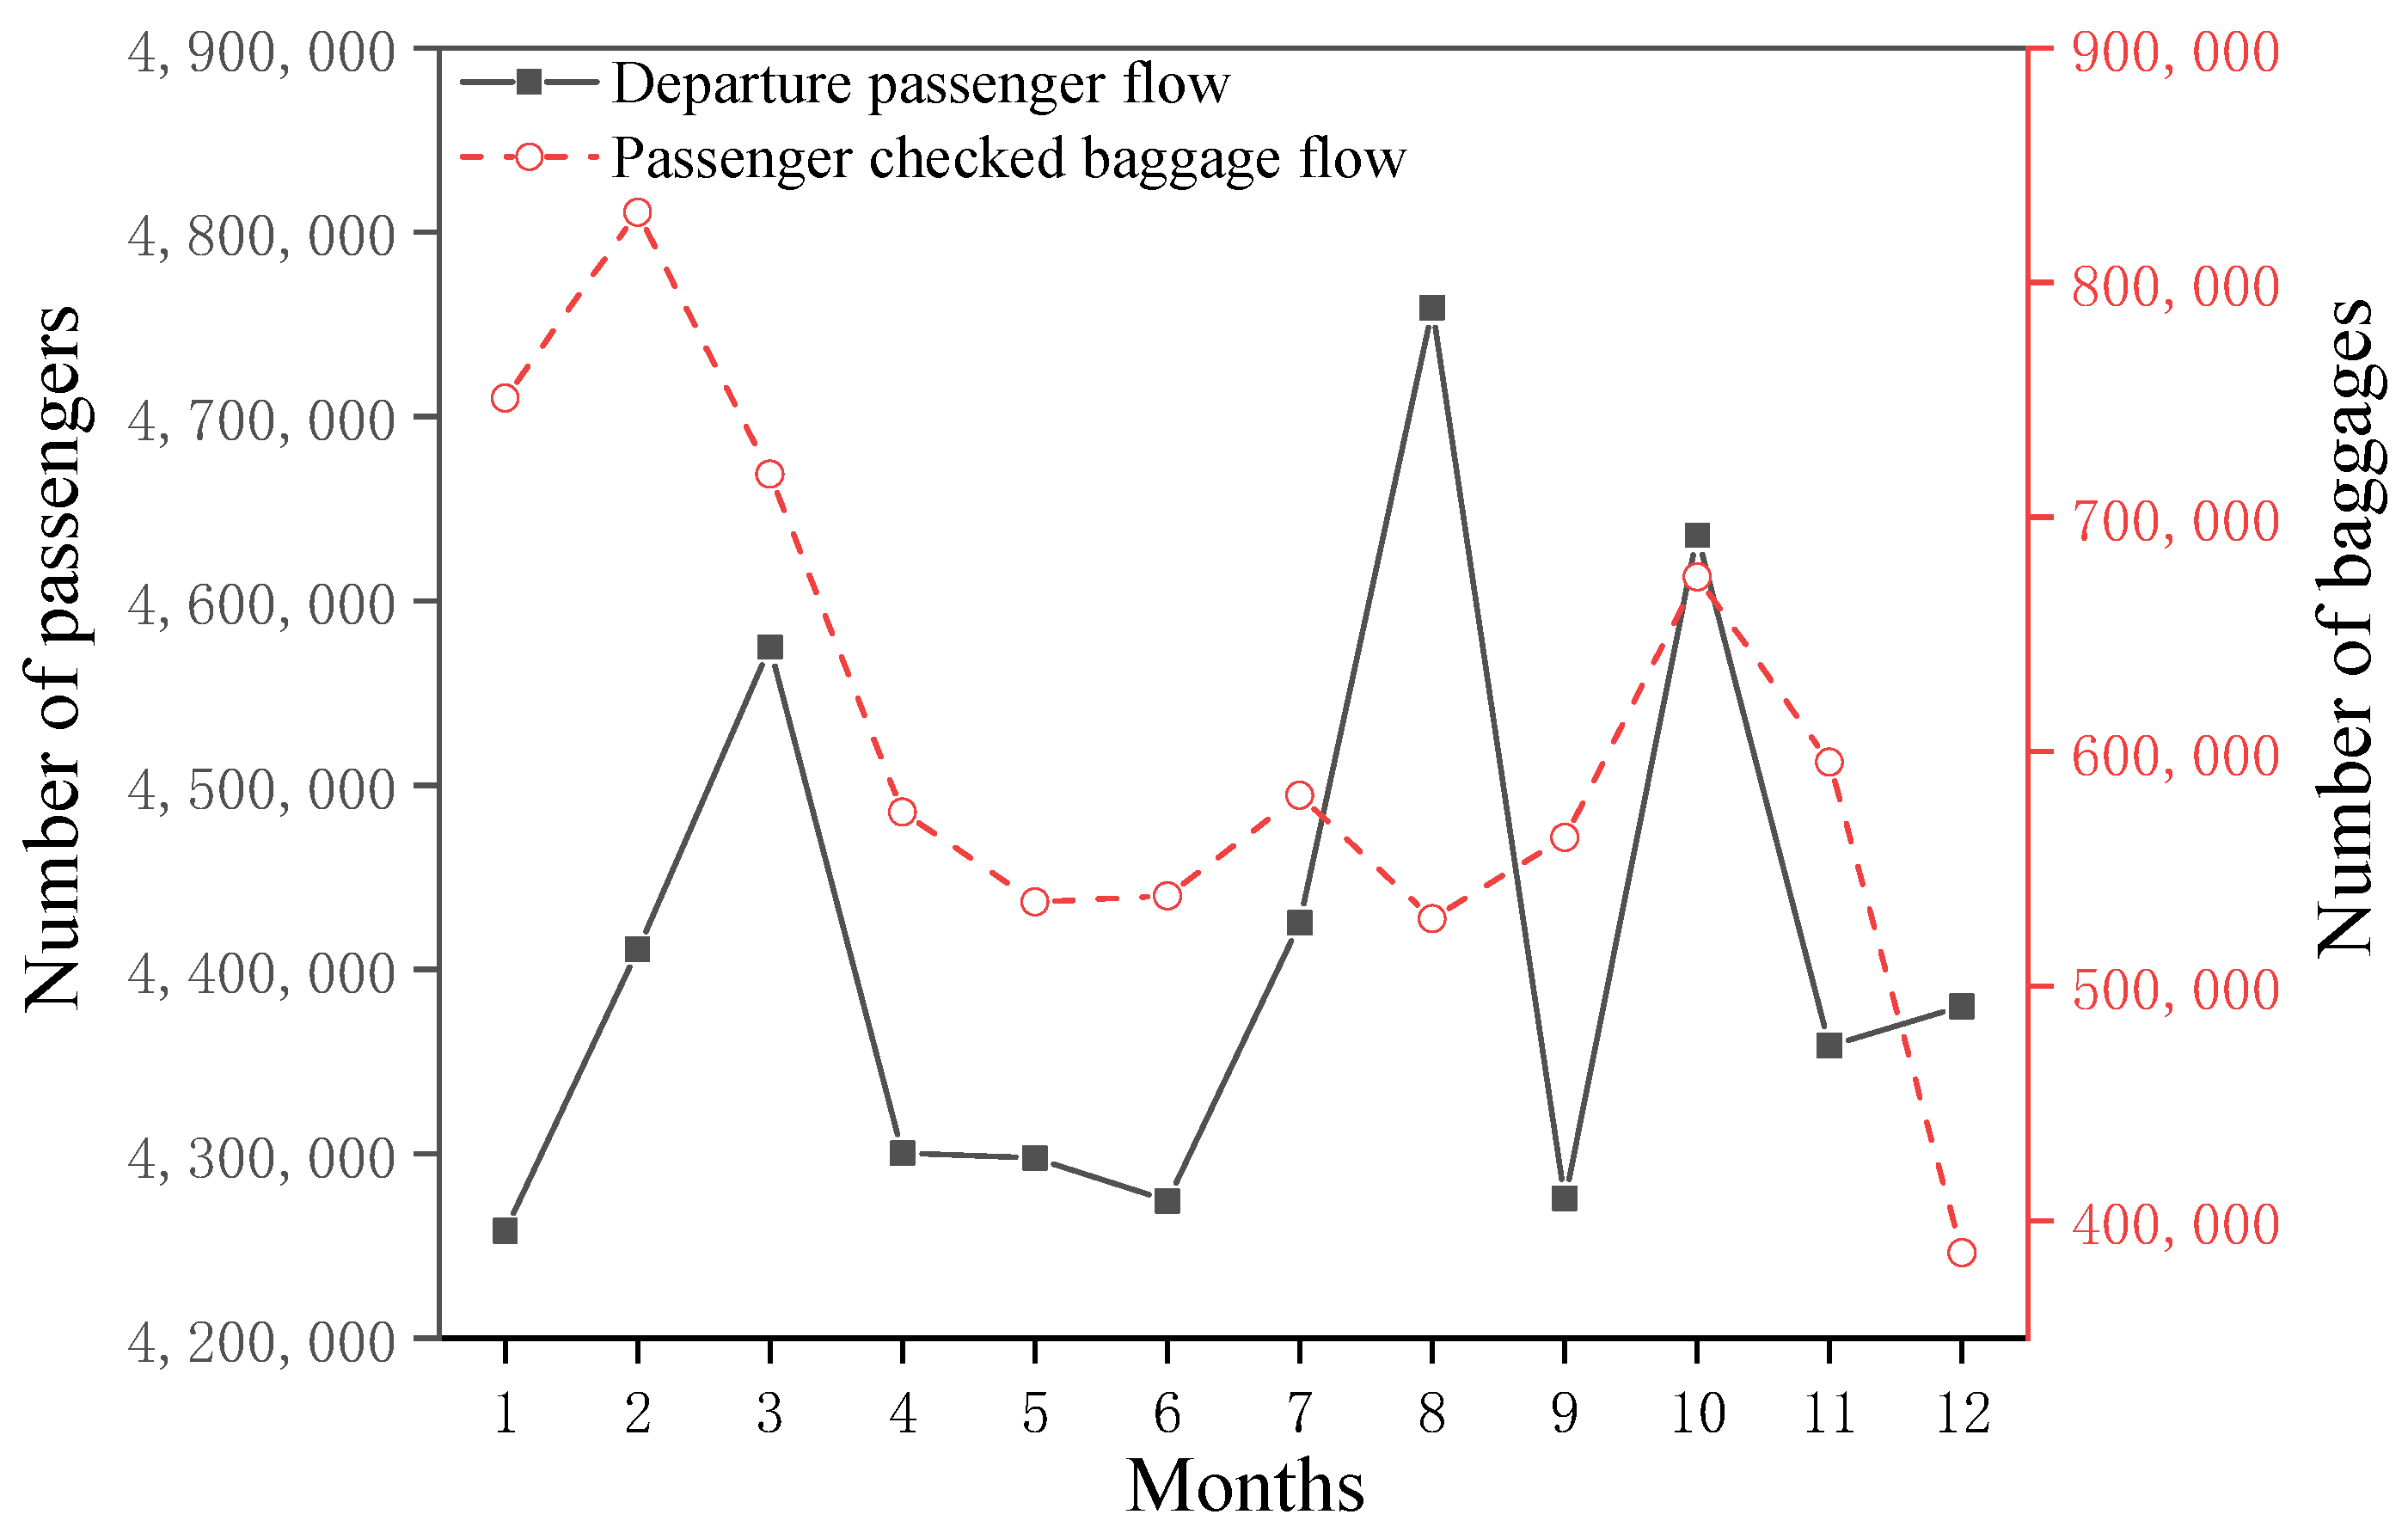
In summary, few studies have focused on the demand for checked baggage for airport departure passengers in previous research. Although some studies have suggested that the prediction results of airport departure passenger flow could be directly converted into the prediction results of baggage demand, relevant research was still needed to give a scientific quantitative conversion formula. On the one hand, the influencing factors and changing rules of baggage demand had their characteristics, as shown in Figure 1. Figure 1 compares the departure passenger flow and baggage flow of the Chengdu Shuangliu International Airport (the annual passenger throughput exceeds 30 million) in different months of 2018 (data prior to the COVID-19 pandemic outbreak). Three peaks in passenger flow appear in March, August, and October. By comparison, there are only two main peaks in baggage flow in February and October. Although the increase in passenger flow would increase the amount of baggage, it was not a simple linear relationship. Simply predicting baggage flow based on the prediction results of passenger flow would not only lead to significant errors in the conversion process but also ignore the characteristics of baggage demand. On the other hand, relevant research did not consider the combined effect of various influencing factors on baggage flow. At the same time, it established mathematical models by using simple mathematical statistics and hypothesis testing, resulting in insufficient sample diversity and poor prediction accuracy, which could not be put into production. Therefore, it is necessary to accurately and comprehensively grasp the airport departure baggage demand and deeply analyze the change in law and mechanism of baggage demand, which has important theoretical and practical significance in the current era of rapid development of the civil aviation industry. For example, accurately understanding baggage flow demand enables airport management to rationally allocate resources for check-in, security checks, and baggage handling systems. Similarly, airlines can optimize aircraft size and staffing for baggage sorting. These optimization methods can enhance baggage handling efficiency, reduce operating costs, and improve the quality of passenger service.
3. Influence Factor Analysis of the Airport Baggage Flow
The flow of baggage is influenced by external factors and constitutes a complex system of nonlinear changes. To support effective management in developing airport transportation programs, it is essential to accurately understand the changing patterns of baggage flow and the role of influencing factors.
3.1. Macro-Factors
There are many factors affecting the baggage flow, and different influencing factors have different degrees of influence on the baggage flow. Due to the strong correlation between baggage flow and airport passenger flow, some factors that affect passenger flow may also influence baggage flow. Factors from the macro level, the regional GDP level, industrial structure, the population in the airport radiation area, and other factors are closely related to the airport flow. Different relationships between different modes of transportation, such as aircraft transportation and railways, highways, and adjacent airports, will also affect the volume of airport traffic [14,15,16,17,18]. A higher airport density and developed road network traffic will affect airport passenger flow. For example, the density of airports in China has increased from 1.5 per 100,000 square kilometers in 2006 to 2.38 per 100,000 square kilometers, showing high regional differences. Meanwhile, the high density of airports in the Yangtze River Delta and Pearl River Delta may lead to the dispersion of airport passenger flow. Therefore, the density of airports on a regional scale affects the magnitude of passenger traffic at individual airports. Hong et al. examined the relationship between transportation infrastructure and regional economic growth in 31 provinces of China. They believed that land and water transportation had significant impacts on economic growth, and the contribution of air transportation was relatively minor [15]. Meanwhile, after investigating the Granger causal relationship between air transportation activities (passenger and freight flows) and economic growth in all countries in South Asia, Hakim et al. considered that the increase in air transportation had no apparent impact on the economy, and there was no bidirectional relationship between the two [16]. This suggests that the relationship between the economy and air transport should not be studied in general terms using GDP as a sole indicator, but rather should be comprehensively analyzed in relation to other economic indicators such as total retail sales of consumer goods and value added of the tertiary sector. Generally, regional GDP is the main influencing factor when forecasting and modeling airport flow. Multiple collinearities exist between GDP and route mileage, population, the proportion of tertiary industry in GDP, and other variables [19]. Gao et al. calculated the weight ratio of seven indicators, such as regional GDP, number of tourists, and resident population to passenger flow, using the Pearson correlation coefficient method and concluded that each indicator significantly correlated with airport passenger flow [14]. However, after removing the influence of the total retail sales of consumer goods and the added value of the tertiary industry through the partial correlation method, the relationship between airport passenger flow and GDP growth was weak. In addition, the study found that the relationship between regional population and airport flow was significant. Huang et al. examined the air transportation flows in Europe, Canada, and the United States using data on network characteristics, city population, and local area GDP, and found that demographic factors have a significant impact on passenger traffic when the city population exceeds 100,000 people [20]. However, the correlation analysis was based on developed countries with high per capita GDP. In developing countries with low per capita GDP, the development trend between population and airport flow might be different due to the disharmony of regional development. Shu calculated the correlation coefficient between the GDP of China and passenger flow through SPSS 12.0 as being as high as 0.97, but the correlation coefficient between population and passenger flow was only 0.80 [15]. Zhang et al. used the principal component analysis method to study the influencing factors of passenger flow at four airports with an annual passenger throughput of more than 10 million in China [21]. Through analyzing regional GDP, urban population, tourist numbers, railway flow, highway flow, and other factors, the same factors showed differences in different airports. However, high consistency in the main influencing factors was shown, such as GDP level, tourism resources, total retail sales of social consumer goods, etc. Wang et al. found that in terms of topological measurements, air transport in China is characterized similarly to India but differently from the US [22]. The air transportation in low-income countries usually features point-to-point connections between city pairs, while high-income countries are increasingly prompted to utilize a hub-and-spoke system due to their mature air travel markets [20,23]. Therefore, it is necessary to analyze key indicators (such as GDP and income of the population) in order to predict changes in passenger flow more objectively. In addition, Li used the grey correlation theory to demonstrate that regional tourism development in China has a significant role in promoting airport passenger flow [19]. Among these results, the ratio of Hainan air travel (the ratio of airport passenger flow to the number of tourists received) was as high as 69–99%, and the ratios of the southwest and northwest regions were higher than those of North China and East China. Meanwhile, the China civil aviation business statistics also confirmed this statement. The tourist flow accounts for one-third of the airport passenger flow and has become essential to civil aviation transportation [24]. Although the number of tourists is closely related to the growth of passenger flow, there may be no nonlinear relationship between the number of tourists and the demand for baggage. It is generally believed that tourists who travel carry little baggage.
3.2. Micro-Factors
From the micro level, indicators such as dates (including workdays, holidays, winter and summer holidays, etc.), time intervals, weather, flight types, and the number of routes have different promotion degrees on airport traffic [25,26,27]. Zhu et al. made a horizontal comparison of different airports from the number of flights, ticket price, transportation mode, airworthiness days, and other aspects [28]. According to his research result, airworthiness days were closely related to weather conditions, and weather conditions and different dates have a significant impact on passenger flow. Zhong et al. analyzed the impact of different time intervals (in 30 min), visual distance in the airport areas, flight number, and check-in passenger flow on the security passenger flow of an airport [29]. Through this study, they found that the security passenger flow of different time intervals varied greatly. Meanwhile, the weather conditions were closely related to the number of flights and check-in passenger flow. The flight type (international and domestic flights) and the number of routes have a great impact on the airport baggage flow. For example, passengers on international flights usually have a long journey and travel time, so the baggage demand may be greater than for passengers on domestic flights. Within a regional context, the implementation of visa restrictions has the potential to significantly impede air passenger flow between countries, while disparities in international traffic patterns can be attributed to variations in visa policies across nations [20]. In addition, psychological factors of passengers, airport service, travel purpose, ticket price and discount, and other factors that are difficult to quantify could have a significant impact on the baggage flow. The scientific calculation of the relevant impact weight is one important research direction in the future. According to the literature research, the main influencing factors of departure baggage flow are classified into the following categories, as shown in Table 1. The factors that affect baggage flow can be categorized into two main categories: macro-influences and micro-influences. Macro-influences include the total retail sales of consumer goods, regional industrial structure, regional population, highway transport, railway transport, adjacent airports, etc. Micro-influences include the passenger flow, number of flights/air lines, different types of dates (weekdays or non-workdays, and periods like summer and winter vacations, etc.), international/domestic flights, visa policies, weather conditions, airport service quality, passengers’ psychological factors, purpose of passenger travel, airfare costs and discount strength, etc.
Transportation flow forecasts can be categorized based on their time horizon into long term (monthly, quarterly, or annually) and short term (measured in days or time periods of the day) [30,31,32]. The selection of feature vectors differs between the two prediction approaches. When forecasting baggage flow over the long term, influencing factors tend to be more macroscopic due to the extended time span. For instance, the size of the baggage flow is closely related to the regional economy, population, and other factors [15,20]. In making short-term baggage flow forecasts, the relationship between influencing factors and baggage flow is more microscopic, such as weather conditions, passenger flow, weekdays, or holidays [31,32]. Changes in these factors can lead to significant fluctuations in baggage flow within a short period. Moreover, difficult-to-quantify factors like passengers’ psychological states, travel purposes, and airport service levels can contribute to short-term baggage flow fluctuations. Scientifically quantifying these factors represents a key direction in the study of baggage flow demand. Therefore, the airport baggage flow has many affecting factors and is impacted by the joint action of various indicators. Their relationship is not a simple linear one but is complex and nonlinear. The accurate map of this complex nonlinear relationship is essential to baggage flow forecasting modelling.
4. Analysis of Methods for Forecasting Transportation Flow
The prediction of baggage flow is a crucial component of the research process for airport baggage handling systems. Studies have indicated that methods used for passenger flow prediction can be adapted for baggage flow prediction, although differences may exist in the selection of feature vectors and optimization methods [33]. Given the limited literature on baggage flow forecasting and its significance within the field of transportation flow forecasting, the primary focus is on transportation flow forecasting methods. This approach aims to apply these methods in a dialectical manner to the study of baggage flow forecasting. The current research on traffic flow prediction methods has been considered, and can be divided into two categories, qualitative and quantitative prediction. Qualitative prediction is based on “subjective judgment” centred on “people”. The methods include survey prediction, analogy, brainstorming, etc. However, its disadvantages are very obvious, such as the inability to quantify, low accuracy, and the difficulty in making a scientific and accurate description of the development of things [12,15]. For example, when selecting feature vectors for baggage flow prediction, the qualitative prediction method relies solely on subjective judgment to determine whether a factor influences baggage flow, making it impossible to scientifically analyze its correlation. Meanwhile, quantitative prediction contains linear and nonlinear predictions, of which nonlinear prediction is an important research direction. Three traffic flow prediction models were adopted based on a mathematical statistics model, an intelligent algorithm, and a combination algorithm. Table 2 compares common algorithms in the three traffic flow prediction models.
4.1. Based on Mathematical and Statistical Models
The model based on mathematical statistics applies the relationship between random variables for quantitative description, such as the time series method, grey models (GMs), Kalman filter (KF), etc. The time series method aims to establish the algorithm model based on the rule of the time series change in baggage flow, such as the autoregressive model, the autoregressive integrated moving average model (ARIMA), etc.
Time Series Analysis (TSA) is a mathematical and statistical method used to analyze and predict changes in data based on their temporal order. It is widely used in various fields, including transportation. TSA elucidates data behavior by extracting information on trends, seasonality, and residuals from the data [34]. Based on this understanding, predictions and decisions are made. The main advantage of TSA lies in its transparent analysis process, in contrast to the “black box” phenomenon often associated with the analysis processes of artificial neural networks. ARIMA is the most common prediction model used for time series analysis. When modelling, the data need to be stabilized first. Since the baggage flow is periodic, the seasonal difference can be used to stabilize the baggage flow data. Then, ARIMA research, the SARIMA model, is used. Anilkumar employed the residual method to fit a SARIMA model, choosing the model with the smoothest residuals for predicting the passenger flow of a U.S. airline over the next 24 months. Based on this model, he concluded that the airline’s passenger flow is expected to continue growing [35]. However, its disadvantage is that the time series data must be stable, so it lacks advantages in nonlinear analysis. TSA typically yields good results for long-term predictions of passenger or baggage flow, yet it proves less effective for short-term forecasts. For example, Chandra et al. used SARIMA to predict the traffic flow on freeways for a short time [36]. During this research, they found that the prediction accuracy of the regular traffic flow was high. However, the mean absolute percentage error (MAPE) of the prediction on the random traffic flow was more than 10%.
The principle of the GM is that the modelling process of generating exponential law through the accumulation of baggage flow data or other ways has a good effect on short-term prediction. However, it is not ideal for solving multiclassification problems. For example, Wang used the dynamic improved grey model to calculate the passenger throughput of China Hongqiao airport from 2008 to 2017 to predict the situation from 2018 to 2020 [37]. Although the relative error of the simulation was only 2.1%, the actual result had a significant deviation.
The KF aims to calculate the optimal value of the current traffic based on the traffic at the previous and current time nodes and then calculate the next time node value. Its advantages are its nonlinear processing ability and accuracy, but it is easy to be disturbed by noise data. Meanwhile, the calculation amount is large because of the complex model. Okutani and Chen et al. applied the KF to predict traffic flow; the prediction results were more accurate after eliminating the noise of the data, but the prediction effect on highly nonlinear problems was poor [38,39].
4.2. Based on Intelligent Algorithmic Models
As one of the current mainstream research directions, intelligent algorithms are widely used in all walks of life with their characteristics including their multi-quantization of processing information, high prediction accuracy, and ability to find efficient solutions to complex problems. The research of scholars on intelligent algorithms has focused on analyzing prediction theory, model establishment, and algorithm optimization [40,41,42]. Common prediction models include the discrete choice model (DCM), support vector machines (SVMs), decision tree (DT), and the ANN.
The DCM describes the phenomenon by using quantitative methods and stochastic utility theory based on the probability. It needs to consider the airport service level and the regional economic development when modelling. Therefore, the DCM is mostly used to study urban transportation mode selection and spatial patterns, and the nested logit model (NLM) is widely used. For example, the NLM can better explain the passenger structure and flow direction under the impact of the economic situation of the airport location and the competition of the surrounding urban airports on the airport passenger flow. However, the prediction process of this method is relatively complicated, without scientific judgment standards for defining the scope of the airport radiation area. Since much data need to be collected, the feasibility needs further improvement [15,43,44,45].
The principle of an SVM is to maximize the geometric interval between positive and negative categories by establishing an optimal hyperplane space for samples. After that, the SVM fits the historical data of baggage flow based on structural risk minimization to predict the current baggage flow. However, it cannot express the complex correlation within the complex data comprehensively and correctly, and the calculation process may lose some important information reflected between the data, so it is not suitable as a long-term prediction tool. For example, the accuracy of the SVM global model established by WANG et al. when predicting the short-term (in 5 min) passenger flow of the subway was significantly higher than the long-term prediction [46].
DT is a simple and interpretable algorithm based on the “if-else” rule and is the basic model of all tree models. However, its sensitivity to hyperparameters and simple assumptions leads to its easy overfitting. Hou et al. built a long-term traffic state prediction model using DT and random forest (RF) [47]. This method could effectively capture the internal information of the data but it lacked interpretability.
Rule-Based Reasoning (RBR) is a fundamental component of artificial intelligence. It operates by continually using the rules in the knowledge base to match facts and derive conclusions based on those rules. RBR has found applications in various fields, including classification, information sorting, and traffic prediction [48]. RBR employs a rational decision-making design with high interpretability, logic, and transparency, addressing the issue of low interpretability often associated with neural networks. However, RBR struggles with its adaptability to different working conditions and is not well-suited for high-dimensional data. The dimensionality explosion, characterized by an exponential increase in the number of rules with the addition of new rules to the set, poses a significant challenge for machine learning based on RBR [49]. Consequently, in the context of predicting the behavior of complex engineering systems, traditional models may fall short in accurately forecasting future system behavior, necessitating an integrated approach that combines multiple predictive models [50]. Yang et al. have developed a novel RBR system named the Cumulative Belief Rule-Based System (CBBS), which creates cumulative belief rules through the transformation of numerical data and the extended integration of belief rules. The inference process in the rule base entails deducing cumulative belief rules through consistent rule activation and the integration of activated rules [49]. The CBBS addresses the limitations of traditional RBR systems and offers greater adaptability across various forecasting scenarios. Fuzzy inference systems are based on specific rules. In Eren’s study, the Gustafson–Kessel (GK) clustering algorithm is employed instead of a traditional fuzzy clustering method. This approach enables the membership values of the input set to be obtained with the GK algorithm within the fuzzy regression functions framework. The analysis results indicate that utilizing the Gustafson–Kessel algorithm significantly enhances prediction performance over traditional rule-based reasoning algorithms [48].
The ANN was first proposed by scholars such as Mcculloch and Pitts in the middle of the 20th century as a nonlinear dynamic network system that was widely connected by many simple processing units. It was applied to simulate the mathematical model of biological neural network behavior characteristics [51,52], with a good parallel information processing ability and an excellent nonlinear mapping ability. For example, the neural network machine model represented by AlphaGo successively defeated the world go champion and other human giants in 2016 [53]. Furthermore, the AI chat robot model represented by ChatGPT based on a deep neural network showed the vast development potential of neural networks in 2023, proving that the prediction ability of the ANN may be superior to other traditional algorithms [54]. ANNs are divided into multilayer perceptron (MLP), convolutional neural networks (CNNs), recursive neural networks (RNNs), fully convolutional networks (FCNs), long short-term memory networks (LSTMs), BPNNs, and so on based on the different structures of neural networks. Figure 2 presents a schematic of several common neural network structures, while Table 3 displays the comparative results of various commonly used artificial network models.
MLP comprises an input layer, a hidden layer, and an output layer. It adopts a full connection of neurons in each layer, with excellent nonlinear mapping and global optimization capabilities. However, it is inefficient in processing multidimensional data. In practical applications, it is affected by the learning efficiency of parameters. Generally, shallow models (no more than three layers) are used [55,56]. For example, Chen et al. used MLP to estimate near-surface optical turbulence and found that the generalization ability was insufficient when processing a lot of meteorological data [54].
An RNN is characterized by the interconnection of hidden layer neurons. The output of hidden layer nodes depends on the current node input and the previous node value. An RNN can compare the correlation of two events far from the time dimension horizontally. It has a strong ability to extract the characteristics of time series and a good generalization ability, but the sharing of model parameters ignores the independent characteristics of nodes. A gradient disappearance problem seriously reduces the accuracy in dealing with long-term dependence [57,58]. Ling et al. applied an RNN to the fault detection of nuclear power equipment [59]. It could effectively identify the occurrence of creep by collecting the time series data of rotational speed and vibration. However, the long-term prediction might have led to a decline in prediction accuracy because the independent characteristics of each node were ignored.
A CNN is composed of five parts, an input layer, a convolution layer, a full connection layer, a pooling layer, and an output layer. At present, the commonly used CNN structure applies an unsaturated nonlinear function as an excitation function (such as the ReLU function), which can extract and classify features independently. However, its construction needs substantial training data. Meanwhile, it is mostly used in image recognition, state monitoring, and other fields. Le-Net-5 is one of the classic CNN models [42]. For example, Hu et al. obtained more than 97% accuracy when using a CNN to diagnose lung medical images [60]. On the other hand, Shi et al. predicted short-term traffic congestion through a CNN and found that pooling and convolution caused the loss of target location information and other problems, reducing the prediction accuracy [61].
The network structure of an FCN and a CNN is similar, but the difference lies in the connection of adjacent nodes in the network. It converts the full connection mode of a CNN into convolution substitution, which is higher than a CNN in input efficiency, but massive and complex network parameters result in its slow calculation speed and easy overfitting. In general, an FCN is composed of multiple convolution layers. When large convolution cores are needed, too many convolution layers bring a lot of difficulties in calculation and optimization, and the complexity of calculation increases significantly. Yang et al. classified the green tide concentration image and found that applying an FCN to sample the high-power image caused contour distortion and detail loss [62].
LSTM can solve the limitation of an RNN by introducing the concept of the gate control unit, which is the gradient vanishing problem. However, it cannot fully learn the problem of long-time correlation due to its time lag characteristics. Thus, it has high requirements for training data sets. Meanwhile, its good robustness uses the time characteristics of data to solve regression problems, such as the interval or long delay, that the general recurrent neural network cannot process. Therefore, it is mostly used in the direction of traffic flow prediction, autonomous speech recognition, etc. [63,64]. Huang et al. used LSTM to predict the closing price of the Hong Kong Hang Seng index in time series [65]. Although it could solve the problem that the general neural network could not remember and use historical information, the lag significantly reduced its prediction effect.
As a multilayer feedforward neural network, the BPNN is widely used in function approximation and time series prediction. Its core idea is to use the forward transmission of information and the reverse transmission of error, adopt the gradient descent method, and apply the gradient search technology to achieve the minimum error between the actual output value and the expected output value. The research showed that a three-layer BPNN model could accurately and comprehensively reflect the correlation between complex data. Therefore, it could approximate most complex nonlinear functions, with an excellent nonlinear mapping ability and a generalization performance. In a way, it is one of the best traffic flow prediction models [66,67]. In the study of time series problems such as traffic flow prediction, the prediction accuracy of the BPNN can often reach more than 90%, whether it is a long-term or short-term prediction [6,14,29,68].
4.3. Combined Algorithm Model Based on ANN
Although the flow prediction method based on a BPNN has high accuracy, it is still easy to fall into the local minimum rather than the global minimum when dealing with highly nonlinear problems. This shortcoming may cause the problem of good data fitting with the deviated prediction results [69]. A single traffic flow prediction model may not achieve the best accuracy due to its shortcomings, so the combined model comes into being. Luo used a CNN to extract traffic flow characteristics and SVR to predict short-term traffic flow [70]. Compared with the single model, the performance improved by 11%. Liu used the principal component analysis method to extract the main features affecting the network traffic as the input vector of the BPNN and then predicted the network traffic in the future through the BPNN [71]. According to the research result, the mean absolute error (MAE) and normalized mean square error (NMSE) of the combined model were smaller than those of the single prediction model. Next, Guo et al. [72] applied the attention-based spatial–temporal graph convolution network to improve the traffic flow prediction accuracy of a certain section in a road. Compared with the traditional benchmark algorithm, the prediction performance is better. Jiang et al. used an ant colony algorithm to optimize the initial weights and thresholds of the BPNN to predict the short-term traffic flow of roads [73]. Compared with the traditional single model, the MAE decreased by more than 4%. Hui et al. obtained the optimal weight threshold by introducing the PSO algorithm to optimize the BPNN [74]. Through the coupling analysis of the space–time characteristics of the subway passenger flow through three time granularities and two spatial granularities, the prediction accuracy and calculation speed of the combined model were significantly improved. Then, Deng proposed a subspace learning method based on a CNN, solving the prediction problem of fuzzy asymmetric data and improving the prediction ability of the model by converting data into images for spatial feature extraction [75]. Finally, Ji et al. established the traffic flow prediction model in holiday expressways through the LSTM-SVR. Compared with the single SVR and LSTM models, the MAE decreased by 70.93% and 15.74%, confirming the effectiveness of the combined model [76]. According to this study, the combination of different algorithms could overcome the shortcomings of a single algorithm, form complementary advantages, and improve the prediction accuracy of the model.
5. Conclusions
The study of checked baggage flow at airports is critical to the health of the civil aviation industry. This paper thoroughly reviews the current state of the research on baggage flow demand, analyzes the factors that influence baggage flow, and investigates related models for predicting flow. Based on these findings, the paper anticipates trends in baggage flow demand research and outlines potential research directions. This analysis aims to provide a reference for the organization and management of baggage transportation, as summarized below:
- The prediction of checked baggage flow for departing passengers at airports exhibits characteristics of nonlinearity and strong randomness. Although there exists a significant correlation between passenger flow and baggage flow, the growth in departing passenger flow at airports does not necessarily result in a proportional increase in checked baggage flow. The relationship between these two variables is nonlinear, implying that solely relying on forecasting passenger flow to predict baggage flow may overlook the inherent characteristics associated with it.
- When studying the relationship between the economy and baggage flow, GDP should not be used as a sole indicator in general. Instead, it should be comprehensively analyzed in conjunction with other economic indicators such as the total retail sales of consumer goods and value added of the tertiary sector.
- How some factors that are difficult to quantify, such as passenger psychological factors, airport service levels, checked baggage prices, and ticket discounts, affect baggage demand; and how to optimize the relevant service resources of airports based on the research results of baggage flow, including by scientifically allocating check-ins, security, and human resources for different airlines and routes, can be critical directions for future research.
- An ANN should be one of the best baggage flow prediction methods. An ANN can approximate any complex nonlinear function, which makes it more advantageous than other flow prediction methods in terms of its nonlinear mapping ability and generalization performance. At the same time, the application of the combined model based on an ANN overcomes the shortcomings of the single algorithm, forms a complementary advantage, and has huge development potential. Therefore, researchers believe that a combined model based on a neural network can solve complex time series problems such as airport baggage flow prediction.
- An ANN has a wide range of applications. In the future, the development of the ANN prediction model may move forward in the following directions: by further improving the generalization ability of the ANN prediction model; by studying the standard algorithm for the optimal number of network layers and neural nodes to establish a combined forecasting model which is more suitable for the actual demand; and by designing a light and efficient neural network structure.
Author Contributions
The authors confirm the contributions to the paper are as follows: study conception and design: B.J. and J.F.; data collection and analysis: G.D. and J.Z.; draft manuscript preparation: B.J., J.F. and Y.Z. All authors have read and agreed to the published version of the manuscript.
Funding
This research received no external funding.
Conflicts of Interest
Author Bo Jiang is employed by Chengdu Shuangliu International Airport Co., Ltd. The remaining authors declare that the research was conducted in the absence of any commercial or financial relationships that could be construed as a potential conflict of interest.
References
- Society International de Telecommunicatioan Aero-Nautiques. Baggage IT Insights in 2023. 2023. Available online: https://www.sita.aero/resources/surveys-reports/baggage-it-insights-2023/ (accessed on 3 April 2024).
- Yfantis, E.A. An Intelligent Baggage-tracking System for Airport Security. Eng. Appl. Artif. Intell. 1997, 10, 603–606. [Google Scholar] [CrossRef]
- Brunettal, L.; Romanin-Jacu, J.G.; San, N.A.S. Passenger and Baggage Flow in an Airport Terminal: A Flexible Simulation Model. J. Air Traffic Manag. 1999, 6, 361–363. [Google Scholar]
- Takakuwa, S.; Oyama, T. Modeling People Flow: Simulation Analysis of International-Departure Passenger Flows in an Airport terminal. In Proceedings of the 35th Conference on Winter Simulation: Driving Innovation, New Orleans, LA, USA, 7–10 December 2003; pp. 1627–1634. [Google Scholar]
- Zeinaly, Y.; De Schutter, B.; Hellenoorn, H. An Integrated Model Predictive Scheme for Baggage-Handling Systems: Routing, Line Balancing, and Empty-Cart Management. IEEE Trans. Control Syst. Technol. 2015, 23, 1536–1545. [Google Scholar] [CrossRef]
- Yang, Z.C. The Demand Forecasting for the Checked Baggage of the Departing Passengers the Airport Terminal. Master’s Thesis, Harbin University of Technology, Harbin, China, 2013. [Google Scholar]
- Cheng, S.; Gao, Q.; Zhang, Y. Comparative Study on Forecasting Method of Departure Flight Baggage Demand. In Proceedings of the 2014 IEEE Chinese Guidance, Navigation and Control Conference, Yantai, China, 8–10 August 2014; pp. 1600–1605. [Google Scholar]
- Meuter, R.F.; Lacherez, P.Z. When and Why Threats Go Undetected: Impacts of Event Rate and Shift Length on Threat Detection Accuracy during Airport Baggage Screening. Hum. Factors. 2015, 58, 1536–1545. [Google Scholar] [CrossRef] [PubMed]
- Li, Z.; Bi, J.; Zhang, J.; Li, Q. Analysis of Airport Departure Baggage Check-in Process Based on Passenger Behavior. In Proceedings of the 2017 10th International Symposium on Computational Intelligence and Design (ISCID), Hangzhou, China, 9–10 December 2017; pp. 204–207. [Google Scholar]
- Liu, X.; Li, L.; Liu, X.; Zhang, T.; Rong, X.; Yang, L.; Xiong, D. Field Investigation on Characteristics of Passenger Flow in a Chinese Hub Airport Terminal. Build. Environ. 2018, 133, 1536–1545. [Google Scholar] [CrossRef]
- Li, Z.Y. Forecast Research on the Demand for Checked Baggage of Eparting Passengers at the Airport Terminal Based on Data Driven. Master’s Thesis, Beijing Jiaotong University, Beijing, China, 2018. [Google Scholar]
- Xie, X.D. Study on the Forecasting of Passenger Checked Baggage Demand for Departure Flights. Master’s Thesis, Civil Aviation University of China, Tianjin, China, 2020. [Google Scholar]
- Xu, X.B.; He, X.; Li, G.F.; Yang, L.; Kan, X.W. Check-in Baggage Flow Prediction Based on Support Vector Machine Regression Algorithm. Logist. Technol. Appl. 2022, 27, 159–163. [Google Scholar]
- Gao, W.; Xiao, X.M. Prediction of Airport Passenger Throughput Based on Entropy BP Neural Network. Comput. Simul. 2021, 38, 67. [Google Scholar]
- Hong, J.; Chu, Z.F.; Wang, C.Q. Transport Infrastructure and Regional Economic Growth: Evidence from China. Transportation 2011, 38, 737–752. [Google Scholar] [CrossRef]
- Hakim, M.M.; Merkert, R. The Causal Relationship between Air Transport and Economic Growth: Empirical Evidence from South Asia. J. Transp. Geogr. 2016, 56, 120–127. [Google Scholar] [CrossRef]
- Jiao, P.P. Forecasting Method and Its Mechanism of Impacts on Airport Passenger Throughput. J. Transp. Syst. Eng. Inf. Technol. 2005, 5, 107–110. [Google Scholar]
- Silva, P.; Ribeiro, D.; Mendes, J.; Seabra, E.A.R.; Postolache, O. Railways Passengers Comfort Evaluation through Motion Parameters: A Systematic Review. Machines 2023, 11, 465–495. [Google Scholar] [CrossRef]
- Li, C.P. Analysis of the Influencing Factors of China’s Civil Aviation Passenger Volume. Sci. Technol. Ind. 2011, 11, 59–61. [Google Scholar]
- Huang, Z.; Wu, X.; Garcia, A.J.; Fik, T.J.; Tatem, A.J. An Open-Access Modeled Passenger Flow Matrix for the Global Air Network in 2010. PLoS ONE 2013, 8, e64317. [Google Scholar] [CrossRef] [PubMed]
- Zhang, Z.D.; Xu, J.H. An Analysis of Major Factors on Airport Passenger Volumes. Urban Transp. China 2007, 5, 54–57. [Google Scholar]
- Wang, J.; Mo, H.H.; Wang, F.H.; Jin, F.J. Exploring the Network Structure and Nodal Centrality of China’s Air Transport Network: A Complex Network Approach. J. Transp. Geogr. 2011, 19, 712–721. [Google Scholar] [CrossRef]
- Wang, J.; Jin, F. China’s Air Passenger Transport: An Analysis of Recent Trends. Eurasian Geogr. Econ. 2007, 48, 469–480. [Google Scholar] [CrossRef]
- Civil Aviation Administration of China. Report on Development of China Civil Aviation Transportation Industry (2007/2008). 2008. Available online: http://www.caac.gov.cn/GYMH/MHGK/ZGMH/201509/t20150923_1952.html (accessed on 25 February 2023).
- Liu, S.; Wan, Y.; Ha, H.K. Impact of High-speed Rail Network Development on Airport Traffic and Traffic Distribution: Evidence from China and Japan. Transp. Res. Part A Policy Pract. 2019, 127, 115–135. [Google Scholar] [CrossRef]
- Zuidberg, J. Exploring the Determinants for Airport Profitability: Traffic Characteristics, Low-cost Carriers, Seasonality and Cost Efficiency. Transp. Res. Part A Policy Pract. 2017, 101, 61–72. [Google Scholar] [CrossRef]
- Strand, S. Airport-specific Traffic Forecasts: The Resultant of Local and Non-Local Forces. J. Transp. Geogr. 1999, 7, 17–29. [Google Scholar] [CrossRef]
- Zhu, F.; Bao, J.G. A Study on the Conceptual Model of the Influential Elements if Throughput of Tourism Airport. Hum. Geogr. 2010, 25, 128–133. [Google Scholar]
- Zhong, X.; Zhu, C.Y.; Han, X. The Prediction Model Based on BP Neural Network About Airport Security Check Passenger Flow. Adv. Aeronaut. Sci. Eng. 2019, 10, 655–663. [Google Scholar]
- Laña, I.; Lobo, J.L.; Capecci, E.; Ser, J.D.; Kasabov, N. Adaptive Long-Term Traffic State Estimation with Evolving Spiking Neural. Transp. Res. Part C Emerg. Technol. 2019, 101, 126–144. [Google Scholar] [CrossRef]
- Vlahogianni, E.I.; Karlaftis, M.G.; Golias, J.C. Short-Term Traffic Forecasting: Where We are and Where We’re Going. Transp. Res. Part C Emerg. Technol. 2014, 43, 3–19. [Google Scholar] [CrossRef]
- Lana, J.; Velez, M.; Vlahogianni, E.I. Road Traffic Forecasting: Recent Advances and New Challenges. IEEE Intell. Transp. Syst. Mag. 2018, 10, 93–109. [Google Scholar] [CrossRef]
- Feng, B.; Li, Y.; Liu, H. Tying Mechanism for Airlines’ air Cargo Capacity Allocation. Eur. J. Oper. Res. 2015, 224, 322–330. [Google Scholar] [CrossRef]
- Chen, Z.; Ma, M.; Li, T.; Wang, H.; Li, C. Long. Sequence Time-Series Forecasting with Deep Learning: A Survey. Inf. Fusion 2023, 97, 101819. [Google Scholar] [CrossRef]
- Anilkumar, L.J. Time Series Analysis of Airline Passengers. Available online: https://rstudio-pubs-static.s3.amazonaws.com/782060_9f7c2afb62bd4de28c0774cf4ded2658.html (accessed on 1 April 2024).
- Chandra, S.R.; Al-Deek, H. Cross-Correlation Analysis and Multivariate Prediction of Spatial Time Series of Freeway Traffic Speeds. Transp. Res. Rec. 2008, 2089, 64–76. [Google Scholar] [CrossRef]
- Wang, C.; Li, D.; Zhang, Y. Application of Dynamic Improved Grey Model in Airport Throughput Prediction. Comput. Simul. 2019, 36, 74–77. [Google Scholar]
- Okutani, I.; Stephanedes, Y.J. Dynamic Prediction of Traffic Volume through Kalman Filtering Theory. Transp. Res. Part B Methodol. 1984, 18, 1–11. [Google Scholar] [CrossRef]
- Chen, F.; Jia, Y.; An, W. Research of Short-Term Traffic Flow Forecast Method Based on the Kalman Filter. In Proceedings of the 11th International Conference of Chinese Transportation Professionals (ICCTP), Nanjing, China, 14–17 August 2011; pp. 960–968. [Google Scholar]
- Cao, Y.; Zhao, J.; Qu, X.; Wang, X.; Liu, B. Prediction of Abrasive Belt Wear Based on BP Neural Network. Machines 2002, 9, 314–332. [Google Scholar] [CrossRef]
- Filipovska, M.; Mahmassani, H.S. Traffic Flow Breakdown Prediction using Machine Learning Approaches. Transp. Res. Rec. J. Transp. Res. Board. 2020, 2674, 560–570. [Google Scholar] [CrossRef]
- Liu, H.; Li, B.; Liu, C.; Zu, M.; Lin, M. Research on Yield Prediction Technology for Aerospace Engine Production Lines Based on Convolutional Neural Networks-Improved Support Vector Regression. Machines 2023, 11, 875–897. [Google Scholar] [CrossRef]
- Hess, S.; Polak, J.W. Mixed Logit Modelling of Airport Choice in Multi-airport Regions. J. Air Transp. Manag. 2005, 11, 59–68. [Google Scholar] [CrossRef]
- Grosche, T.; Roth, F.; Heinzl, A. Gravity Models for Airline Passenger Volume Estimation. J. Air Transp. Manag. 2007, 13, 175–183. [Google Scholar] [CrossRef]
- Zhang, L.F.; Bian, T. Forecast of Large Airport Access Mode Choice Based on Nested Logit Model. In Proceedings of the COTA International Conference of Transportation Professionals, Shanghai, China, 7–9 July 2017; pp. 4391–5120. [Google Scholar]
- Wang, X.M.; Zhang, N.; Yun, Y.L.; Shi, Z.B. Forecasting of Short-Term Metro Ridership with Support Vector Machine Online Model. J. Adv. Transp. 2018, 2018, 3189238. [Google Scholar] [CrossRef]
- Hou, Y.; Edarap, P.; Sun, C. Traffic Flow Forecasting for Urban Work Zones. IEEE Trans. Intell. Transp. Syst. 2015, 16, 1761–1770. [Google Scholar] [CrossRef]
- Bas, E.; Egrioglu, E. A Fuzzy Regression Functions Approach Based on Gustafson-Kessel Clustering Algorithm. Inf. Sci. 2022, 592, 206–214. [Google Scholar] [CrossRef]
- Yang, L.; Liu, J.; Ye, F.; Wang, Y.; Nugent, C.; Wang, H.; Martinez, L. Highly Explainable Cumulative Belief Rule-Based System with Effective Rule-Base Modeling and Inference Scheme. Knowl.-Based Syst. 2022, 240, 107805. [Google Scholar] [CrossRef]
- Zhou, Z.J.; Hu, C.H.; Yang, D.L.X.J.B.; Zhou, D.H. New Model for System Behavior Prediction Based on Belief Rule Based Systems. Inf. Sci. 2010, 180, 4834–4864. [Google Scholar] [CrossRef]
- Song, S.; Xiong, X.; Wu, X.; Xue, Z. Modeling the SOFC by BP Neural Network Algorithm. Int. J. Hydrogen Energy 2017, 46, 20065–20077. [Google Scholar] [CrossRef]
- Mcculloch, W.S.; Pitts, W.H. A Logical Calculus of Ideas Immanent in Nervous Activity. Bull. Math. Biophys. 1942, 5, 115–133. [Google Scholar] [CrossRef]
- Krizhevsky, A.; Sutskever, I.; Hinton, G.E. ImageNet Classification with Deep Convolutional Neural Networks. Commun. ACM 2017, 60, 84–90. [Google Scholar] [CrossRef]
- Haque, M.U.; Dharmadasa, I.; Sworna, Z.T.; Rajapakse, R.N.; Ahmad, H. “I think this is the most disruptive technology”: Exploring Sentiments of ChatGPT Early Adopters Using Twitter Data. arXiv 2022, arXiv:2212.05856. [Google Scholar]
- Liu, H.; Tian, H.Q.; Li, Y.F.; Zhang, L. Comparison of Four AdaBoost Algorithm Based Artificial Neural Networks in Wind Speed Predictions. Energy Convers. Manag. 2015, 92, 67–81. [Google Scholar] [CrossRef]
- Chen, X.W.; Zhu, W.Y.; Qian, X.M.; Luo, T.; Sun, G.; Liu, Q.; Li, X.B. Estimation of Surface Layer Optical Turbulence Using Artificial Neural Network. Acta Opt. Sin. 2020, 40, 15–21. [Google Scholar]
- Athreya, R.G.; Bansal, S.; Ngomo, A.C.N. Template-based Question Answering using Recursive Neural Networks. In Proceedings of the 2021 IEEE 15th International Conference on Semantic Computing (ICSC), Laguna Hills, CA, USA, 27–29 January 2020; pp. 1–19. [Google Scholar]
- Hocheiter, S.; Schmidhuber, J. Long Short-Term Memory. Neural Comput. 1997, 9, 1735–1780. [Google Scholar] [CrossRef]
- Ling, J.; Liu, G.J.; Li, J.L.; Shen, X.C.; You, D.D. Fault Prediction Method for Nuclear Power Machinery Based on Bayesian PPCA Recurrent Neural Network Model. Nucl. Sci. Tech. 2020, 31, 8–11. [Google Scholar] [CrossRef]
- Hu, Q.H.; Souzal, L.F.F.; Holanda, G.B.; Alves, S.S.; Reboucas Filho, P.P. An Effective Approach for CT Lung Segmentation Using Mask Region-Based Convolutional Neural Networks. Artif. Intell. Med. 2020, 103, 101792. [Google Scholar] [CrossRef]
- Shi, M.; Cai, S.W.; Yi, Q.M. A Traffic Congestion Prediction Model Based on Dilated-Dense Network. J. Shanghai Jiaotong Univ. 2021, 55, 124–130. [Google Scholar]
- Yang, S.; Chen, L.F.; Shi, Y.; Mao, M. Semantic Segmentation of Blue-green Algae Based on Deep Generative Adversarial Net. J. Comput. Appl. 2018, 38, 1554–1561. [Google Scholar]
- Utku, A.; Kaya, S.K. New Deep Learning-Based Passenger Flow Prediction Model. Transp. Res. Rec. J. Transp. Res. Board 2023, 2677, 1–17. [Google Scholar] [CrossRef]
- Yang, D.; Chen, K.R.; Yang, M.N.; Zhao, X.C. Urban Rail Transit Passenger Flow Forecast Based on LSTM with Enhanced Long-Term Features. IET Intell. Transp. Syst. 2019, 13, 1475–1482. [Google Scholar] [CrossRef]
- Huang, T.T.; Yu, L. Application of SDAE-LSTM Model on Financial Time Series Forecasting. Comput. Eng. Appl. 2019, 55, 142–148. [Google Scholar]
- Vlahogianni, E.I.; Karlaftis, M.G. Testing and Comparing Neural Network and Statistical Approaches for Predicting Transportation Time Series. Transp. Res. Rec. J. Transp. Res. Board 2013, 2399, 9–22. [Google Scholar] [CrossRef]
- Sang, B. Application of Genetic Algorithm and BP Neural Network in Supply China Finance under Information Sharing. J. Comput. Appl. Math. 2020, 384, 113–170. [Google Scholar]
- Chen, M.Q.; Feng, J.H. Research of Air Traffic Flow Forecasts Based on BP Neural Network. Adv. Mater. Res. 2022, 671–674, 2912–2915. [Google Scholar] [CrossRef]
- Lou, J.; Li, W. Forecasting Model for the Scale of New-Built Airport Logistics Demand Based on the Back Propagation Artificial Neural Network. In Proceedings of the 2010 International Conference on E-Product E-Service and E-Entertainment, Henan, China, 7–9 November 2010; pp. 3021–3027. [Google Scholar]
- Luo, W.H.; Dong, B.T.; Wang, Z.J. Short-Term Traffic Flow Prediction Based on CNN-SVR Hybrid Deep Learning Model. J. Transp. Syst. Eng. Inf. Technol. 2017, 17, 68–74. [Google Scholar]
- Liu, Y.H. Network Flow Prediction Based on Principal Component Analysis and BP Neural Network. Laser J. 2015, 36, 151–153. [Google Scholar]
- Guo, S.; Lin, Y.; Feng, N.; Song, C.; Wang, H. Attention Based Spatial-Temporal Graph Convolutional Networks for Traffic Flow Forecasting. In Proceedings of the Thirty-Third AAAI Conference on Artificial Intelligence, Honolulu, HI, USA, 27 January–1 February 2019; pp. 922–929. [Google Scholar]
- Jiang, J.; Zhang, J.X. Improved ACO-Optimized BP Neural Network for Short-Term Traffic Flow Prediction. Comput. Simul. 2021, 38, 99–101. [Google Scholar]
- Hui, Y.; Wang, Y.G.; Peng, H.; Hou, S.Q. Subway Passenger Flow Prediction Based on Optimized PSO-BP Algorithm with Coupled Spatial-temporal Characteristics. J. Traffic Transp. Eng. 2021, 21, 210–222. [Google Scholar]
- Deng, S.; Jia, S.; Chen, J. Exploring Spatial–Temporal Relations via Deep Convolutional Neural Networks for Traffic Flow Prediction with Incomplete Data. Appl. Soft Comput. 2019, 78, 714–721. [Google Scholar] [CrossRef]
- Ji, X.F.; Ge, Y.C. Holiday Highway Traffic Flow Prediction Method Based on Deep Learning. J. Syst. Simul. 2020, 32, 1164–1171. [Google Scholar]
Figure 1.
Compares the departure passenger flow and baggage flow of the Chengdu Shuangliu International Airport in different months of 2018.
Figure 1.
Compares the departure passenger flow and baggage flow of the Chengdu Shuangliu International Airport in different months of 2018.

Figure 2.
Schematic structure of several common neural networks. Among them, in the RNN and LSTM networks, denotes the hidden state at time step t, denotes the input at time step t, W denotes the parameters of the neural networks, and denotes the cell state. In the BP networks, taking the BP neural network with a 7-3-1 structure as an example: represent seven sets of input vectors; represents a set of output vectors; is the connection weight between the input layer and the hidden layer; is the connection weight between the hidden layer and the output layer; and are the node thresholds for the hidden layer and the output layer, respectively. (Note: the figure shows schematic representations of neural network structures, which should not be interpreted as detailed designs of actual networks.)


Table 1.
The main factors influencing the flow of checked baggage for departing passengers at airport.
Table 1.
The main factors influencing the flow of checked baggage for departing passengers at airport.
| Macro-Factors | Micro-Factors | Other Factors |
|---|---|---|
| Regional GDP | Passenger flow | Airport service quality |
| Total retail sales of consumer goods | Number of flights/air lines | Passengers’ psychological factors |
| Regional industrial structure | Different types of dates (weekdays or non-workdays, and periods like summer and winter vacations, etc.) | Purpose of passenger travel |
| Regional population | Different date types | Airfare costs and discount strength |
| Tourist resources | International/Domestic flight | |
| Other modes of transport (highway transport, railway transport, adjacent airports, etc.) | Visa policies | |
| Income of the population | Weather conditions |
Table 2.
Compares common algorithms in the three traffic flow prediction models.
| Model Category | Algorithm Name | Advantages | Disadvantages | Application Example |
|---|---|---|---|---|
| Mathematical statistics model | ARIMA | The model is simple, malleable, and transplantable. | It is required that the time series data are stable, sensitive to data, and the nonlinear problem is not solved effectively. | Time series problems such as traffic flow prediction. |
| GM | Better prediction accuracy for problems with short time period and small amount of data. | Unable to be used as a long-term forecasting tool as the calculation is very cumbersome. | Time series problems such as traffic flow prediction. | |
| KF | High prediction accuracy and strong nonlinear processing ability. | The model is complex, sensitive to data, and requires a large amount of calculation | Traffic flow prediction, image recognition, etc. | |
| Intelligent algorithm model | NLM | Structure of the model is simple, and has good characteristics of time transfer and regional transfer. | The mathematical foundation is weak, the structural rigor of the model is insufficient, and the error of the collective calculation results is large. | Flow forecasting, spatial pattern research, etc. |
| SVM | Binary classification algorithm, applicable to both linear and nonlinear problems, and has advantages for high-dimensional data. | It is difficult to determine the parameters of kernel function, and the multiclassification problem is not well solved. | Traffic flow prediction, image recognition, etc. | |
| DT | The algorithm is simple and has advantages in dealing with missing attribute samples. | Easy to overfit. | Traffic flow prediction, classification, and other issues. | |
| ANN | It has good nonlinear mapping ability, learning ability, self-organization ability, and self-adaptive ability. | Easy to overfit. | Traffic flow prediction, image recognition, condition monitoring, etc. | |
| Combined algorithm model | Combined algorithm model based on ANN | High prediction accuracy and low calculation time. | Traffic flow prediction, image recognition, condition monitoring, etc. |
Table 3.
Comparison of several common artificial neural network models.
| Algorithm Name | Structural Features | Advantages | Disadvantages | Application Example |
|---|---|---|---|---|
| MLP | A fully connected neural network, based on back-propagation algorithm. | Excellent nonlinear mapping capability, high parallelism. | Insufficient generalization ability and poor processing of multidimensional data. | Pattern recognition, etc. |
| RNN | The hidden layer node output value depends on the current node output and the previous node value. | Strong ability to extract temporal features and relatively good generalization ability. | The long-term dependence of processing accuracy will decrease. | Automatic speech recognition, fault detection, time series problems such as traffic flow prediction, etc. |
| CNN | The convolutional layer and pooling layer are alternately set, convolution kernel feature extraction, sparse connection, weight sharing. | Self-learning for feature extraction and classification with high recognition rate. | It requires a large training data set and high computer performance. | Image recognition, condition monitoring, etc. |
| FCN | The full connection of neurons is replaced by convolution stacking. | It can accept input data of any size with high segmentation accuracy. | The model complexity can be very large when large size convolution kernels are required. | Image processing, video processing, etc. |
| LSTM | It is composed of input gate, forget door, and output gate, and the information dissemination process can selectively abandon useless information. | It can make better use of the time characteristics of the data center and has good robustness. | It requires a large training data set, is sensitive to data, and has a slow convergence speed. | Time series problems such as traffic flow prediction. |
| BPNN | Forward transfer of information, reverse transfer of errors, based on back-propagation algorithm. | Strong nonlinear mapping ability and flexible network structure, fast convergence speed, and can more fully map the relationship between data. | For highly nonlinear problems, it is easy to fall into local minimum rather than global minimum. | Time series problems such as traffic flow prediction. |
Disclaimer/Publisher’s Note: The statements, opinions and data contained in all publications are solely those of the individual author(s) and contributor(s) and not of MDPI and/or the editor(s). MDPI and/or the editor(s) disclaim responsibility for any injury to people or property resulting from any ideas, methods, instructions or products referred to in the content. |
© 2024 by the authors. Licensee MDPI, Basel, Switzerland. This article is an open access article distributed under the terms and conditions of the Creative Commons Attribution (CC BY) license (https://creativecommons.org/licenses/by/4.0/).
Share and Cite
MDPI and ACS Style
Jiang, B.; Ding, G.; Fu, J.; Zhang, J.; Zhang, Y. An Overview of Demand Analysis and Forecasting Algorithms for the Flow of Checked Baggage among Departing Passengers. Algorithms 2024, 17, 173. https://doi.org/10.3390/a17050173
AMA Style
Jiang B, Ding G, Fu J, Zhang J, Zhang Y. An Overview of Demand Analysis and Forecasting Algorithms for the Flow of Checked Baggage among Departing Passengers. Algorithms. 2024; 17(5):173. https://doi.org/10.3390/a17050173
Chicago/Turabian StyleJiang, Bo, Guofu Ding, Jianlin Fu, Jian Zhang, and Yong Zhang. 2024. "An Overview of Demand Analysis and Forecasting Algorithms for the Flow of Checked Baggage among Departing Passengers" Algorithms 17, no. 5: 173. https://doi.org/10.3390/a17050173
Note that from the first issue of 2016, this journal uses article numbers instead of page numbers. See further details here.