
Strategic Machine Learning Optimization for Cardiovascular Disease Prediction and High-Risk Patient Identification


School of Science and Technology, International Hellenic University, 57001 Thessaloniki, Greece
*
Author to whom correspondence should be addressed.
Algorithms 2024, 17(5), 178; https://doi.org/10.3390/a17050178
Submission received: 21 March 2024
/
Revised: 14 April 2024
/
Accepted: 23 April 2024
/
Published: 26 April 2024
(This article belongs to the Collection Feature Papers in Algorithms and Mathematical Models for Computer-Assisted Diagnostic Systems)
Abstract
:Despite medical advancements in recent years, cardiovascular diseases (CVDs) remain a major factor in rising mortality rates, challenging predictions despite extensive expertise. The healthcare sector is poised to benefit significantly from harnessing massive data and the insights we can derive from it, underscoring the importance of integrating machine learning (ML) to improve CVD prevention strategies. In this study, we addressed the major issue of class imbalance in the Behavioral Risk Factor Surveillance System (BRFSS) 2021 heart disease dataset, including personal lifestyle factors, by exploring several resampling techniques, such as the Synthetic Minority Oversampling Technique (SMOTE), Adaptive Synthetic Sampling (ADASYN), SMOTE-Tomek, and SMOTE-Edited Nearest Neighbor (SMOTE-ENN). Subsequently, we trained, tested, and evaluated multiple classifiers, including logistic regression (LR), decision trees (DTs), random forest (RF), gradient boosting (GB), XGBoost (XGB), CatBoost, and artificial neural networks (ANNs), comparing their performance with a primary focus on maximizing sensitivity for CVD risk prediction. Based on our findings, the hybrid resampling techniques outperformed the alternative sampling techniques, and our proposed implementation includes SMOTE-ENN coupled with CatBoost optimized through Optuna, achieving a remarkable 88% rate for recall and 82% for the area under the receiver operating characteristic (ROC) curve (AUC) metric.
1. Introduction
The World Health Organization (WHO) has reported that approximately 17.9 million individuals succumb to CardioVascular Disease (CVD) annually, establishing CVDs as a leading cause of global mortality [1]. Despite a decline in CVD mortality rates over the last three decades, this favorable trend is beginning to plateau, raising concerns about a potential reversal unless substantial and concerted efforts are undertaken.
This challenge necessitates a transformative stance towards preventive healthcare, whereby our response transcends mere reaction to illness and instead emphasizes the anticipation and interception of risk factors before they converge into potentially devastating outcomes. Accurately predicting CVD risk based on personal lifestyle factors is pivotal for facilitating early intervention and implementing preventive measures.
Nevertheless, diagnosis poses a significant challenge for practitioners due to the intricate nature of CVDs, which are frequently conflated with signs of aging. In this context, machine learning (ML) algorithms have emerged as invaluable assets, leveraging their capacity to uncover intricate patterns and relationships within datasets, empowering healthcare practitioners with predictive tools for the early detection and intervention of CVD [2].
CVDs refer to a group of conditions that affect the heart and blood vessels, often leading to complications such as heart attacks, strokes, and other circulatory disorders [3]. These conditions can arise due to factors such as plaque buildup in the arteries (atherosclerosis), hypertension (high blood pressure), inflammation, and various lifestyle factors such as diet, physical activity, and smoking [3,4]. Symptoms of CVD can range from chest pain and shortness of breath to numbness and weakness in the extremities, highlighting the diverse nature of these conditions [5,6].
In this context, prevention emerges as the cornerstone for maintaining good health and detecting potential health concerns at an early stage before they escalate into complications or become more challenging to manage [7]. Regrettably, the uptake of preventive measures falls significantly short of what is necessary. A study from 2018 revealed that merely 8% of adults in the United States aged 35 years and above received the recommended preventive care [8]. This disparity underscores the substantial gap between the potential advantages of preventive healthcare and its current implementation. Consequently, the role of technology, data analytics, and predictive modeling in preventive healthcare has become increasingly vital.
The advancements in technology facilitate a health management approach that is not only more vigilant but also highly personalized. Through the application of data analytics and predictive models, healthcare professionals can meticulously analyze extensive datasets comprising crucial information, ranging from an individual’s medical history and lifestyle choices to genetic predispositions and beyond [9]. This thorough analysis enables the identification of intricate patterns and risk factors, particularly those associated with conditions like CVD.
The utility of these advanced tools transcends mere pattern recognition. It enables the precise identification of high-risk individuals before clinical symptoms manifest, thus expediting the deployment of targeted interventions and tailored treatment strategies [8,10]. Early detection holds transformative potential in disease management and patient outcomes. By identifying the onset of health issues at their nascent stages, healthcare providers can initiate timely and personalized interventions tailored to individual needs. This enhances treatment effectiveness, reduces complications, alleviates the burden on healthcare resources, and ultimately improves overall patient quality of life [11]. Consequently, early detection not only yields medical benefits but also optimizes the overall healthcare system and promotes population health resilience.
Predictive analytics can also play a crucial role in discerning patients at high risk of hospital readmission [12]. Forecasting patient readmission allows clinicians to adjust post-hospitalization treatment strategies, thereby saving costs, conserving healthcare resources, and improving patient outcomes [13]. Additionally, predictive analytics in healthcare assist in identifying potential population health trends or outbreaks. For instance, a study published in The Lancet, a public health journal, utilized predictive analytics to forecast health trends, indicating a rise in alcohol-related liver diseases in the US due to alcohol consumption patterns. Moreover, predictive analytics could have anticipated the COVID-19 pandemic, as evidenced by BlueDot, a Canadian company issuing warnings about unfamiliar pneumonia cases in Wuhan, which preceded the World Health Organization’s official declaration of the novel coronavirus emergence [14].
However, as we embrace technological advancements, addressing challenges related to data privacy, predictive model accuracy, and equitable access to healthcare resources is crucial. Balancing the potential benefits of technology with ethical considerations will be instrumental in shaping the future of preventive healthcare.
1.1. Related Work
In recent years, significant progress has been made in applying data mining and ML methods to predict CVDs, emphasizing early detection and prevention. These advancements have been strongly influenced by seminal studies in the field, prompting an examination of their methodologies, outcomes, and limitations. Researchers have demonstrated the potential of various ML and deep learning models to achieve high accuracy in predicting CVDs.
The authors in [15], from the very outset in 2017, evaluated four different models using clinical data from over 300,000 homes in the United Kingdom, with neural networks demonstrating the highest accuracy in predicting CVDs, particularly with extensive datasets. Another research [16] developed an ensemble of ML and deep learning models that achieved an 88.70% accuracy, with the ML ensemble model emerging as the most accurate. Another study [17] designed a machine intelligent framework (MIFH) for predicting heart diseases, achieving improved sensitivity rates and selecting the best possible solution among input predictive models.
In [18], the authors proposed a model that integrates bagging ensemble learning with decision trees and employs feature extraction via Principal Component Analysis (PCA), achieving an impressive accuracy rate of 98.6% on a practical heart dataset. The researchers in [19] developed a predictive model aimed at forecasting the likelihood of cardiac events in hypertensive individuals, utilizing electrocardiogram (ECG) data as the input. They creatively combined a convolutional neural network with a long short-term memory network, resulting in a hybrid model. This fusion leveraged time-series data to detect early increases in hypertension occurrences among individuals.
The research in [20] directed efforts towards creating an intelligent agent for CVD prediction using a multi-layer dynamic system based on ensembles. The proposed model integrates five feature selection algorithms alongside advanced ensemble learning techniques, achieving high accuracy rates, with up to a 94.16% accuracy and a 0.94 Area Under the Curve (AUC) value on a realistic heart dataset. Notably, this multi-layer dynamic system perpetuates the classification process across successive layers by enhancing knowledge at each level, yielding optimal results.
The study in [21] surpassed other ML algorithms discussed in the literature, achieving a 96.7% accuracy using the random forest classifier and 95.08% using extreme gradient boosting on the Cleveland dataset in 2023. Another study [22] attained an 86% AUC score in predicting diabetes mellitus using the CatBoost classifier. Alongside SHAP values, they identified glycose levels and age as the most influential features.
A recent development in [23] introduced an advanced hybrid ensemble gain ratio feature selection (AHEG-FS) model. This model concentrates on enhancing accuracy and AUC by selecting highly effective features while retaining relevant ones. Nine ML classifiers—adaBoost, logistic regression (LR), classification via clustering (CVC), random forest (RF), k-nearest neighbor (KNN), support vector machine (SVM), boosted regression tree (BRT), naive Bayes (NB), and stochastic gradient boosting (SGB)—were integrated with the proposed AHEG-FS model, which was tailored on medical datasets to design an innovative methodology for enhancing prediction performance. The model achieved an impressive 99% AUC after reducing features by 46.15%.
According to another research [24], methods like CatBoost, random forest, and gradient boosting can accurately predict almost eight out of ten cardiac arrests. Additionally, the authors in [25] achieved an impressive 98.15% accuracy on a Kaggle dataset, showcasing the efficacy of ensemble methods like the extra tree classifier in predicting heart diseases.
The research in [26] proposed the further application of deep neural networks to address heart disease diagnosis, achieving a 90% accuracy rate on the Cleveland dataset by utilizing Talos for optimizing hyperparameters. The study in [27] utilized an artificial neural network (ANN) on the same dataset and assessed its performance across different learning rates and numbers of neurons. The results indicated that the highest accuracy of 80.6% was attained with a learning rate of 0.25 and 25 neurons.
In another study [28], a deep learning methodology was recommended, coupled with the isolation forest algorithm for feature extraction, resulting in an improved accuracy of 94.2% for the University of California Irvine (UCI) dataset. [29] subsequently developed a stacking model comprising both a base learner layer and a meta-learner layer, achieving an impressive accuracy of nearly 96% for predicting the presence or absence of heart disease. These noteworthy findings underscore the potential of deep learning approaches in enhancing predictive performance.
However, the aforementioned studies on heart disease prediction primarily utilize small and relatively balanced datasets. To address the challenge of dataset imbalance in a large-scale dataset, we aim to determine the most suitable classification algorithms for heart disease prediction. Authors in [30] employed a novel approach by integrating stacking ensemble modelling, which combines SVM, NB, and KNN with a 10-fold cross-validation Synthetic Minority Oversampling Technique (SMOTE). This method effectively handles softly imbalanced datasets, yielding a robust accuracy of 90.9%. Researchers in [31] utilized the Synthetic Minority Oversampling Technique along with the edited nearest neighbor (SMOTE-ENN) data resampling technique and hyperparameter optimization, resulting in notable improvements in classifier performance, especially in predicting the survival of patients with heart failure.
Another study in [32] also leveraged the Synthetic Minority Oversampling Technique (SMOTE) to address class imbalance and noise present in the Cleveland dataset. By employing an AdaBoost random forest classifier, they achieved an accuracy of 95.47% in the early detection of heart disease. Researchers in [33] attempted to mitigate imbalance in the National Health & Nutrition Examination Survey (NHANES) dataset through a two-step approach involving a least absolute shrinkage and selection operator (LASSO)-based feature weight assessment, followed by majority-voting-based identification of important features.
The authors in [34] chose to under sample cases without CVDs to reduce medical resource consumption and false positive cases. They developed a three-layered model that iteratively trains models and incorporates predictions from previous layers as features. Also, in their investigation, [35] achieved a notable 30.4% improvement in their model’s sensitivity by integrating the SMOTE-Tomek with random forest algorithm.
Another research [2] also utilized the 2021 BRFSS data, which mirrors the dataset used in our study, advocated for increased involvement of logistic regression in the workflow for CVD prediction. They demonstrated that logistic regression accurately classified 79.18% of individuals with CVDs and 73.46% of healthy individuals, identifying sex, diabetes, and general health as the most influential factors in predictions. These findings align well with our study, in which we offer improved results, and we also emphasize minimizing false negatives to help ensure timely medical attention for high-risk individuals.
1.2. Research Overview
This study focuses on the realm of early and precise detection of heart diseases, leveraging the prowess of ML and deep learning algorithms. Operating within the intricate landscape of highly imbalanced datasets drawn from past patient records, our research focuses on achieving heightened accuracy levels in disease prediction.
Specifically, we explore the efficacy of two oversampling techniques (SMOTE and ADASYN) and two hybrid resampling algorithms (SMOTE-Tomek and SMOTE-ENN) alongside six ML models (logistic regression (LR), decision tree (DT), random forest (RF), gradient boosting (GB), XGBoost classifier (XGB), and CatBoost) complemented by the application of an ANN.
The primary contributions of our investigation are given below:
- Addressing the inherent class imbalance prevalent in real-world medical datasets by implementing a range of resampling methodologies aimed at enhancing model performance.
- Discerning the optimal compatibility between specific classification algorithms and corresponding statistical sampling techniques.
- Enhancing the models’ sensitivity to identify positive cases within the imbalanced dataset, notably witnessing a remarkable surge in sensitivity from 4% to an impressive 88% with the utilization of CatBoost.
Ultimately, this study effectively addresses a noteworthy research gap by thoroughly exploring ML and deep learning models for CVD risk prediction based on personal lifestyle factors on a highly imbalanced dataset. By comparing model performance and resampling methods, identifying influential attributes, and investigating the impact of hyperparameter tuning, this study provides valuable insights for healthcare professionals and researchers by transitioning our focus from reactive to proactive healthcare paradigms; we aspire to catalyze a transformative shift in healthcare dynamics.
2. Materials and Methods
Our study endeavors to predict CVDs by employing advanced ML techniques. Operating within the realm of real-world datasets characterized by significant class imbalances, our research underscores the importance of minimizing false negative (FN) cases, thereby enhancing the landscape of preventive healthcare. Figure 1 provides a visual depiction of our study’s methodology.
Initiating with preprocessing and feature engineering procedures, our methodology encompassed comprehensive data cleaning, outlier detection, distribution assessments, and data scaling. Additionally, we introduced supplementary features to unravel nuanced patterns embedded within the dataset. After data preparation, we confronted the challenge of class imbalance through the implementation of two oversampling techniques (SMOTE and ADASYN) alongside two hybrid resampling methods (SMOTE-ENN and SMOTE-Tomek) applied to our training data.
In sequence, we deployed six distinct ML algorithms—logistic regression, decision tree, random forest, gradient boosting, XGBoost, and CatBoost—while constructing an ANN. Proceeding forward, we meticulously optimized our models through a comprehensive hyperparameter tuning processes.
The culmination of our study involves the presentation and analysis of performance results gleaned from each resampling technique. Central to our investigation is the quest to identify the most effective combination that maximizes the sensitivity metric. This intensified focus on sensitivity stands as our pivotal contribution to mitigating the challenges posed by class imbalance within heart disease datasets, refining existing approaches that have often sacrificed sensitivity in favor of elevated accuracy levels.
This study was conducted utilizing Google Colab, an online platform tailored for executing Python code. The computational environment provided by Google Colab included:
- Operating System: Linux-based environment;
- GPU: NVIDIA Tesla T4;
- Driver Version: 525.105.17;
- CUDA Version: 12.0.
- The analysis, computations, and visualizations were performed using Python 3.10.12 within the Google Colab environment. Key libraries utilized included Pandas 2.0.3 and Numpy 1.25.2 for data manipulation and preprocessing. For model training and validation, we employed Sklearn 1.4.2 and TensorFlow 2.15.0, supplemented by Optuna 3.6.1 and SciPy 1.12.0 for hyperparameter tuning and statistical analysis. Additionally, for visualization purposes, we utilized the Seaborn and Matplotlib libraries.
2.1. Data Collection
The data collection process for this study involved accessing the 2021 annual Behavioral Risk Factor Surveillance System data (BRFSS) [36], a health-related telephone survey, which was obtained from the Center for Disease Control (2021). The dataset, comprising 308,854 records with a total of 304 attributes, was accessed on a local machine for analysis and model development. However, not all of these attributes were utilized in this specific study, as they were considered irrelevant. Therefore, a subset of 19 attributes was deliberately selected and was integrated into the construction of the predictive model, which aimed to identify high-risk individuals for CVD. The target variable (‘Heart_Disease’) represents whether an individual is likely to be at risk for CVD (class 1) or not (class 0). The subset of the BRFSS dataset used is displayed in Table 1, and it consists of 19 distinct features.
This curated subset, comprising 19 features, encapsulates most of the known risk factors associated with CVDs. As we delve into our analysis and model construction, these distilled attributes serve as crucial indicators, guiding our research for effective risk prediction and proactive healthcare intervention.
2.2. Exploratory Data Analysis
Exploratory data analysis (EDA) stands as a cornerstone in predictive analytics, serving to illuminate feature interactions, unveil correlations, discern valuable patterns, and foster data comprehension before venturing into predictive modeling. In our endeavor to unlock insights within the BRFSS dataset pertaining to heart disease, we leveraged various data analysis methodologies, including descriptive statistics, data visualization, and correlation analysis.
A preliminary statistical examination unveiled pivotal characteristics embedded within our dataset:
- The Sex distribution indicates a slight predominance of females over males, with females comprising 52% of the population.
- Patient demographics span diverse age categories, with the highest representation observed in the 50–54 age group, closely trailed by the 55–59 and 60–64 age brackets. Notably, fewer young individuals participated in the survey, suggesting the potential applicability of the predictive model to older demographics.
- The majority of patients perceive their overall health as “Good”, with “Very Good” emerging as the next frequently chosen option. Relatively fewer patients (33%) categorize their health as “Fair” or “Poor”.
- A significant portion of patients (77%) underwent a medical checkup within the previous year.
- Most patients reported no history of diabetes, arthritis, cancer, or depression.
- The majority of patients had no smoking history (59%) and engaged in regular exercise (78%).
Furthermore, gaining precise insights into the distribution of the target variable within the dataset is imperative. Our analysis of the BRFSS data unveiled a notable class imbalance, as depicted in Figure 2. Merely 8.1% of the surveyed population reported a diagnosis of heart disease, accentuating the challenge of class imbalance in our modeling endeavors. Such imbalance may predispose the model towards the majority class of non-CVD cases, potentially compromising its efficacy in identifying high-risk patients. Addressing this imbalance is paramount to mitigating bias and enhancing model performance in risk prediction.
Afterwards, we conducted a correlation analysis, which shed light on the intricate relationships between various features and the risk of developing CVD. One notable observation is the negative correlation between general health and both heart disease and diabetes. This suggests that individuals who rate their general health poorly are more prone to developing one or both diseases, underscoring the importance of overall health status in disease prevention.
Similarly, the negative correlation observed with exercise implies that engaging in regular physical activity may contribute to reducing the risk of developing CVDs. This aligns with established knowledge emphasizing the benefits of exercise in promoting cardiovascular health.
On the other hand, the positive correlation between age category and the target variable is unsurprising, as age is a non-modifiable risk factor strongly associated with increased CVD incidence. This underscores the importance of age as a critical determinant in assessing cardiovascular risk.
The identified influential features for prediction, including general health, age category, diabetes, arthritis, and exercise, resonate with existing research in the field of CVDs. These factors have been consistently recognized as significant contributors to CVD risk and progression.
Overall, these findings provide valuable insights into the factors influencing CVD risk and serve as a foundation for developing predictive models aimed at early detection and prevention strategies in cardiovascular health management.
2.3. Data Wrangling
Data wrangling serves as the foundational step in the journey from raw data to meaningful insights and actionable outcomes. In this chapter, we focus on the intricate process of data preprocessing and feature engineering, essential components of preparing datasets for analysis and modelling. Data wrangling encompasses a series of tasks aimed at transforming raw data into a format conducive to analysis, addressing issues of quality, consistency, and relevance.
2.3.1. Data Preprocessing
The subsequent phase involved the preprocessing of the dataset, aiming to render the data as more compatible with ML algorithms and conducive to modeling. Notably, the dataset exhibited no missing values, and its output was binary, categorizing individuals as either unaffected by heart disease (labeled 0) or reporting its presence (labeled 1). Initially, 80 duplicated observations were identified and removed to mitigate potential noise and inaccuracies. While outliers were detected in variables such as weight, height, and Body Mass Index (BMI), they were deemed as extreme yet potentially meaningful values and were retained within the dataset. Additionally, normalization of input features was performed using MinMaxScaler, ensuring that all features fell within the range [0, 1] to facilitate a uniform contribution to model fitting and prevent bias stemming from varying scales.
2.3.2. Feature Engineering
Subsequently, we engaged in feature engineering to augment the informativeness and relevance of the data for our predictive objectives. Initially, binning was applied to the “BMI” feature to facilitate interpretability, categorizing BMI values into underweight, healthy weight, overweight, and obese ranges [1,37].
Binning continuous variables like BMI can help mitigate the impact of outliers and non-linear relationships, making the data more amenable to modelling techniques that assume linearity or require categorical inputs. Furthermore, we devised a composite variable labelled “Overall_Diet”, which quantifies an individual’s dietary habits by considering the consumption of green vegetables, fruits, and fried potatoes. The inclusion of fruits and vegetables contributes positively to the score, while fried potato consumption detracts from it.
In an effort to discern potential correlations between individual habits and heart disease development, the feature “Substance_Use” was introduced, encapsulating the interaction between smoking and alcohol consumption. Notably, a modified mapping was employed for the smoking variable, with smokers being assigned a value of “−1” and non-smokers designated as “0”, thereby accentuating higher negative values for individuals engaging in both tobacco and alcohol use.
Further preprocessing steps involved converting features such as Heart_Disease, Skin_Cancer, Other_Cancer, depression, arthritis, Smoking_History, and exercise from Yes/No values to binary format. Additionally, ordinal features like General_Health, BMI_Category, and Age_Category underwent label encoding to retain their ordinal nature, while categorical nominal features such as sex and diabetes were subjected to one-hot encoding to prevent the model from inferring spurious relationships between categories.
2.4. Resampling Techniques
In the domain of data-driven decision making, the significance of data quality and integrity cannot be overstated. The efficacy of predictive models, irrespective of their application domain, heavily hinges on the quality of the data they are trained on. A prevalent challenge encountered in real-world datasets is data imbalance, which poses a substantial obstacle to achieving accurate predictions and robust model generalization. Data imbalance manifests when the distribution of classes within the dataset is highly skewed, with one class significantly outnumbering the others. Traditional ML models often struggle with imbalanced data, exhibiting a tendency to prioritize the majority class while potentially overlooking crucial patterns within the minority class.
To tackle the issue of imbalanced datasets, resampling techniques have emerged as a widely adopted strategy. Resampling involves the manipulation of dataset instances, typically through under sampling of the majority class and/or oversampling of the minority class. The primary aim of this section is to offer a comprehensive insight into various resampling techniques that have proven effective in addressing the imbalance challenge.
These techniques encompass methodologies such as the Synthetic Minority Oversampling Technique (SMOTE), SMOTE combined with edited nearest neighbors (SMOTE-ENN), SMOTE combined with Tomek links (SMOTE-Tomek), and Adaptive Synthetic Sampling (ADASYN).
2.4.1. Synthetic Minority Oversampling Technique (SMOTE)
SMOTE stands out as an oversampling technique designed to generate synthetic samples for the minority class. Unlike random oversampling, which can lead to overfitting, SMOTE operates within the feature space, creating new instances through interpolation between closely positioned positive instances.
Initially, the total number of oversampled observations, denoted as N, is determined. Typically, this value is selected to attain a balanced binary class distribution of 1:1, although adjustments can be performed based on specific requirements. The process initiates by randomly selecting a positive class instance, followed by identifying its K-nearest neighbors, often set to 5 by default. Subsequently, N instances from this set of K neighbors are chosen to generate new synthetic instances. This is achieved by calculating the difference in distance between the feature vector and its neighboring instances using a chosen distance metric. The difference is then multiplied by a random value in the range (0, 1] and added to the original feature vector [38].
2.4.2. Adaptive Synthetic Sampling (ADASYN)
Adaptive Synthetic Sampling (ADASYN) represents an extension of the SMOTE algorithm, with a focus on adaptability in addressing the challenges posed by imbalanced datasets. ADASYN operates by boosting the representation of the minority class through the creation of synthetic instances. Unlike SMOTE, ADASYN adjusts its oversampling rate based on the difficulty of classifying instances due to their proximity to the decision boundary. Instances that are harder to classify receive a higher oversampling rate, while those that are easier to classify receive a lower rate. Additionally, ADASYN explores the nearest neighbor area more comprehensively by considering the majority class data points present within that region [39]. This adaptability ensures a balanced oversampling technique while preventing over-generalization.
2.4.3. SMOTE Combined with Edited Nearest Neighbors (SMOTE-ENN)
SMOTE combined with edited nearest neighbors (SMOTE-ENN) integrates both undersampling and oversampling methods to enhance classifier performance. SMOTE augments the underrepresented class, while edited nearest neighbors (ENNs) eliminate observations from both classes that deviate from their K-nearest neighbor majority class. This hybrid approach ensures a balanced dataset free from noisy or misleading data points, thereby improving predictive accuracy [39].
2.4.4. SMOTE Combined with Tomek Links (SMOTE-Tomek)
SMOTE combined with Tomek links (SMOTE-Tomek) is another hybrid algorithm that balances data by generating synthetic minority class instances and subsequently removing noisy and borderline instances using Tomek links, an undersampling technique. A Tomek link exists between two instances from different classes that are each other’s nearest neighbors in the feature space. By removing these links, ambiguous data points are eliminated, resulting in a cleaner and more balanced dataset [35].
2.5. Modeling
In this chapter, we briefly discuss the classification algorithms employed in our study, as well as the configuration of the models’ fine-tuning.
Logistic regression: Logistic regression is a favored model for predicting the likelihood of a target variable, employing the sigmoid function to transform real-valued inputs into probabilities ranging from 0 to 1. By formulating a hypothesis and thresholding it at 0.5, logistic regression facilitates binary classification, with values above 0.5 indicating the presence of heart disease (y = 1) and values below 0.5 indicating a healthy individual (y = 0) [40].
Decision tree: Decision trees are widely used for regression and classification tasks, offering a clear and interpretable method for making predictions. With branches representing decisions and leaf nodes denoting outcomes, decision trees encapsulate training data in a compact tree structure. Despite their susceptibility to overfitting, techniques like pruning and ensemble methods enhance their generalization to unseen data [41].
Random forest: Random forest is an ensemble learning algorithm that constructs multiple decision trees with random subsets of data and features during training. By combining predictions from individual trees, random forest mitigates overfitting and enhances decision-making accuracy [35].
Gradient boosting: Gradient boosting combines weak learners, often decision trees, into a robust predictive model by iteratively rectifying errors introduced by prior learners. Continuous reduction of residual error with each iteration enhances model performance [20].
Extreme gradient boosting (XGBoost): XGBoost is a scalable implementation of gradient boosting, employing techniques like parallel processing and tree pruning to optimize speed and accuracy. It integrates regularization to mitigate overfitting and offers flexibility by allowing custom loss functions [21].
CatBoost: CatBoost, based on gradient boosted decision trees, excels in handling categorical data in diverse datasets. Its ordered boosting approach and use of target statistics facilitate efficient learning without relying on one-hot encoding. Additionally, Catboost reduces the need for extensive hyperparameter tuning and enables custom function specification, enhancing its utility for ML tasks [22].
Artificial neural networks (ANNs): ANNs constitute a class of ML models inspired by the intricate network of interconnected neurons in the human brain. ANNs consist of interconnected layers of artificial neurons, known as perceptrons, which serve as nonlinear transformation units for input data. This architecture enables ANNs to perform complex ANNs is their ability to adapt parameters through iterative training, where the network adjusts internal weightings to optimize performance. Training involves using a backpropagation network to adjust weights based on the disparity between predicted and actual outcomes [42,43].
Our proposed ANN architecture comprises sequentially arranged, densely connected layers designed to extract intricate patterns from the input data. The input layer, consisting of 128 units with rectified linear unit (ReLU) activation functions, introduces non-linearity to capture complex relationships. A dropout layer with a dropout rate of 0.5 is added to prevent overfitting by randomly dropping connections during training. Subsequently, a second dense layer with 64 units and a ReLU activation function refines the learned features, followed by another dropout layer to reinforce model robustness. The output layer, with a sigmoid activation function, transforms learned features into probability scores for the binary classification of CVD presence. To address class imbalance, we assign class weights during model compilation, prioritizing the correct prediction of high-risk cases. The class weight for the positive class is set to 10 on raw data and 2 on resampled data.
For model optimization, we employed the Adam optimizer and binary cross-entropy loss function. Early stopping is implemented using the EarlyStopping callback to prevent overfitting by halting training if validation loss fails to improve over a predefined number of epochs.
3. Results
In this chapter, we present the results obtained from our research, encompassing the comprehensive performance assessment of each classifier (logistic regression (LR), decision trees (DTs), random forest (RF), gradient boosting (GB), XGBoost (XGB) and CatBoost) subsequent to the application of each resampling technique (SMOTE, ADASYN, SMOTE-Tomek, SMOTE-ENN). The evaluation metrics employed in our analysis include accuracy, recall, precision, F1-score, the area under the ROC curve (AUC), alongside the elucidation of the confusion matrix. Highlighted in bold within the tables are the superior performance outcomes the models achieved, representing the best-performing model when coupled with each of the resampling techniques.
For the sake of robustness, a stratified split of 70% for training and 30% for testing was adopted across all experiments. It is noteworthy that each resampling method was exclusively applied to the training dataset to forestall any potential data leakage from the test set. This meticulous approach not only upholds the integrity of the test dataset but also provides a more precise evaluation of the model’s generalization ability.
3.1. Raw Data
At the onset of our study, we applied our ML algorithms on the raw dataset. As was expected, the inherent imbalance within the data posed a substantial obstacle, hindering the models’ ability to accurately identify positive observations of heart disease. This imbalance led to a bias favoring the classification of most observations as not having heart disease, thereby inflating apparent accuracy metrics while obscuring poor performance on the minority class. Recognizing the critical nature of this challenge, we undertook measures to address it, resulting in noteworthy improvements, as elaborated in subsequent sections.
To ensure robust estimations of model performance, we employed a stratified 5-fold cross-validation across all models. This technique, by partitioning the dataset into multiple folds and training/evaluating the model on each combination, provided a comprehensive assessment of how well the models generalized to different subsets of the data. The evaluation outcomes of the trained ML models on both the testing and training sets are summarized in Table 2.
Notably, initial observations revealed instances of overfitting in the decision tree and random forest models, leading to poor generalization of unseen data. Additionally, while many models achieved high accuracy rates (approximately 92%), their performance in correctly predicting positive cases was notably deficient.
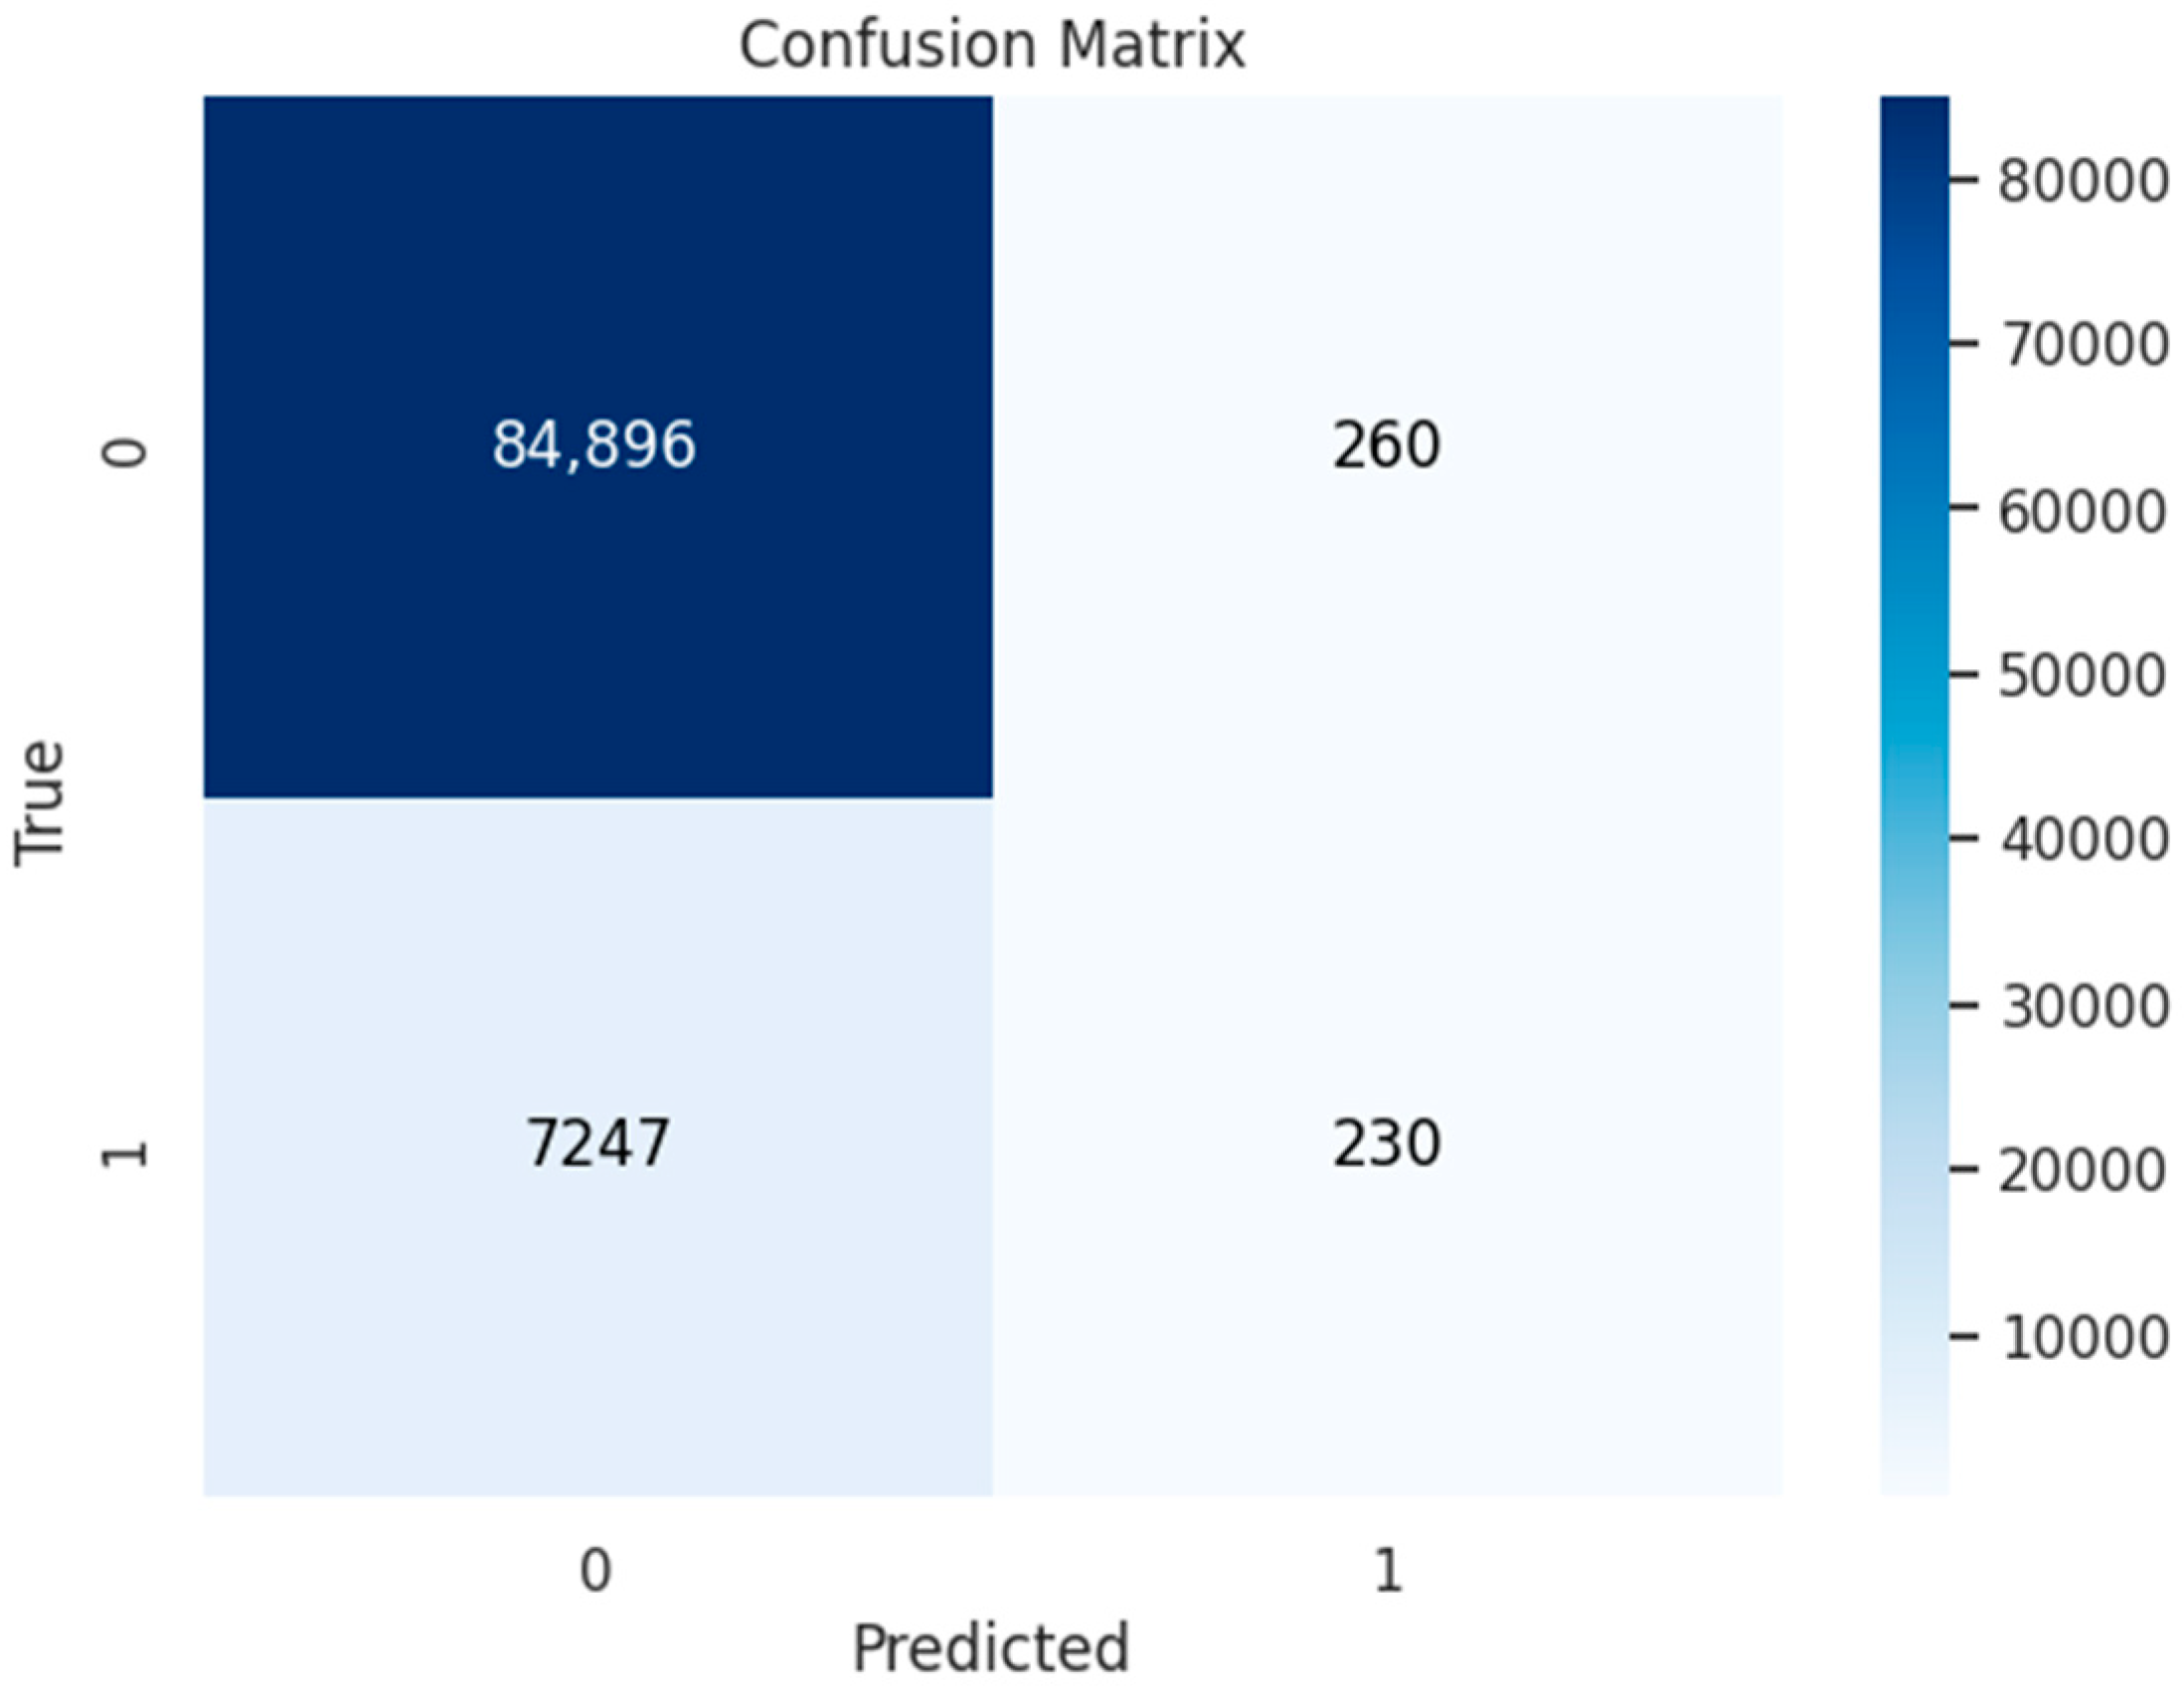
This discrepancy, wherein models exhibited high accuracy but low recall rates, underscores concern regarding the potential oversight of a significant portion of positive cases—an issue of paramount importance in predictive healthcare analytics. For instance, as depicted in Figure 3, the confusion matrix for logistic regression, which exhibited relatively better performance, revealed 7247 missed positive cases. Such oversights could carry significant consequences in real-world scenarios, prompting us to prioritize the enhancement of model sensitivity.
While default values often yield satisfactory results, the art of hyperparameter tuning unveils the potential for more accurate predictions. By reviewing the documentation of each algorithm, the bibliography, and by using some optimizing algorithms, we tried to find the right parameter grid to improve our models’ performance. The performance results that the models achieved can be seen in Table 3.
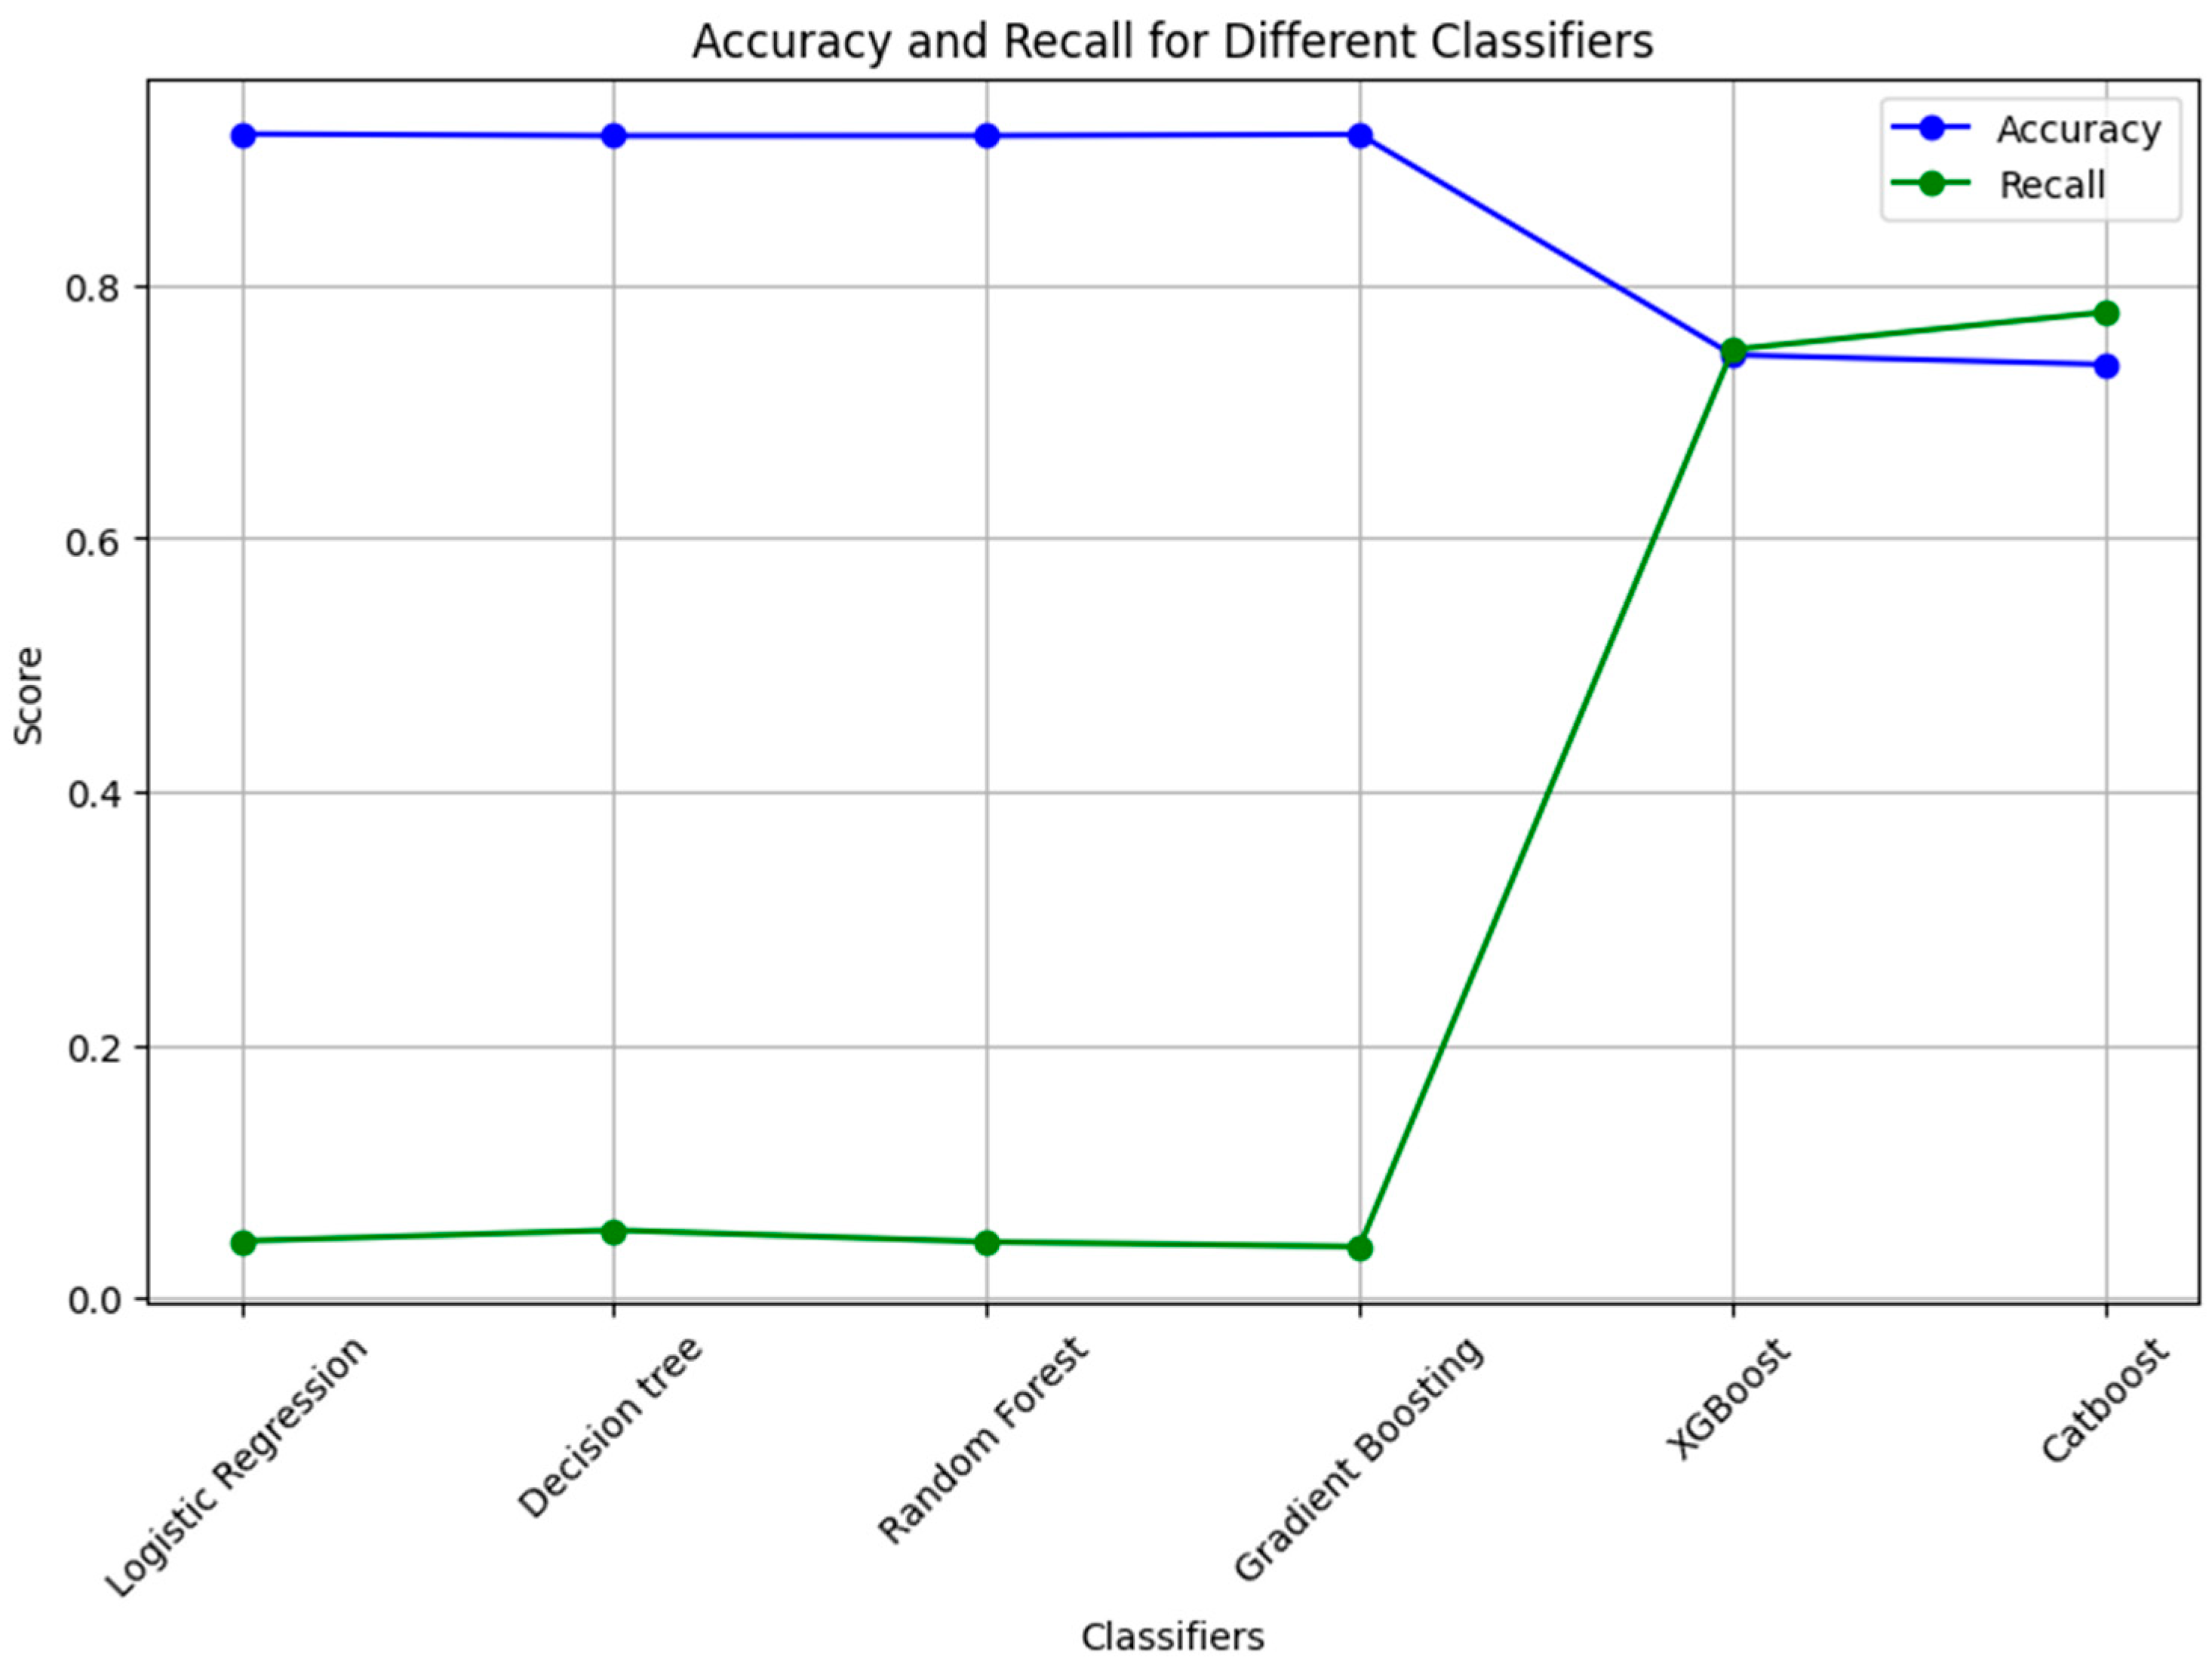
Upon examination of the results, it is evident that there is negligible variance among the outcomes for the remaining models, except for XGBoost and CatBoost. Notably, these two models exhibited a noteworthy increase in the achieved recall, with CatBoost reaching an impressive 77% while preserving an excellent accuracy rate. This substantial escalation from the initial 4% underscores the significant impact of tuning these models with the right hyperparameters. It demonstrates that, when finely tuned, CatBoost can identify a considerable number of individuals prone to CVD with a level of accuracy that extends beyond mere satisfaction. The dual-axis visualization in Figure 4 offers insights into how each model navigates the trade-off between overall accuracy and the adeptness in capturing positive cases, recall.
Analyzing both the weighted average and the macro average F1-score, as illustrated in Table 4, offers valuable insights into the model’s performance with and without considering the proportion of each class.
Particularly, the macro average F1-score, even in the best case scenario, reached only 0.58. This indicates that the model’s performance diminishes when both classes are considered equally, irrespective of their imbalance.
3.2. SMOTE
Next, in order to address the dataset’s class imbalance, we utilized the Synthetic Minority Oversampling Technique (SMOTE) algorithm. This approach involved generating synthetic instances within the minority class to augment its representation within the dataset. The application of SMOTE resulted in the generation of an adequate number of observations, thereby equalizing the representation of both classes. Consequently, the dataset comprised a total of 397,294 observations.
The performance results of the trained models on the test set, in contrast with their performance on the training set after applying SMOTE in the dataset, can be seen in Table 5.
The implementation of SMOTE yielded a significant improvement in the models’ ability to detect individuals at risk of heart disease. Notably, the recall metric experienced a substantial surge, rising from 3% to an impressive 64% when employing logistic regression or random forest algorithms. This heightened sensitivity indicates an enhancement in accurately identifying positive cases, a critical aspect in the domain of heart disease prediction.
However, it is imperative to acknowledge the trade-offs associated with this improvement. While the recall metric demonstrated a remarkable boost, accuracy and precision witnessed a decline. This implies that while the models become more proficient at capturing instances of heart disease, there is a corresponding increase in false positives and a potential reduction in overall predictive accuracy.
Interestingly, the boosting algorithms did not demonstrate a proportional enhancement in performance with the introduction of SMOTE. Despite the augmentation of synthetic data, they maintained a level of performance comparable with that before oversampling the dataset. These variations in performance across different algorithms underscore the complexity associated with the utilization of SMOTE and its impact on various evaluation metrics. Subsequently, we proceeded to fine-tune our models, and the attained results are delineated in Table 6.
The findings in Table 6 reveal that, despite an exhaustive grid search aimed at optimizing their hyperparameters, there was no discernible enhancement in the performance of logistic regression, decision trees, and random forest. Furthermore, the latter two algorithms appear to have potentially overfit the training data.
However, our boosting algorithms have exceeded expectations. CatBoost achieved an impressive recall of 79%, while XGBoost attained a noteworthy 80%. Additionally, both models maintained a robust AUC score of 80%, underscoring their resilience and discriminative capabilities.
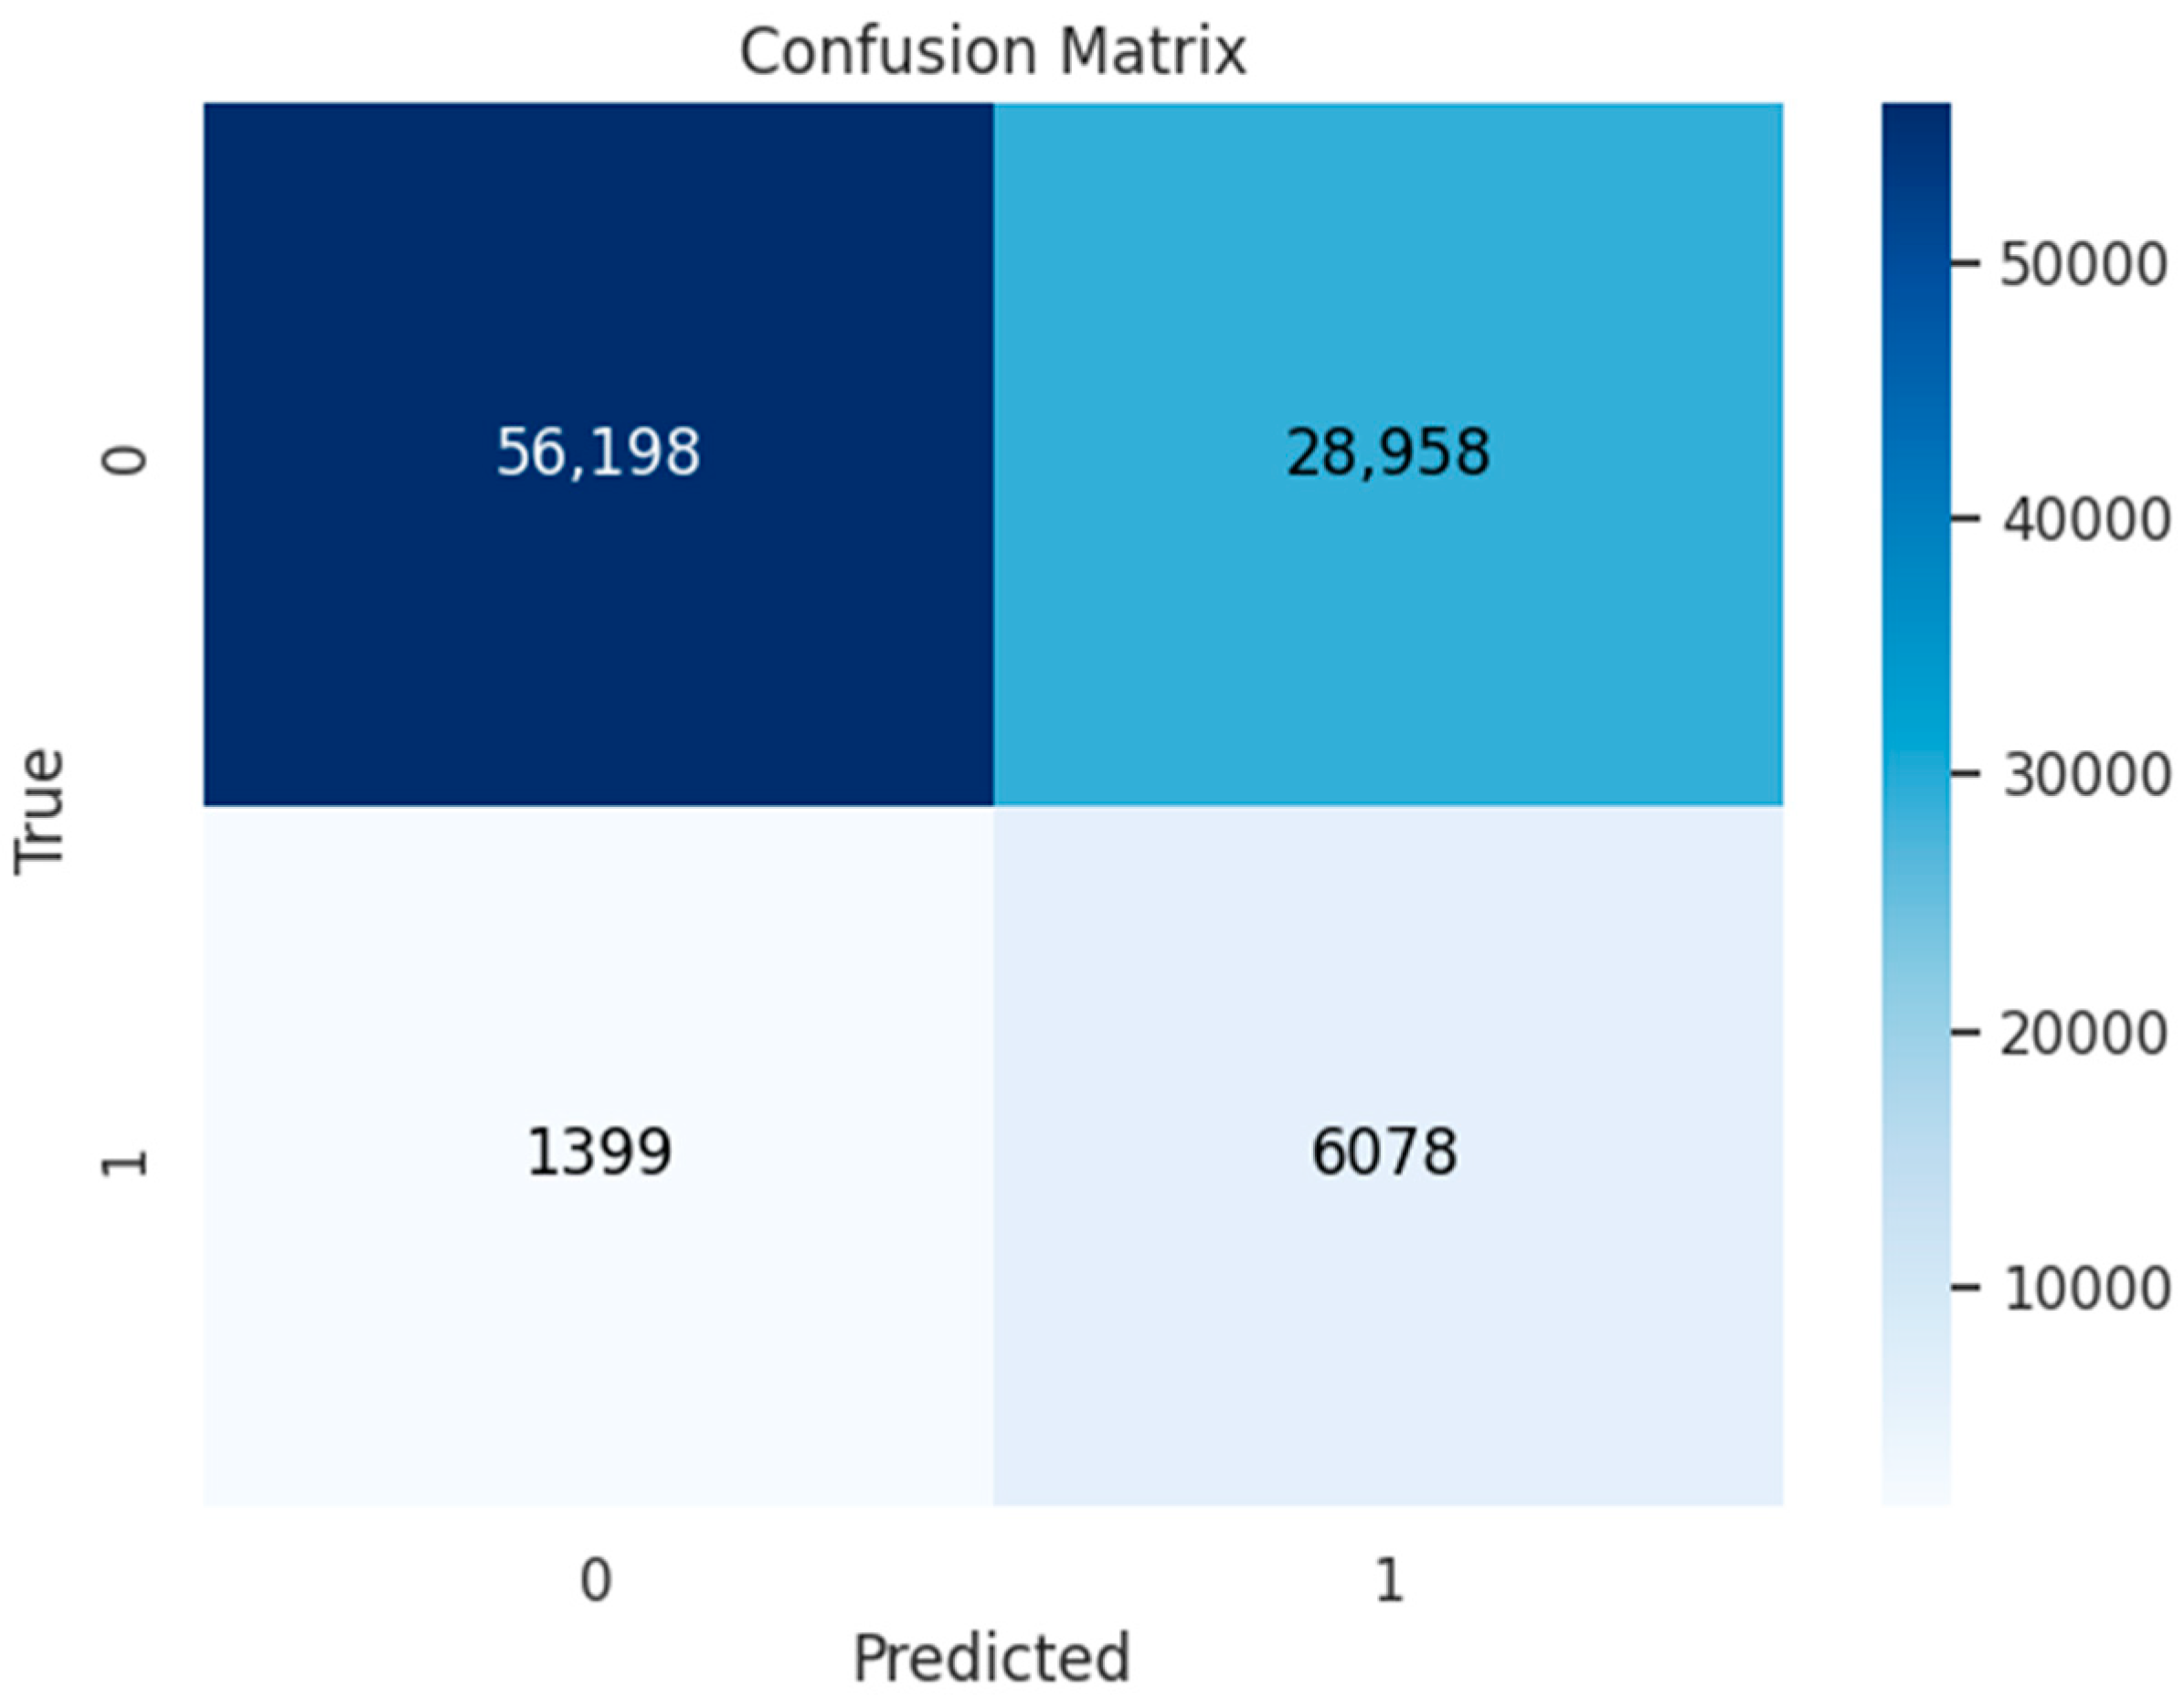
As depicted in the confusion matrix presented in Figure 5, the optimized XGBoost model successfully identified 6078 out of the total 7477 positive cases. This outcome highlights the potential utility of our approach in the healthcare domain, showcasing its efficacy in accurately identifying a substantial proportion of positive cases.
3.3. ADASYN
Distinguishing itself from SMOTE, ADASYN introduces an adaptive dimension to the generation of synthetic data. Unlike SMOTE, which uniformly enhances the minority class with synthetic instances, ADASYN adopts a more dynamic approach. It focuses its synthetic sampling efforts on areas of the feature space where minority instances are sparse, offering a more nuanced adaptation to the data distribution.
ADASYN dynamically adjusted the dataset by augmenting the minority class instances to 200,721, a substantial increase, while maintaining the count of the majority class at its original level of 198,647 instances.
The influence of ADASYN on model performance is evident in Table 7. Upon reviewing the performance metrics presented in this table, it becomes apparent that ADASYN, while enhancing the recall of the models, demonstrated a somewhat more restrained impact compared with its oversampling counterpart, SMOTE. Particularly, logistic regression and random forest exhibited notable improvement once again, achieving a commendable 55% in recall. However, decision trees and boosting algorithms displayed increased accuracy but contend with a considerably lower recall.
Upon scrutinizing the models’ performance on the training data, a notable disparity in the outcomes emerges particularly for decision trees when compared with their performance on the testing data. While the model achieved remarkably high accuracy on the training data, its performance on unseen data was notably inferior. This discrepancy raises concerns regarding potential overfitting, indicating that the model might have captured noise or idiosyncratic patterns that do not generalize effectively beyond the training set.
Subsequently, we proceed with the optimization of our models, leveraging the hyperparameters recommended by the GridSearchCV and Optuna algorithms. The results of this optimization endeavor are elaborated in Table 8.
Notably, XGBoost and CatBoost maintain a commendable AUC rate of 80%, concurrently enhancing their sensitivity to 81% and 80%, respectively, surpassing SMOTE’s performance on the same models. Moreover, despite the improvement in F1-score compared with previous results, there remains scope for further enhancement.
3.4. SMOTE-Tomek
Subsequently, we implemented the SMOTE-Tomek algorithm, a hybrid resampling technique widely adopted for addressing data imbalance. Through this approach, the minority class experiences augmentation, reaching 198,031 instances, significantly strengthening its presence within the dataset. Concurrently, the Tomek links algorithm identifies and eliminates instances forming Tomek links—pairs of instances from different classes that are nearest to each other—facilitating a targeted reduction in the majority class.
Following the resampling process, we applied our ML models, and the ensuing results are presented in Table 9.
With our data now balanced, we find satisfaction in the 91% accuracy achieved by the boosting algorithms. However, the 8% recall rate reveals a notable drawback, as the models tend to favor the majority class, thus hindering their ability to accurately detect positive cases. Consequently, we find the performance of logistic regression and random forest more appealing as they strike a balance between relatively high accuracy and a satisfactory level of recall.
Upon fine-tuning the models, as depicted in Table 10, we observed that decision trees unfortunately overfit to the training data, while logistic regression and random forest experienced a drop in performance. Interestingly, CatBoost and XGBoost demonstrated noteworthy performance improvements.
CatBoost not only achieved an impressive 70% accuracy but also excelled in identifying positive cases, boasting an 81% recall rate. Similarly, XGBoost outperformed all models with an 82% sensitivity rate, marking the highest result thus far. These outcomes underscore the effectiveness and robustness of boosting algorithms in navigating the intricacies of the dataset.
3.5. SMOTE-ENN
In the concluding phase, we implemented the SMOTE-ENN hybrid resampling algorithm on the BRFSS data, merging synthetic data generation with data refinement strategies. This approach strategically increased the minority class to 193,714 instances, substantially reinforcing its presence in the dataset. Concurrently, it pruned the majority class, reducing its observations to 133,109 from the original count of 198,647.
The performance results after applying the SMOTE-ENN algorithm are presented in Table 11.
Upon scrutinizing these findings, a notable enhancement was discernible across all models concerning recall, while maintaining a commendable accuracy rate, subsequent to the implementation of the SMOTE-ENN technique. For example, gradient boosting demonstrated a substantial surge from 4% to 67% without any additional optimization. Furthermore, it is noteworthy that both logistic regression and random forest achieved an impressive 79% recall. Moreover, with our dataset now balanced, we could explore the AUC metric, revealing that nearly all our models exhibited commendable proficiency in correctly classifying instances, with random forest notably achieving an impressive 80%.
Moving forward to optimize the models, we meticulously selected hyperparameters tailored to our data, prioritizing those assigning different weights to each class. This strategic decision emphasizes the minority class, which holds particular significance in our context. The results, as illustrated in Table 12, are promising. Interestingly, we mitigated overfitting across all models, as evidenced by the consistent performance on both the training and test sets. Additionally, we achieved peak performance for each model. Particularly, CatBoost surpassed expectations with a remarkable 88% recall, alongside a decent accuracy rate and an impressive 82% AUC rate.
This outcome highlights the effectiveness of integrating CatBoost with the hybrid SMOTE-ENN algorithm, particularly for healthcare professionals grappling with imbalanced real-world datasets.
As depicted in Figure 6, this combination proves highly advantageous, facilitating the detection of a significant number of positive cases—an invaluable asset for the healthcare sector by identifying 6548 out of the total 7477 individuals at risk.
3.6. Deep Learning
The versatility of ANNs extends beyond unstructured data, such as images and text, to structured data as well. In our study, we demonstrated the efficacy of ANNs in surpassing traditional ML algorithms when applied to structured data. The model’s performance when employed with each of the resampling algorithms and on the raw data is presented in Table 13.
The analysis of our results uncovers several significant findings. Firstly, our successful mitigation of overfitting represents a notable achievement, especially when employing an ANN in the context of structured, non-complex data.
Upon closer inspection, our ANN demonstrates superior performance compared with previously utilized ML models on the raw data. Remarkably, it achieved a recall rate of 78% while matching the accuracy rate attained by the top-performing ML model at 74%. This outcome underscores the effectiveness of our ANN in discerning meaningful patterns within the data.
Furthermore, the integration of our ANN with the SMOTE-ENN hybrid resampling algorithm yielded outstanding results, culminating in a peak recall rate of 87%. This collaborative approach highlights the efficacy of incorporating data resampling techniques to augment the performance of our ANN.
While our ANN, in conjunction with SMOTE, ADASYN, and SMOTE-Tomek algorithms, falls slightly short of surpassing our optimized boosting algorithms, it is noteworthy that it achieves a performance closely comparable with them. This suggests that even in scenarios where boosting algorithms maintain a marginal advantage, our ANN remains a competitive and promising alternative.
The nuanced interplay observed between our ANN and various resampling techniques underscores its adaptability and potential to deliver robust performance across diverse data types.
4. Discussion
Our investigation into predicting CVD using both ML and deep learning algorithms has revealed crucial insights, as elucidated in this extensive evaluation. The initial phase of our study involved the deployment of six ML models—logistic regression, decision trees, random forest, gradient boosting, XGBoost, and CatBoost—on raw data, exposing inherent challenges associated with dataset imbalance. Despite achieving commendable overall accuracy, our models encountered difficulties in accurately identifying positive cases, manifesting in a suboptimal recall rate of merely 4%. This discrepancy underscored concerns regarding the models’ sensitivity in detecting individuals with heart-related conditions, prompting a meticulous exploration of bias mitigation strategies and performance enhancement avenues.
To address these challenges, we pursued an optimization strategy involving detailed hyperparameter tuning using GridSearchCV for logistic regression, decision trees, and random forest and Optuna for gradient boosting and CatBoost. Notably, XGBoost highlighted the significance of adaptive approaches by outperforming grid searches with manually discovered hyperparameters.
In subsequent phases, we delved into resampling techniques, implementing various oversampling and hybrid sampling algorithms to achieve class balance. Initially, two oversampling algorithms—SMOTE and ADASYN—were employed. SMOTE exhibited remarkable performance improvements across all models, particularly when integrated with XGBoost, achieving a notable accuracy rate of 67% and an impressive recall rate of 80%. While ADASYN initially lagged behind SMOTE, fine-tuning efforts yielded enhanced performance, with XGBoost achieving an 81% recall rate while maintaining the same accuracy rate.
Further exploration involved the utilization of two hybrid resampling algorithms—SMOTE-Tomek and SMOTE-ENN—which strategically combined undersampling and oversampling methods. While SMOTE-Tomek encountered challenges related to overfitting in certain models, it demonstrated effectiveness when paired with boosting algorithms. Notably, XGBoost attained an 82% recall rate, and CatBoost reached 81%. SMOTE-ENN exhibited immediate enhancements in the models’ generalization abilities and effective detection of positive cases. The combination of SMOTE-ENN with CatBoost yielded the peak of our study’s performance, achieving an impressive 88% recall rate, indicative of minimal missed positive cases in the dataset.
Finally, we showcased the efficacy of ANN for structured data when appropriately harnessed. Our proposed artificial neural network (ANN), combined with the SMOTE-ENN algorithm, achieved an outstanding 87% recall rate and 70% AUC metric. It also outperformed all ML models when applied on the raw data, even after their optimization, demonstrating its potential as a valuable tool for healthcare practitioners handling imbalanced data.
In Figure 7, we present our recommended optimal resampling algorithm–predictive model combinations, offering a comprehensive overview of their achieved recall rates and guiding future research and clinical applications.
In summary, our investigation has not only shed light on the challenges associated with predicting CVDs in real-world datasets but has also highlighted the efficacy of a multi-faceted approach involving ML, deep learning, and resampling techniques. These findings underscore the potential for advanced analytics to significantly impact predictive healthcare, paving the way for improved patient outcomes and enhanced clinical decision making.
Threats to Validity and Limitations
While conducting this research, we encountered various constraints and limitations that require recognition. A significant limitation involved the utilization of a single dataset, potentially overlooking the diverse traits and features of the entire population. This reliance could potentially bias our models and restrict the applicability of our conclusions. Thus, future additional validation of our findings using broader and more diverse datasets is desirable to ensure the robustness and verifiability of our outcomes.
Also, it is important to address the practical challenges associated with the inclusion of 95% confidence intervals (CIs) in evaluating the statistical significance of metrics, particularly in the context of imbalanced datasets. Our analysis employed five different sampling techniques across seven distinct models, necessitating extensive bootstrap sampling to calculate CIs for each combination. However, conducting 1000 bootstraps for example for each of the five sampling techniques across seven models would result in a total of 35,000 cycles, rendering it impractical within the scope of our study. Therefore, we focused on cross-validation, prediction on unseen data, and comparison of these sets as our primary validation strategies. While traditional CIs were not incorporated, these validation methods are recognized as efficient and reasonable alternatives, providing robust evidence for the validity of our findings. We encourage future studies to explore methods for incorporating CIs in similarly complex analyses, balancing statistical rigor with practical considerations.
5. Conclusions
In conclusion, our exploration into CVD prediction using real-life datasets, encompassing both ML and deep learning approaches, has yielded pivotal insights with profound implications for healthcare practitioners and researchers. Our findings underscore the inherent challenges of dealing with imbalanced datasets and emphasize the critical importance of accurately identifying positive cases, particularly in scenarios where their representation is limited.
Initial observations revealed a discernible trade-off between high accuracy and poor recall for positive cases, primarily attributable to dataset imbalance. This spurred an in-depth investigation into remedial measures, leading to the implementation of optimization strategies, such as hyperparameter tuning and resampling techniques. By employing oversampling methods such as Synthetic Minority Oversampling Technique (SMOTE) and Adaptive Synthetic Sampling (ADASYN), alongside hybrid techniques like SMOTE-ENN, we effectively balanced the distribution of classes, thereby enhancing the performance of our predictive models. Through meticulous experimentation, we conducted five distinct experiments for each resampling algorithm, leveraging the resampling techniques alongside six ML models and an ANN. These interventions yielded significant enhancements, notably improving recall rates, with optimized boosting algorithms and hybrid resampling methods achieving impressive results. Notably, CatBoost coupled with SMOTE-ENN achieved a remarkable 88% recall rate.
Moreover, the integration of ANNs demonstrated their efficacy in handling structured imbalanced data, further enhancing the detection of positive cases in the healthcare domain. Additionally, the indispensable role of electronic health records (EHRs) in predictive analytics for healthcare was emphasized, highlighting the wealth of information within EHR that enhances model predictive capabilities and facilitates a comprehensive understanding of individual health profiles.
There are several promising avenues for further exploration, building upon the groundwork laid in our study. Firstly, as previously mentioned, the quality of EHR can exert a substantial influence on model performance. Integrating more diverse and extensive datasets holds potential to augment the generalizability of predictive models, thereby enhancing their capacity to identify high-risk patients. Moreover, delving into the incorporation of genetic and biomarker data could furnish a more comprehensive understanding of CVD risk, given compelling evidence suggesting a potential correlation [2].
Venturing into advanced ML techniques and deep learning architectures presents another avenue for advancement. Employing transfer learning holds promise in significantly bolstering the predictive capabilities of our models. Leveraging insights gleaned from pre-trained models in health-related domains on structured data could substantially refine CVD risk prediction. Additionally, exploring explainable AI methods stands to mitigate interpretability challenges associated with complex models, fostering greater trust and adoption in clinical settings. This could further empower healthcare practitioners by elucidating the reasoning behind the models’ decision-making processes.
Author Contributions
Conceptualization, K.-V.T.; methodology, K.-V.T. and G.P.; software, K.-V.T. and G.P.; validation, K.-V.T., G.P., and C.T.; formal analysis, K.-V.T. and G.P.; investigation, K.-V.T. and G.P.; resources, C.T., K.-V.T., and G.P.; data curation, K.-V.T. and G.P.; writing—original draft preparation, K.-V.T. and G.P.; writing—review and editing, K.-V.T., G.P., and C.T.; visualization, K.-V.T.; supervision, C.T.; project administration, C.T. and K.-V.T. All authors have read and agreed to the published version of the manuscript.
Funding
This research received no external funding.
Data Availability Statement
Data are partly available within the manuscript.
Conflicts of Interest
The authors declare no potential conflicts of interest with respect to the research, authorship, and/or publication of this article. This manuscript is according to the guidelines and complies with the Ethical Standards.
References
- World Health Organization. Cardiovascular Diseases (CVDs). Available online: https://www.who.int/news-room/fact-sheets/detail/cardiovascular-diseases-(cvds) (accessed on 26 June 2023).
- Lupague, R.M.J.M.; Mabborang, R.C.; Bansil, A.G.; Lupague, M.M. Integrated Machine Learning Model for Comprehensive Heart Disease Risk Assessment Based on Multi-Dimensional Health Factors. Eur. J. Comput. Sci. Inf. Technol. 2023, 11, 44–58. [Google Scholar] [CrossRef]
- Cleveland Clinic Cardiovascular Disease. Available online: https://my.clevelandclinic.org/health/diseases/21493-cardiovascular-disease (accessed on 1 August 2023).
- National Center for Chronic Disease Prevention and Health Promotion. The Nation’s Risk Factors and CDC’s Response. Available online: https://www.cdc.gov/chronicdisease/resources/publications/factsheets/heart-disease-stroke.htm (accessed on 1 August 2023).
- Lindman, B.R.; Arnold, S.V.; Bagur, R.; Clarke, L.; Coylewright, M.; Evans, F.; Hung, J.; Lauck, S.B.; Peschin, S.; Sachdev, V.; et al. Priorities for Patient-Centered Research in Valvular Heart Disease: A Report from the National Heart, Lung, and Blood Institute Working Group. J. Am. Heart Assoc. 2020, 9, e015975. [Google Scholar] [CrossRef] [PubMed]
- NHS. Heart Failure. Available online: https://www.nhs.uk/conditions/heart-failure/ (accessed on 1 August 2023).
- Khushi, H.M.T.; Masood, T.; Jaffar, A.; Akram, S.; Bhatti, S.M. Performance Analysis of state-of-the-art CNN Architectures for Brain Tumour Detection. Int. J. Imaging Syst. Technol. 2024, 34, e22949. [Google Scholar] [CrossRef]
- Wisner, W. What Is Preventive Health and Why Is It Important? Available online: https://www.healthline.com/health/what-is-preventive-health-and-why-is-it-important (accessed on 16 March 2024).
- Batko, K.; Ślęzak, A. The Use of Big Data Analytics in Healthcare. J. Big Data 2022, 9, 3. [Google Scholar] [CrossRef]
- Feng, C.; Ding, Z.; Lao, Q.; Zhen, T.; Ruan, M.; Han, J.; He, L.; Shen, Q. Prediction of early hematoma expansion of spontaneous intracerebral hemorrhage based on deep learning radiomics features of noncontrast computed tomography. Eur. Radiol. 2023. [Google Scholar] [CrossRef] [PubMed]
- EIT Health. Early Diagnostics: Shaping Healthcare and Society through New Technologies. Available online: https://eithealth.eu/wp-content/uploads/2020/09/EIT-Health-paper_Early-Diagnostics_Shaping-Healthcare-Society.pdf (accessed on 1 August 2023).
- Aldraimli, M.; Soria, D.; Parkinson, J.; Thomas, E.L.; Bell, J.D.; Dwek, M.V.; Chaussalet, T.J. Machine Learning Prediction of Susceptibility to Visceral Fat Associated Diseases. Health Technol. 2020, 10, 925–944. [Google Scholar] [CrossRef]
- Mary, K. Pratt Predictive Analytics in Healthcare: 12 Valuable Use Cases. Available online: https://www.techtarget.com/searchbusinessanalytics/tip/Predictive-analytics-in-healthcare-12-valuable-use-cases (accessed on 1 August 2023).
- Alkhaldi, N. Predictive Analytics in Healthcare: 7 Ways to Save Time and Money. Available online: https://itrexgroup.com/blog/predictive-analytics-in-healthcare-top-use-cases/ (accessed on 1 August 2023).
- Weng, S.F.; Reps, J.; Kai, J.; Garibaldi, J.M.; Qureshi, N. Can Machine-Learning Improve Cardiovascular Risk Prediction Using Routine Clinical Data? PLoS ONE 2017, 12, e0174944. [Google Scholar] [CrossRef]
- Alqahtani, A.; Alsubai, S.; Sha, M.; Vilcekova, L.; Javed, T. Cardiovascular Disease Detection Using Ensemble Learning. Comput. Intell. Neurosci. 2022, 2022, 267498. [Google Scholar] [CrossRef]
- Gupta, A.; Kumar, R.; Singh Arora, H.; Raman, B. MIFH: A Machine Intelligence Framework for Heart Disease Diagnosis. IEEE Access 2020, 8, 14659–14674. [Google Scholar] [CrossRef]
- Gao, X.-Y.; Amin Ali, A.; Shaban Hassan, H.; Anwar, E.M. Improving the Accuracy for Analyzing Heart Diseases Prediction Based on the Ensemble Method. Complexity 2021, 2021, 6663455. [Google Scholar] [CrossRef]
- Paragliola, G.; Coronato, A. An Hybrid ECG-Based Deep Network for the Early Identification of High-Risk to Major Cardiovascular Events for Hypertension Patients. J. Biomed. Inform. 2021, 113, 103648. [Google Scholar] [CrossRef] [PubMed]
- Uddin, M.N.; Halder, R.K. An Ensemble Method Based Multilayer Dynamic System to Predict Cardiovascular Disease Using Machine Learning Approach. Inform. Med. Unlocked 2021, 24, 100584. [Google Scholar] [CrossRef]
- Al Ahdal, A.; Rakhra, M.; Rajendran, R.R.; Arslan, F.; Khder, M.A.; Patel, B.; Rajagopal, B.R.; Jain, R. Monitoring Cardiovascular Problems in Heart Patients Using Machine Learning. J. Healthc. Eng. 2023, 2023, 9738123. [Google Scholar] [CrossRef] [PubMed]
- Permatasari, N.; Asy Syahidah, S.; Leofiro Irfiansyah, A.; Al-Haqqoni, M.G. Predicting Diabetes Mellitus Using Catboost Classifier and Shapley Additive Explanation (Shap) Approach. BAREKENG J. Ilmu Mat. Dan. Terap. 2022, 16, 615–624. [Google Scholar] [CrossRef]
- Pasha, S.J.; Mohamed, E.S. Advanced Hybrid Ensemble Gain Ratio Feature Selection Model Using Machine Learning for Enhanced Disease Risk Prediction. Inform. Med. Unlocked 2022, 32, 101064. [Google Scholar] [CrossRef]
- Ahmed, S.; Shaikh, S.; Ikram, F.; Fayaz, M.; Alwageed, H.S.; Khan, F.; Jaskani, F.H. Prediction of Cardiovascular Disease on Self-Augmented Datasets of Heart Patients Using Multiple Machine Learning Models. J. Sens. 2022, 2022, 3730303. [Google Scholar] [CrossRef]
- Asif, D.; Bibi, M.; Arif, M.S.; Mukheimer, A. Enhancing Heart Disease Prediction through Ensemble Learning Techniques with Hyperparameter Optimization. Algorithms 2023, 16, 308. [Google Scholar] [CrossRef]
- Sharma, S.; Parmar, M. Heart Diseases Prediction Using Deep Learning Neural Network Model. Int. J. Innov. Technol. Explor. Eng. 2020, 9, 2244–2248. [Google Scholar] [CrossRef]
- Tick, V.K.; Meeng, N.Y.; Mohammad, N.F.; Harun, N.H.; Alquran, H.; Mohsin, M.F.M. Classification of Heart Disease Using Artificial Neural Network. J. Phys. Conf. Ser. 2021, 1997, 012022. [Google Scholar] [CrossRef]
- Bharti, R.; Khamparia, A.; Shabaz, M.; Dhiman, G.; Pande, S.; Singh, P. Prediction of Heart Disease Using a Combination of Machine Learning and Deep Learning. Comput. Intell. Neurosci. 2021, 2021, 8387680. [Google Scholar] [CrossRef]
- Subramani, S.; Varshney, N.; Anand, M.V.; Soudagar, M.E.M.; Al-keridis, L.A.; Upadhyay, T.K.; Alshammari, N.; Saeed, M.; Subramanian, K.; Anbarasu, K.; et al. Cardiovascular Diseases Prediction by Machine Learning Incorporation with Deep Learning. Front. Med. 2023, 10, 1150933. [Google Scholar] [CrossRef] [PubMed]
- Trigka, M.; Dritsas, E. Long-Term Coronary Artery Disease Risk Prediction with Machine Learning Models. Sensors 2023, 23, 1193. [Google Scholar] [CrossRef]
- Muntasir Nishat, M.; Faisal, F.; Jahan Ratul, I.; Al-Monsur, A.; Ar-Rafi, A.M.; Nasrullah, S.M.; Reza, M.T.; Khan, M.R.H. A Comprehensive Investigation of the Performances of Different Machine Learning Classifiers with SMOTE-ENN Oversampling Technique and Hyperparameter Optimization for Imbalanced Heart Failure Dataset. Sci. Program. 2022, 2022, 3649406. [Google Scholar] [CrossRef]
- Mahesh, T.R.; Dhilip Kumar, V.; Vinoth Kumar, V.; Asghar, J.; Geman, O.; Arulkumaran, G.; Arun, N. AdaBoost Ensemble Methods Using K-Fold Cross Validation for Survivability with the Early Detection of Heart Disease. Comput. Intell. Neurosci. 2022, 2022, 9005278. [Google Scholar] [CrossRef] [PubMed]
- Dutta, A.; Batabyal, T.; Basu, M.; Acton, S.T. An Efficient Convolutional Neural Network for Coronary Heart Disease Prediction. Expert. Syst. Appl. 2020, 159, 113408. [Google Scholar] [CrossRef]
- Hsieh, H.-Y.; Su, C.-F.; Chiu, S.-I. Constructing Multiple Layers of Machine Learning for the Early Detection of Cardiovascular Diseases . EasyChair, 2022; 7470, preprint. [Google Scholar]
- Hairani, H.; Anggrawan, A.; Priyanto, D. Improvement Performance of the Random Forest Method on Unbalanced Diabetes Data Classification Using Smote-Tomek Link. JOIV Int. J. Inform. Vis. 2023, 7, 258. [Google Scholar] [CrossRef]
- Center for Disease Control. 2021 BRFSS Survey Data and Documentation. Available online: https://www.cdc.gov/brfss/annual_data/annual_2021.html (accessed on 1 August 2023).
- Lopez-Jimenez, F.; Almahmeed, W.; Bays, H.; Cuevas, A.; Di Angelantonio, E.; le Roux, C.W.; Sattar, N.; Chan Sun, M.; Wittert, G.; Pinto, F.J.; et al. Obesity and cardiovascular disease: Mechanistic insights and management strategies. A joint position paper by the World Heart Federation and World Obesity Federation. Eur. J. Prev. Cardiol. 2022, 29, 2218–2237. [Google Scholar] [CrossRef]
- Blagus, R.; Lusa, L. SMOTE for High-Dimensional Class-Imbalanced Data. BMC Bioinform. 2013, 14, 106. [Google Scholar] [CrossRef] [PubMed]
- Rohit Chowdary, K.; Bhargav, P.; Nikhil, N.; Varun, K.; Jayanthi, D. Early Heart Disease Prediction Using Ensemble Learning Techniques. J. Phys. Conf. Ser. 2022, 2325, 012051. [Google Scholar] [CrossRef]
- Ullah, F.; Chen, X.; Rajab, K.; Al Reshan, M.S.; Shaikh, A.; Hassan, M.A.; Rizwan, M.; Davidekova, M. An Efficient Machine Learning Model Based on Improved Features Selections for Early and Accurate Heart Disease Predication. Comput. Intell. Neurosci. 2022, 2022, 1906466. [Google Scholar] [CrossRef]
- Song, Y.-Y.; Lu, Y. Decision Tree Methods: Applications for Classification and Prediction. Shanghai Arch. Psychiatry 2015, 27, 130–135. [Google Scholar] [CrossRef] [PubMed]
- Olaniyi, E.O.; Oyedotun, O.K.; Adnan, K. Heart Diseases Diagnosis Using Neural Networks Arbitration. Int. J. Intell. Syst. Appl. 2015, 7, 75–82. [Google Scholar] [CrossRef]
- Rone Sarra, R.; Musa Dinar, A.; Abed Mohammed, M. Enhanced Accuracy for Heart Disease Prediction Using Artificial Neural Network. Indones. J. Electr. Eng. Comput. Sci. 2022, 29, 375. [Google Scholar] [CrossRef]
Figure 1.
Flowchart of the proposed methodology.

Figure 2.
Percentage of people having a heart disease.

Figure 3.
Confusion matrix of logistic regression performance.

Figure 4.
Trade-off between accuracy and recall.

Figure 5.
Confusion matrix of XGBoost and SMOTE.

Figure 6.
Confusion matrix for CatBoost and SMOTE-ENN peak performance.

Figure 7.
Models’ recall performance with optimal combinations per resampling technique.


Table 1.
BRFSS dataset description.
| Feature | Description |
|---|---|
| General_Health | The general health condition of the respondent |
| Checkup | The period elapsed since the last time the respondent had a routine check-up |
| Exercise | Whether the respondent participated in any physical activities during the last month or not |
| Skin_Cancer | Whether the respondent had skin cancer or not |
| Other_Cancer | Whether the respondent had another kind of cancer or not |
| Depression | Whether the respondent had a depressive disorder or not |
| Diabetes | Whether the respondent had diabetes or not |
| Arthritis | Whether the respondent had arthritis or not |
| Sex | The respondent’s sex |
| Age_Category | The category of age that the respondent falls into |
| Height_(cm) | The respondent’s height measured in cm |
| Weight_(kg) | The respondent’s weight measured in kg |
| BMI | The respondent’s body mass index |
| Smoking_History | Whether the respondent had a smoking history or not |
| Alcohol_Consumption | The respondent’s reported alcohol consumption |
| Fruit_Consumption | The respondent’s reported fruit consumption |
| Green_Vegetables_Consumption | The respondent’s reported green vegetables consumption |
| Fried_Potato_Consumption | The respondent’s reported fried potatoes consumption |
| Heart_Disease | Whether the respondent reported having a heart disease or not |
Table 2.
Performance results on raw data.
| Model | Accuracy/ Training Accuracy | Recall/ Training Recall | Precision/ Training Precision | F1-Score/ Training F1-Score | AUC/ Training AUC |
|---|---|---|---|---|---|
| Logistic Regression | 0.92/0.93 | 0.03/0.06 | 0.47/0.51 | 0.06/0.12 | 0.80/0.84 |
| Decision Tree | 0.86/1.00 | 0.23/1.00 | 0.19/1.00 | 0.21/1.00 | 0.57/1.00 |
| Random Forest | 0.92/1.00 | 0.03/1.00 | 0.47/1.00 | 0.06/1.00 | 0.80/1.00 |
| Gradient Boosting | 0.92/0.92 | 0.05/0.05 | 0.49/0.55 | 0.09/0.09 | 0.83/0.84 |
| XGBoost | 0.92/0.92 | 0.05/0.09 | 0.46/0.75 | 0.10/0.17 | 0.83/0.88 |
| CatBoost | 0.92/0.93 | 0.04/0.11 | 0.47/0.84 | 0.09/0.19 | 0.83/0.87 |
Table 3.
Performance results after optimization.
| Model | Accuracy/ Training Accuracy | Recall/ Training Recall | Precision/ Training Precision | F1-Score/ Training F1-Score | AUC/ Training AUC |
|---|---|---|---|---|---|
| Logistic Regression | 0.92/0.92 | 0.05/0.05 | 0.52/0.53 | 0.08/0.09 | 0.83/0.84 |
| Decision Tree | 0.92/0.92 | 0.05/0.07 | 0.44/0.61 | 0.09/0.13 | 0.80/0.86 |
| Random Forest | 0.92/1.00 | 0.04/1.00 | 0.43/1.00 | 0.08/1.00 | 0.81/1.00 |
| Gradient Boosting | 0.92/0.92 | 0.04/0.07 | 0.49/0.71 | 0.08/0.12 | 0.83/0.86 |
| XGBoost | 0.74/0.76 | 0.75/0.87 | 0.20/0.23 | 0.32/0.37 | 0.82/0.89 |
| CatBoost | 0.74/0.78 | 0.77/0.85 | 0.20/0.22 | 0.33/0.35 | 0.83/0.87 |
Table 4.
Macro and weighted average F1-score.
| Model | Macro Avg. F1-Score | Weighted Avg. F1-Score |
|---|---|---|
| Logistic Regression | 0.52 | 0.89 |
| Decision Tree | 0.53 | 0.89 |
| Random Forest | 0.52 | 0.89 |
| Gradient Boosting | 0.52 | 0.89 |
| XGBoost | 0.58 | 0.80 |
| CatBoost | 0.58 | 0.80 |
Table 5.
Performance results after SMOTE.
| Model | Accuracy/ Training Accuracy | Recall/ Training Recall | Precision/ Training Precision | F1-Score/ Training F1-Score | AUC/ Training AUC |
|---|---|---|---|---|---|
| Logistic Regression | 0.70/0.70 | 0.64/0.65 | 0.16/0.17 | 0.26/0.26 | 0.74/0.75 |
| Decision Tree | 0.84/0.99 | 0.27/0.99 | 0.17/1.00 | 0.21/1.00 | 0.58/1.00 |
| Random Forest | 0.70/0.70 | 0.64/0.65 | 0.16/0.17 | 0.26/0.26 | 0.78/1.00 |
| Gradient Boosting | 0.83/0.84 | 0.39/0.40 | 0.21/0.22 | 0.27/0.28 | 0.77/0.77 |
| XGBoost | 0.91/0.91 | 0.11/0.16 | 0.31/0.42 | 0.17/0.23 | 0.80/0.84 |
| CatBoost | 0.91/0.92 | 0.08/0.14 | 0.40/0.62 | 0.14/0.23 | 0.81/0.87 |
Table 6.
Performance results after optimization (SMOTE).
| Model | Accuracy/ Training Accuracy | Recall/ Training Recall | Precision/ Training Precision | F1-Score/ Training F1-Score | AUC/ Training AUC |
|---|---|---|---|---|---|
| Logistic Regression | 0.70/0.70 | 0.64/0.65 | 0.16/0.17 | 0.26/0.26 | 0.74/0.75 |
| Decision Tree | 0.84/0.97 | 0.27/0.78 | 0.17/0.94 | 0.20/0.86 | 0.58/1.00 |
| Random Forest | 0.70/0.97 | 0.64/0.65 | 0.16/0.17 | 0.26/0.26 | 0.78/1.00 |
| Gradient Boosting | 0.83/0.84 | 0.39/0.40 | 0.21/0.22 | 0.27/0.28 | 0.77/0.78 |
| XGBoost | 0.67/0.68 | 0.80/0.89 | 0.17/0.19 | 0.28/0.31 | 0.80/0.85 |
| CatBoost | 0.70/0.71 | 0.79/0.80 | 0.18/0.20 | 0.30/0.33 | 0.81/0.87 |
Table 7.
Performance results after implementing ADASYN.
| Model | Accuracy/ Training Accuracy | Recall/ Training Recall | Precision/ Training Precision | F1-Score/ Training F1-Score | AUC/ Training AUC |
|---|---|---|---|---|---|
| Logistic Regression | 0.73/0.74 | 0.56/0.56 | 0.16/0.16 | 0.25/0.25 | 0.73/0.73 |
| Decision Tree | 0.84/1.00 | 0.26/1.00 | 0.17/1.00 | 0.20/1.00 | 0.57/1.00 |
| Random Forest | 0.73/0.74 | 0.56/0.56 | 0.16/0.16 | 0.25/0.26 | 0.78/1.00 |
| Gradient Boosting | 0.83/0.83 | 0.40/0.40 | 0.21/0.21 | 0.27/0.28 | 0.77/0.77 |
| XGBoost | 0.90/0.92 | 0.11/0.15 | 0.32/0.44 | 0.16/0.23 | 0.80/0.84 |
| CatBoost | 0.92/0.92 | 0.08/0.14 | 0.40/0.63 | 0.13/0.23 | 0.81/0.86 |
Table 8.
Performance results after optimization (ADASYN).
| Model | Accuracy/ Training Accuracy | Recall/ Training Recall | Precision/ Training Precision | F1-score/ Training F1-score | AUC/ Training AUC |
|---|---|---|---|---|---|
| Logistic Regression | 0.75/0.76 | 0.50/0.50 | 0.16/0.16 | 0.25/0.25 | 0.71/0.72 |
| Decision Tree | 0.85/0.98 | 0.23/0.78 | 0.18/0.88 | 0.20/0.82 | 0.59/1.00 |
| Random Forest | 0.74/0.76 | 0.56/0.50 | 0.16/0.16 | 0.25/0.25 | 0.78/1.00 |
| Gradient Boosting | 0.83/0.90 | 0.41/0.17 | 0.21/0.27 | 0.27/0.21 | 0.77/0.79 |
| XGBoost | 0.67/0.68 | 0.81/0.89 | 0.17/0.18 | 0.28/0.31 | 0.80/0.85 |
| CatBoost | 0.70/0.71 | 0.80/0.90 | 0.18/0.20 | 0.30/0.34 | 0.81/0.87 |
Table 9.
Performance results after implementing SMOTE-Tomek.
| Model | Accuracy/ Training Accuracy | Recall/ Training Recall | Precision/ Training Precision | F1-Score/ Training F1-Score | AUC/ Training AUC |
|---|---|---|---|---|---|
| Logistic Regression | 0.70/0.70 | 0.63/0.61 | 0.16/0.16 | 0.25/0.25 | 0.74/0.74 |
| Decision Tree | 0.84/1.00 | 0.27/1.00 | 0.17/1.00 | 0.21/1.00 | 0.58/1.00 |
| Random Forest | 0.70/0.70 | 0.63/0.61 | 0.16/0.16 | 0.25/0.25 | 0.78/1.00 |
| Gradient Boosting | 0.83/0.84 | 0.40/0.40 | 0.21/0.22 | 0.28/0.28 | 0.77/0.78 |
| XGBoost | 0.90/0.91 | 0.12/0.16 | 0.31/0.43 | 0.17/0.24 | 0.80/0.84 |
| CatBoost | 0.91/0.92 | 0.08/0.15 | 0.40/0.63 | 0.14/0.24 | 0.81/0.87 |
Table 10.
Performance results after optimization with SMOTE-Tomek.
| Model | Accuracy/ Training Accuracy | Recall/ Training Recall | Precision/ Training Precision | F1-Score/ Training F1-Score | AUC/ Training AUC |
|---|---|---|---|---|---|
| Logistic Regression | 0.76/0.76 | 0.49/0.50 | 0.16/0.17 | 0.25/0.25 | 0.72/0.73 |
| Decision Tree | 0.86/0.98 | 0.21/0.79 | 0.20/0.93 | 0.20/0.85 | 0.59/1.00 |
| Random Forest | 0.76/0.76 | 0.49/0.50 | 0.16/0.17 | 0.25/0.25 | 0.78/1.00 |
| Gradient Boosting | 0.83/0.84 | 0.40/0.40 | 0.21/0.22 | 0.28/0.28 | 0.77/0.78 |
| XGBoost | 0.67/0.68 | 0.82/0.89 | 0.17/0.19 | 0.28/0.31 | 0.80/0.85 |
| CatBoost | 0.70/0.71 | 0.81/0.90 | 0.18/0.21 | 0.30/0.34 | 0.81/0.87 |
Table 11.
Performance results after implementing SMOTE-ENN.
| Model | Accuracy/ Training Accuracy | Recall/ Training Recall | Precision/ Training Precision | F1-Score/ Training F1-Score | AUC/ Training AUC |
|---|---|---|---|---|---|
| Logistic Regression | 0.60/0.61 | 0.79/0.80 | 0.14/0.15 | 0.24/0.25 | 0.75/0.76 |
| Decision Tree | 0.79/0.91 | 0.42/1.00 | 0.17/0.48 | 0.24/0.65 | 0.62/0.95 |
| Random Forest | 0.60/0.61 | 0.79/0.80 | 0.14/0.48 | 0.24/0.25 | 0.79/0.99 |
| Gradient Boosting | 0.74/0.74 | 0.67/0.68 | 0.19/0.19 | 0.29/0.30 | 0.78/0.79 |
| XGBoost | 0.85/0.86 | 0.42/0.50 | 0.25/0.30 | 0.31/0.38 | 0.80/0.84 |
| CatBoost | 0.87/0.89 | 0.37/0.48 | 0.28/0.36 | 0.32/0.41 | 0.81/0.86 |
Table 12.
Performance results after optimization with SMOTE-ENN.
| Model | Accuracy/ Training Accuracy | Recall/ Training Recall | Precision/ Training Precision | F1-Score/ Training F1-Score | AUC/ Training AUC |
|---|---|---|---|---|---|
| Logistic Regression | 0.66/0.66 | 0.71/0.73 | 0.15/0.16 | 0.25/0.26 | 0.74/0.75 |
| Decision Tree | 0.79/0.91 | 0.41/0.99 | 0.17/0.48 | 0.24/0.65 | 0.62/0.95 |
| Random Forest | 0.66/0.66 | 0.71/0.73 | 0.15/0.16 | 0.25/0.26 | 0.78/0.98 |
| Gradient Boosting | 0.74/0.74 | 0.67/0.68 | 0.19/0.19 | 0.29/0.30 | 0.78/0.79 |
| XGBoost | 0.61/0.61 | 0.87/0.94 | 0.15/0.17 | 0.26/0.28 | 0.80/0.85 |
| CatBoost | 0.63/0.63 | 0.88/0.94 | 0.16/0.17 | 0.27/0.29 | 0.82/0.86 |
Table 13.
ANN performance results.
| ANN | Accuracy/ Training Accuracy | Recall/ Training Recall | Precision/ Training Precision | F1-Score/ Training F1-Score | AUC/ Training AUC |
|---|---|---|---|---|---|
| Raw data | 0.74/0.73 | 0.78/0.80 | 0.20/0.21 | 0.32/0.33 | 0.76/0.77 |
| SMOTE | 0.58/0.78 | 0.80/0.93 | 0.14/0.71 | 0.23/0.81 | 0.68/0.77 |
| ADASYN | 0.63/0.77 | 0.74/0.92 | 0.15/0.70 | 0.24/0.80 | 0.68/0.76 |
| SMOTE-Tomek | 0.62/0.77 | 0.77/0.94 | 0.15/0.70 | 0.24/0.80 | 0.69/0.77 |
| SMOTE-ENN | 0.54/0.83 | 0.87/0.96 | 0.14/0.79 | 0.24/0.87 | 0.69/0.80 |
Disclaimer/Publisher’s Note: The statements, opinions and data contained in all publications are solely those of the individual author(s) and contributor(s) and not of MDPI and/or the editor(s). MDPI and/or the editor(s) disclaim responsibility for any injury to people or property resulting from any ideas, methods, instructions or products referred to in the content. |
© 2024 by the authors. Licensee MDPI, Basel, Switzerland. This article is an open access article distributed under the terms and conditions of the Creative Commons Attribution (CC BY) license (https://creativecommons.org/licenses/by/4.0/).
Share and Cite
MDPI and ACS Style
Tompra, K.-V.; Papageorgiou, G.; Tjortjis, C. Strategic Machine Learning Optimization for Cardiovascular Disease Prediction and High-Risk Patient Identification. Algorithms 2024, 17, 178. https://doi.org/10.3390/a17050178
AMA Style
Tompra K-V, Papageorgiou G, Tjortjis C. Strategic Machine Learning Optimization for Cardiovascular Disease Prediction and High-Risk Patient Identification. Algorithms. 2024; 17(5):178. https://doi.org/10.3390/a17050178
Chicago/Turabian StyleTompra, Konstantina-Vasiliki, George Papageorgiou, and Christos Tjortjis. 2024. "Strategic Machine Learning Optimization for Cardiovascular Disease Prediction and High-Risk Patient Identification" Algorithms 17, no. 5: 178. https://doi.org/10.3390/a17050178
Note that from the first issue of 2016, this journal uses article numbers instead of page numbers. See further details here.