1. Background
Due to the now common explosion of information , we are often faced with too much to read. Search engines have improved dramatically over the past several decades, so much so that they frequently return too many relevant documents. Tools that enable us to sift through data to find relevant documents and, more generally, information of the greatest interest to us, are much needed. One approach to deal with this overload of information is to produce summaries of the documents. The problem of single document summarization was first introduced over 55 years ago by Luhn [
1]. Since then, hundreds of papers on text summarization have been published. In 1995 Kathleen McKeown and Dragomir Radev introduced multi-document summarization [
2] where information from a collection of documents on the same topic is summarized. This approach naturally leads to a top-down navigation of documents to extract relevant information. A series of evaluations of summarization methods has been conducted over the last dozen years and the data from these will be described in
Section 3. The most recent of these has been the Text Analysis Conference (TAC) [
3] which is sponsored by the National Institute of Standards and Technology (NIST). Each year at TAC, several dozen summarization systems are evaluated by NIST based on several criteria.
The two main types of summarization evaluation are extrinsic and intrinsic. In extrinsic evaluation, summaries are evaluated according to how successfully an external task can be completed using only the summary. In intrinsic evaluation, a summary’s score is derived from the summary itself, perhaps by comparison with a human-written, gold standard summary. For the purposes of this work, we focus only on intrinsic evaluation.
The ultimate intrinsic test of the quality of a summary is human judgment of its content, linguistic quality, and overall responsiveness to the needs of the given information task. These human judgments will be described in more detail in
Section 3. Suffice it to say that such human-based evaluation, while absolutely necessary to evaluate the task, is very time consuming. Because of this, we seek to find automatic evaluation metrics which, as closely as possible, will correlate with human judgments of text summaries. In recent years, automatic summarization systems have made great gains in their performance. Today, top performing summarization systems outperform humans when measured by traditional automatic metrics, despite the fact that the measured performance, as judged by human evaluators, indicate that the automatic systems perform significantly worse than humans. Mathematically, such a metric gap is a discontinuity in the function relating the automatic and manual metrics and is illustrated in
Figure 1. This metric gap will be discussed further in the next few paragraphs.
Measuring correlation between automatic metrics and human judgments is a natural way to measure the performance of an automatic metric. When NIST recently evaluated automatic summarization metrics, the three widely used correlation metrics—Pearson, Spearman, and Kendall tau—were used. Of these three metrics we present only Pearson, primarily for space considerations, and we direct the reader to [
3] for results using Spearman and Kendall tau. Secondly, we favor Pearson as a metric since, of the three, it penalizes metrics for discontinuities such as those illustrated in
Figure 1.
The baseline summarization evaluation method to which many others are often compared is Recall-Oriented Understudy for Gisting Evaluation (ROUGE) [
4] and is a (word) n-gram-based approach for comparing one summary to one or more human-generated summaries (note that to evaluate a human summary, one simply compares it to the other human summaries). Generally, bigram-based versions of ROUGE give the best correlation with human judgments of a summary.
Figure 1.
TAC 2008/2011 task results.
Figure 1.
TAC 2008/2011 task results.
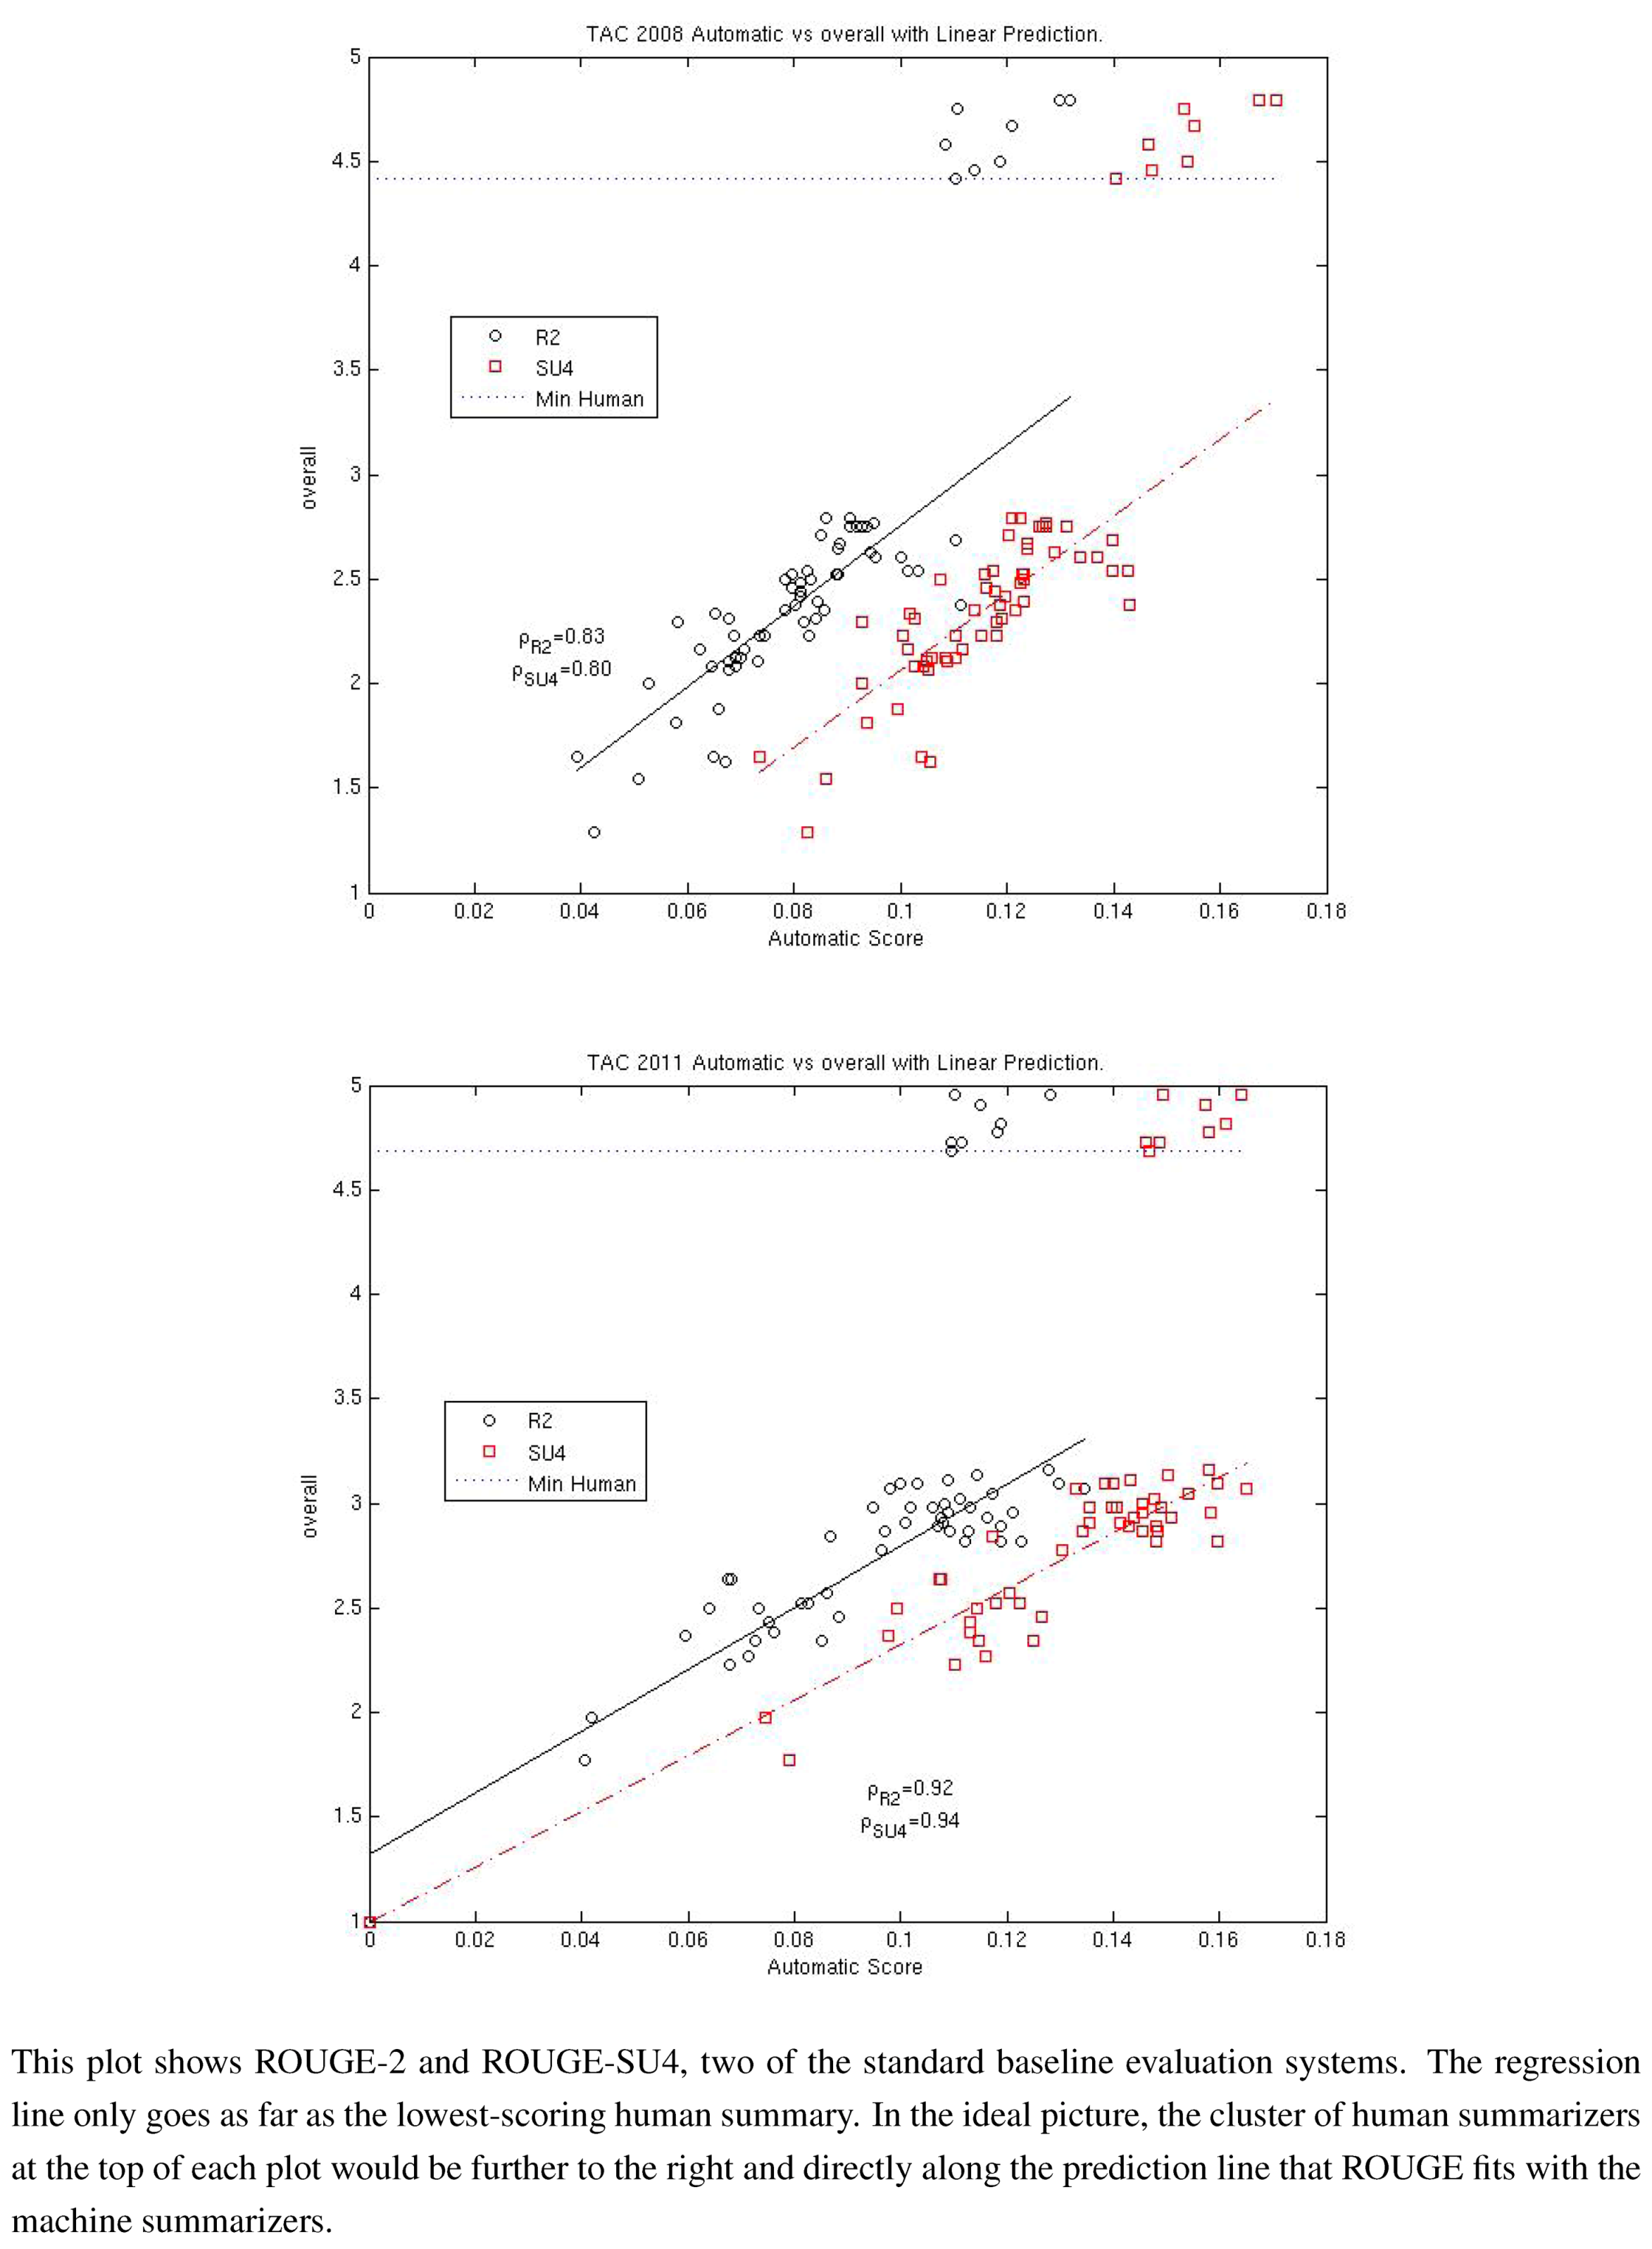
To illustrate the strengths and weaknesses of ROUGE as a measure of a summarization system’s performance, we give two scatter plots in
Figure 1. In these plots, ordered pairs of each system’s average ROUGE scores and average “overall responsiveness” scores are given for each automatic summarization system as well as for 8 human summarizers. The plots illustrate two of the best ROUGE scoring approaches, ROUGE-2 which measures the bigram similarity of a summary against human-generated summaries and ROUGE-SU4 which measures bigram similarity but allows for a skip distance of up to 4 words. Both plots show 2 major groups of data which, not surprisingly, correspond to the machine-generated and human-generated summaries. In 2008, there was a wide gap in the performance in average overall responsiveness (the human judgment) while the best systems scored in the lower range of human performance for both ROUGE metrics. Three years later, we see that the best machine-generated summaries have made improvement in both ROUGE and responsiveness, so much so that some systems now exceed the performance of humans in the ROUGE metric. However, their performance in responsiveness pales in comparison with that of humans.
This inability of ROUGE to adequately predict human judgments of summaries gave rise to a “meta-evaluation”, an evaluation of evaluation methods. The task is called AESOP or Automatically Evaluating Summaries of Peers and has been part of TAC for the last two years. In this paper, we propose using both content-oriented features, similar in spirit to ROUGE, in conjunction with low-level linguistic features to produce a metric that correlates well between human-generated summaries and those produced by machine-generated summarization systems. The features were combined based on training on previous years of TAC data using linear algebraic and statistical methods. They were then used to predict scores for the 2011 data prior to their release. The resulting metrics more accurately predicted the current performance gap between human and machine generated summaries than ROUGE. In addition, we have applied our methods to the 2008 TAC data to further validate their ability to predict the human-machine performance gap.
The rest of this paper is organized as follows:
Section 2 covers related work in text summarization evaluation. We discuss the origin of our data in
Section 3. In
Section 4, we define the linguistic and content features that go into our supervised learning algorithms and in
Section 5, we discuss how those algorithms select subsets of the features.
Section 6 describes our results and
Section 7 contains our conclusions and ideas for future work.
2. Related Work
Previous work has looked at extensions to (word) n-gram approaches for judging the quality of a summary relative to one or more human-generated summaries. Conroy and Dang [
5] analyzed summarization evaluation data from the Document Understanding Conferences (DUC [
6], the TAC predecessor) for the years 2005–2007. They proposed using robust regression to find canonical correlation coefficients to improve the correlation between the automatically-generated metric and human-generated metrics. Their approach used several variants of the ROUGE (word) n-gram scoring to produce a new metric, called ROUGE Optimal Summarization Evaluation (ROSE). ROSE was successful in improving the correlation within a given year, which would be useful for researchers producing new summarization methods to build an interpolation model to compare their new method with methods that were evaluated by humans. However, the method was not successful in improving the correlation when a model was built using one year’s data, say 2005, and then applying it to another year’s data, say 2006. The authors did demonstrate that if the actual linguistic quality scores were known, then such a cross-year improvement could be attained.
For “update summaries”, the base summary (or summaries), which encapsulates the readers’ knowledge of the topic so far, must be taken into account. An update summary is a text summary that is generated on an “evolving topic” and summaries are generated for new documents with a focus on what is novel in the new set of documents. Evaluation of such summaries can pose a challenge. An approach that uses the ROUGE content metrics comparing the information in the update summary to that of the previously generated summaries on the topic was proposed by Conroy, Schlesinger and O’Leary [
6]. Nouveau-ROUGE computes a linear combination of the similarity of the summary with not only the current human-generated summaries on the topic but those corresponding to the previously known information. Such an approach was shown to improve correlation with both pyramid and overall responsiveness metrics, two important human-generated scores given to summaries.
Oliveira
et al. [
7] proposed a system which they called Valuation using Enhanced Rationale Technique (VERT-F). VERT-F compares the (word) bigrams of summaries to be evaluated with human-generated summaries by computing a statistic which is a combination of 4 others: the
χ2 statistic, and the three metrics from information retrieval—precision, recall, and the geometric mean of these (
F - measure).
Giannakopoulos
et al. [
8] proposed a novel (character) n-gram approach, AutoSummENG (AUTOmatic SUMMary Evaluation based on N-gram Graphs), which was designed to be language independent. The approach builds graphs for a given summary based on n-gram counts. Graph similarity metrics are then used to compare summaries. The resulting metrics were shown to be competitive with ROUGE scoring. (Giannakopoulos
et al. [
9] turned the evaluation around and used it as a method to generate summaries.)
The Merged Model Graph method (MeMoG) [
10] is a variation on AutoSummENG where instead of comparing summaries to summaries, a summary’s graph is compared to a merged graph of 3 human-generated summaries. We will compare the performance of our approach to AutoSummENG, MeMoG, and VERT-F, as well as several variations of ROUGE in the Results section.
Finally, Pitler, Louis, and Nenkova [
11] went in a different direction and sought to automatically evaluate the linguistic quality of a summary. They tested numerous high-level and low-level features such as cosine similarity between sentences, co-reference information, and number of syllables in a sentence’s words in an attempt to separately predict several aspects of linguistic quality, including grammaticality, non-redundancy, referential clarity, focus, and structure and coherence. Their best results were 90% accuracy for pairwise comparisons of competing systems and 70% accuracy for ranking summaries.
A graph-based method is presented in [
12], where the authors compute term weights to give more credit to essential words in reference sentences (
i.e., sentences from a human-generated summary) when used to automatically measure the quality of a human generated summary. This competitive approach uses centrality score as well as sentence clustering to weight co-occurring words in a sentence. The modifications of their approach were developed after the TAC data were released and are a slight variation of what the authors prepared for TAC 2011. The results of this approach are given in
Figure 2,
Figure 3,
Figure 4 and are labelled 10, 13, 20 and 24.
Figure 2.
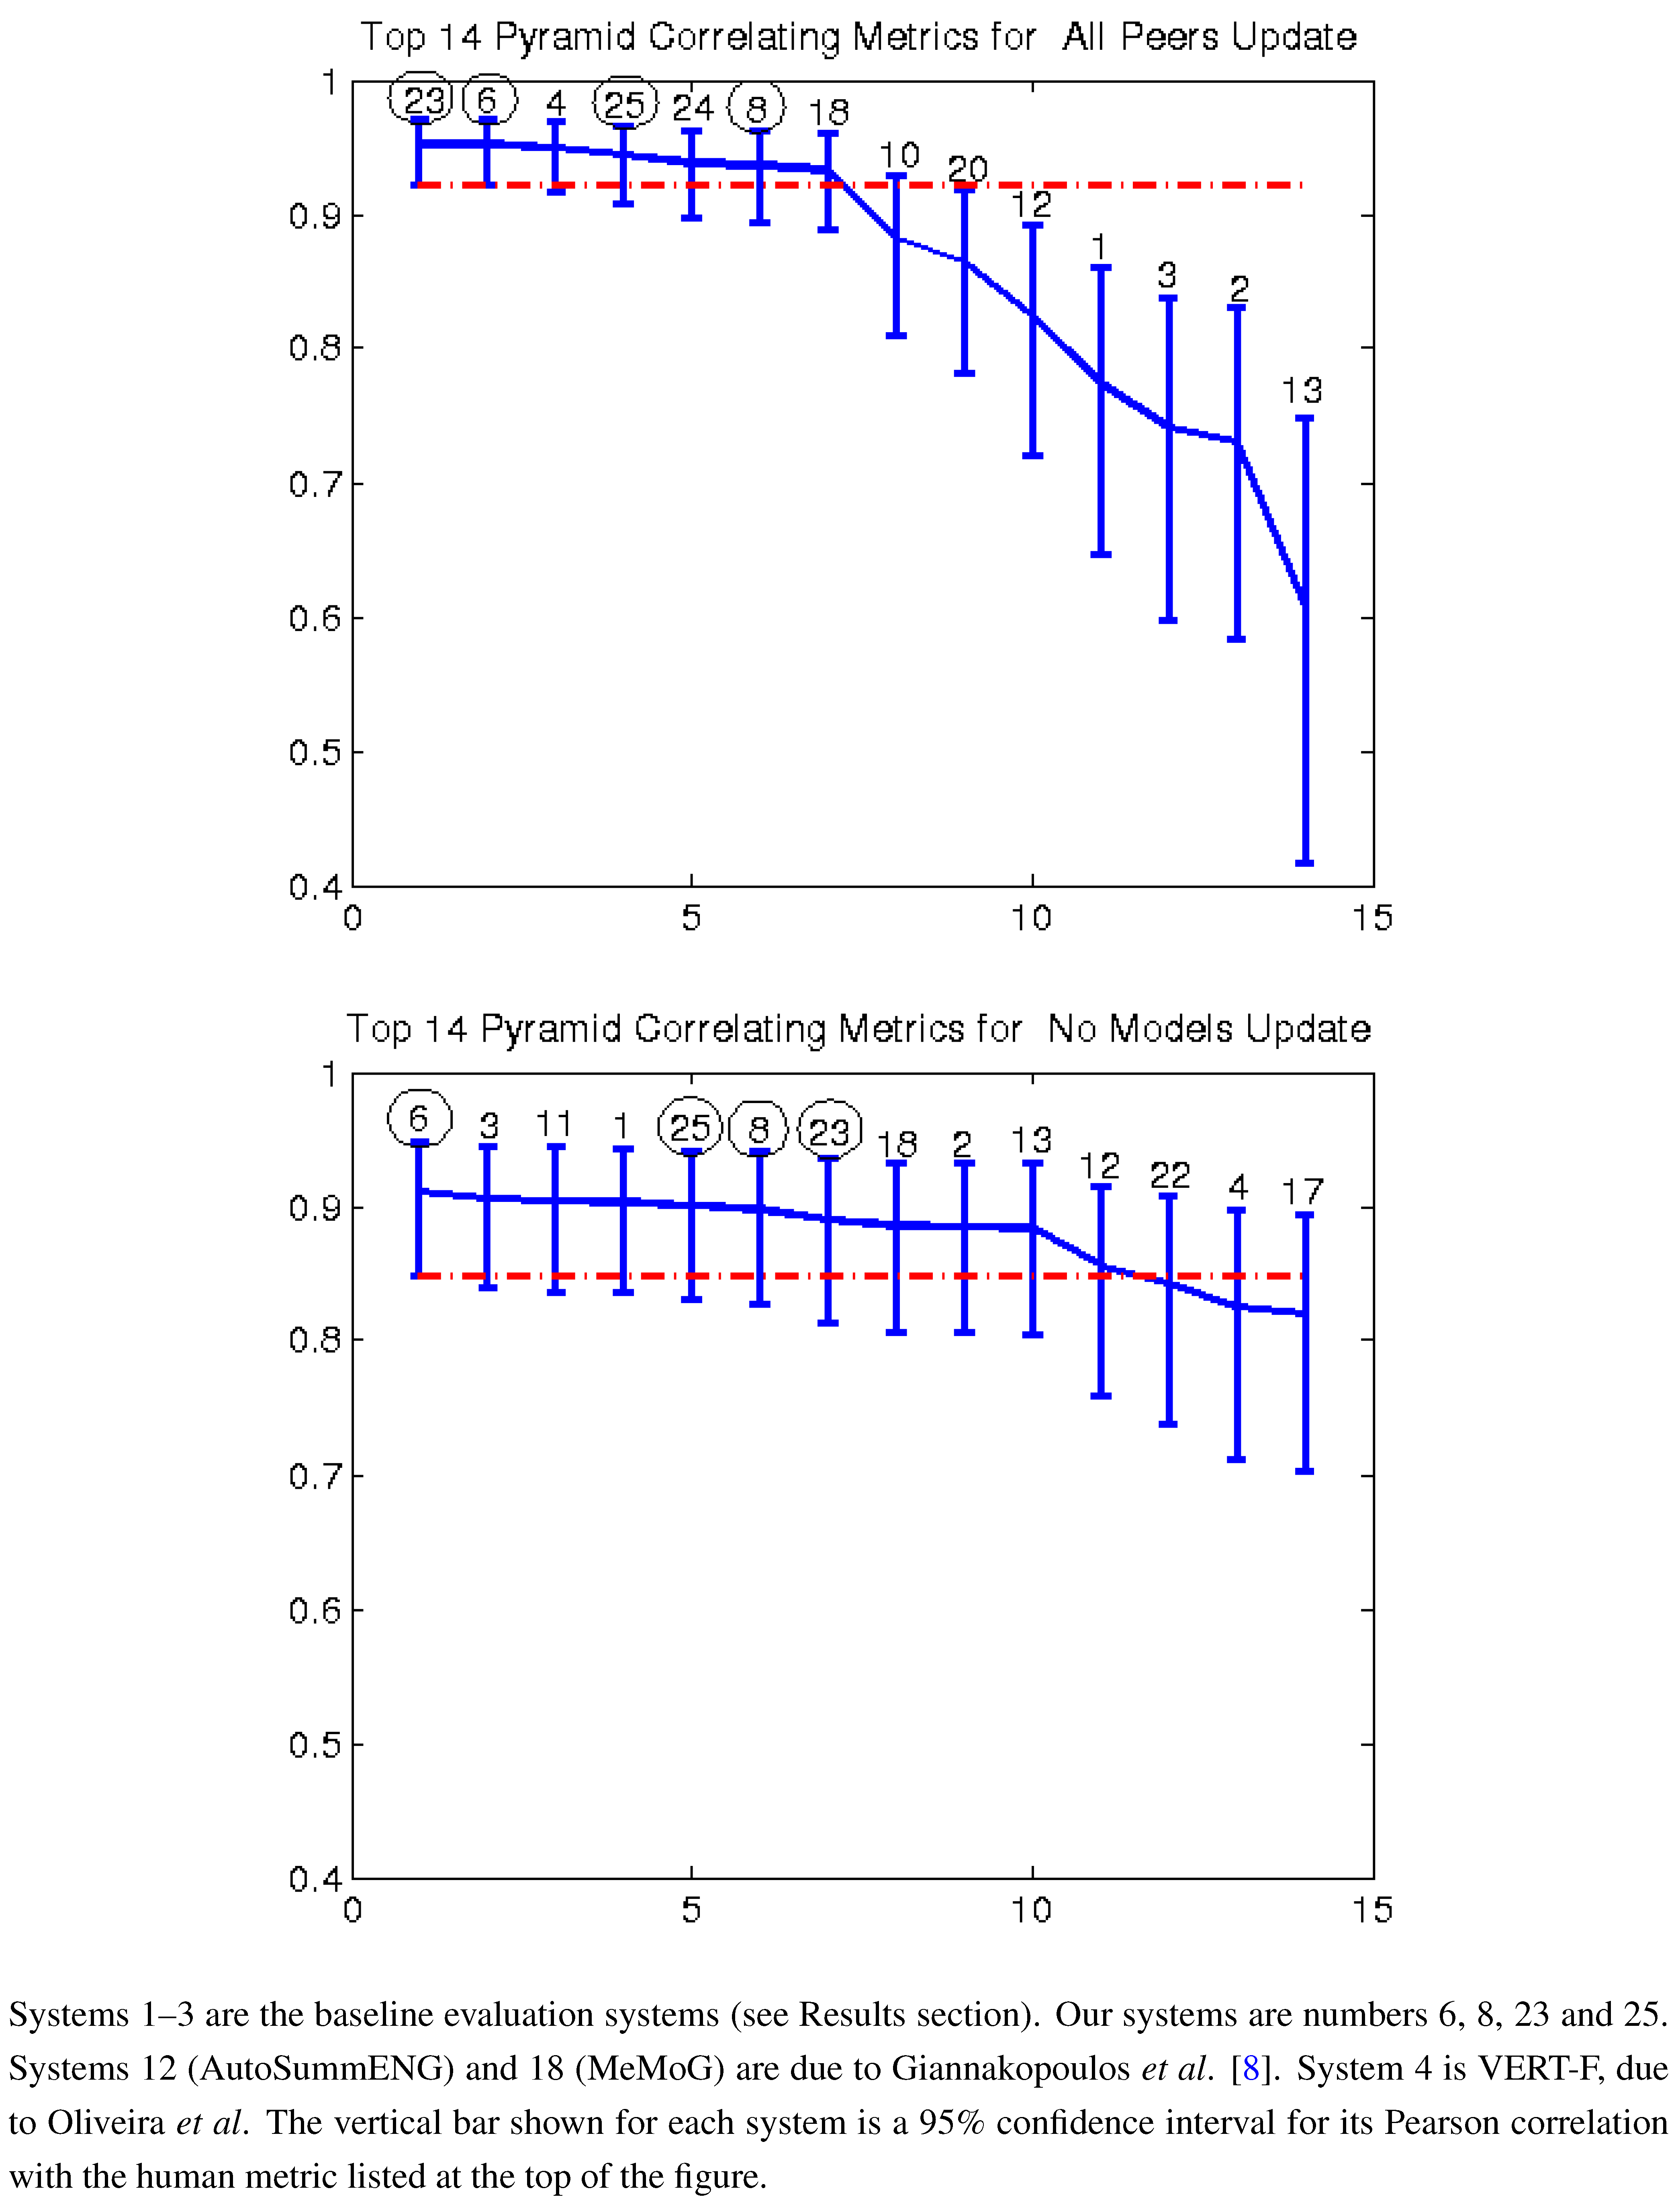
Pearson correlation with pyramid top 14 AESOP metrics all peers and no models (2011).
Figure 2.
Pearson correlation with pyramid top 14 AESOP metrics all peers and no models (2011).
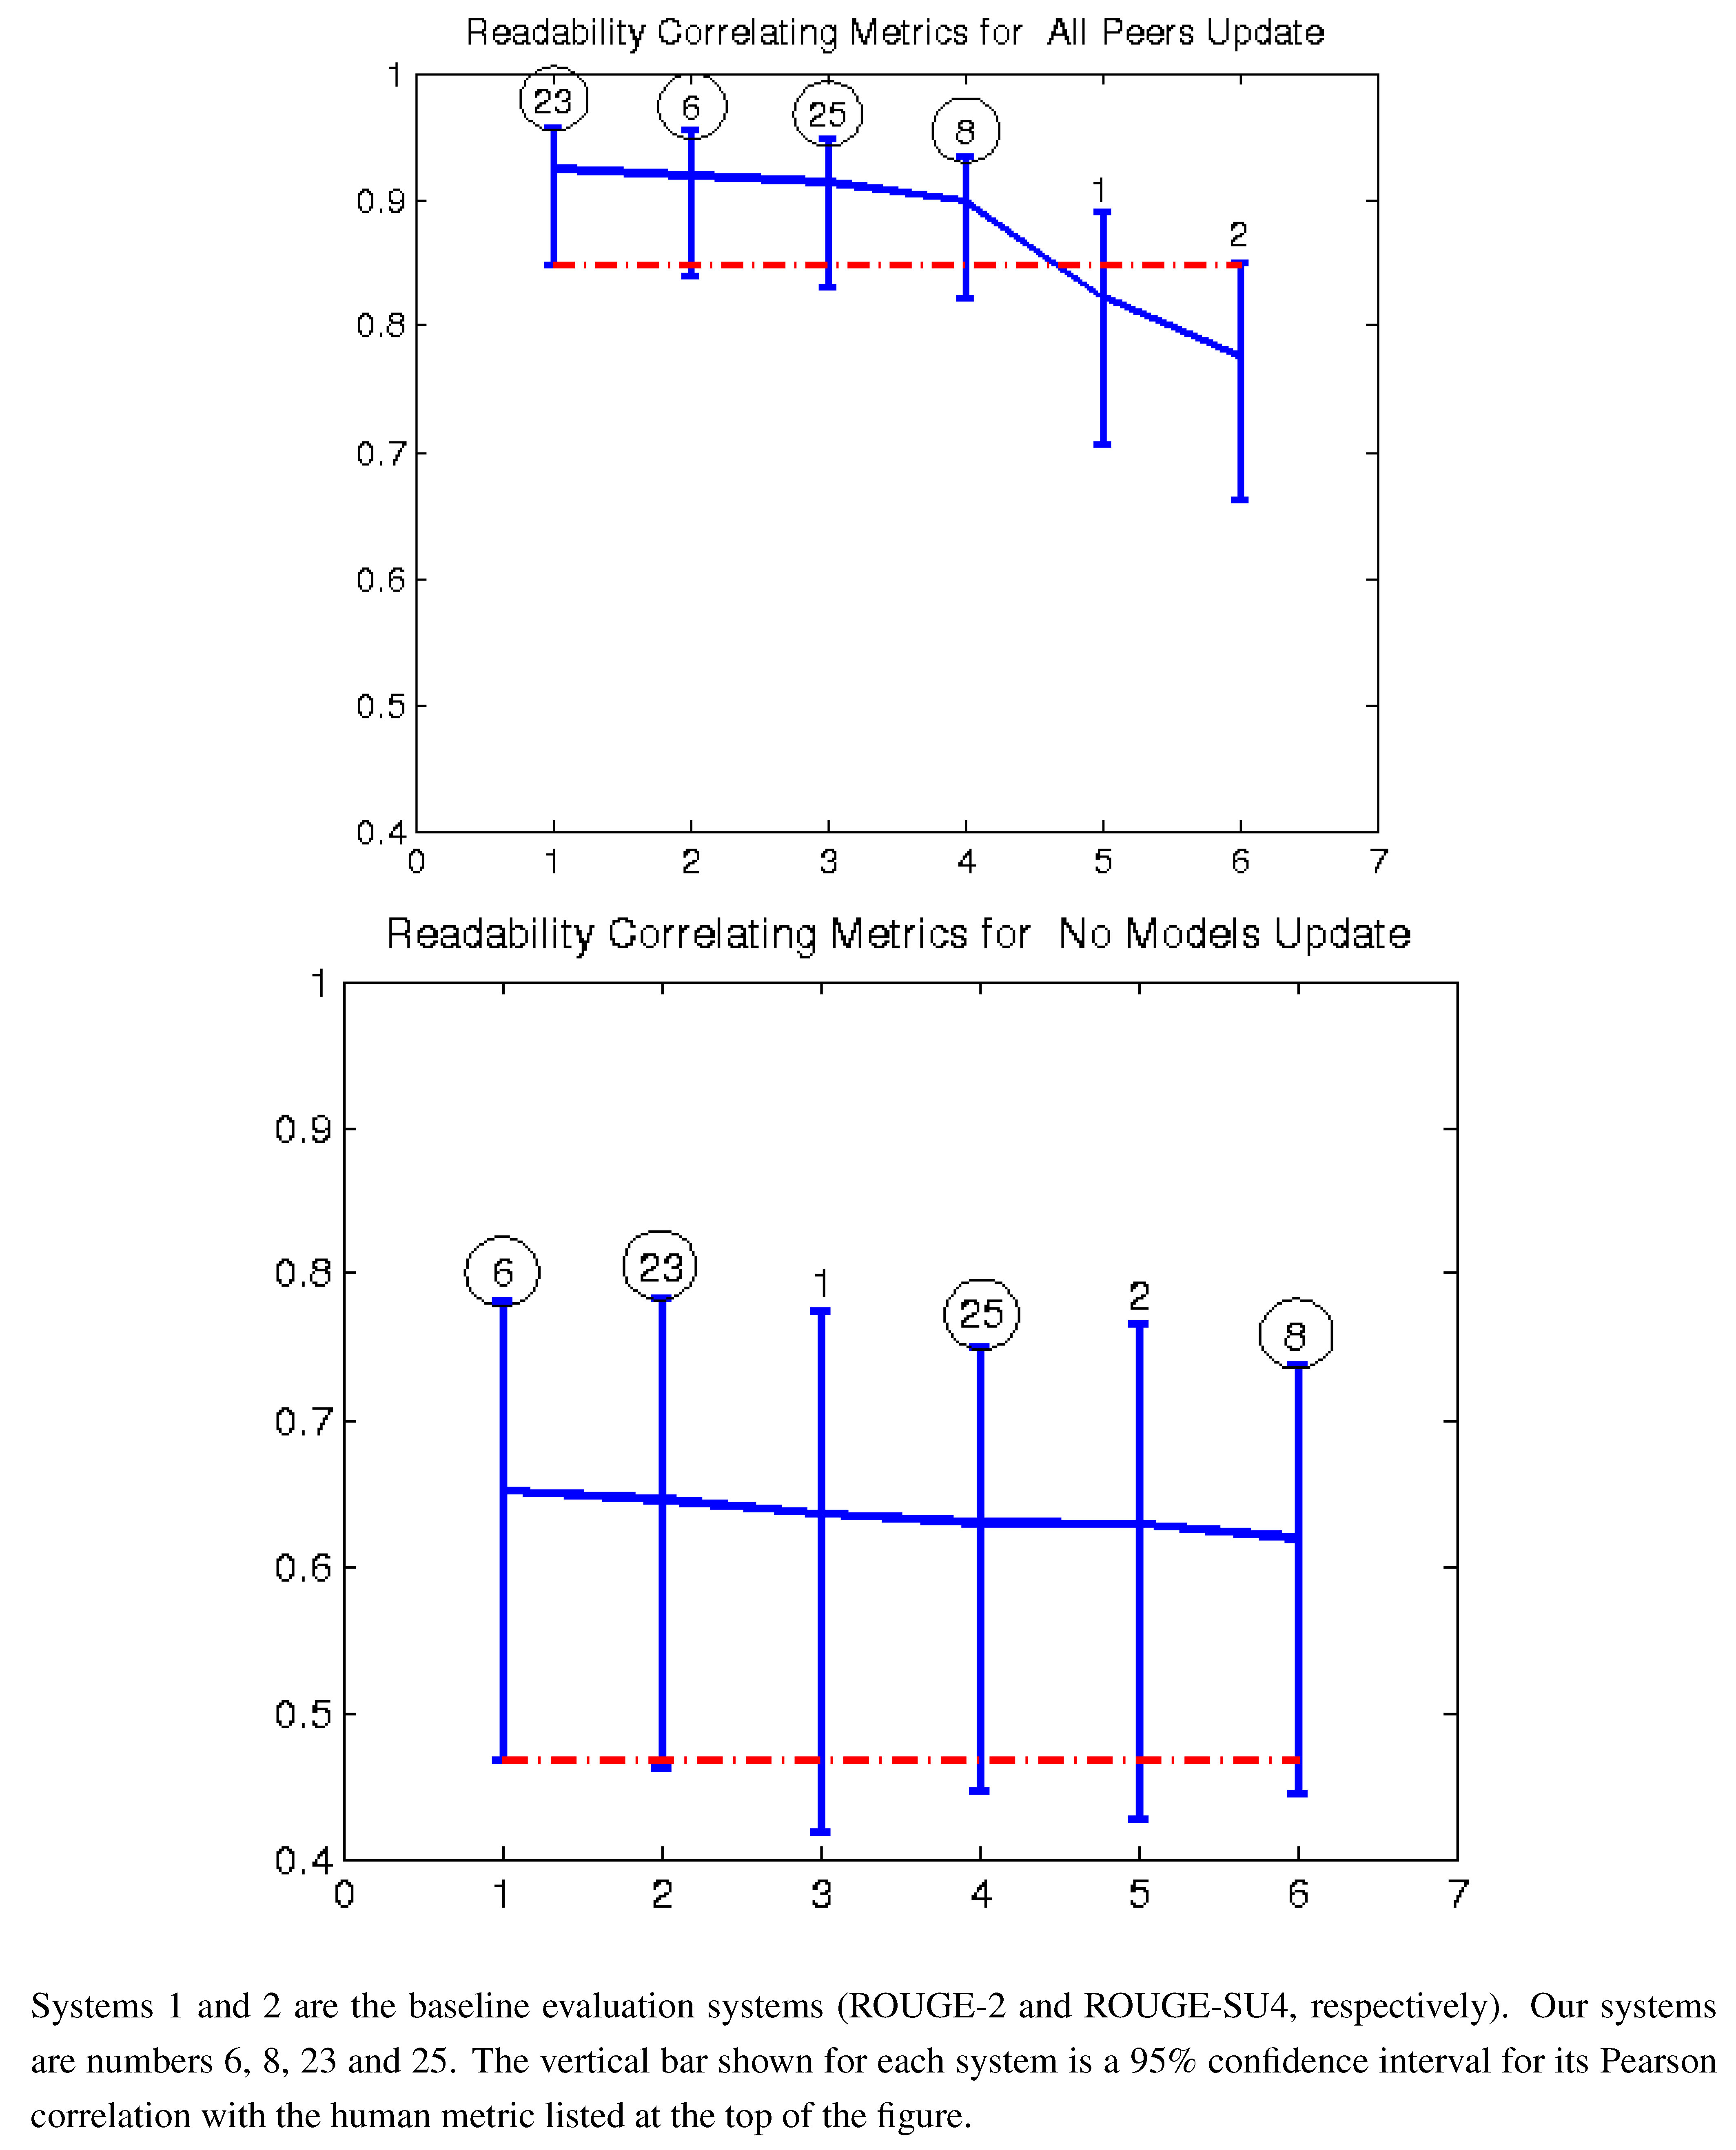
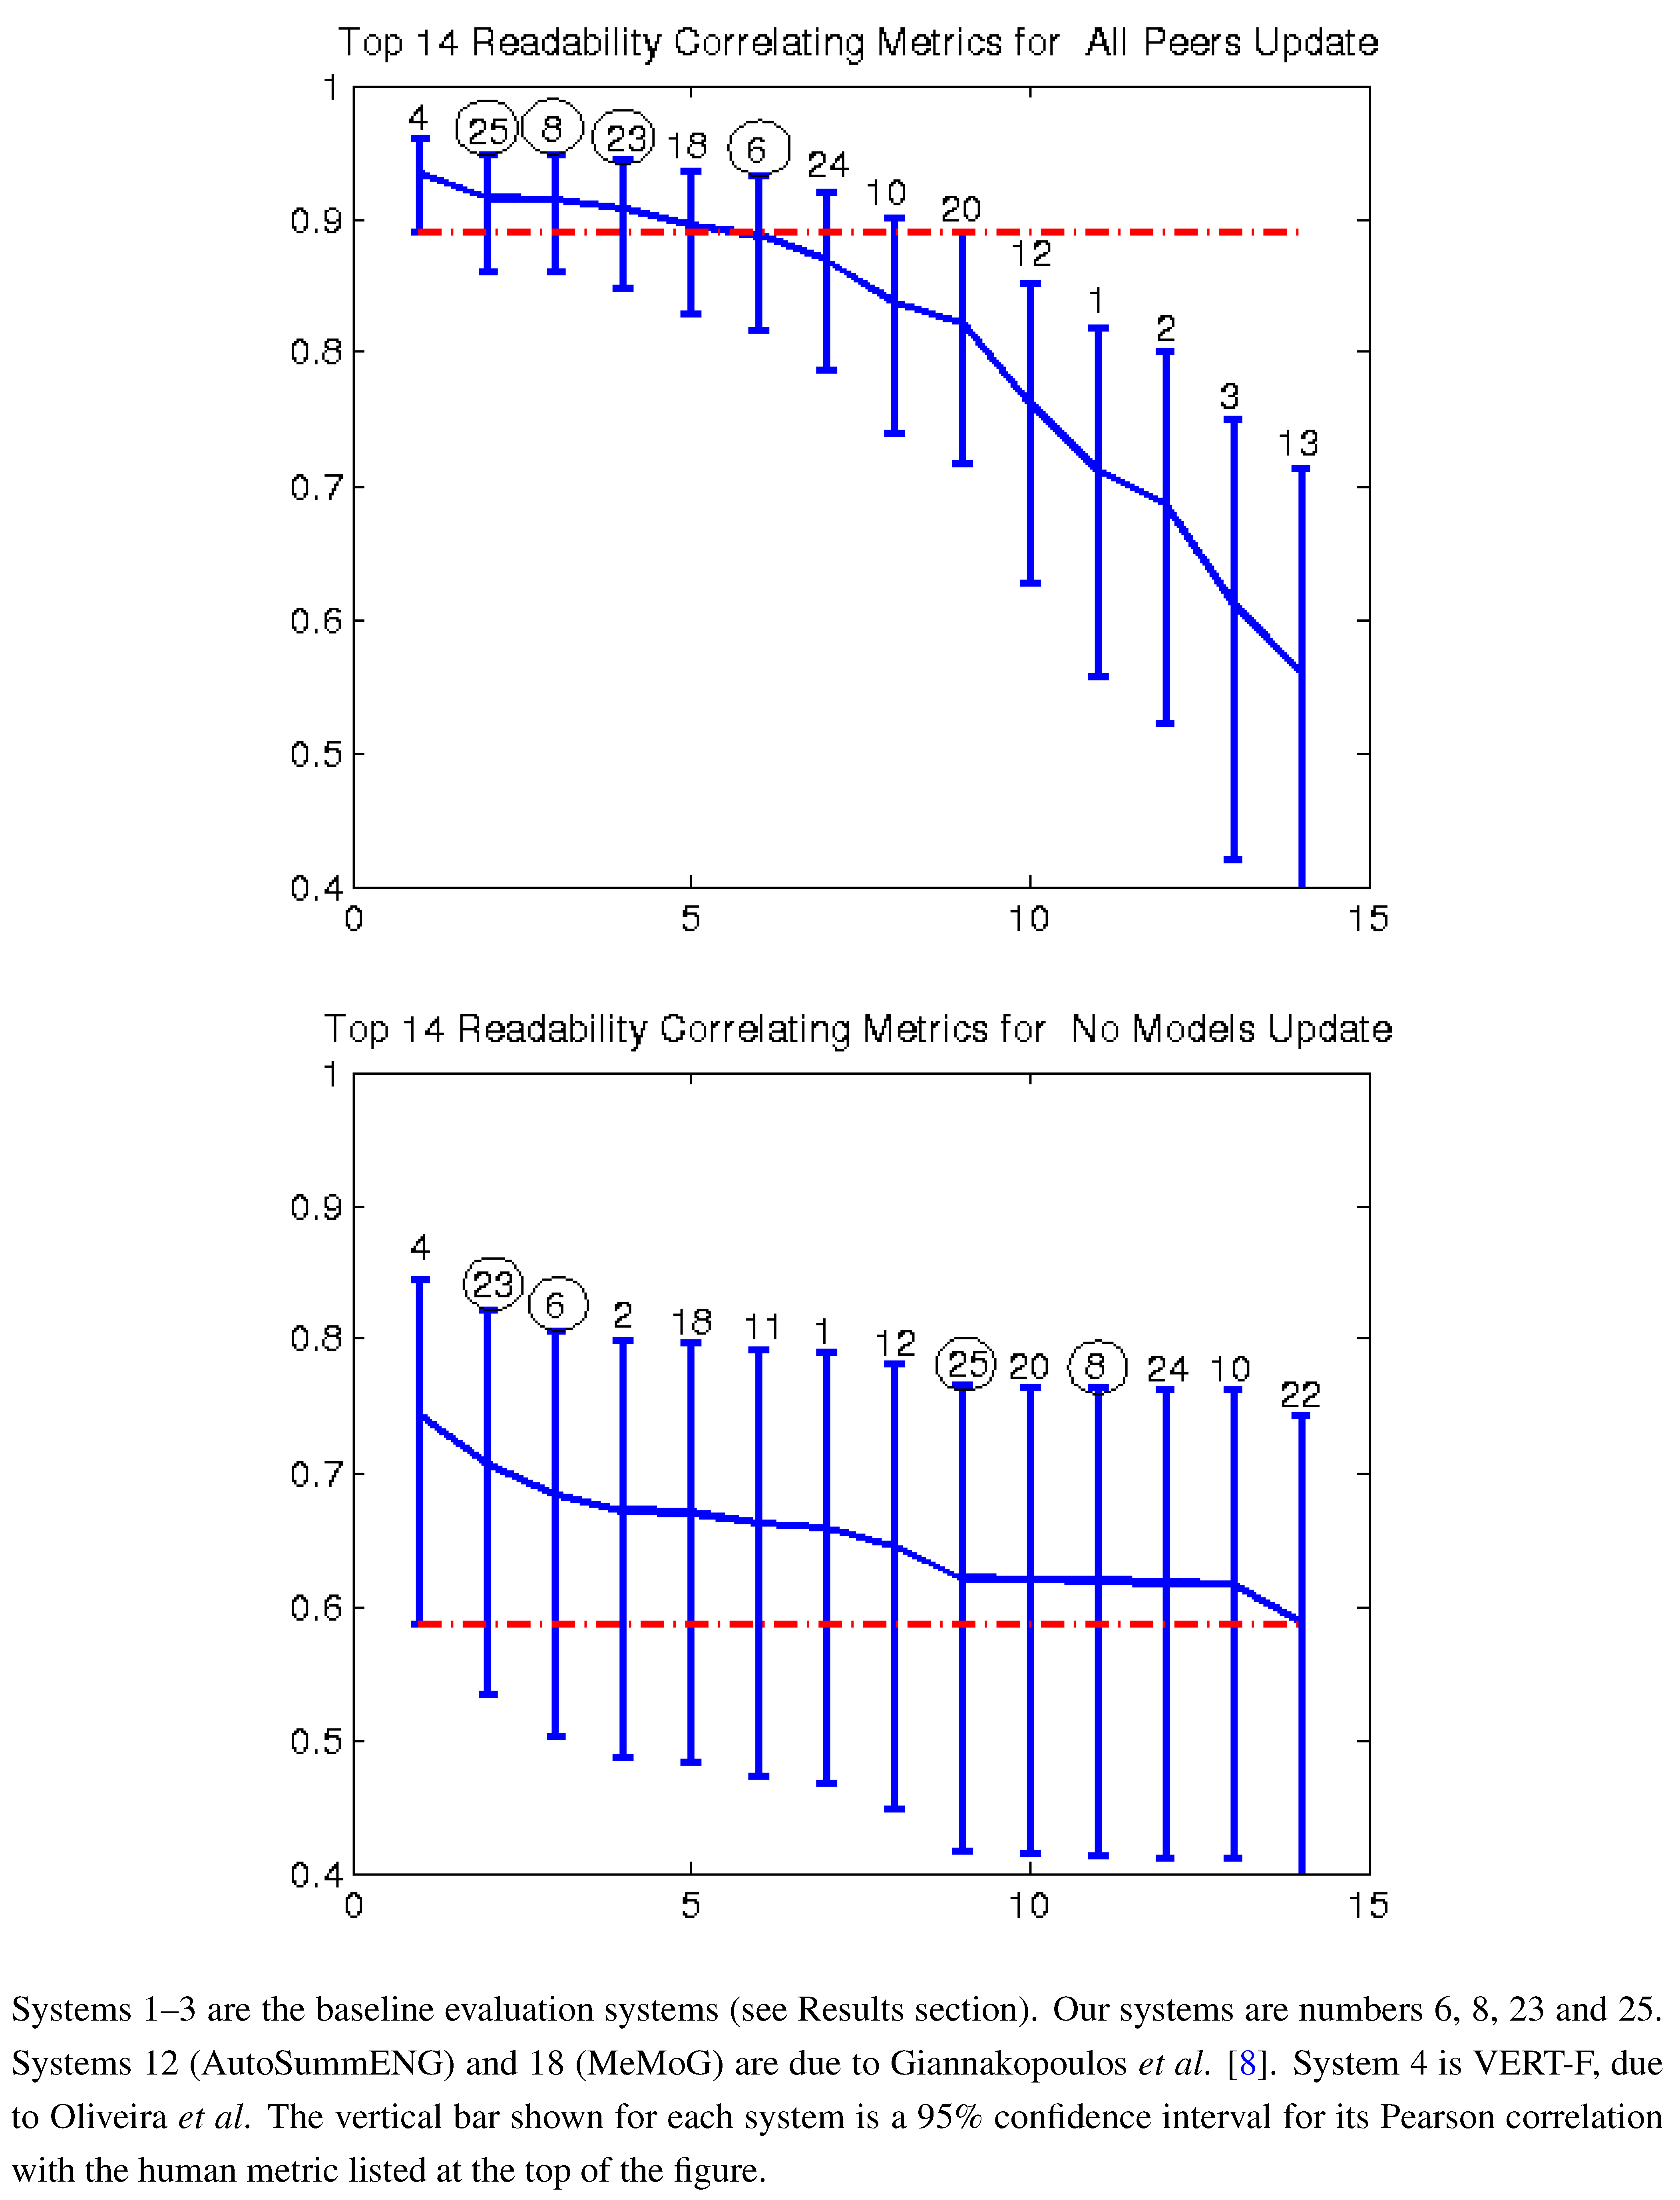
Figure 3.
Pearson correlation with readability top 14 AESOP metrics all peers and no models (2011).
Figure 3.
Pearson correlation with readability top 14 AESOP metrics all peers and no models (2011).
Figure 4.
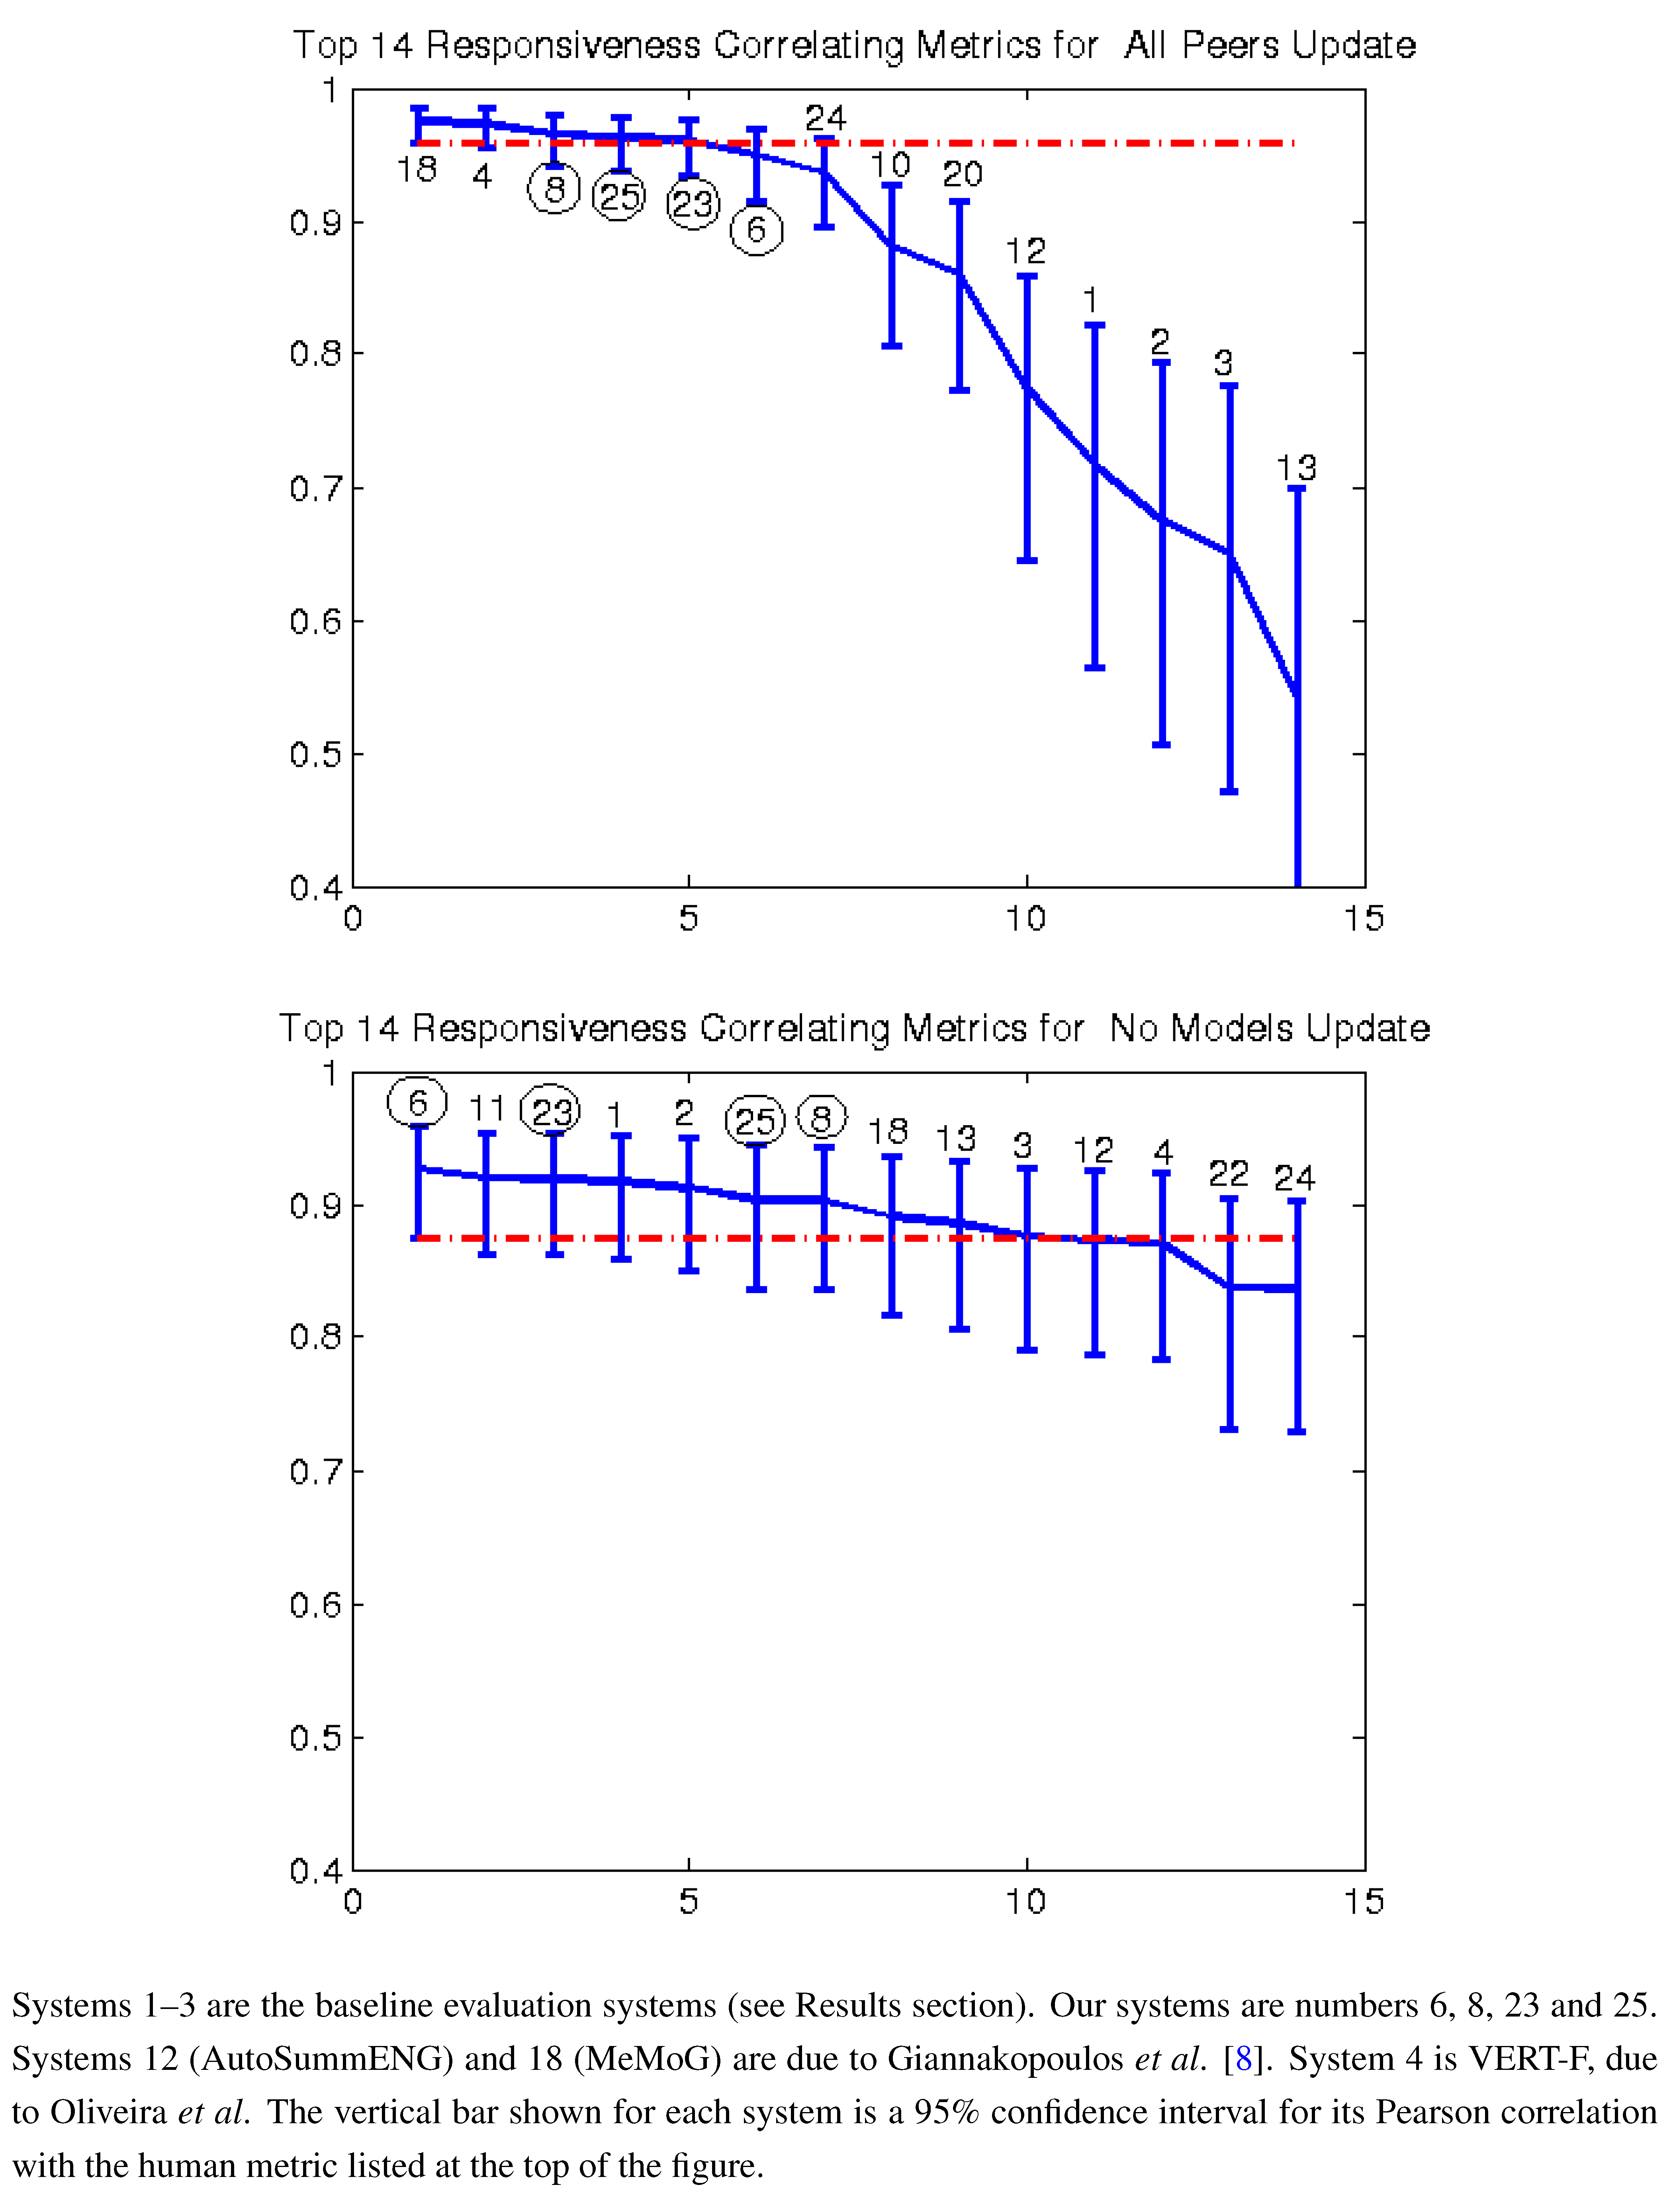
Pearson correlation with responsiveness all peers and no models (2008).
Figure 4.
Pearson correlation with responsiveness all peers and no models (2008).
The following two papers consider the challenge of evaluating machine-produced summaries without model human-written summaries. Steinberger and Ježek [
13] propose using Latent Semantic Analysis (LSA) for summarization evaluation. The idea is that LSA can identify the most important topics in a reference text (full document or abstract) and that a summary can be judged based on how similar its topics are to those in the reference text. They produce similarity scores by computing angles between singular vectors and combinations of singular vectors and achieve good results with model summaries and separately with full text documents.
In [
14], Saggion
et al. expand on the work of Louis and Nenkova [
15] by employing Jensen–Shannon divergence to contrast the probability distribution of a summary with that of its reference text. They show that substituting the full document for the model summary works almost as well in certain cases (generic and topic-based multi-document summarization) but performs much worse in others (summarization of biographical information and summarization of opinions in blogs).
We believe our work is the first to simultaneously combine the different components we used for the scoring of text summaries. We used a novelty metric, content features and various linguistic features to create a family of algorithms able to accurately predict the responsiveness and readability of a text summary.
3. The Data
The data for this evaluation is taken from the 2008–2011 update tasks from TAC. The summarization task consists of two sets of 10 documents in each of 40+ document sets. The first set of 10 is the “base”; the second set occurs later in time and is called the “update”. Participants’ programs create two summaries: One that summarizes the first ten documents and another that summarizes the second ten, focusing only on novel information not contained in the first ten.
In 2010, and continuing to 2011, the notion of a “guided summary” was added. Five categories were established and a set of “aspects”, specific information relevant to the category, was defined for each. Every data set was linked to one category. Inclusion of information that addressed the various aspects was a major focus of the evaluation for both the base and update summaries.
Briefly, NIST has sponsored a summarization evaluation every year since 2001 (DUC through 2007; TAC from 2008 on). Methods to evaluate the submitted summaries have been a major effort and have, of course, evolved over the years. Beginning in 2004, ROUGE [
4] became the automatic method used, replacing a measure of precision and recall of the sentences in the generated summaries. Due to the improved quality of generated summaries, ROUGE scores are no longer as good a predictor of summary quality (when compared with human evaluation of summaries) as they once were. Hence the search for new automatic tools to measure summary quality.
Human evaluation is an expensive undertaking. It, too, has evolved over the years. Various methods to judge the content of the summaries as compared to those generated by humans have been used, beginning with SEE [
16,
17] and moving to a pyramid score [
18], which is the main content evaluation tool at this point. Linguistic quality was first measured by using a set of questions to rate each summary. These questions were modified, extended, and shrunk over the years and are now subsumed in two scores, one which also includes content, called “overall responsiveness”, and one for linguistic quality only.
3.1. Human/System Summary Comparison
We present here an example of a single data set from the TAC 2011 data. The set contains 10 documents; summaries were generated by 4 humans and 43 systems. There was 1 baseline. This data set was chosen specifically because it strongly demonstrates the problems of correlation between ROUGE and human evaluation. Certainly, not all data sets exhibit such wide discrepancies, but in general there is a consistent lack of correlation between the two.
Table 1 shows the pyramid score, overall responsiveness score, linguistic score, and ROUGE-2 score for the human summary with the highest pyramid score and the five system summaries with the highest ROUGE scores. Note that the human’s ROUGE score ranges from almost half to just 40% of the system ROUGE scores, while the system pyramid scores range from barely 14% to just 26% of the human pyramid score. Clearly, in this case, ROUGE-2, which has been shown in the past to have the highest correlation with human evaluation, is lacking.
Table 1.
Contrast between human and system scores for data set D1113C.
Table 1.
Contrast between human and system scores for data set D1113C.
| Summary ID | Pyramid Score | Overall Responsiveness | Linguistic Quality | 2*ROUGE-2 |
|---|
| human C | 0.905 | 5 | 5 | 0.0556 |
| system 3 | 0.123 | 3 | 2 | 0.1370 |
| system 26 | 0.238 | 3 | 3 | 0.1369 |
| system 35 | 0.153 | 2 | 2 | 0.1191 |
| system 13 | 0.182 | 3 | 2 | 0.1135 |
| system 10 | 0.209 | 2 | 3 | 0.1059 |
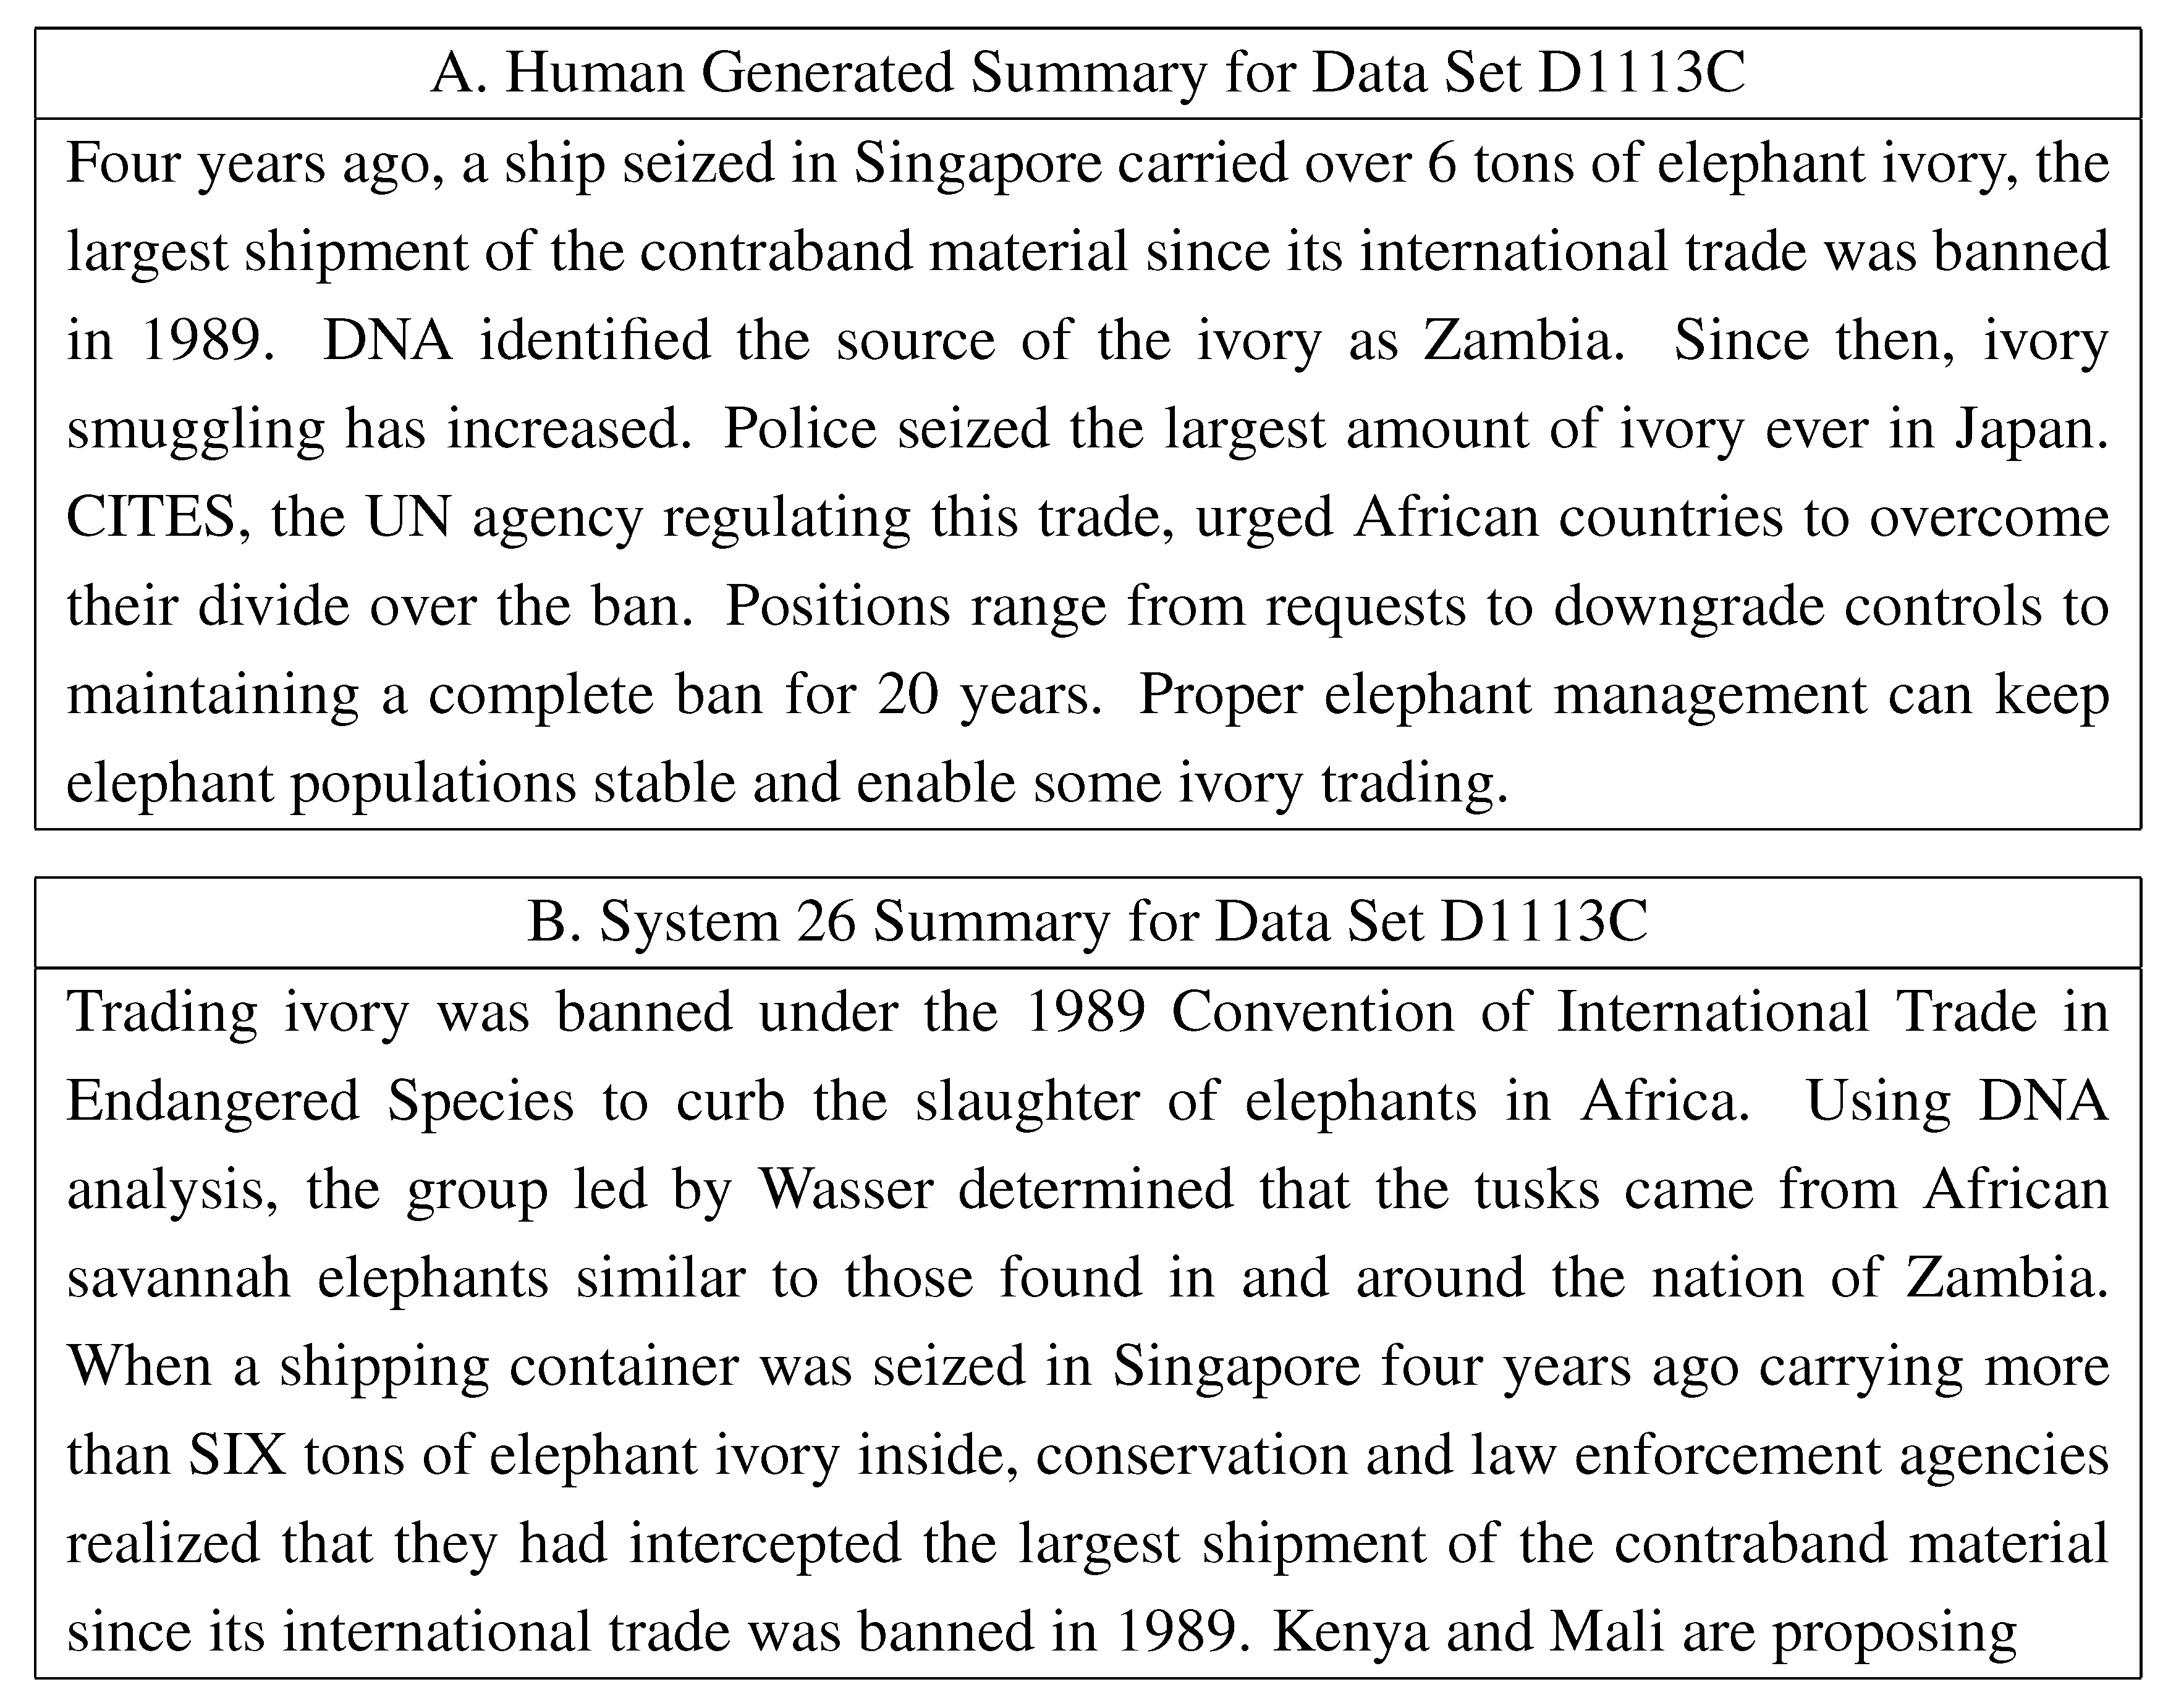
Figure 5 shows the human generated summary and the summary for system 26 which had the best pyramid score of the five systems with the highest ROUGE-2 scores. Note that the overall responsiveness and linguistic scores are 5, the highest possible, for the human summary while system 26 has a score of 3, the best of the five systems but clearly below the human scores. Both overall responsiveness and linguistic quality include cohesiveness, coherence, readability, and redundancy, along with more obvious grammatical issues such as run-on sentences, sentence fragments, bad punctuation and/or capitalization, lack of noun or pronoun referents,
etc. While the system summary reads grammatically correctly, it suffers from poor ordering of the sentences that impacts the summary flow, a lack of specification for the name “Wasser”, and the final sentence fragment.
Figure 5.
Human and system summaries for data set D1113C.
Figure 5.
Human and system summaries for data set D1113C.
4. Features
The models we employ to measure the quality of a text summary combine several features computed from the text of a summary. In this section we define these features and explain why they are included in the models. In general, our features were selected to correlate well with summary content and linguistic quality, since these are what are measured for the TAC summarization evaluation.
4.1. Linguistic Features
Linguistic features correspond to the grammaticality, readability, and flow, including any impact of redundancy, of the summary. These features include the number of sentences, three measures of redundancy, two measures of flow, and a measure of uniformity of sentence length. The current state of the art in automatic summarization is to extract selected sentences from the relevant document(s) to create a summary. Therefore, identifying sentences in the document is a critical early step.
We have developed a sentence splitter called FASST-E (very Fast, very Accurate Sentence Splitter for Text–English) that relies on neither part-of-speech tagging nor parsing, enabling a processing speed of 1000+ sentences per second, yet is still able to execute with an error rate of less than 0.1%. FASST-E is responsible for two major tasks that contribute to the final linguistic quality of the summary. The first is, of course, the sentence splitting itself. The effort here is to ensure that all splits are made where they belong (not as simple a task as it may seem) in order to avoid both run-on sentences and sentence fragments. Run-On sentences generally cause sentences that would never be selected for a summary to be included, thereby weakening the content of the summary. Sentence fragments impact the readability, grammaticality, and continuity of the summary. The second task is to eliminate boilerplate, such as datelines, which can occur in sentences. A selected sentence which contains boilerplate has an even more negative impact on the readability, grammaticality, and continuity of the summary than sentence fragments.
The formal mathematical descriptions of our linguistic features are:
Number of Sentences: We use – log2 (number of sentences). Since TAC summaries are constrained by a word limit, it is unlikely there will be too many sentences, but we have seen summaries comprised of just one long sentence.
Redundancy Score 1: Let σ
1,…,σ
n denote the singular values of the term-overlap matrix
X, where
σi ≥
σi+1. The term-overlap matrix
X is simply (
A > 0)´*(
A > 0), where
A is the term-sentence matrix and
A >0 denotes a logical matrix of zeros and ones. The (
i,
j) -entries in the term-overlap matrix are the number of terms in common in sentence
i and sentence
j. Redundancy score 1 is then defined as
![Algorithms 05 00398 i001]()
, or the sum of the squares of all but the first singular value.
Redundancy Score 2: This is similar to the previous score; this score is calculated as
![Algorithms 05 00398 i002]()
. These two redundancy scores were included to penalize summaries whose sentences overlapped too much. In the extreme case where all sentences contain the same words (in possibly different arrangements), the score would be 0.
Term Entropy (Redundancy Score 3): Term entropy is the sample entropy of the vector of counts of term occurrences. This is calculated from the original term-sentence matrix (with zero columns removed) by dividing the column sums by the sum of all the matrix entries. Call this vector
p. Then the term entropy is
![Algorithms 05 00398 i003]()
.
Sentence Entropy (Sentence Length Uniformity): Sentence entropy is calculated the same way as term entropy, using row sums instead of column sums. It is the sample entropy of the vector of sentence lengths. The sentence length uniformity is designed to penalize systems whose sentence lengths vary greatly. A simple example of non-uniformity of sentence length where the quality of a summary is affected was studied in [
5], where it was shown that systems that use truncated sentences to end a summary have significantly lower scores than those that do not. In addition, Conroy
et al. [
19] demonstrated that this feature was more generally a useful predictor of a summary’s quality.
Term Overlap (Flow Score 1): Our first term overlap feature is computed from the term-overlap matrix, defined above in the description of Redundancy Score 1. We define the term-overlap score as the sum of the super-diagonal of this matrix, or the sum of the (i, i+1) -entries. The score is then the logarithm of the sum of the number of terms overlapping in each pair of adjacent sentences plus 1. We have observed that some term overlap between adjacent sentences improves readability.
Normalized Term Overlap (Flow Score 2): The second term overlap feature is also the sum of the entries along the super-diagonal, but this time the term-overlap matrix has been symmetrically normalized first,
i.e., each
Xij has been replaced by
where
σ(0) = 1 and
σ(
x)=
x for
x≠0
..
4.2. Content Features
Based on the outcome of AESOP 2010, it seemed that word bigrams produced the best results in predicting the content measure of a summary. In particular, ROUGE-2 was most highly correlated with the pyramid score. As such, we focused on variations of bigram scores for content measure. In all, we investigated six variations of bigrams, the first two of which were ROUGE.
ROUGE-2, (R2) the consecutive bigram score.
Let
Rn(
X) be the ROUGE score for matching
n-grams of a summary
X with
h human summaries denoted
M(j),
j=1,…,
h. Then
where
Nn is the set of
n− grams present in the summary being scored,
Xn(
i) is the frequency of the
n-gram
i in the summary and
![Algorithms 05 00398 i006]()
is its frequency in the
j-th human-generated summary.
ROUGE-SU4, (SU4) the bigram score that allows for a skip distance of up to 4 words.
-
Bigram coverage score (Coverage). This score is similar to ROUGE-2 but does not account for the frequency that the bigram occurs in either the human summaries or in the summary to be scored. A credit of
![Algorithms 05 00398 i007]()
for a bigram is given if
i out of
n human summaries contain that bigram.
Unnormalized ROUGE-2 (Bigram). The score is essentially ROUGE-2 without the normalization for the length of the summaries.
Bigram coverage, as measured by a point to point comparison (Coverage P2P). This score is similar to the third score. However, it is computed by comparing the candidate summary to each human summary individually, as opposed to comparing it with the collection of human summaries.
Unnormalized ROUGE-2 as measured by a point to point comparison (Bigram P2P). This score is a point to point version of score 4.
5. Feature Selection and Regression Techniques
For the TAC AESOP task, we submitted four sets of predictions to each of the four different subtasks, for a total of sixteen. Each submission was based on a supervised learning algorithm performed on its own subset of features. We limited our focus here to two variations of linear regression (non-negative least squares and robust regression), and also canonical correlation, an eigenvalue method, but would like to explore other methods in the future. In particular, we chose to start with the current methods due to their ease of of application and interpretability.
In order to predict the quality of an individual summary, we took advantage of previous years’ data in an interesting way. We had 13 predictors, arising from the seven linguistic features and six ROUGE-like content features. For each submission, our goal was to create a model using some subset of these features. We tested every possible combination of these 13 features. For each of the 2
13-1 combinations, we fit three models to the data. Since our ultimate goal was to predict the quality of the 2011 summaries, we trained each of these three models on the 2009 TAC data and predicted the quality of summaries in the 2010 data. For each of the three different regression methods (described below), we used the combination of features that was best able to predict the 2010 summary quality as our feature set for predicting 2011. This gave us three sets of features, each one tailored to a particular regression method. We then used each of the three combinations of features, together with its method, to train a model on the TAC 2010 summaries. This gave us the coefficients to use for predicting the quality of the TAC 2011 summaries. The values of the coefficients are given in
Table 2 and
Table 3 for each of our sixteen submissions.
Table 2.
Features used when predicting scores of both human and machine summaries.
Table 2.
Features used when predicting scores of both human and machine summaries.
| | Pyramid(8) | Responsiveness (25) | Readability(23) | Responsiveness(6) |
|---|
| | canon | canon | canon | canon | robust | robust | nonneg | nonneg |
|---|
| Feature | A | B | A | B | A | B | A | B |
|---|
| R2 | 4.8e + 1 | 2.4e + 1, 5.3e + 1 | 4.8e + 1 | 4.7e + 1, 8.5e + 1 | 4.5e + 1 | 6.5e + 0, -7.1e + 0 | | |
| SU4 | 3.7e + 1 | 3.9e + 1, 5.4e + 1 | 3.7e + 1 | | 4.0e + 1 | -6.9e + 0, 2.0e + 1 | 2.3e + 1 | |
| Coverage | 3.6e - 1 | -3.9e - 1, -1.6e + 0 | 3.6e - 1 | -2.4e - 1, -1.3e + 0 | 2.7e - 1 | 4.3e - 1, -2.0e - 1 | 1.2e - 1 | 7.4e - 2, 2.3e - 2 |
| Bigrams | -4.0e - 1 | | -4.0e - 1 | | -3.6e - 1 | | | 5.9e - 3, 3.5e - 3 |
| Bigrams P2P | 5.9e - 1 | | 5.9e - 1 | | 3.0e + 0 | | | |
| Coverage P2P | -7.2e - 1 | | -7.2e - 1 | | -3.2e + 0 | | | |
| log2(1+Term Overlap) | 8.9e - 2 | 1.9e - 1 | 8.9e - 2 | 9.3e - 2 | | 2.9e - 2 | | 0.0e + 0 |
| Norm Term Overlap | -6.6e - 1 | -1.0e + 0 | -6.6e - 1 | | 7.6e - 2 | | | |
| Redundant 1 | | -2.2e - 4 | | | | -3.0e - 5 | | |
| Redundant 2 | | | | -2.0e - 4 | 6.7e - 4 | | | |
| Term Entropy | | 1.0e - 1 | | -5.3e - 2 | -5.3e - 2 | 2.2e - 1 | | |
| -log2(sent length) | 1.2e + 0 | | 1.2e + 0 | | -2.2e - 3 | 4.4e - 1 | | |
| Neg Sent Entropy | -9.6e - 1 | | -9.6e - 1 | | 1.6e - 1 | -3.8e -1 | | |
For each subset of the covariates, we used three different methods of regression (canonical correlation, robust least squares, and non-negative least squares) to fit a predictive model. What follows are short descriptions of these methods. The input data in each case is an n × 13 matrix A, consisting of columns of predictors, and an n × 3 matrix B, consisting of columns b1,b2 and b3 of the three human scores given to the summaries (overall responsiveness, pyramid score, and linguistic quality score). If we used standard linear regression (ordinary least squares), we would be looking to find x such that ||Ax − bi || is minimized (where bi is the particular column of human metrics we are trying to predict). Each of the three methods uses a variation on this theme.
Robust Least Squares (robust): This method is finding x such that ||w(Ax − bi)|| is minimized, where w is a function that increases the weight of certain observations and decreases the weight of others. Here the function w is applied component-wise to the vector Ax − bi. We used Matlab’s robustfit, which follows an iterative re-weighting procedure. Its default weighting function, “bisquare”, and default tuning constant, 4.685, were also used. “Bisquare” is defined as w =(|r| < 1)(1 − r2)2, where each operation is done component-wise.
Table 3.
Features used when only predicting scores of machine summaries.
Table 3.
Features used when only predicting scores of machine summaries.
| | Pyramid(8) | Responsiveness (25) | Readability(23) | Responsiveness(6) |
|---|
| | robust | robust | robust | canon | robust | robust | nonneg | nonneg |
|---|
| Feature | A | B | A | B | A | B | A | B |
|---|
| R2 | 1.2e + 1 | 2.1e + 1, 2.0e + 0 | | -8.9e + 1, -1.3e + 2 | | | | 2.9e + 0, 0.0e + 0 |
| SU4 | | 3.4e + 1, 4.2e + 1 | 2.2e + 1 | 9.0e + 1, 1.0e + 2 | 2.2e + 1 | | 2.0e + 1 | |
| Coverage | | | | | | | | |
| Bigrams | | | | 3.0e - 1, 4.0e - 1 | | | | 9.6e - 3, 5.1e - 3 |
| Bigrams P2P | -5.7e - 1 | | | 8.7e + 0, -1.4e + 0 | | 2.8e + 0, -5.1e - 1 | | |
| Coverage P2P | 7.3e - 1 | -2.9e - 1, -5.1e - 1 | | -8.6e + 0, 6.8e - 1 | | -2.4e + 0, 4.8e - 1 | | |
| log2(1+Term Overlap) | 2.7e - 1 | | 9.3e - 2 | | 1.4e - 1 | | 1.0e - 1 | |
| Norm Term Overlap | -1.2e + 0 | | | | -7.4e - 1 | | | |
| Redundant 1 | | | | | 4.6e - 5 | -1.5e - 4 | | |
| Redundant 2 | | | 5.4e - 4 | | | 3.2e - 4 | 6.0e - 4 | |
| Term Entropy | -1.5e - 2 | | -1.0e - 1 | | -1.9e - 1 | 8.7e - 2 | | |
| -log2(sent length) | | | | 1.8e + 0 | 5.2e - 1 | 6.7e - 2 | | 1.1e - 2 |
| Neg Sent Entropy | | | | -2.0e + 0 | -4.6e - 1 | 8.4e - 2 | | |
The value
r in the weight functions is
![Algorithms 05 00398 i008]()
, where
resid is the vector of residuals from the previous iteration,
tune is a tuning constant that is divided into the residual vector before computing weights,
h is the vector of leverage values from a least-squares fit, and
s is an estimate of the standard deviation of the error term given by
![Algorithms 05 00398 i009]()
. Here
MAD is the median absolute deviation of the residuals from their median. The constant 0.6745 makes the estimate unbiased for the normal distribution. If there are
p columns in
A, the smallest
p absolute deviations are excluded when computing the median.
Non-Negative Least Squares (nonneg): This is essentially ordinary least squares, since we are trying to minimize ||Ax − bi ||, but the variation here is that x is restricted to having non-negative entries. In order to avoid having features ignored, we first multiply all feature columns by ±1 to ensure each is positively correlated with the response vector. We used Matlab’s lsqnonneg, which also uses an iterative procedure. The procedure starts with a set of possible basis vectors and computes the associated dual vector λ. It then selects the basis vector corresponding to the maximum value in λ and swaps out that vector in exchange for another possible candidate. This continues until λ ≤ 0, at which point a solution is reached.
Canonical Correlation (canon): This method seeks a linear combination of the columns of
A that has maximum correlation with a linear combination of the columns of
B. As in [
20], we can form the covariance matrix Σ of the matrix (
A,B) and partition it as follows:
where Σ
AB = Σ´
BA. Then,
ρ2, the squared correlation between
A and
B, is defined to be the maximum squared correlation between arbitrary linear combinations of the columns of
A and
B, say
v´
A and
w´A. This is given by:
The maximum of
ρ2 in this case is known to be
ρ12, the largest eigenvalue of
The maximum occurs when
v is the eigenvector of
corresponding to
ρ12, and
w is the eigenvector of
corresponding to
ρ12. The positive square root
![Algorithms 05 00398 i015]()
is called the first canonical correlation between
A and
B.
Once we determine which subset of features has the highest possible correlation with a linear combination of the human metrics, we select that subset for evaluation on the test data.
6. Results
To understand the results from the Text Analysis Conference, one more task subdivision needs to be mentioned. For both the update summaries and the initial summaries, participants submit up to four sets of score predictions (for a total of eight). However, the number is actually sixteen, since participants train each of the eight models twice. The first iteration of each is when participants are trying to predict only the scores of machine-generated summaries (called the “no models” subtask). In the second, participants train one model to simultaneously predict the scores of both human summaries and machine summaries (called the “all peers” subtask).
Figure 1, presented in
Section 1, demonstrates why this second iteration exists. When predicting only the machine summaries, the best-fit line for ROUGE-2 and ROUGE-SU4 goes through most of the data, but does not correctly fit the human summaries. This situation improves significantly for several of our systems and is shown in
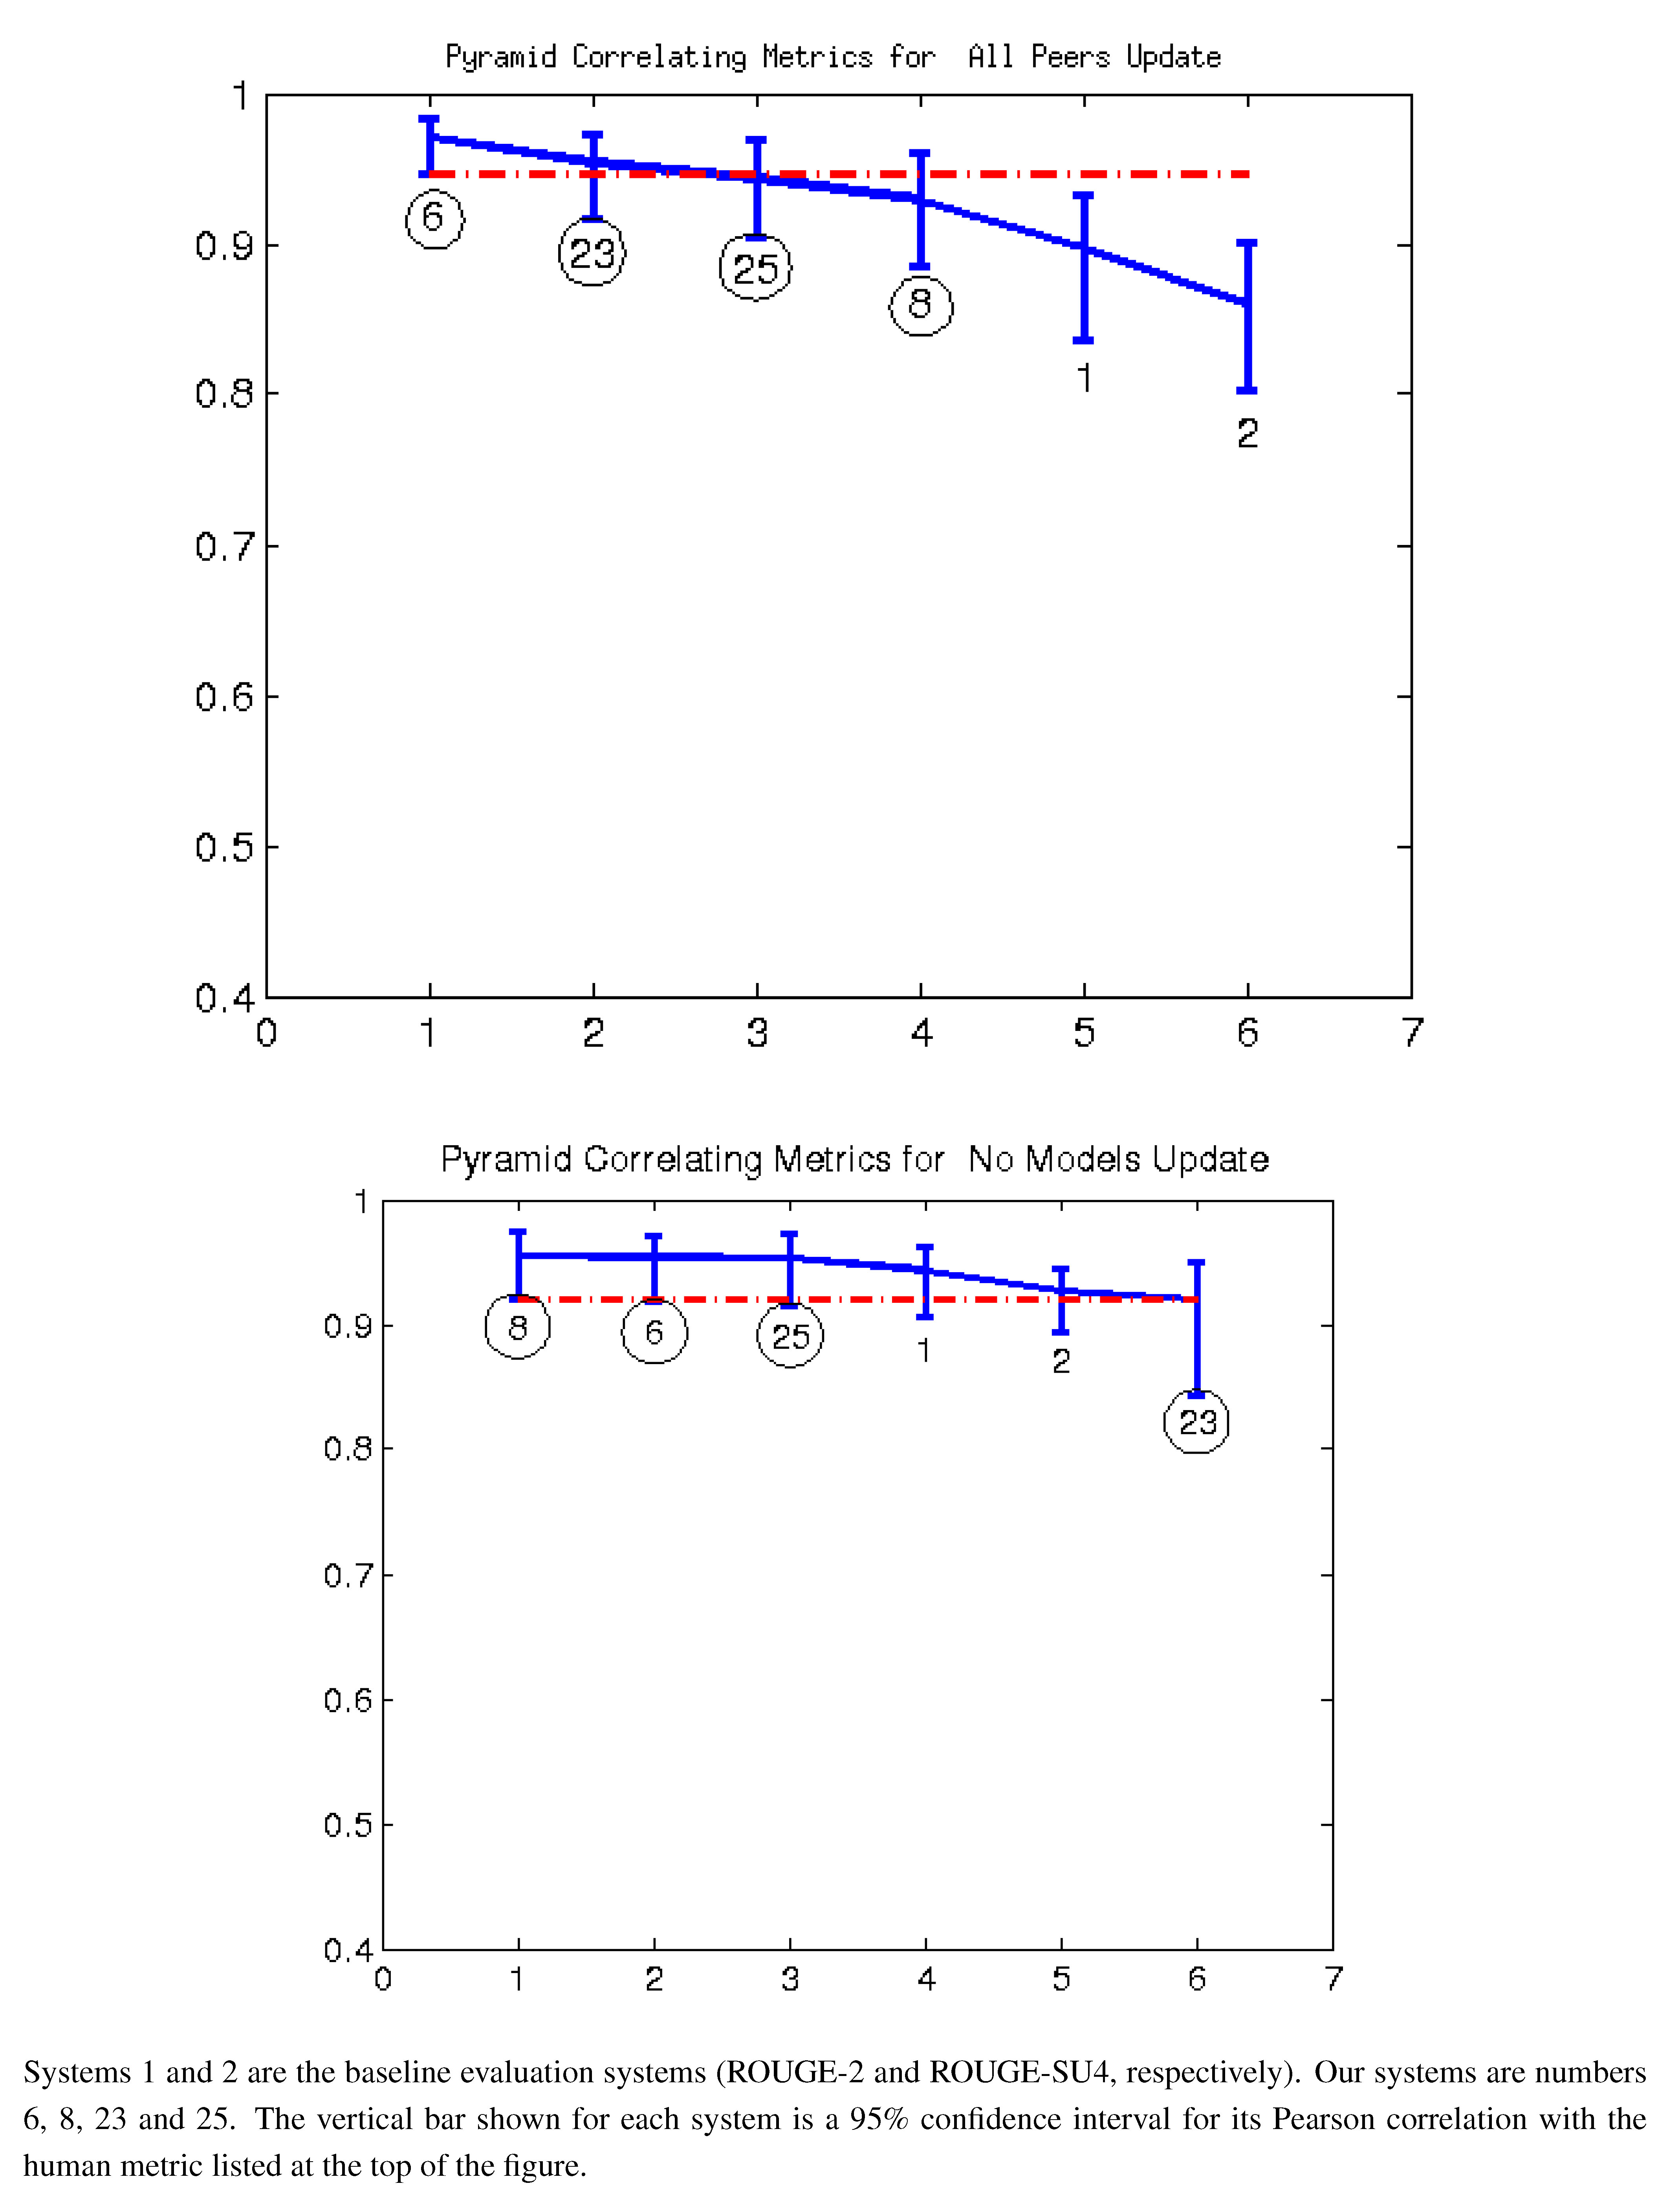
Figure 6 with System 25 (our canonical correlation model aimed at predicting responsiveness). System 25 shrinks the gap for initial summaries and almost eliminates it for update summaries.
Figure 2,
Figure 3 and
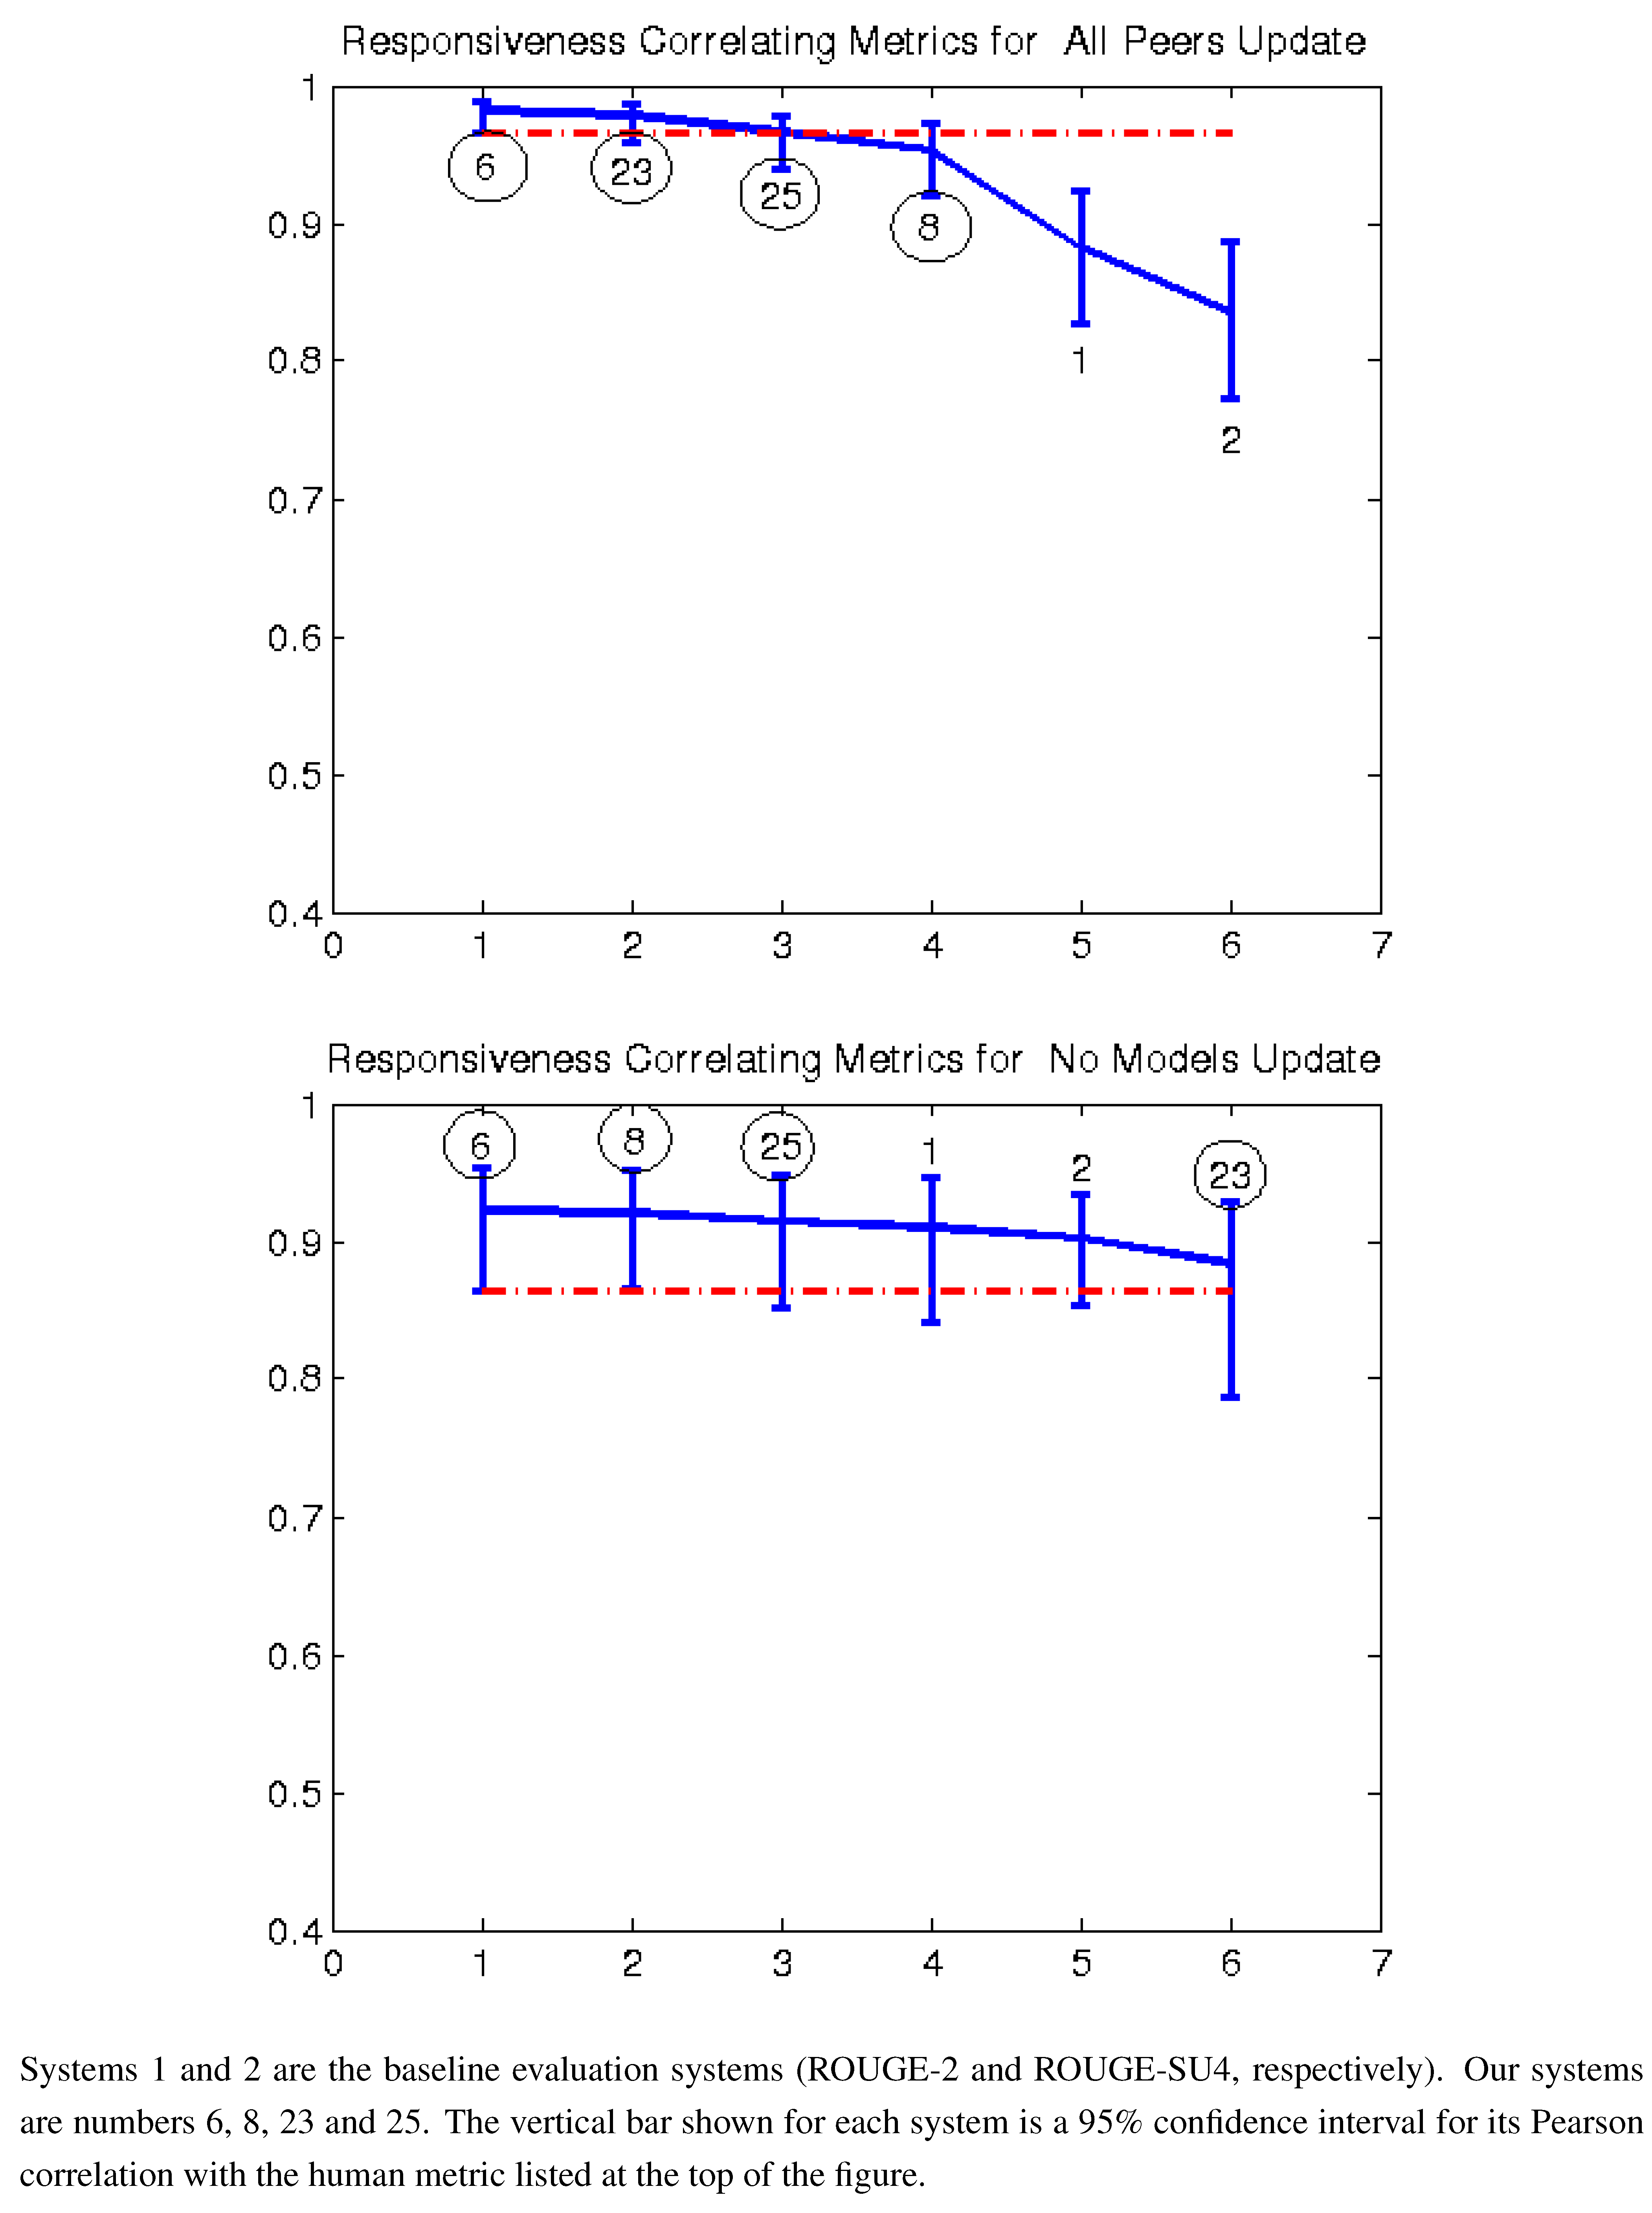
Figure 7 give the Pearson correlation against overall responsiveness, pyramid scoring, and readability for the 2011 update summary tasks for the top 14 performing AESOP submissions (out of 25 total evaluation metrics). Our metrics are usually stronger for the update tasks, but in general, all of our submissions were among the top performers. We note that as indicated by the error bars, many of the best performing systems, including a number of our metrics, significantly outperformed the baselines of the three ROUGE methods in the “all peers” task. On the other hand, while ROUGE is not the best for the no models data, it is always within the 95% confidence interval of the best metric.
Figure 6.
The performance of our System 25 at TAC 2011.
Figure 6.
The performance of our System 25 at TAC 2011.
Figure 7.
Pearson correlation with responsiveness top 14 AESOP metrics all peers and no models (2011).
Figure 7.
Pearson correlation with responsiveness top 14 AESOP metrics all peers and no models (2011).
For the update summaries (
Figure 7,
Figure 2 and
Figure 3), there was no clear winner among our systems. Each of our four submissions was at least once our best system. System 6 (non-negative least squares model aimed at predicting responsiveness) seems to be our best for predicting the quality of machine summaries alone, and was the overall best in predicting responsiveness and pyramid for that subset. However, system 6 was twice our worst for evaluating the humans and machines together. Oliveira’s system 4 (VERT-F) was the best at predicting readability in the tasks with and without human summaries, and Giannakopoulos’ system 18 did the best at predicting responsiveness when the humans were included. Perhaps most impressively, all four of our systems (6, 8, 23 and 25) were among the top six performers (out of 25) for predicting any of the three metrics with human summaries included (
i.e., the “all peers” task).
In order to further validate our results, we applied our sixteen tuned models to the TAC 2008 summarization data. Of our TAC 2008–2011 data, 2008 is the only other year (besides 2011) that our models did not use for training. The limitation of the 2008 data is that AESOP was not run that year, so the only systems we can compare to are the ROUGE variations.
Figure 4,
Figure 8 and
Figure 9 show the results of these comparisons. As with 2011, our methods always outperform ROUGE in the “all peers” task, and in several cases, the differences are statistically significant. The results from the “no models” task are also similar to 2011, with our methods generally performing better than ROUGE, but not significantly so.
Figure 8.
Pearson correlation with pyramid all peers and no models (2008).
Figure 8.
Pearson correlation with pyramid all peers and no models (2008).
Figure 9.
Pearson correlation with readability all peers and no models (2008).
Figure 9.
Pearson correlation with readability all peers and no models (2008).
Baselines: Systems 1–3 are the baseline metrics and are all variants of ROUGE. In particular:
Baseline 1: ROUGE-2, with stemming and keeping stop words.
Baseline 2: ROUGE-SU4, with stemming and keeping stop words.
Baseline 3: Basic Elements (BE). Summaries were parsed with Minipar, and BEs were extracted and matched using the Head-Modifier criterion.
7. Conclusions and Future Work
We have demonstrated a family of metrics for estimating the quality of a text summary. The metrics are built from features which were chosen based on their correlation with human metrics. Our metrics have consistently performed very well at the Text Analysis Conference, with all four ending up in the top six or seven systems for several tasks. In particular, many of our metrics did significantly better than ROUGE in each of the “all peers” tasks (in 2008 and 2011).
At the recent 2011 INEX workshop, Tavernier and Bellot [
21] reported the use of linguistic measures for the Tweet summarization task and found significant correlation with human judgment. In the future, such measures should be investigated as possible features for AESOP evaluation of linguistic quality. In addition, there are many other features we would like to consider for future use in AESOP, including the number of anaphora and other referential objects in a sentence. Also, many of our current features could potentially be improved with normalization and other minor adjustments.
Another avenue for future work is to optimize our models for Spearman or Kendall correlation. One way we have considered doing this is by employing a learning-to-rank method, possibly as a support vector machine.


 , where resid is the vector of residuals from the previous iteration, tune is a tuning constant that is divided into the residual vector before computing weights, h is the vector of leverage values from a least-squares fit, and s is an estimate of the standard deviation of the error term given by
  . Here MAD is the median absolute deviation of the residuals from their median. The constant 0.6745 makes the estimate unbiased for the normal distribution. If there are p columns in A, the smallest p absolute deviations are excluded when computing the median.


 is called the first canonical correlation between A and B.