1. Introduction
The research on multisensor networks has increased significantly in the last 10 years, defining the Internet of Things (IoT) concept. These networks typically include cameras, indoor location systems (ILS), microphones, wearable sensors, etc. Using the information from sensors, computer-based systems can adapt their behaviors to the context conditions (increasing their intelligence) or they can report important information to the user (difficult to obtain through other means). Thanks to the increment of sensor neural networks, the number of possible research areas has also increased rapidly. One of these areas is psycho-motor training where an automatic system senses a psychical activity carried out by a person and provides feedback about the performance. When developing a fully automatic system for evaluating motor activities, one important aspect is to segment and recognize the different activities in order to focus the system analysis on some specific ones. This process must be carried out by a Human Activity Recognition (HAR) system. The recognition of human activities has received a lot of attention in the last five years due to the high number of promising applications and the increasing interest shown by government and commercial organizations.
This paper proposes a user adaptation technique for improving a HAR system based on Hidden Markov Models (HMMs). This system segments and recognizes six different physical activities (walking, walking upstairs, walking downstairs, sitting, standing and lying down) using inertial signals from a smartphone. This paper is organized as follows.
Section 2 presents the state of the art.
Section 3 shows an overview of the HMMs-based HAR system, describing the main modules.
Section 4 describes the user Maximum A Posteriori (MAP) adaptation.
Section 5 presents the experiments carried out in this work, including a detailed description of the dataset used in the experiments. The main discussions and conclusions are summarized in
Section 6.
2. Background
HAR systems can be categorized according to the sensor type or the machine learning algorithm. According to the sensor type, it is possible to consider various types of sensors: on-body, object-placed or ambient sensors. On example of environment sensors is video cameras in monitoring areas [
1,
2]. Human activity can be also analyzed based on a rich variety of acoustic events. The determination of both the identity of sounds and their position in time may help to detect and describe that human activity [
3]. Most environment sensors require an important infrastructure support: for example, the installation of video cameras in the monitoring areas. Additionally, people not always spend all their time in the same environment. In this respect, environmental sensors are limited by their infrastructure and cannot provide monitoring outside the specific environment. This limitation can be overtaken using on-body sensors [
4,
5]. Body-worn sensors add new possibilities to the human monitoring system [
6]: not only by being able to measure body signals (e.g., physiological, motion, location) but also by providing portable and off-site user supervision at any location without the need of fixed infrastructure. In the literature there are different approaches for locating motion sensors in different body parts such as the waist, wrist, chest and thighs achieving good classification performance [
7,
8,
9]. In [
10], a chest-mounted accelerometer was used for classifying five Activities of Daily Living (ADL). However, the use of body sensors has important limitations such as the user’s discomfort while wearing them (these sensors are usually uncomfortable for the common user) and energy-limited mobile devices (they do not provide a long-term solution for activity monitoring).
In recent years, smartphones and smartwatches have become widespread, increasing the number of possibilities for human-centered applications. These devices include embedded built-in sensors such as microphones, dual cameras, accelerometers, gyroscopes, etc. The inertial sensors are a very interesting for monitoring ADL. These devices have important advantages [
11,
12]: easy device portability, unobtrusive sensing provided by the embedded sensors and the processing power of new smartphones that allow online computation. Because of this, some works focused on HAR using smartphones have been developed [
13,
14,
15,
16,
17].
HAR is a machine learning problem, where a system extracts features from sensor signals, generates a model for each activity, and classifies the next activities based on these models. In the literature, different machine learning solutions have been applied to the recognition of activities including Naive Bayes [
18], Decision Trees [
19], and Support Vector Machines (SVMs) [
20]. In many works, several approaches are compared: for example, Yang [
21] uses the WEKA learning toolkit to compare the accuracy rates of several machine learning approaches: C4.5 Decision Trees, Naïve Bayes, k-Nearest Neighbor, and Support Vector Machines. In [
13], three learning algorithms were evaluated: Logistic Regression, J48, and Multilayer Perceptron. Hidden Markov Models is a successful modeling strategy for classifying temporal sequences. HMMs offer dynamic time warping, have clear Bayesian semantics and well-understood training algorithms. HMMs are very robust against degradation, giving the possibility to be trained on one person and to be tested on another. In the last five years, there has been an increase in the number of HAR systems based on HMMs for modeling inertial signals (
Table 1).
According to
Table 1, this work is the first one (known by the authors) that proposes a user adaptation technique for improving the performance of a HMMs-based HAR system. In the literature there are some references proposing other user adaptation techniques: a semi-supervised method [
27] or a Multi-Classifier Adaptive-Training (MCAT) algorithm [
28]. The MCAT algorithm consists of using a meta-classifier for combining several pattern recognition methods. This meta-classifier is trained with user-dependent adaptation data to improve the results for a specific user.
3. HAR System Overview
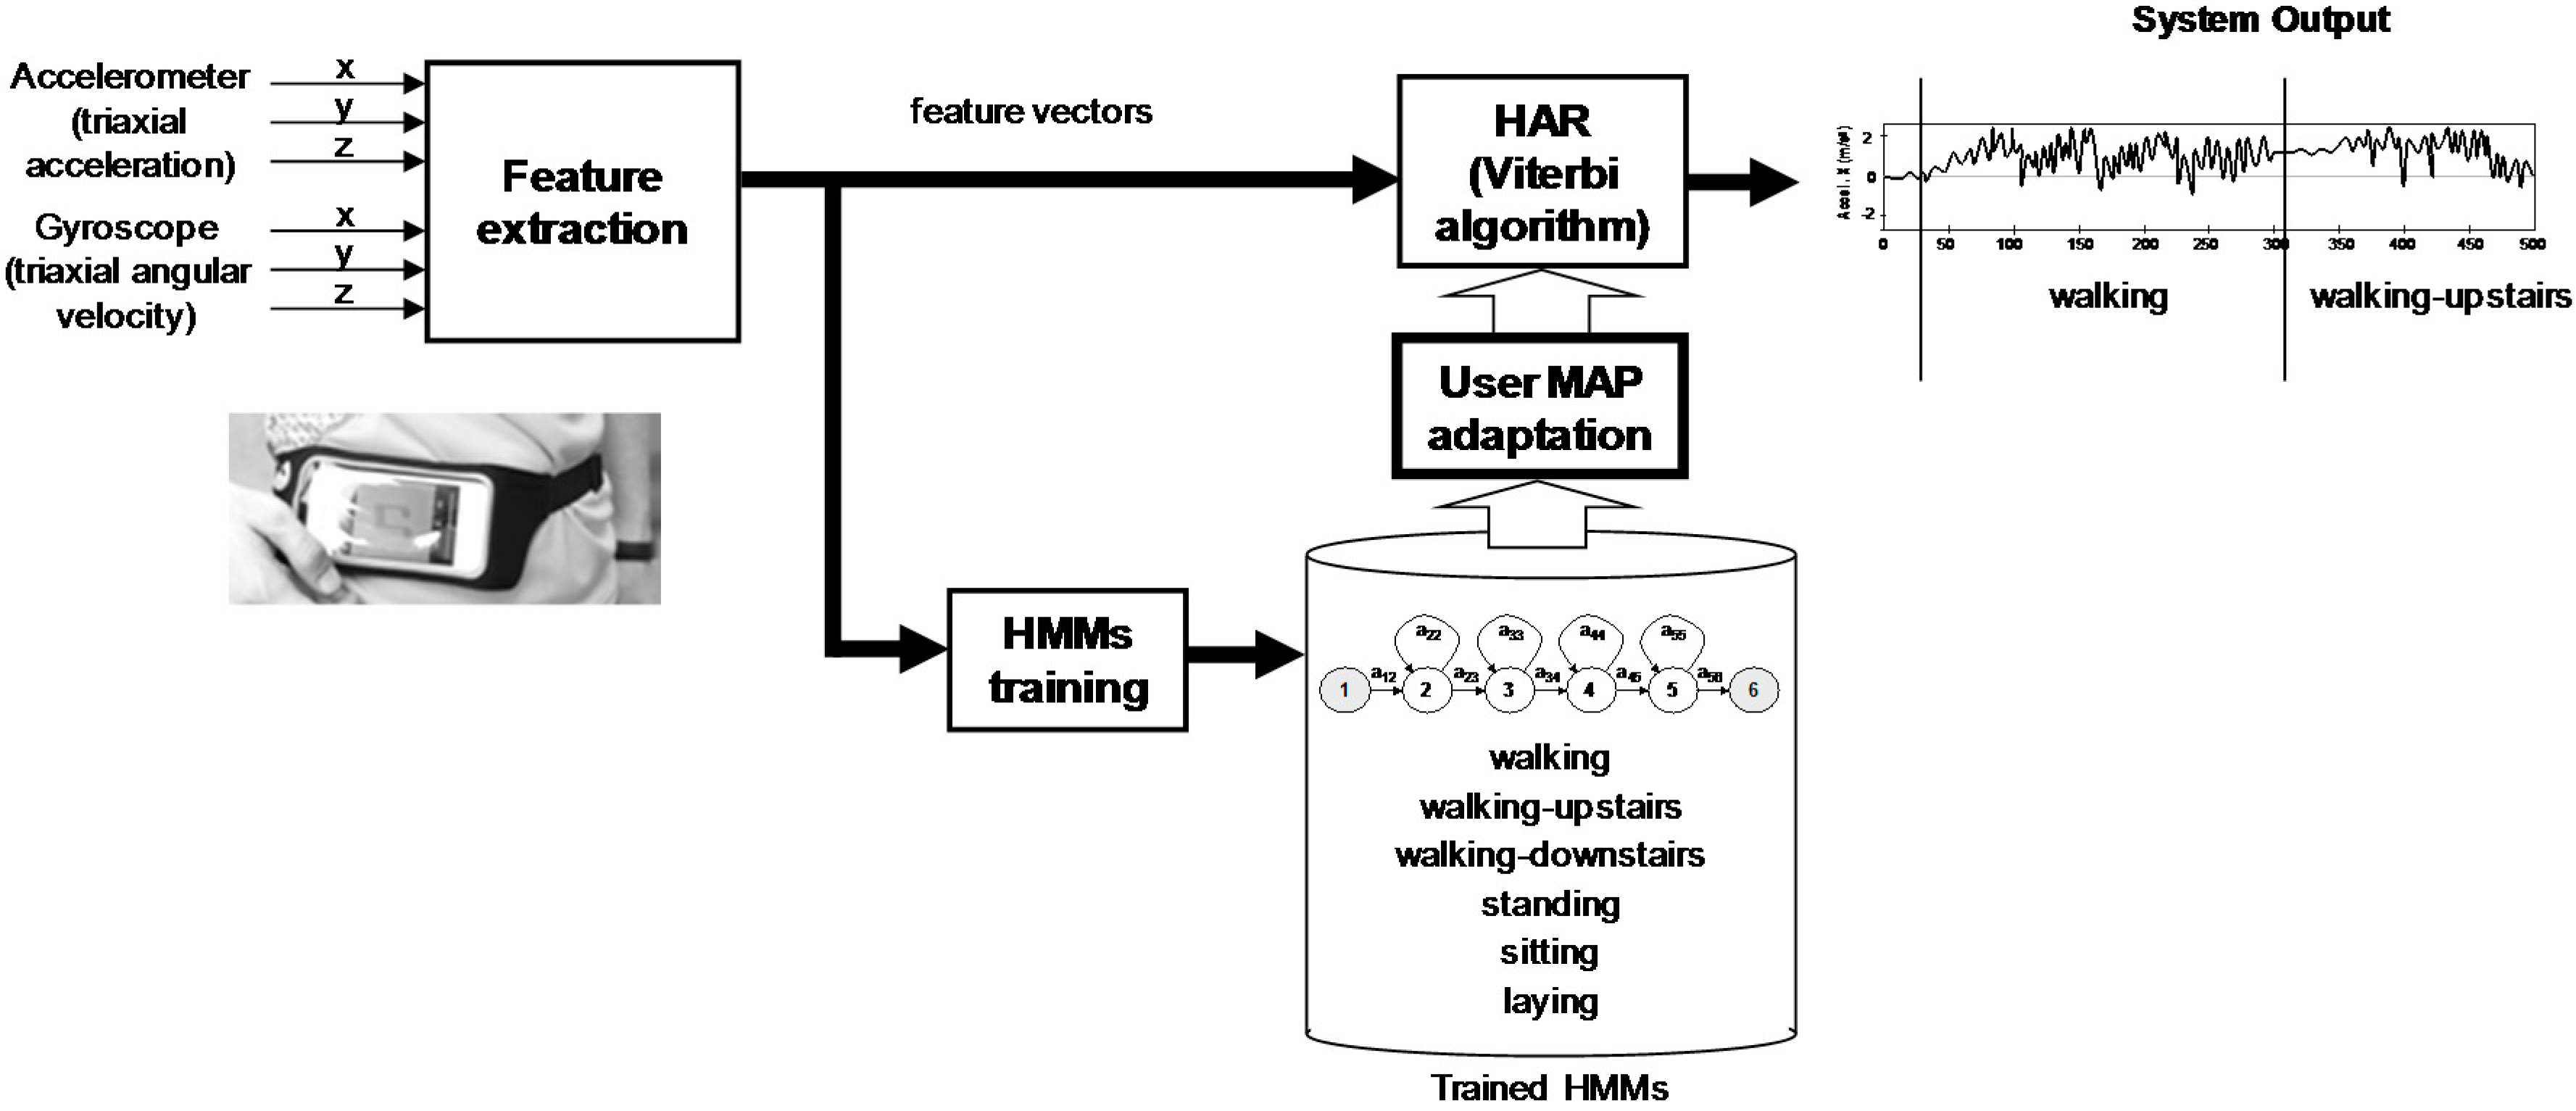
Figure 1 shows the general system architecture presented in [
17], including an additional module for user MAP adaptation. The system is made up of four main modules: feature extraction, HMMs training, HMMs adaptation and activity recognition/segmentation. The main contributions of this paper are focused on HMMs training and adaptation modules. In order to consider only the influence of the HMMs in the results, the Activity Sequence Model (ASM) proposed in [
17] has been deactivated in this work.
The feature extraction module obtains the accelerometer and gyroscope signals, samples them with a sampling rate of 50 Hz and filters them for noise reduction (with a 20 Hz cut-off frequency). This sampling rate is sufficient for capturing human body motion: more than 95% of its energy is contained below 15 Hz [
5]. Using a Butterworth low-pass filter (with a 0.3 Hz cut-off frequency), the sensor acceleration signals are divided into body acceleration and gravity. The Euclidean magnitude and time derivatives (jerk da/dt and angular acceleration dw/dt) are also obtained during the feature extraction process.
The sample sequences are grouped together in frames: fixed-width sliding windows of 2.56 s and 50% overlap (128 samples per frame with an overlap of 64 samples). From each frame, the system obtains a feature vector computing measures from the inertial signals. These features are traditional measures such as the mean, correlation, signal magnitude area (SMA) and auto regression coefficients [
29]. This vector has been extended including more features from time and frequency domains generating a vector with a total of 561 features. The dataset used in this work (available at the UCI Machine Learning Repository) includes the already-computed feature vectors. For comparison, this work uses the same features proposed in [
30]. The set of features computed from the time domain are mean, standard deviation, median absolute deviation, max, min, magnitude, energy, interquartile range, entropy, autoregression coefficients with the Burg order equal to 4, and the correlation coefficient between different axis. The set of features obtained from the frequency domain includes additional ones such as the index of the frequency component with the largest magnitude, the weighted average of the frequency components, skewness, kurtosis and the energy in 64 bins covering the whole signal frequency range.
For HMMs development, we used the HTK toolkit [
31]. This toolkit allows us to train the HMMs, adapt them to a new user, and recognize new activities using these HMMs. In the HAR used in this work, six HMMs are considered, one for every activity. Every model represents the sequence of observed feature vectors corresponding to each activity. Given a vector sequence, it is compared to all the models, computing their likelihood. The model with the highest likelihood is the activity recognized. A HMM can be seen as a finite state machine in which all the states can change every time unit
t. Every state
j generates a feature vector
Ot considering a probability density
bj(
Ot). There is also a probability to control transitions between states. For example, the transition between state
i a state
j can be governed by the discrete probability
aij.
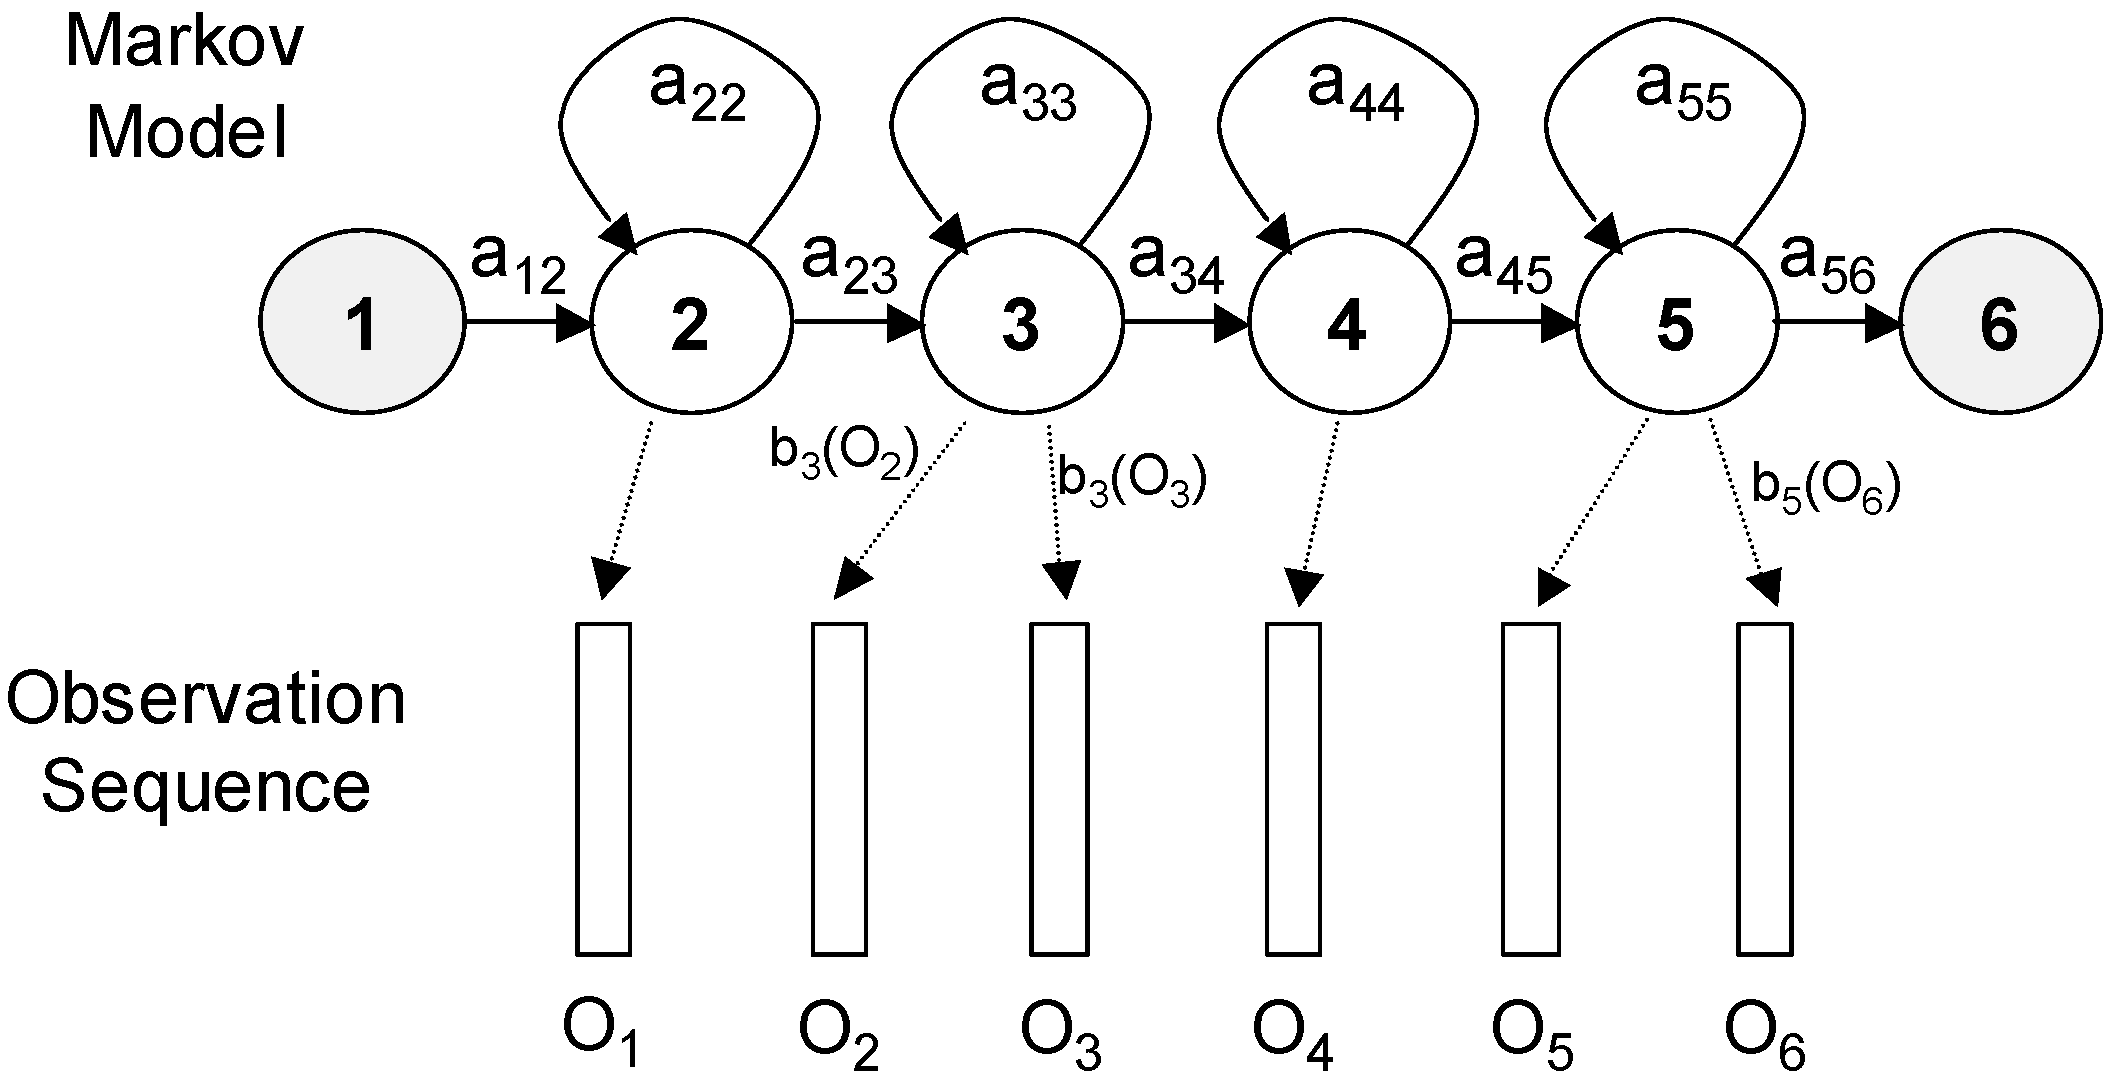
Figure 2 represents a HMM with six states, associated with a sequence of six observations
O1 to
O6. In HTK, the entry and exit states of a HMM are non-emitting. This is to facilitate the construction of composite models (out of the scope of this paper). The association between the observed vector and states is
X = 1; 2; 3; 3; 4; 5; 5; 6.
The joint probability that
O is generated by the model
M moving through the state sequence
X is calculated simply as the product of the transition probabilities and the output probabilities:
In a real application, only the observation sequence O is known and the underlying state sequence
X is hidden. In this case, the required likelihood is computed by considering only the most likely state sequence. The main parameters of every model are
aij and
bj(
Ot). The output distribution
bj(
Ot) can be modeled by using Gaussian mixtures, reducing the model parameters to the mean and variance of every Gaussian distribution. The model parameters can be determined automatically through a robust and efficient re-estimation procedure (estimation maximization, EM) considering a set of training examples corresponding to a particular activity:
- (1)
Initialize all Gaussian distributions with the mean and variance computed throughout the whole dataset.
- (2)
Calculate the forward and backward probabilities for all states j and times t.
- (3)
For each state j and time t, use the probability Lj(t) and the current observation vector Ot to update the accumulators for that state.
- (4)
Use the final accumulator values to calculate new parameter values.
- (5)
If the value of P = P(O/M) for this iteration is not higher than the value at the previous iteration, then stop; otherwise, repeat the aforementioned steps using the new re-estimated parameter values (from step 2).
In the estimation maximization (EM) algorithm, the main target is to maximize the likelihood of an activity respect to its HMM: Maximum Likelihood Estimation (MLE). In some applications, it is possible to consider a discriminative training procedure. In this procedure, the main target is to maximize the differences between models. The HTK toolkit includes a tool for training HMMs in a discriminative way. In this work, the Maximum Mutual Information Estimation (MMIE) discriminative procedure has also been evaluated [
32]. In this procedure, the main difference compared to MLE is the objective function to be optimized. In the case of the MMIE, the function to maximize is:
The first term in the numerator is identical to the objective function for the MLE. In order to maximize Equation (2), the numerator must be increased while the denominator is decreased. Similar to the MLE, the MMIE has the target to maximize the likelihood of each observation given by the training sequences. In addition, the MMIE has a denominator term that can be reduced by decreasing the probabilities of other possible activity sequences. In conclusion, the MMIE attempts make the correct hypothesis more probable, and at the same time, it tries to make incorrect hypotheses less probable.
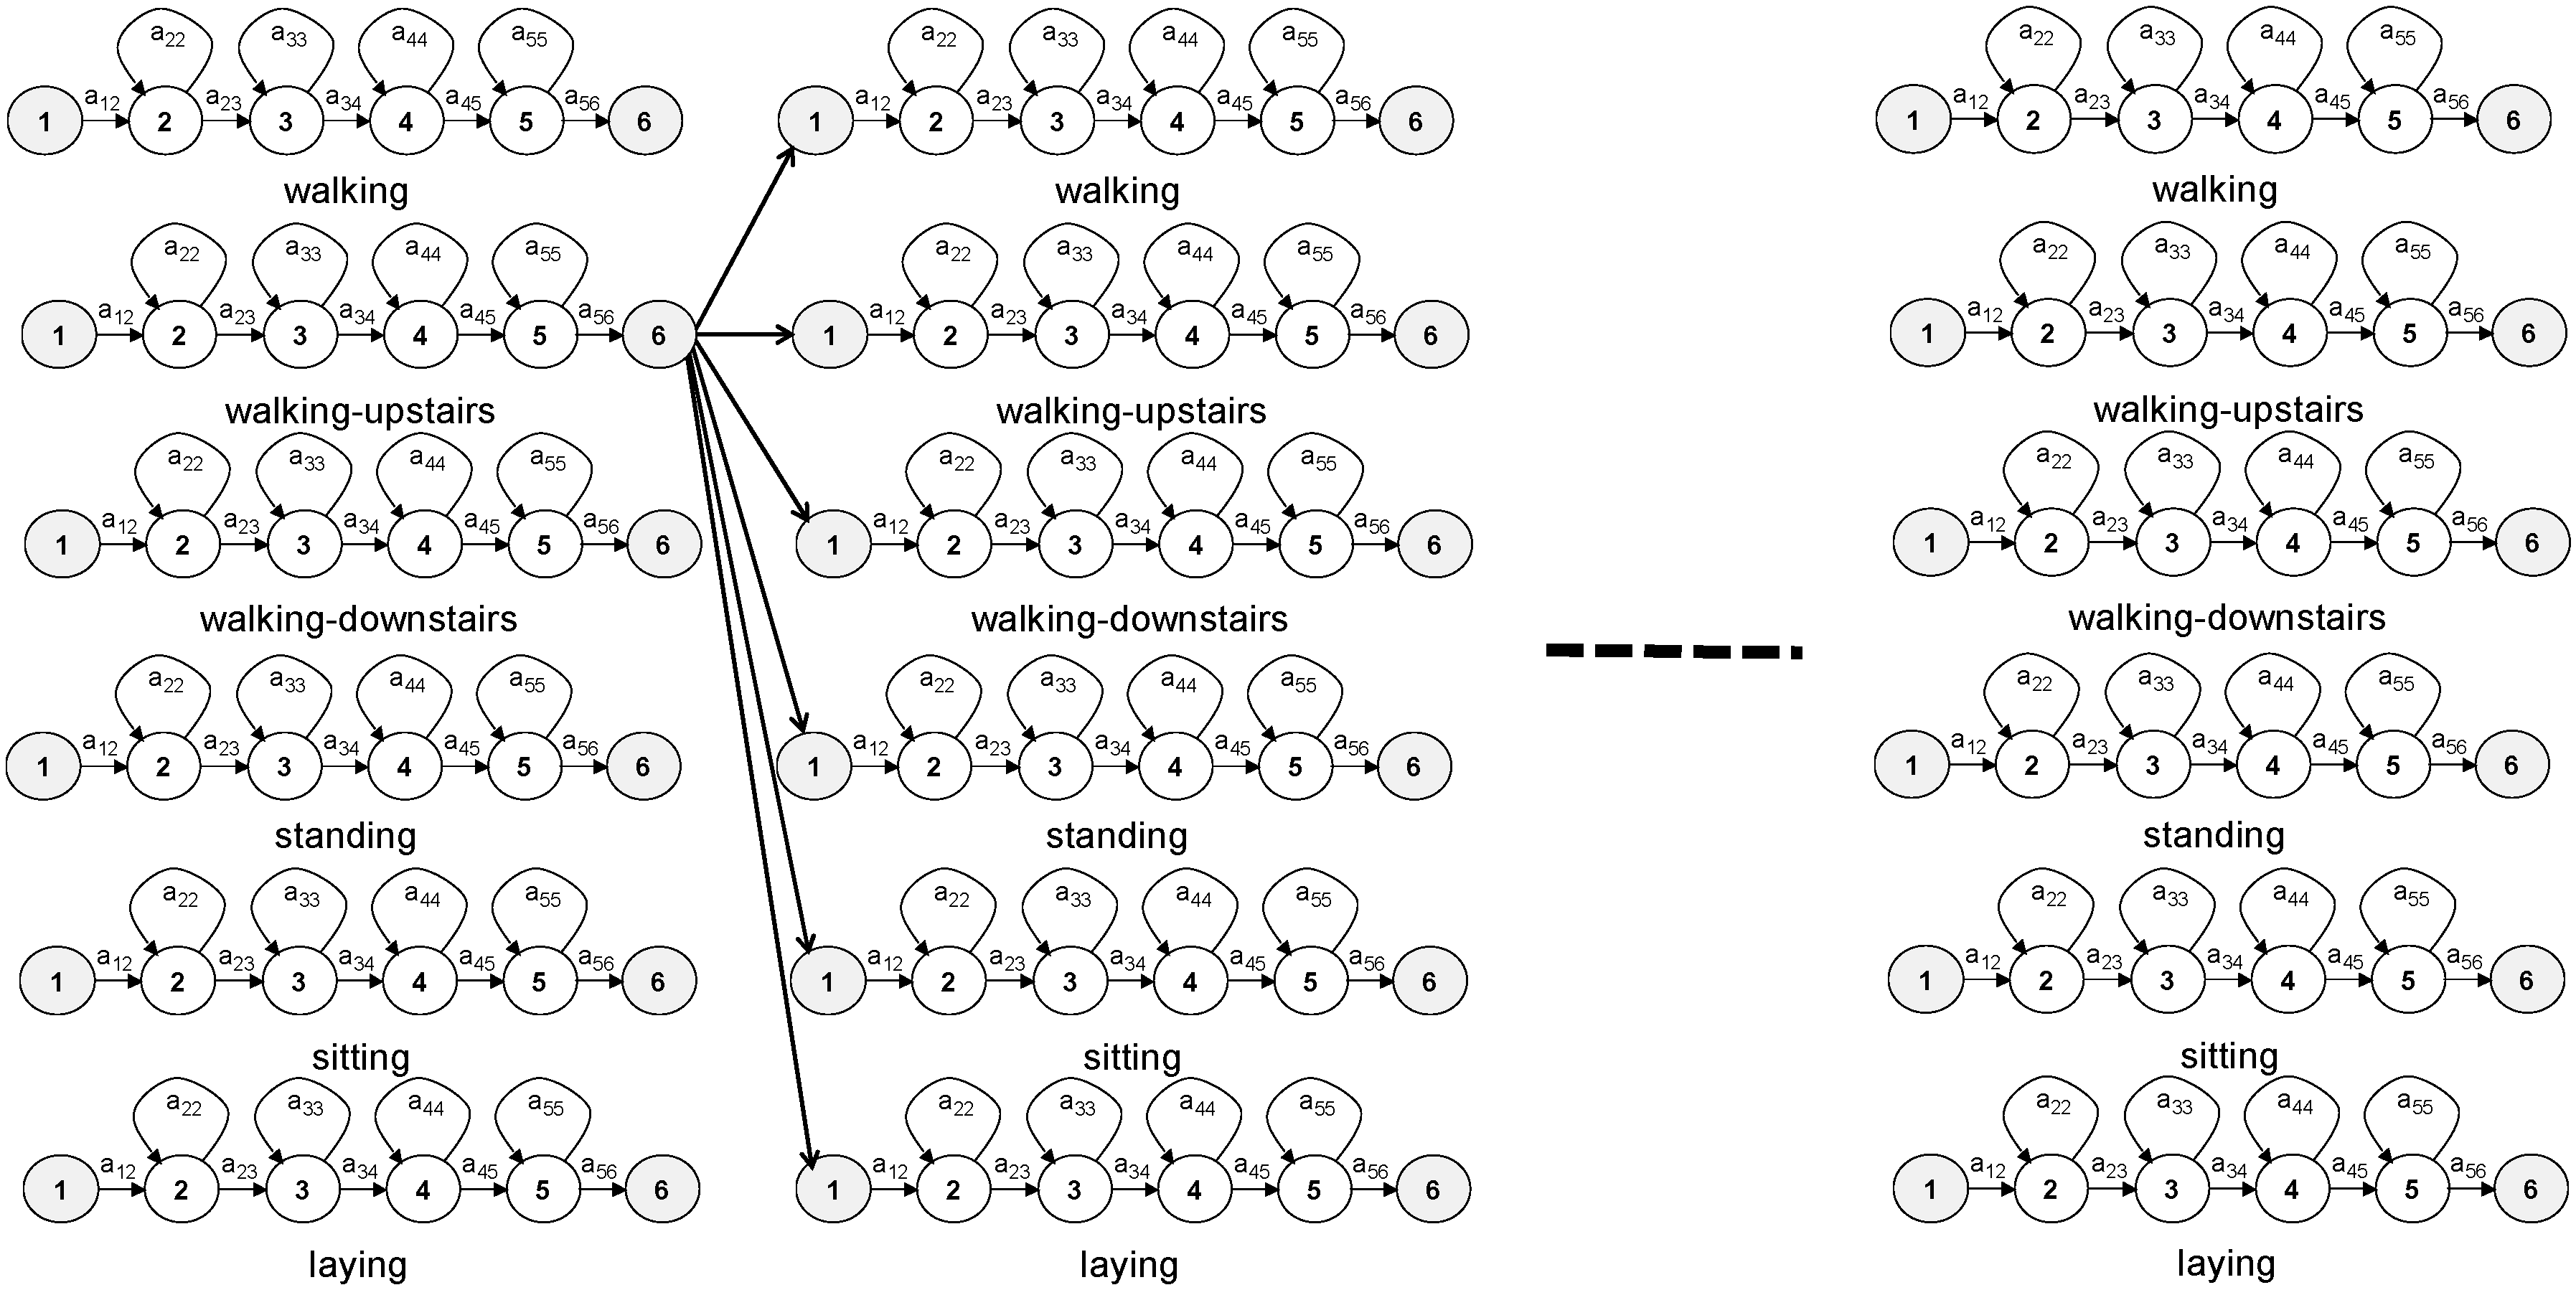
Continuous activity recognition and segmentation involves connecting several HMMs in sequence. In the HTK toolkit, the Viterbi algorithm is expanded to allow several models to be connected in the search space: the last state of every model is connected with the first state of all models (
Figure 3). Each model in the sequence corresponds directly to its activity.
4. User Maximum A Posteriori Adaptation
In order to generate activity HMMs adapted to every user, the system trains general activity HMMs including information from all users. After training these general models, user-adapted activity HMMs are generated by adapting the general models to every user via a Maximum A Posteriori approach (sometimes referred to as Bayesian adaptation). MAP adaptation needs prior knowledge about the model parameter distribution (original HMMs). For MAP adaptation purposes, the informative priors that are generally used are the user-independent model parameters. The updated formula for the
μ parameter of mixture component
m is:
The estimated
μm is a linear combination of the
μ parameter of mixture component
m in the original model (
μgeneral·m) and the
μ parameter of mixture component
m obtained considering only observation vectors from the user (
μUSER·m).
MU is the adaptation coefficient that defines the weighting of user-dependent information compared to general HMMs.
Nm is the occupation likelihood of the adaptation data (from the user) along the
T frames, defined as:
After training the adapted activity HMMs for every user, the activity recognition and segmentation process is the same as the method used with user-independent HMMs: the process consists of computing the likelihood of the best model sequence when generating several activities.
5. Experiments Carried out in This Work
This section describes the dataset used in the experiments, the baseline results considering the training algorithms (MLE and MMIE), the user adaptation experiments, and at the end, the final results with a discussion.
5.1. Dataset Used in the Experiments
This work has been carried out using a public dataset available at the UCI Machine Learning Repository: the Human Activity Recognition Using Smartphones Data Set [
30]. This dataset contains inertial information (from smartphone sensors: accelerometer and gyroscope) recorded from a group of 30 people (from 19 to 48 years old), performing six different physical activities several times. These activities are walking, walking upstairs, walking downstairs, sitting, standing and lying down. While performing these activities, every user carried a smartphone (Samsung Galaxy S II) for recording the inertial signals. These signals consisted of the three-axial linear acceleration and the three-axial angular velocity being sampled at a constant rate of 50 Hz. The dataset contains 13,182 s of recording including 400 activity instances from 30 users. An example of the recording process can be seen in a video [
33].
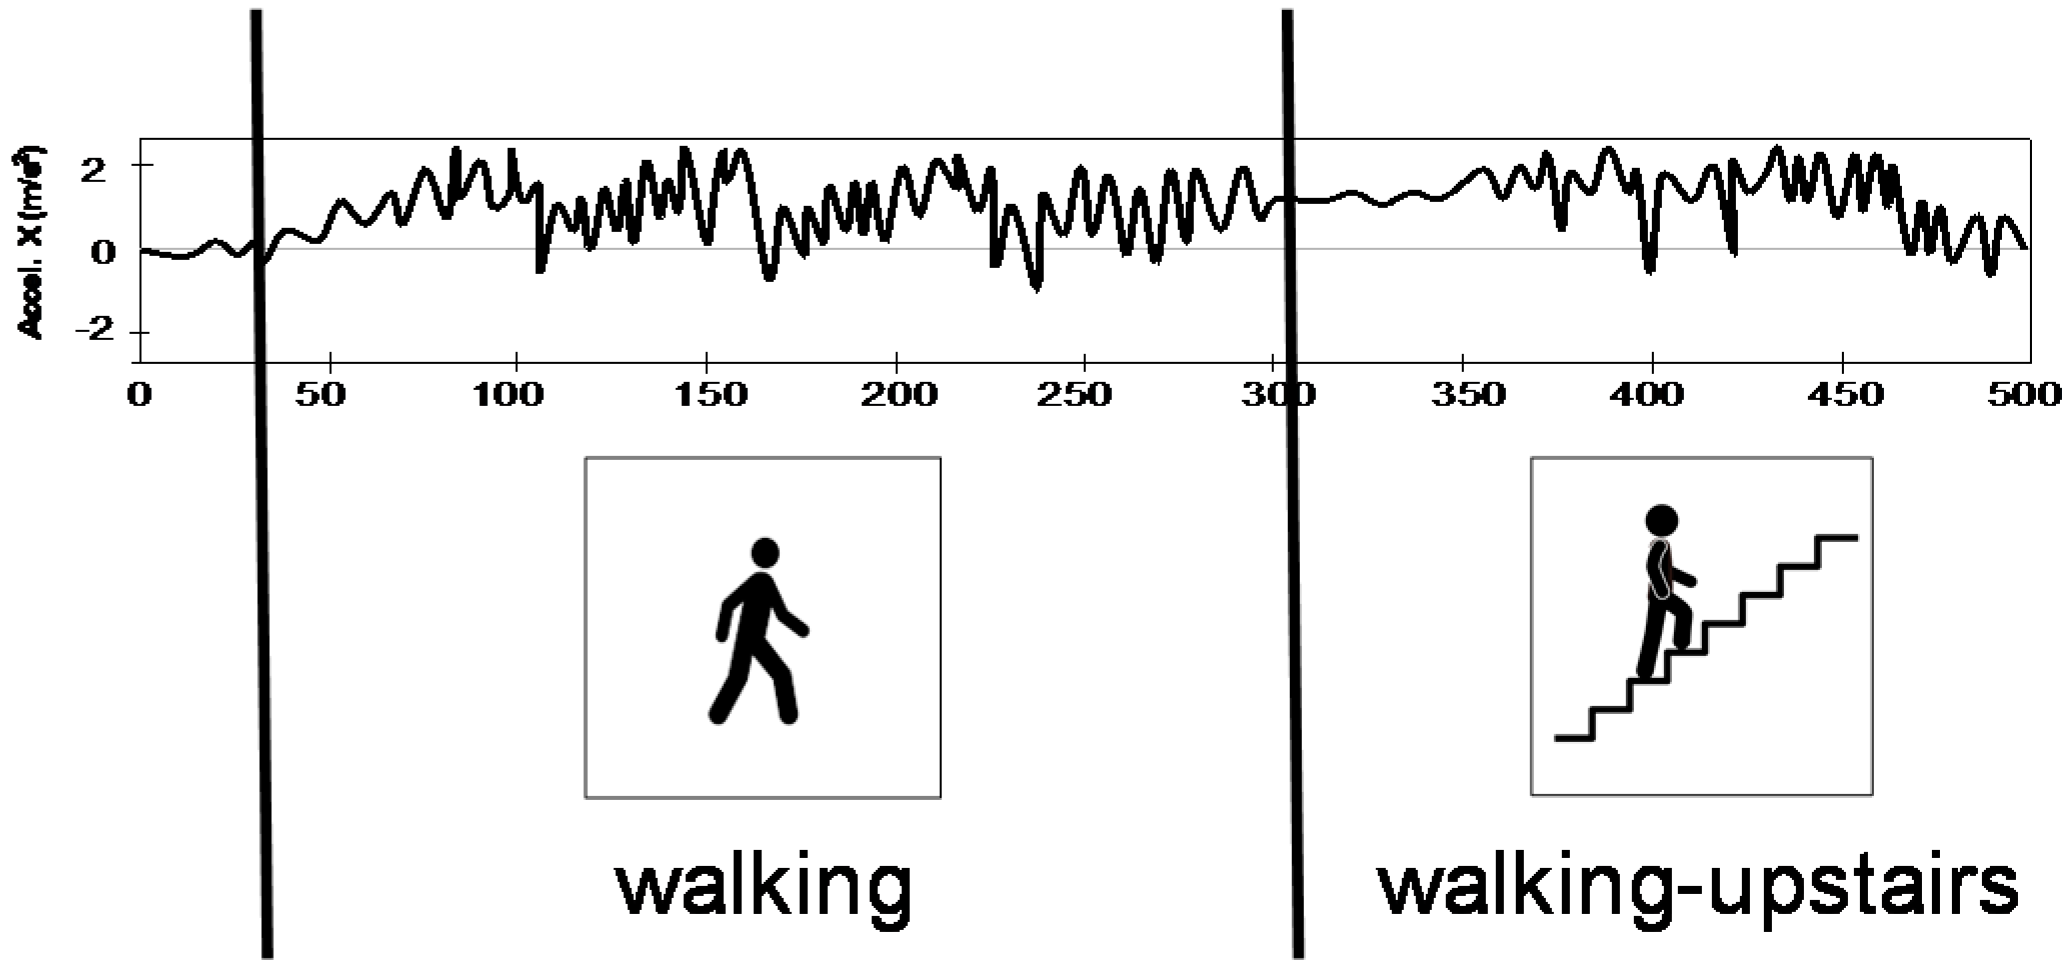
In this work, the main aim is to recognize the activity sequence carried by every user. For this evaluation, all activities carried out from the same user have been stored in the same file, defining a recording session. There are 30 sessions with an average number of 13.3 activities per session. The problem to solve in this paper consists of recognizing and segmenting all physical activities recorded in the same session (
Figure 4). In the initial configuration of the dataset, it was divided in two sets, and 70% of the users were selected for training and 30% for testing the system. In this work, the 30 sessions have been randomly divided into six subsets. Every session includes all activities carried out by the same user, so all activities from the same user are included in the same subset. This characteristic avoids the person-dependent characteristic being influenced by the activity recognition or segmentation. In order to improve the significance of the results, a six-fold cross-validation procedure has been carried out. The cross-validation procedure uses four subsets for training the activity Hidden Markov Models (HMMs), one for validation (tuning the system parameters) and one for testing. This configuration has been repeated six times in a round-robin strategy. The results presented in this paper are average values obtained throughout the six-fold cross-validation procedure. In every experiment, the system is evaluated with all sessions (13,182 s) (defining a 95% confidence interval of ±0.4%). In
Section 5.2 and
Section 5.3, only the validation results were considered for tuning the adaptation coefficient and selecting the training procedure. The final results are presented in
Section 5.4 with the testing subsets, using the best system configuration.
Regarding the evaluation metrics, in this work we considered the Activity Recognition Error Rate (ARER): the percentage of time that has been wrongly assigned to an activity (Equation (5)).
In addition to this measure, other possible metrics are precision and recall. The precision is the time correctly assigned to this activity (true positive) divided by the activity time detected by the system (including true and false positive times). Recall is defined as the time correctly assigned (true positive) divided by the actual duration of the activity. As it was shown in [
17], there is an important correlation between these three measures. Because of this, ARER will be considered for system development, and in the final experiments, all metrics will be provided for comparison with further works.
5.2. Baseline Experiments Considering Different Training Algorithms
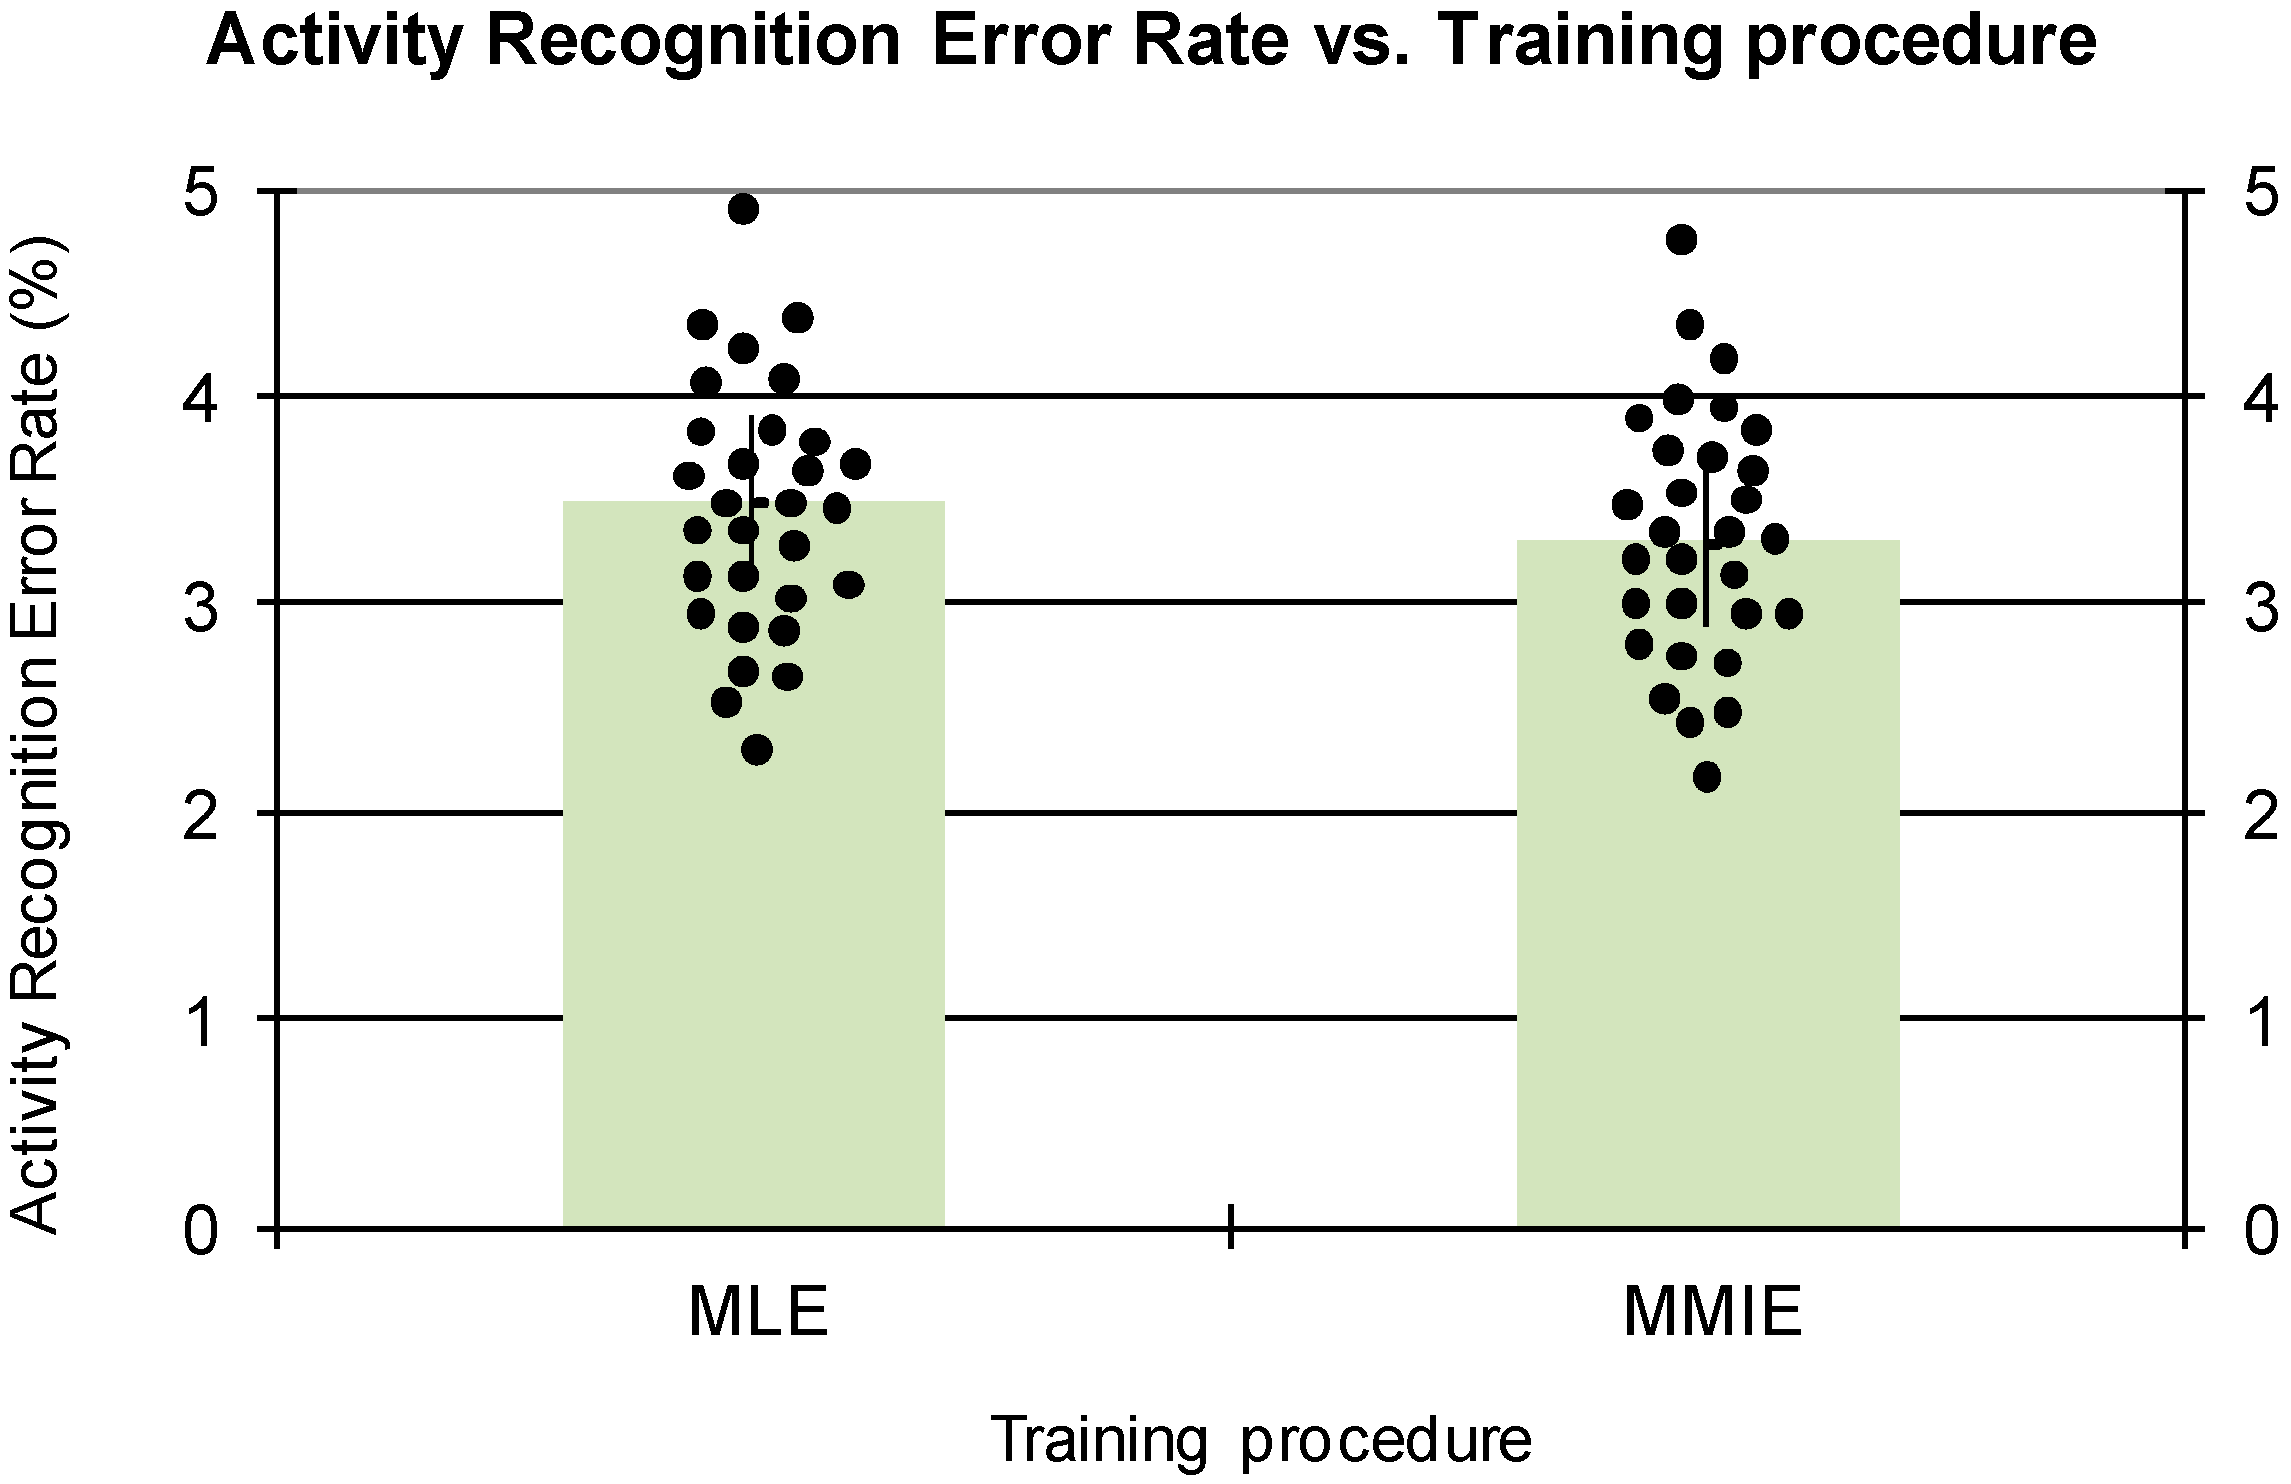
Figure 5 represents the ARER depending on the training procedure. As it is shown, the discriminative training strategy (MMIE) obtains slightly better results, although the differences are not statistically significant. For the next experiments, the MMIE strategy has been considered. In this task, the system is able to distinguish between static and dynamic activities, but the confusion between static activities (standing, sitting and lying down) is very high. A similar behavior occurs for the dynamic activities of walking, walking upstairs and walking downstairs.
Figure 5 also includes the error points for all the subjects using the representation method proposed in [
34]. Regarding the ARER distributions, both training procedures show very similar behaviors.
5.3. User Adaptation Experiments
For the user adaptation experiments, all user sessions used for testing the system are randomly divided into two sub-sessions including 50% of the activities each. The average duration of an activity is 440 s. The first sub-session is used for adapting the HMMs to the user and the second sub-session is used for testing the system. There is not any overlap between these two sub-sessions. It is important to remark that the sub-session used for testing is the same along all the experiments to allow a fair comparison.
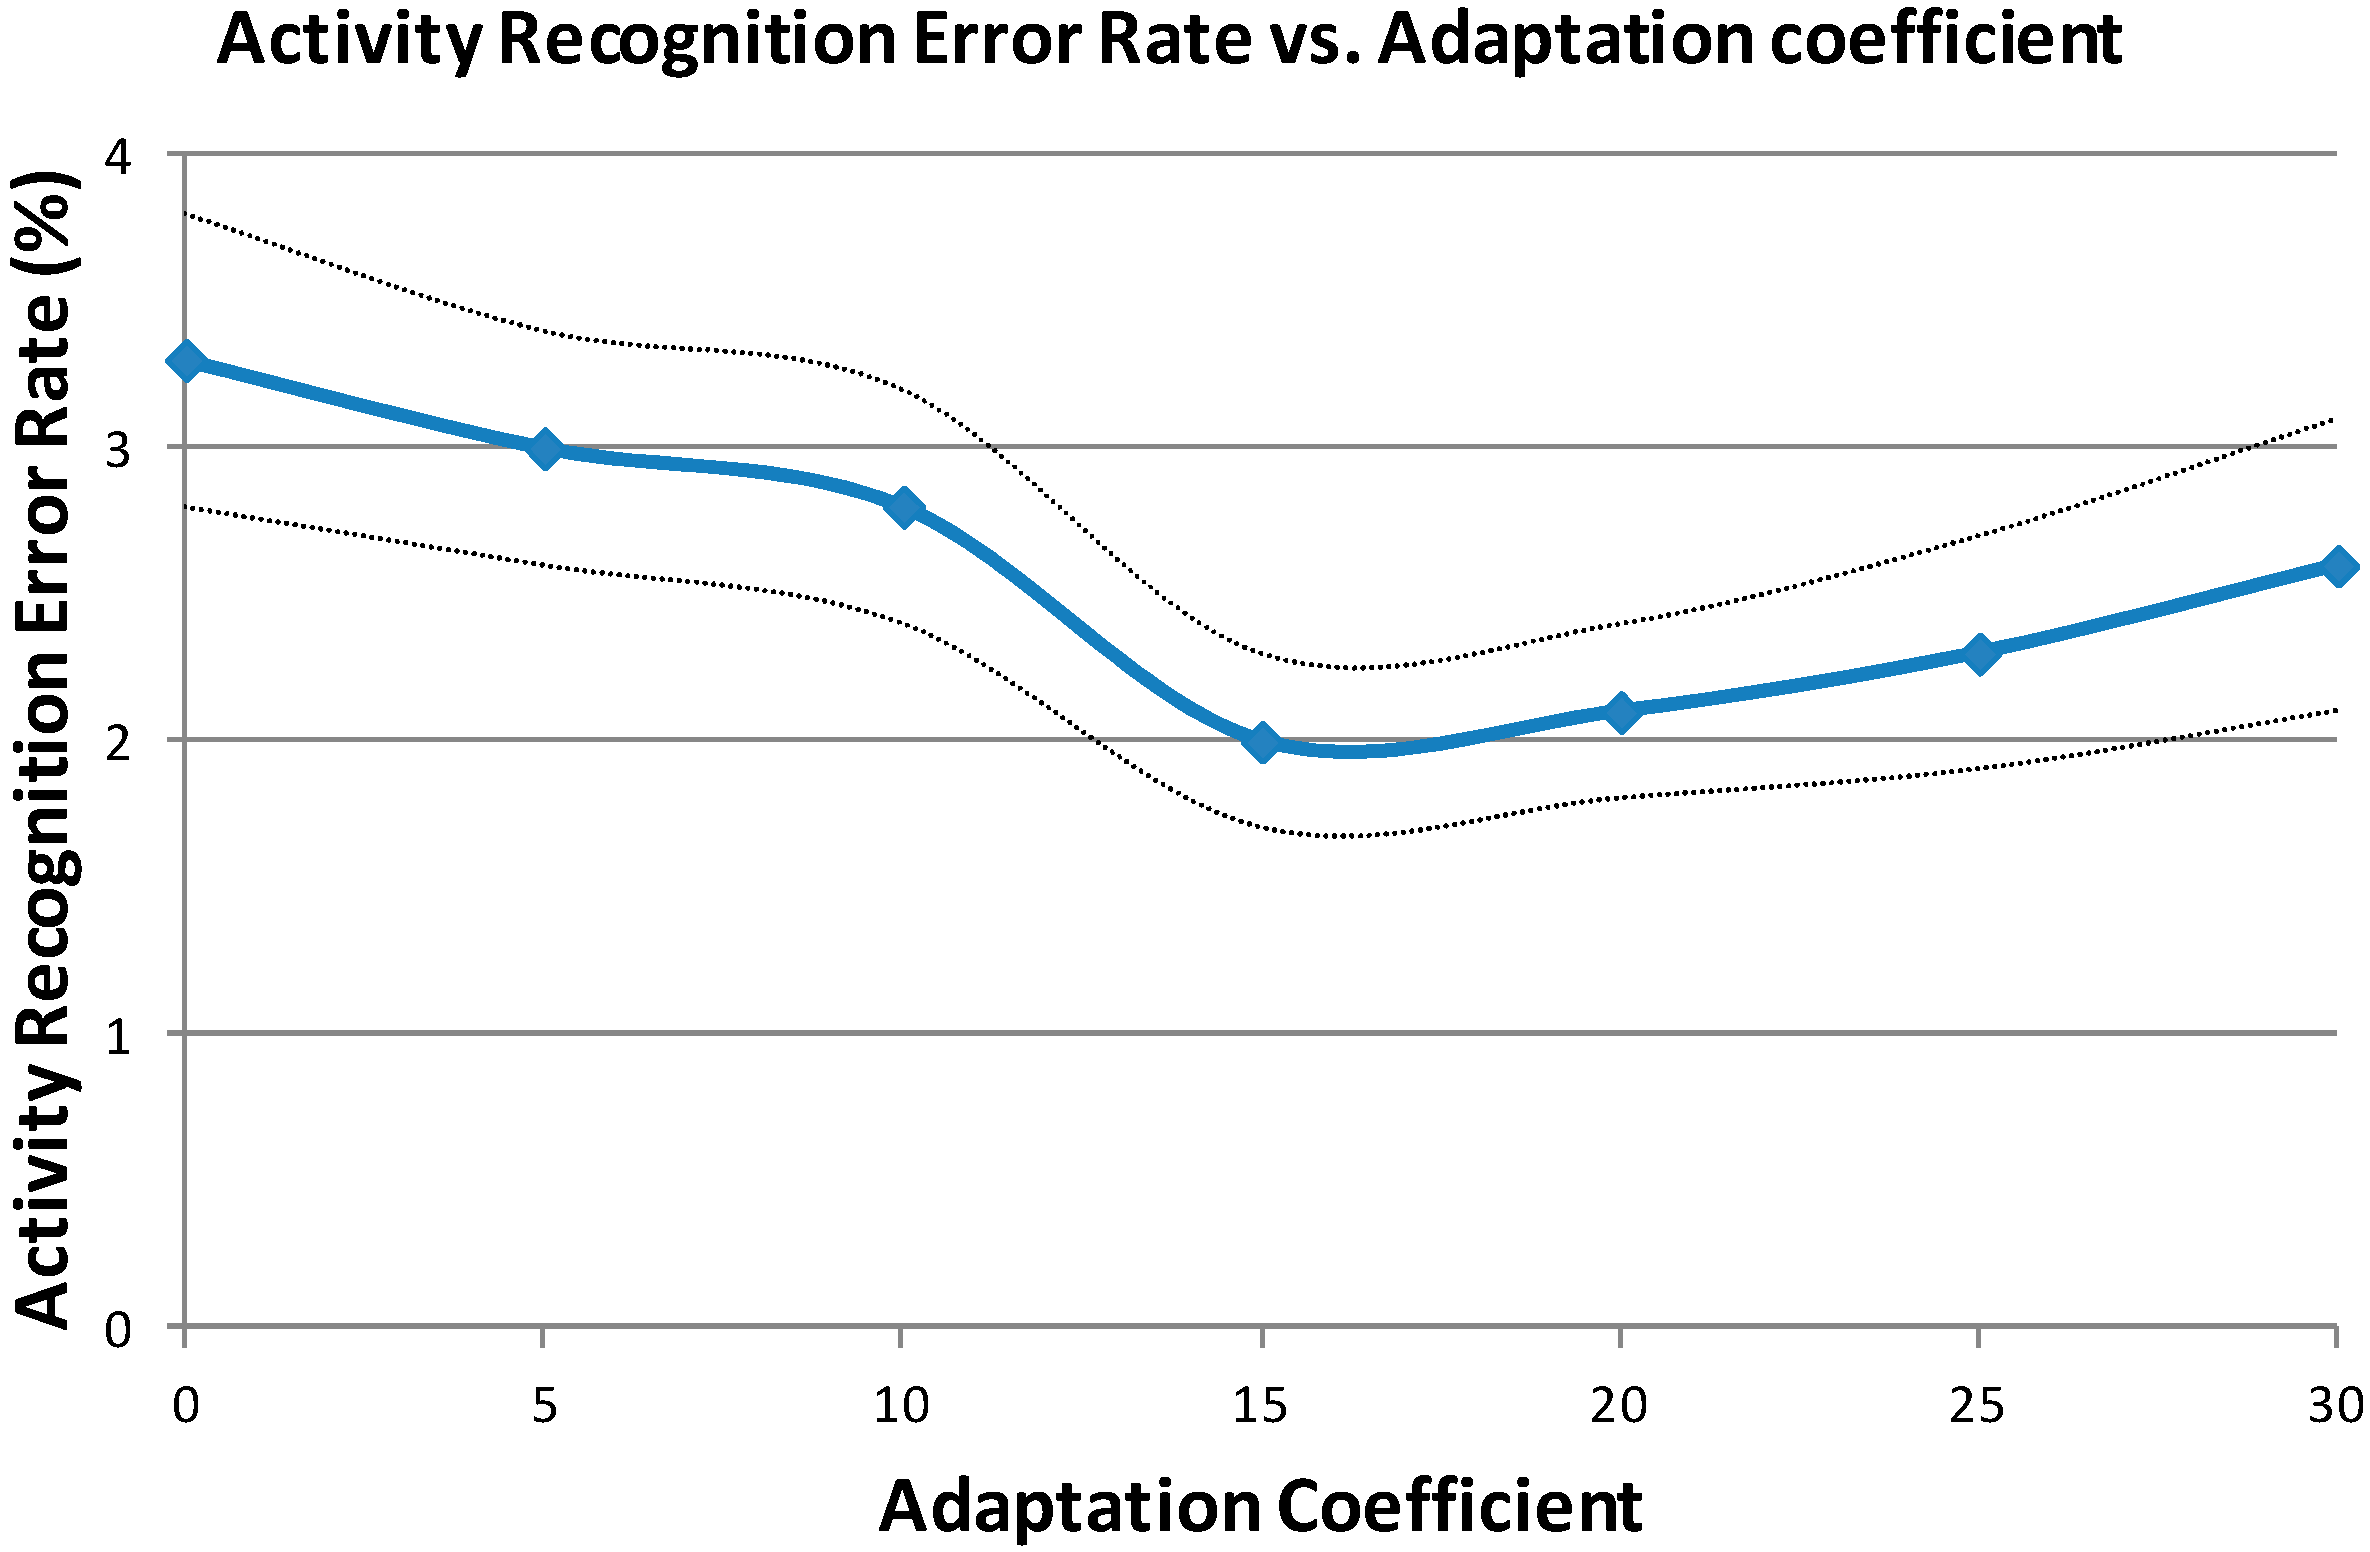
Figure 6 represents the evolution of the ARER depending on the adaptation coefficient. This representation also includes the confidence intervals at 95% along the curve. When MU = 0 no adaptation is done and the system obtains the same results as when using general HMMs. When MU increases, the ARER decreases until reaching a minimum for MU = 15. After this value, the ARER increases because the available user-dependent data is limited and it is not productive to increase its weight for HMMs training.
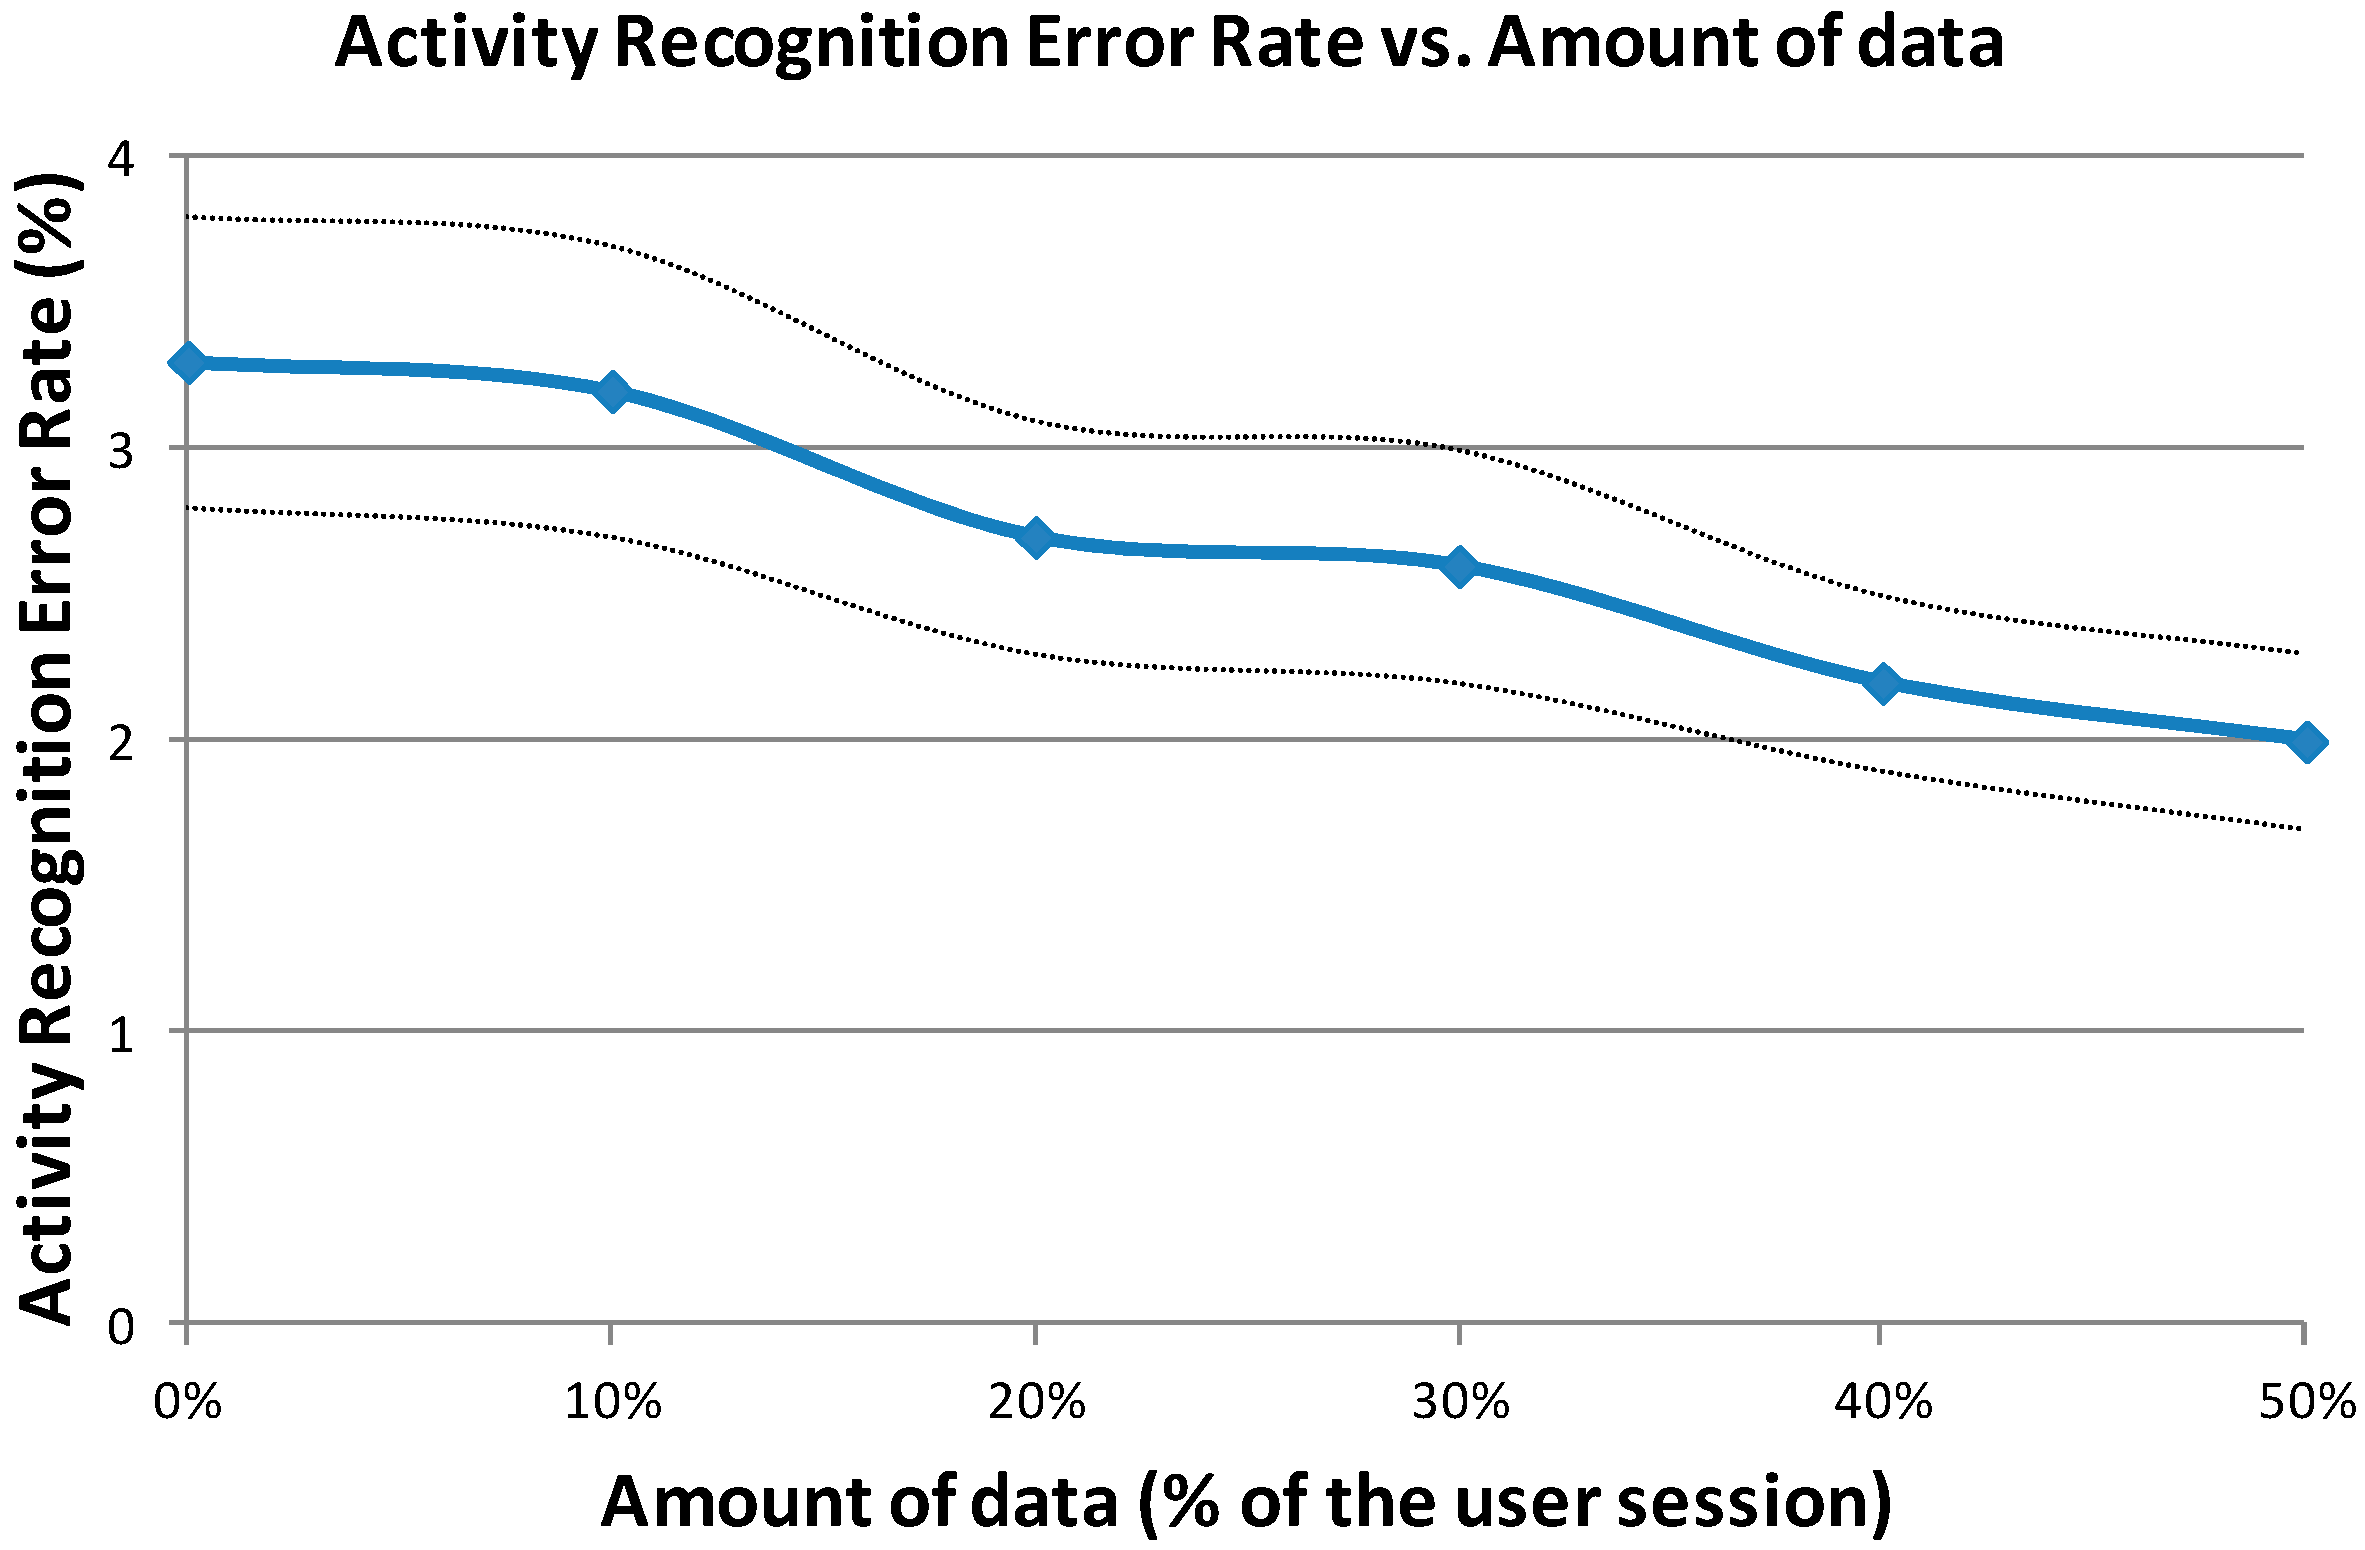
The next figure (
Figure 7) shows the ARER depending on the amount of data to adapt. Instead of using the whole sub-session (50% of the user session) for adapting the HMMs, different amounts have been considered: 10%, 20%, 30%, 40% and 50% of the user session.
As it is shown in
Figure 7, the ARER decreases when we increase the amount of data (this representation also includes the confidence intervals at 95% along the curve). Regarding the differences between users, the absolute ARER reduction varies from 0.5% (the lowest reduction) to 1.5% (the highest reduction). The curve presented in
Figure 7 does not show any saturation tendency, so it means that if we increase the adaptation data, the ARER can continue decreasing. For further works, a bigger dataset will be considered in order to analyze this effect.
In order to complete the analysis, a new experiment has been carried by training the HAR system with the data of a single user. In this case, the first user sub-session has been used for training the system (instead of adapting the system) and the second sub-session for testing. In this case, the ARER increases to 9.4%. This significant degradation is due to the important reduction in the amount of data for training the system. This result supports the utility of the adaptation algorithm proposed in this paper as the best solution for developing a user-dependent HAR system when there is a small amount of data per user.
5.4. Final Experiments and Discussion
This subsection presents the final results on test datasets. These experiments have been carried out considering the best system configuration obtained from the analyses done on the validation sets (see previous subsection): MMIE HMMs training and user MAP adaptation using 50% of the user session for adaptation (first sub-session) and 50% for testing (second sub-session). The sub-session used for testing is the same in all the experiments. It is important to remark that there is not any overlap between testing and adaptation data.
Table 2 shows the final results obtained on validation and test subsets. This table includes the activity segmentation error rates (%), recall (%), precision (%) and confidence intervals at 95%. The results on validation subsets have already been presented in previous subsections.
As shown, the final results on test subsets are slightly worse because the system was optimized on the validation subset. Similar to the conclusion obtained in previous subsections, the ARER error decreases significantly when adapting the HMMs to the user considering a MAP approach.
Table 3 includes the same experiments considering the original dataset partition (70% for HMMs training and 30% for testing) for comparing to previous works. These results show that using a user MAP adaptation, it is possible to significantly improve the segmentation results obtained in previous works on this dataset. When adapting the HMMs to the user, the HAR has better modeling for recognizing the physical activities carried out by this specific user. This adaptation is the main contribution of this paper.
6. Conclusions
This work has proposed a user adaptation technique for improving a HAR system based on HMMs. This system segments and recognizes six different physical activities (walking, walking upstairs, walking downstairs, sitting, standing and lying down) using inertial signals from a smartphone. The system is composed of a feature extractor for obtaining the most relevant characteristics from the inertial signals, a module for training the six HMMs (one per activity), and the last module for segmenting new activity sequences using these models. This paper has evaluated two different HMMs training strategies: the first one, a generative approach (Maximum Likelihood Estimation), and the second, a discriminative one (Maximum Mutual Information Estimation). The discriminative training strategy (MMIE) obtains slightly better results, although the differences are not statistically significant.
The main contribution of this paper is the analysis of a user adaptation technique for adapting the HMMs to the user who performs the different activities. The user adaptation technique consists of a Maximum A Posteriori (MAP) approach. The final results on a public dataset [
30] have reported significant error rate reduction: from 3.2% to 2.0% ARER (more than 30% relative error rate reduction). In conclusion, adapting a HAR system to the user who is performing the physical activities reports significant improvement in the activity segmentation process.


