
Short-Term Load Forecasting Based on the Analysis of User Electricity Behavior


School of Control and Computer Engineering, North China Electric Power University, Beijing 102206, China
*
Author to whom correspondence should be addressed.
Algorithms 2016, 9(4), 80; https://doi.org/10.3390/a9040080
Submission received: 12 October 2016
/
Revised: 16 November 2016
/
Accepted: 17 November 2016
/
Published: 23 November 2016
Abstract
:The smart meter is an important part of the smart grid, and in order to take full advantage of smart meter data, this paper mines the electricity behaviors of smart meter users to improve the accuracy of load forecasting. First, the typical day loads of users are calculated separately according to different date types (ordinary workdays, day before holidays, holidays). Second, the similarity between user electricity behaviors is mined and the user electricity loads are clustered to classify the users with similar behaviors into the same cluster. Finally, the load forecasting model based on the Online Sequential Extreme Learning Machine (OS-ELM) is applied to different clusters to conduct load forecasting and the load forecast is summed to obtain the system load. In order to prove the validity of the proposed method, we performed simulation experiments on the MATLAB platform using smart meter data from the Ireland electric power cooperation. The experimental results show that the proposed method is able to mine the user electricity behaviors deeply, improve the accuracy of load forecasting by the reasonable clustering of users, and reveal the relationship between forecasting accuracy and cluster numbers.
1. Introduction
With the development of smart grid technology, massive deployment of the advanced metering infrastructure (AMI) and all kinds of monitoring systems generate and accumulate a large amount of data [1]. The smart meter is an important part of AMI and it can obtain the precise user electricity load within a certain time interval (such as 15 min, 30 min, etc.) [2]. Compared with many traditional systems, the smart meter is able to generate more data in a shorter time period, which means that most data are collected without deep analysis. It is important to mine the values of these data fully; for example, the user electricity behaviors can be mined via smart meter data and the accuracy of load forecasting can be improved according to user electricity behaviors. Load forecasting has always been a key operation and planning approach of power systems, as it affects many decisions relating to power systems such as economic dispatching, automatic generating control, security evaluation, maintenance scheduling, and energy commercialization [3,4]. Accurate load forecasting can start and stop a power system generator set both economically and reasonably, and plays an important role in maintaining the security and stability of the power grid operation, maintaining the normal production and life of society, and effectively reducing the generation costs [5]. Load forecasting can be divided into four categories; super short-term, short-term, medium-term, and long-term based on different purposes, and their time ranges of forecasting are within 1 h in the future, one day or a week, one month to one year, and 3 to 5 years in the future, respectively [6,7,8]. This paper mainly makes a short-term load forecasting of user electricity load.
In recent years, there have been many studies about short-term load forecasting, regarding the influence factors of load forecasting, accumulated temperature effect caused by continuous high temperatures during the summer, demand side management, and the impact which the renewable energy grid has on electricity load, considered respectively in [9,10,11]. In the construction of the forecasting model, the forecasting models for load demand in buildings are presented by using the time-series approach [12]. A power load forecasting model based on support vector machine and particle swarm optimization is proposed in [13]. A Least Squares Support Vector Machine (LS-SVM) forecasting model based on K-means is proposed in [14]. Multiple linear regression, stepwise linear regression, and neural network methods are introduced in [15], which also improves the neural network prediction model to increase the forecasting accuracy. However, classical load forecasting is limited by the lack of user load data, as it generally makes direct load forecasting of system data [16]. However, the relationship between electricity loads of different users is not considered, which affects the load forecasting accuracy. A smart meter can record a user’s consumption details and classify user loads into clusters, which can effectively mine the relationship between electricity loads of different users (mine the relationship between electricity behaviors of users). In the analysis of user electricity behaviors, medium-term and long-term analyses are made about user electricity behaviors in [17], and appropriate algorithms and the optimal clustering number of mining user electricity behavior similarity are compared in depth. User electricity loads are clustered according to the similarity between user electricity load curves in [18,19,20], through the analysis of the clustered load curves, a reasonable real-time electricity price strategy is put forward to achieve “peak load shifting” of the load curves. The loads are clustered according to user electricity behaviors to estimate the electricity consumption habits and capacities of different users, and an electricity price strategy based on user electricity behaviors is proposed accordingly [21,22,23]. Electricity price is forecasted according to user electricity behavior and electricity price strategy [24]. This study shows that deep mining of the smart meter user electricity behaviors helps to improve the accuracy of load forecasting; The date type is usually introduced while making load forecasting, therefore the date type should also be considered regarding clustering loads. User electricity loads are clustered and classified to determine load forecasting. However, clustering does not calculate typical day load curves respectively according to different date types; the analysis of user electricity behavior is not accurate enough and the data used is not smart meter data, which affects the accuracy of load forecasting [25,26]. The parallel K-means algorithm is firstly adopted to cluster the daily load and then the random vector functional-link net is used to make load forecasting for every cluster [27]. User electricity loads are also clustered and classified for load forecasting in [28,29,30,31]. However, the chosen typical day load curves in clustering do not distinguish date type and average day load; typical day load curves are not calculated according to different date types, which causes the analysis of user electricity behaviors to be not accurate enough and affects the accuracy of load forecasting.
According to the above analysis, in this paper, first the average load data of the same type of date within one month are calculated according to different date types (ordinary workdays, day before holidays, holidays) and the typical day load curves of users are obtained. Second, similarity between user electricity behaviors under different date types are considered to cluster users, which classifies the users with similar electricity behaviors into the same cluster, and the users from various clusters have many differences in their electricity behaviors. Finally, the load forecasting model based on OS-ELM is adopted for different user clusters for load forecasting and aggregated to get the system load. In order to prove the validity of the proposed method, we perform simulation experiments on the MATLAB platform using smart meter data from the Ireland electric power cooperation.
2. Analysis of User Electricity Behavior
Based on different electricity equipment and preferences, users have various behaviors. Not considering the differences between these user behaviors will seriously restrain the improvement of load forecasting accuracy. With the gradual popularization of smart meters, detailed electricity information from users can be accurately obtained, and it is of great significance to improve load forecasting accuracy via in depth studies of user electricity behaviors and by mining the relationship between user behaviors. Therefore, user behaviors are analyzed in depth in this section and related works about load forecasting are demonstrated below.
This paper mainly adopts the smart meter data of Irish households from the Irish Social Science Data Archive (ISSDA) [32]. These data recorded the electricity load of users from 14 July 2009 to 31 December 2010 every 30 min. This paper randomly selects 3000 households and uses three months of their smart meter data from 20 July 2009 to 20 October 2009 as the experimental data. Because these 3000 households were selected randomly, the results can reflect the whole situation of electricity usage. The sum of the electricity load from 3000 households is regarded as the system load in the experiment.
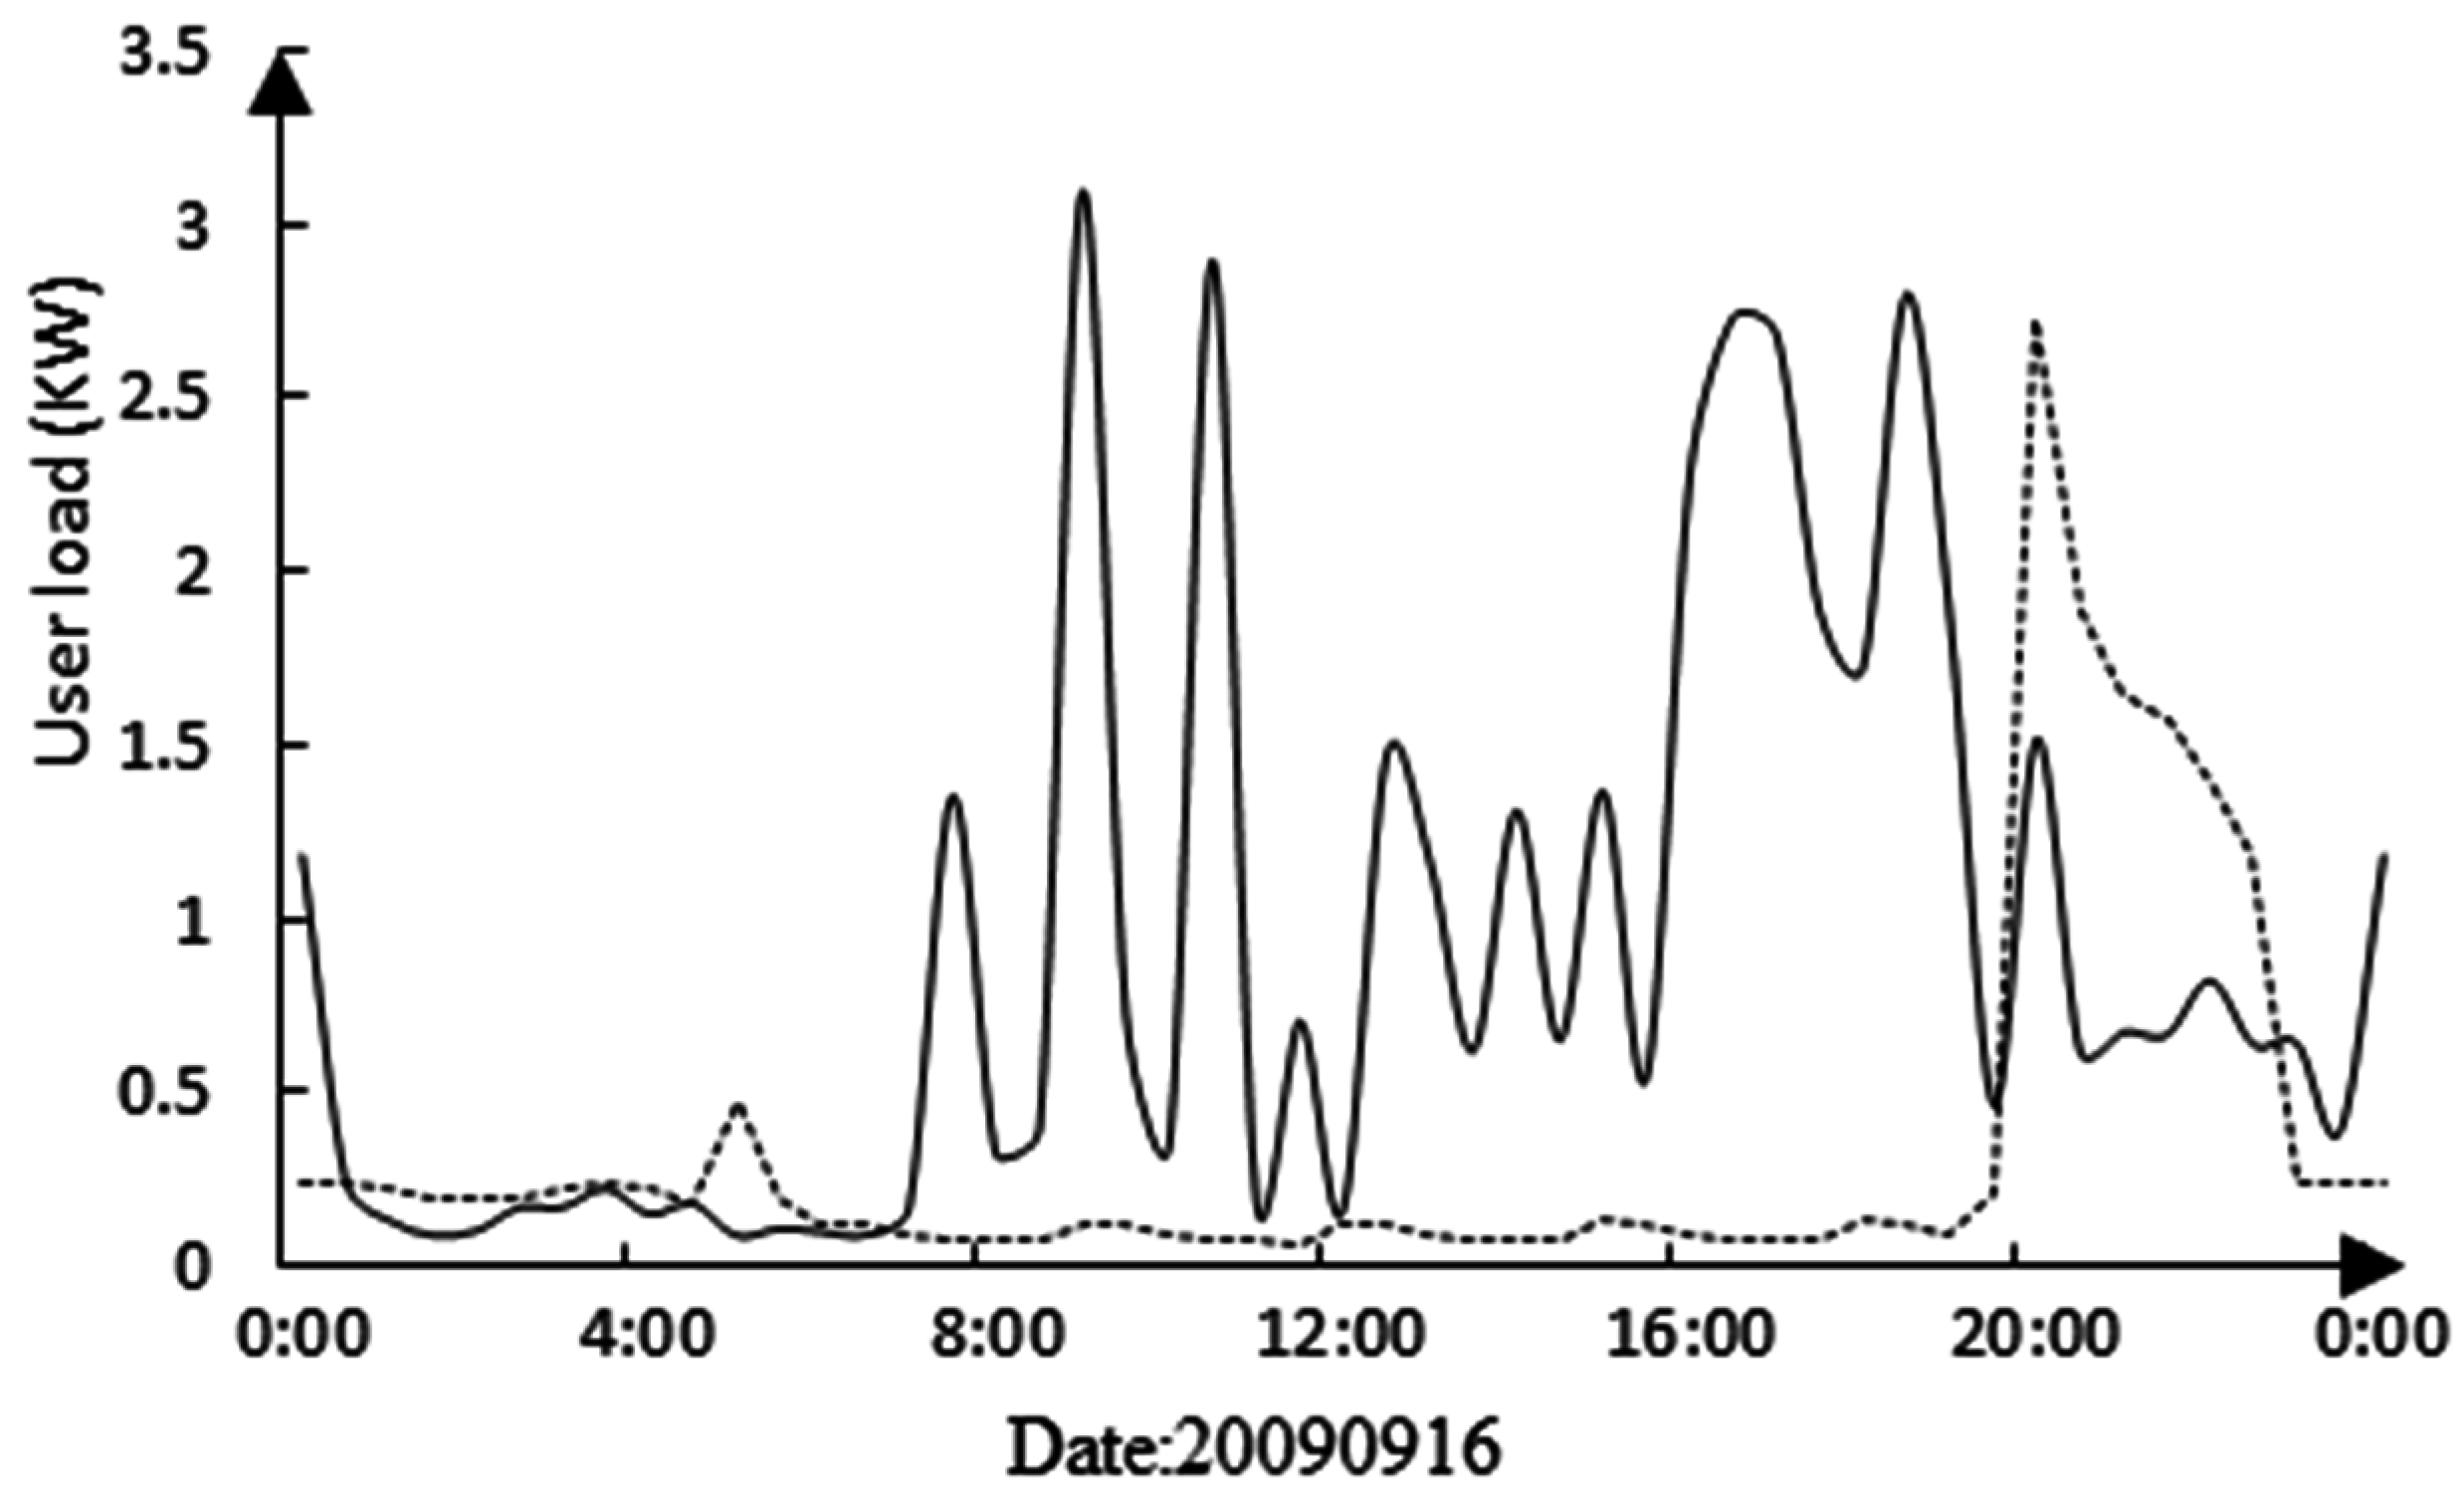
The load curves of the system and a domestic user on the same day are shown in Figure 1. It can be seen that the load curve shapes of the system and single user have a big difference; the system load forecast cannot reflect the future electricity load of a singular user. Therefore, it can improve the accuracy of load forecasting by aggregating the user load forecast to obtain the system load forecast.
The electricity load curves of two different users on the same day are shown in Figure 2. It can be seen that the load curves of different users are not the same; this is due to the fact that every user owns different electrical equipment, and has different usage times and preferences. Therefore, the users with similar electricity behaviors can be classified into the same cluster by in depth mining of their behaviors, and the behaviors of users from different clusters are not the same.
The day load curves of a domestic user over the course of one week are shown in Figure 3. It can be seen that the electricity loads of the same user is different at various times, therefore, the differences between user habits at various times should be considered during load clustering. In load forecasting, date type is usually taken into consideration as an influencing factor, so date type should be introduced in load clustering.
It can be said that the reasonable clustering of user loads is very important and necessary for load forecasting. K-means is adopted to cluster loads in this paper. Smart meter data can probably be lost during transmission, so the average of the first three loads with the same date type and time is used to supplement the missing data reasonably. Mining the similarity between user electricity behaviors has to do with their load curve shape and it has nothing to do with the specific electricity consumption. Therefore, the typical load data of every date type should be normalized before clustering. Date type is considered in this paper and it is divided into ordinary workdays, day before holidays, and holidays. The average electricity loads of three types of dates within one month is regarded as the typical day load data of the respective date type. The typical day loads of every date type are then normalized and the normalized data are joined to participate in the load clustering as the typical loads of users; there are 48 × 3 = 144 dimensions (there are 48 load values every day and the joined load values of the three date types are 144) based on which load clustering is performed to mine the similarity between user behaviors. The adopted normalization is the most used extremum method during load clustering, as follows:
where denotes the load data of user at the moment, denotes the maximum typical day load data of some date type, and is the normalized data.
The normalized load curve of a user is shown in Figure 4, and the load peak, valley values, and the variations of the user load in different types of dates can be clearly seen.
These data are clustered after they are normalized. In order to ensure that the algorithm does not fall into the local optimum, the experiment conducts iterative operations 500 times, and the chosen data set is respectively classified into 1–6 clusters. Because the ultimate objective is to conduct load forecasting, the study of the relationship between the cluster number and forecasting accuracy is required, and the appropriate cluster number depends on the forecasting accuracy.
3. Short-Term Load Forecasting Model Based on OS-ELM
3.1. OS-ELM Algorithm
OS-ELM (Online Sequential Extreme Learning Machine) is a new type of learning algorithm that uses the single hidden layer feed-forward neural network, and this algorithm can be applied to problems of classification and regression [33]. In the traditional extreme learning machine algorithm, when new data are obtained, the historical data will be repeatedly trained together with new data, which requires a lot of time. OS-ELM effectively avoids the repeated training of data and greatly improves the learning efficiency by using a partitioned matrix method [34,35,36].
An OS-ELM description is as follows:
In any different size training sample , the number of nodes in the hidden layer is , and the activation function is , where is the input weight and is the threshold of hidden layer nodes.
Any given values of and can approximate any zero error of the different training samples. It can be expressed as Equation (2):
where is the output vector, and are the output weights. Equation (2) can be simplified further as follows:
where , and is the hidden layer output matrix which can by calculated by Equation (4):
where the j-th column in matrix shows the j-th hidden layer node’s output given an input .
OS-ELM algorithm process:
Step 1: Initialization phase: selecting the suitable data in data set as a short period of a training set to initialize the network, the number of hidden layer nodes is .
(1) The input weight and threshold value of the hidden layer node are randomly selected, ;
(2) The hidden layer and output matrix calculation, as shown in Equation (5);
(3) The initial output weights calculation, as shown in Equation (6).
.
, is the number of data segments sent to the network.
Step 2: Online learning phase:
(1) The newly added k+1th data block is shown in Equation (7);
(2) The hidden layer matrix of newly added data calculation, as shown in Equation (8);
And the output expressed as .
(3) The output weights calculation formula is shown in Equation (9).
Assuming that there is k data set being inputted into the power grid security situation prediction model, then is obtained. Then the new training data block is added, and can be expressed as Equation (10).
and can also be expressed as Equation (11) through further calculation.
(4) Set , return to Step 2, and update the output weights constantly until all the data have been processed.
The OS-ELM algorithm only uses a small part of data for training and learning in the initial stage, and the training data is discarded after the training. Additionally, the parameters H and which are obtained by training are stored in the network; in the continuous learning phase, inputting change data updates parameters in real time, which greatly enhances the network generalization ability.
3.2. Forecasting Model
The first two months of data is used as training data and the last month of data is used as testing data. Besides these smart meter data, the local historical temperature data are obtained from [37] (the highest temperature, the lowest temperature, and average temperature). Considering that all various factors (such as temperature, date type, etc.) have an effect on user loads, the data sample of load forecasting is constructed as shown in Table 1.
As shown in Table 1, every data sample is composed of 12 variables (because date type has already been considered in the sample construction, date type is not added to the sample as a dimension of the data).
After clustering the chosen experimental data, the users are classified into different clusters. The sum of the user electricity load from every cluster is taken as the partial system load of the corresponding cluster, and then load forecasting is made for every cluster. The sum of the partial system load is taken as the total system load forecast.
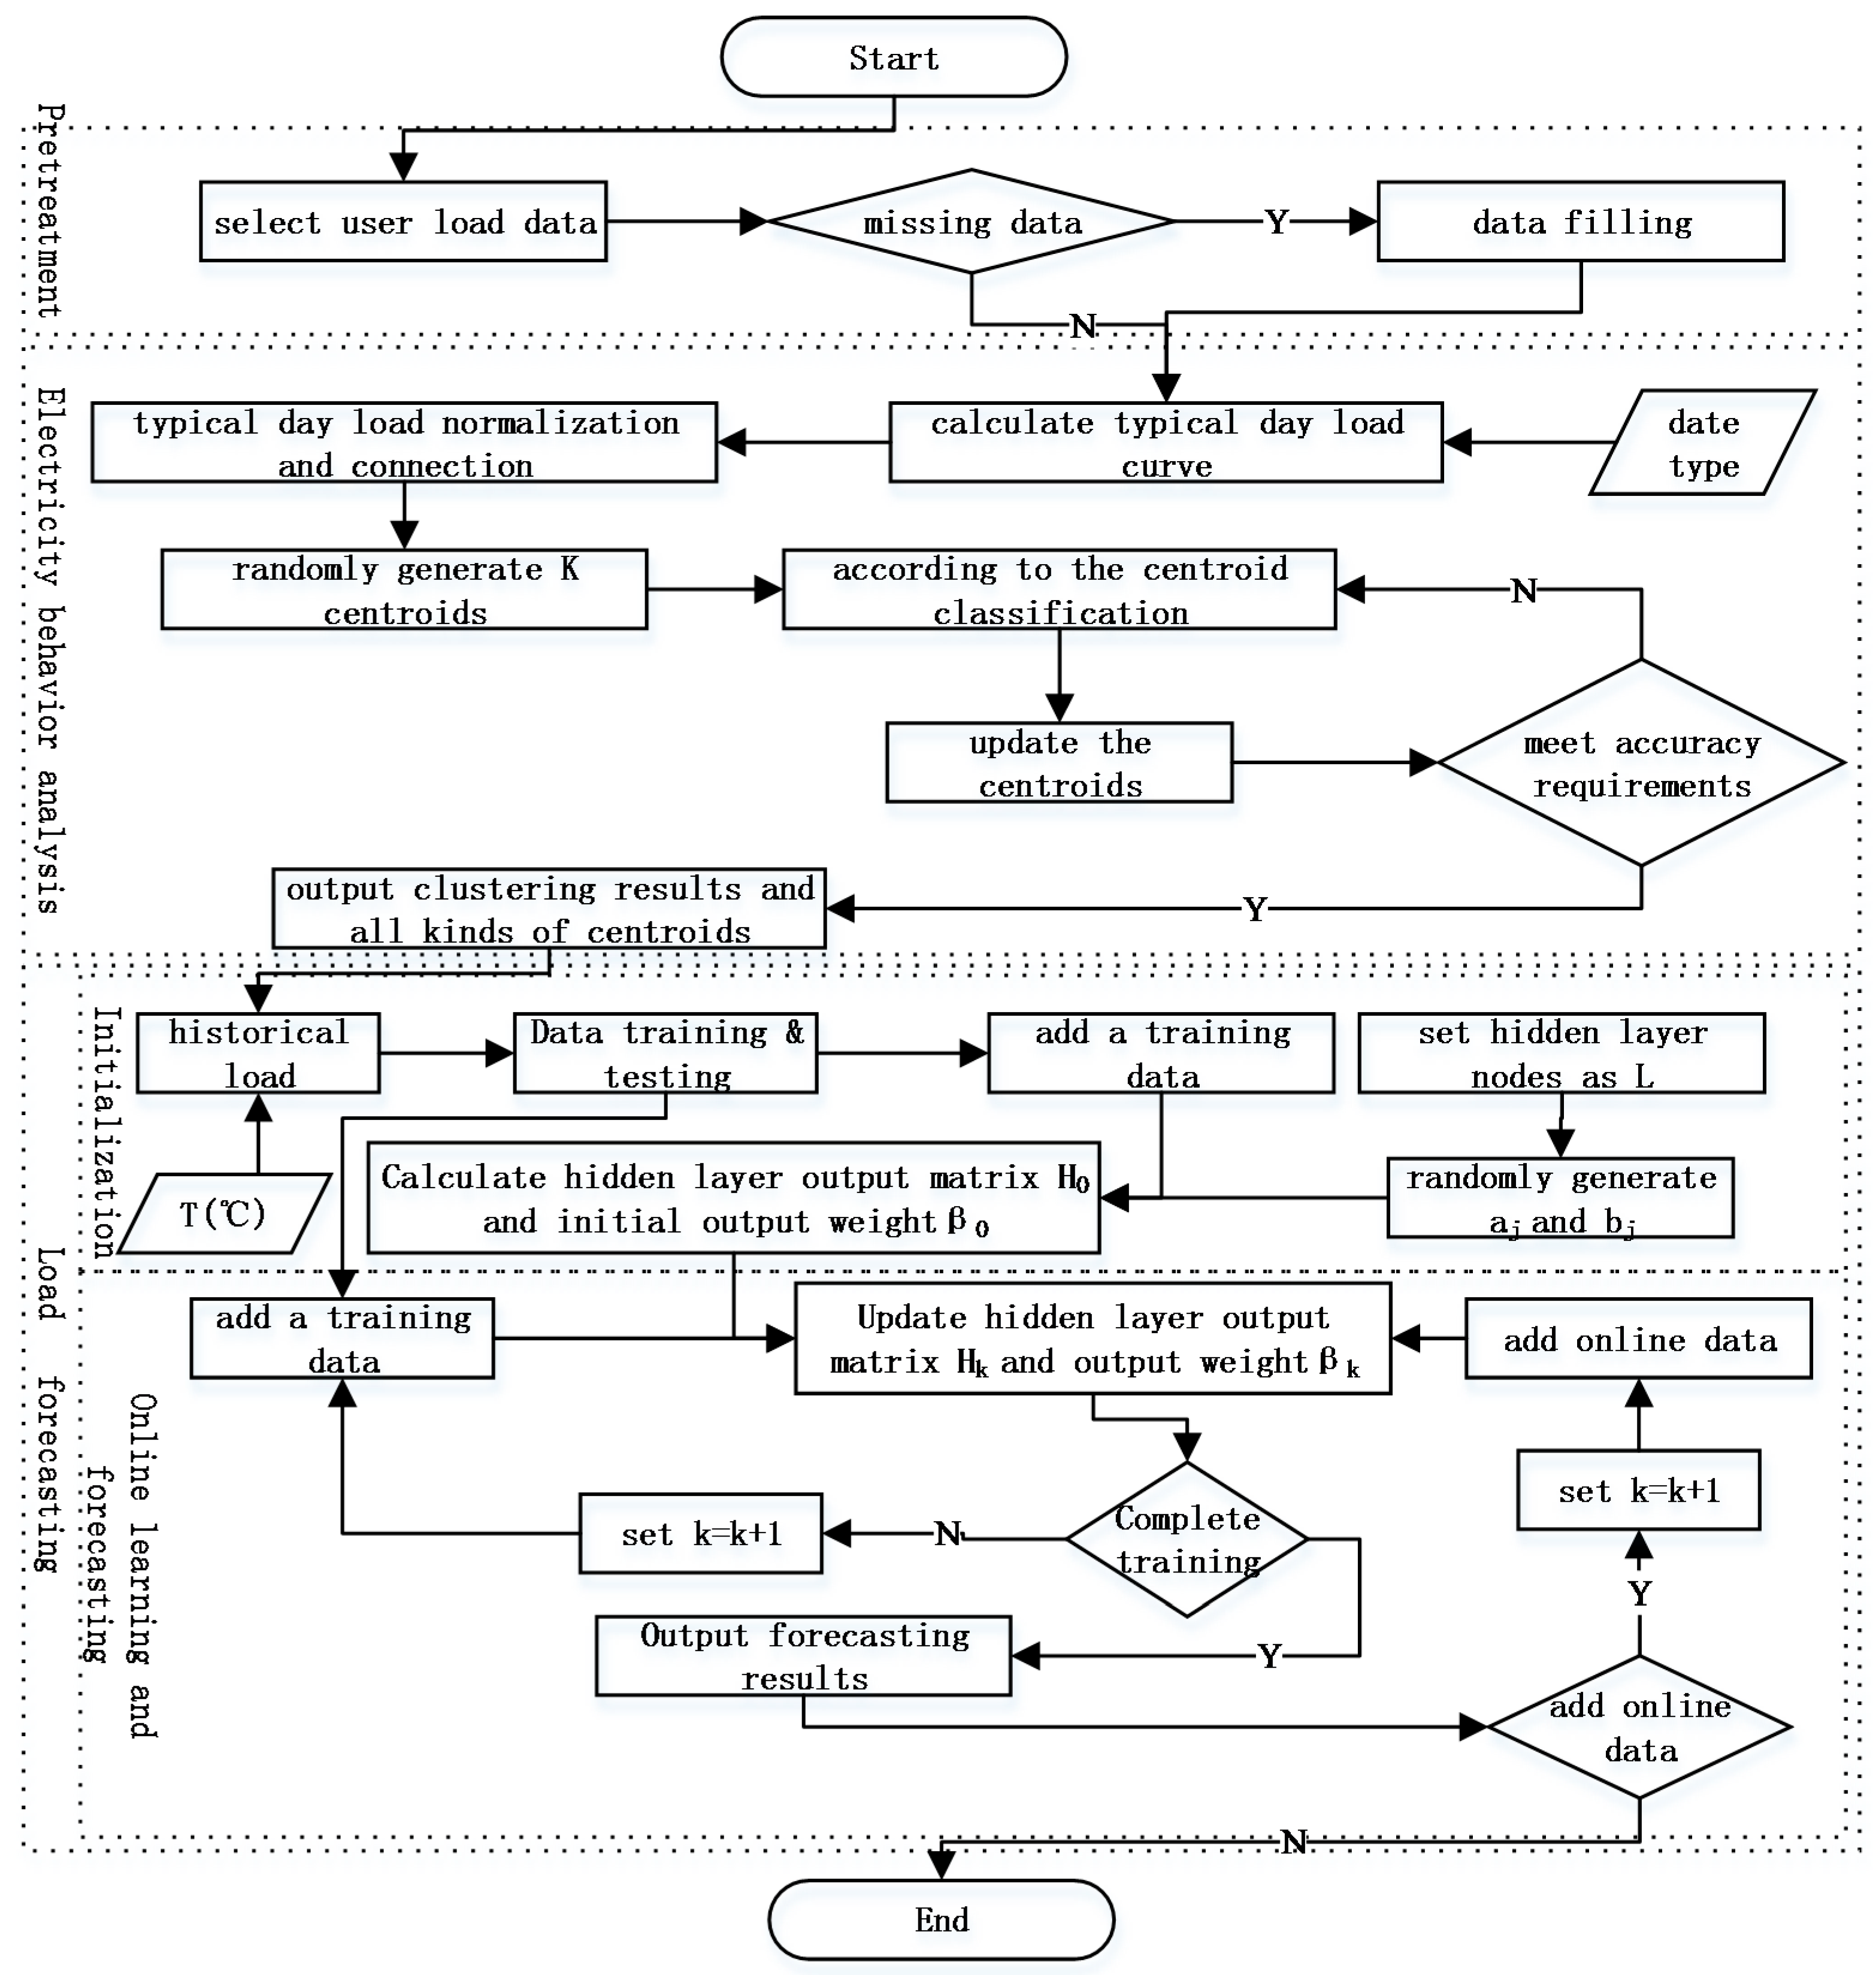
The first two months of data from the sample was chosen to be the training sample and the last month of data was chosen to be the testing sample. The experimental objective was to forecast the user electricity load every 30 min within the period of one day. The specific model flowchart is shown in Figure 5.
4. Analysis of Examples
As this paper studies how deep mining of user electricity behaviors increases the accuracy of load forecasting, in order to exclude the influences from other factors, parameters are set to be the same during the experiment of the whole forecasting phase, the number of neurons in hidden layer is L = 20, the activation function is , the number of added data blocks for each time is one, the number of data contained in every data block is one, and the experiment is conducted in the MATLAB R2014b platform.
This paper adopts MAPE (Mean Absolute Percent Error) as the measurement criteria for the accuracy of load forecasting, as follows:
where n is the number of clusters, is the practical value of the partial system load from the i-th cluster, and is the forecast value of partial system load from the i-th cluster. At the same time, the maximum and average of MAPE (MAX-MAPE and MID-MAPE) are chosen within one day as the general measurement criteria for load forecasting accuracy on that day.
Because this paper makes short-term load forecasting, the whole next day load is required to be forecasted at one time. Whereas, as shown in Table 1, the load values from the two hours before the forecasted time are used, and when the load after the next two hours is forecasted, the load forecast within the next two hours must be used. Because these values are forecast values instead of real values, the MAPE is accumulated, and on the whole, the MAPE curves present a rising trend.
In order to verify the validity of the proposed sample construction method and forecasting model, this paper performs the following comparison experiment: A. The date type is not considered during clustering, and the typical day load of users is clustered directly after normalization. While performing load forecasting, the date type is considered to be a factor to construct the sample (add another dimension of data into Table 1 to express the date type); B. The date type is considered during clustering, and the load forecasting is performed using the proposed model; C. The date type is considered during clustering, and the load forecasting is performed using the traditional ELM forecasting model. No clustering is also compared for all experiments; that is to say, K = 1.
A. Using the proposed forecasting model, the variation curves of MAPE under different clustering conditions are shown in Figure 6 (without considering the date type).
K is the number of clusters. From Figure 6, we can see that the MAPE of the load forecasting firstly decreases with increasing K (the decrease of the MAPE corresponds to the increase of the forecasting accuracy). With K = 3, MAPE is at its minimum, and then MAPE increases with increasing K (the forecasting accuracy decreases).
At this time, the corresponding K, and the maximum and average MAPE of the load forecasting are shown in Table 2.
B. Using the proposed forecasting model, the variation curves of MAPE under different clustering conditions are shown in Figure 7 (considering the date type).
The maximum and average MAPE of forecasting within one day and corresponding cluster numbers are shown in Table 3; apparently the forecasting error is at a minimum when K = 4, and it can be seen that K = 4 is the best number of clusters, and the maximum of the load forecasting accuracy can be obtained.
It can be seen from Figure 7 and Table 3 that the forecasting accuracy is at its minimum when K = 4, and the forecasting accuracy with K = 1 (the analysis of user similarity is not performed, the load forecasting is performed directly) is much lower than with K = 4.
By comparing Figure 6 with Figure 7, and Table 2 with Table 3, it is obvious that the forecasting accuracy using the condition of considering the date type during load clustering is generally better than using the condition of not considering the date type. This is because in experiment A, the date type was not considered during load clustering, and the date type is generally considered while making load forecasting; the load forecasting accuracy must be influenced without considering the date factor while analyzing user electricity behaviors.
C. Using the traditional ELM forecasting model, the variation curves of MAPE under different clustering conditions are shown in Figure 8 (considering the date type).
The maximum and average MAPE of the forecasting within one day and the corresponding cluster numbers are shown in Table 4; apparently the forecasting error is at its minimum when K = 4, and it can be seen that K = 4 is the best number of clusters and the maximum of load forecasting accuracy can be obtained.
Through comparison of experiments A and B, we can see that we can increase the load forecasting accuracy if we cluster the user with consideration of the date type, and then perform load forecasting to obtain the partial system load forecasts and aggregate them to obtain the system load forecast. We can conclude that when the similarity between user electricity behaviors is mined deeply, clustering is conducted, and load forecasting is made on the basis of clustering, we can obtain a more precise accuracy of load forecasting.
Through comparison of experiments B and C, in the traditional ELM forecasting model, the historical data will be repeatedly trained together with new data when new data are obtained, while OS-ELM effectively avoids the repeated training data. In this way, the new data will correct the parameters, therefore OS-ELM greatly improves the training speed and the forecasting accuracy by using the partitioned matrix method.
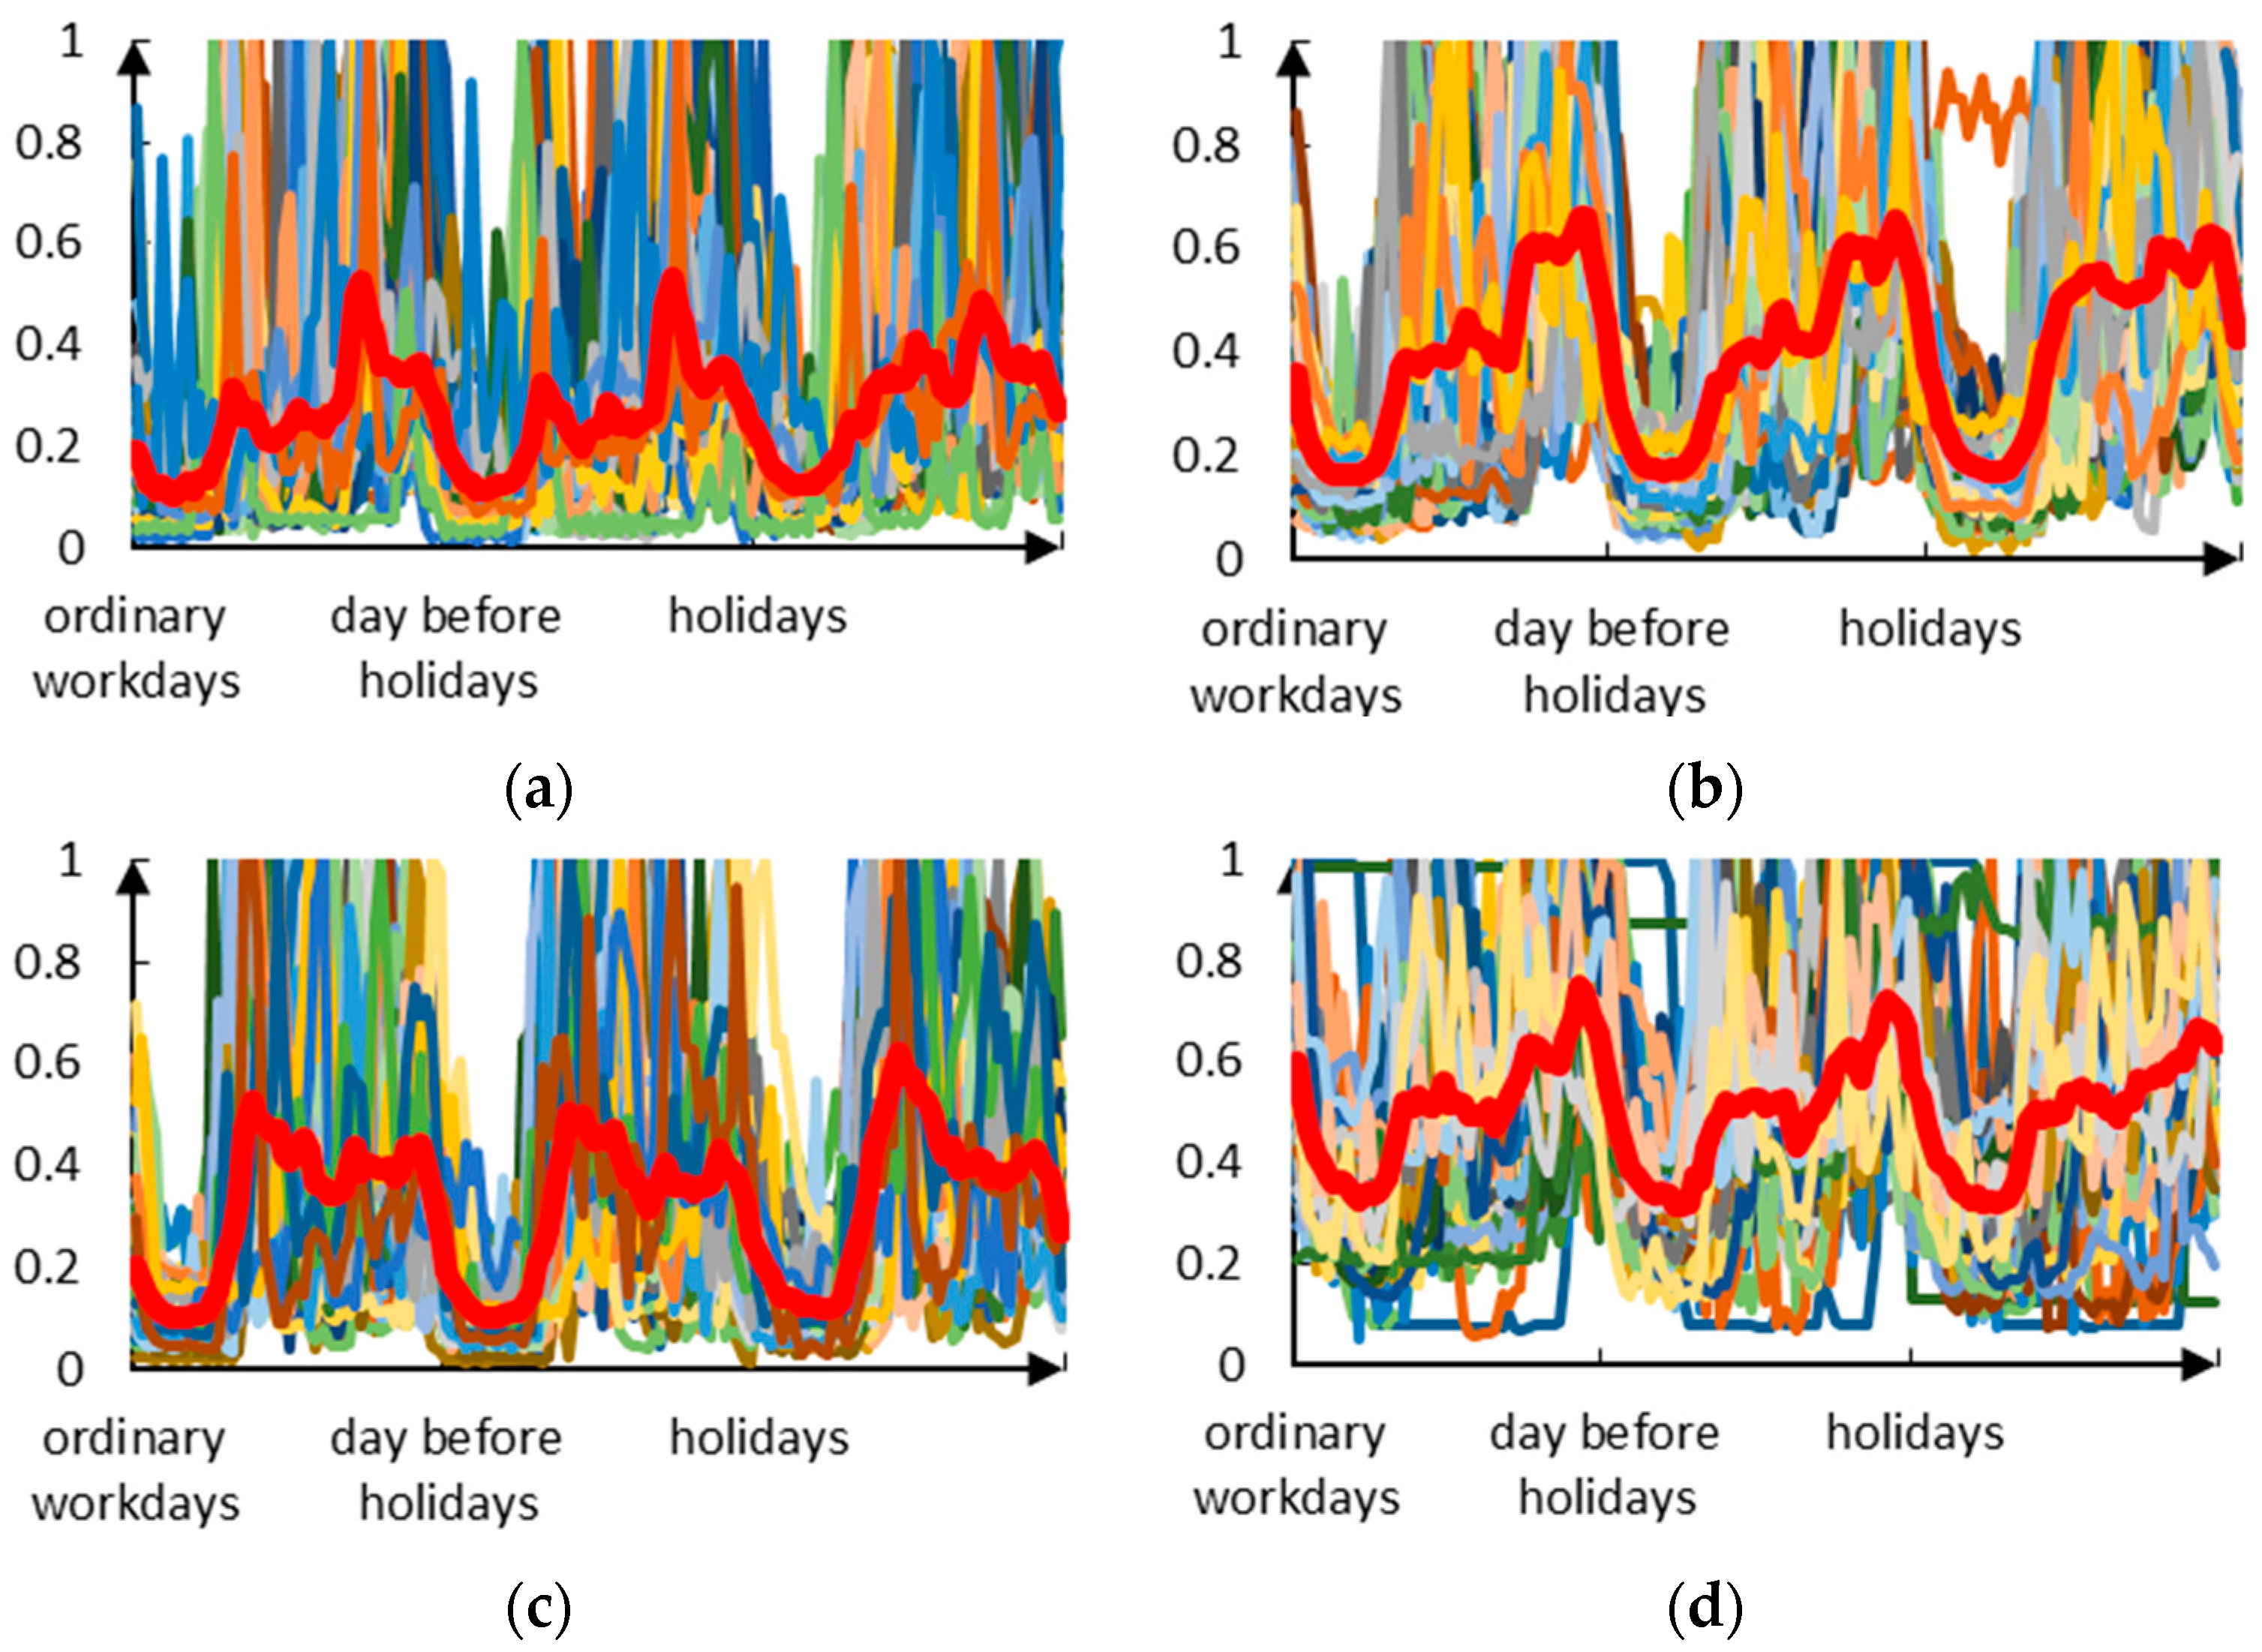
According to the above study, for the proposed sample construction method and forecasting model for the chosen data set, the forecasting accuracy is at its maximum when the users are classified into four clusters. The clustering result of the normalized user loads is shown in Figure 9.
The good clustering effect is shown in Figure 9; the red line is the center line of clustering, and the other colored lines are the normalized load curves of different users. It can be seen that the load curves of users who are from the same cluster are very similar and the load curves of users who are from various clusters are vastly different.
5. Conclusions
The network model that uses smart meters makes it convenient to conduct online load forecasting. This paper studies how to deeply mine the similarity between user electricity behaviors according to the requirements of load forecasting, and how to increase the forecasting accuracy on the system level according to the similarity between user behaviors. We have proven the validity of the proposed sample construction method and forecasting model using smart meter data of actual domestic users, which provides a reference for the analysis of user electricity behaviors and the research of load forecasting. Although this paper only adopts the load data of domestic users, the proposed model can also be applied to load forecasting for commercial and industrial users.
Acknowledgments
This paper is supported by the Scientific Research Foundation for the Returned Overseas Chinese Scholars, State Education Ministry ([2013]693).
Author Contributions
Yuancheng Li and Panpan Guo performed the experiments and drafted the manuscript; Xiang Li revised the manuscript; all the authors read and approved the final manuscript.
Conflicts of Interest
The authors declare no conflict of interest.
References
- Zhao, T.; Zhang, Y.; Zhang, D. Application technology of big data in smart distribution grid and its prospect analysis. Power Syst. Technol. 2014, 12, 3305–3312. [Google Scholar]
- Baig, Z.A.; Al Amoudy, A.; Salah, K. Detection of compromised smart meters in the Advanced Metering Infrastructure. In Proceedings of the 2015 IEEE 8th GCC Conference and Exhibition (GCCCE), Muscat, Oman, 1–4 February 2015; pp. 1–6.
- Zhang, S.; Zhao, B.; Wang, F.; Zhang, D. Short-term power load forecasting based on big data. Proc. Chin. Soc. Electr. Eng. 2015, 1, 37–42. [Google Scholar]
- Wang, B.; Zhao, S.; Zhang, S. A distributed load forecasting algorithm based on cloud computing and extreme learning machine. Power Syst. Technol. 2014, 2, 526–531. [Google Scholar]
- Zhong, Q.; Sun, W.; Yu, N.; Liu, C.; Wang, F.; Zhang, X. Load and power forecasting in active distribution network planning. Proc. Chin. Soc. Electr. Eng. 2014, 19, 3050–3056. [Google Scholar]
- Wang, D.; Sun, Z. Big data analysis and parallel load forecasting of electric power user side. Proc. Chin. Soc. Electr. Eng. 2015, 3, 527–537. [Google Scholar]
- Zhao, M.; Liu, W.; Su, J.; Zhao, L.; Dong, X. Medium and long term load forecasting method for distribution network with high penetration DGs. In Proceedings of the 2014 China International Conference on Electricity Distribution (CICED), Shenzhen, China, 23–26 September 2014; pp. 442–444.
- Yao, M.; Zhao, M.; Xiao, H.; Wang, D. Research on mid-long term load forecasting based on combination forecasting mode. In Proceedings of the 2015 16th IEEE/ACIS International Conference on Software Engineering, Artificial Intelligence, Networking and Parallel/Distributed Computing (SNPD), Takamatsu, Japan, 1–3 June 2015; pp. 1–5.
- Gao, C.; Li, Q.; Su, W.; Li, Y. Temperature correction model research considering temperature cumulative effect in short-term load forecasting. Trans. China Electrotech. Soc. 2015, 4, 242–248. [Google Scholar]
- Zhao, H.; Tang, Z. The review of demand side management and load forecasting in smart grid. In Proceedings of the 2016 12th World Congress on Intelligent Control and Automation (WCICA), Guilin, China, 12–15 June 2016; pp. 625–629.
- Livani, H.; Jafarzadeh, S.; Evrenosoglu, C.Y.; Fadali, M.S. A unified approach for power system predictive operations using viterbi algorithm. IEEE Trans. Sustain. Energy 2014, 5, 757–766. [Google Scholar] [CrossRef]
- Saatwong, P.; Suwankawin, S. Short-term electricity load forecasting for Building Energy Management System. In Proceedings of the 2016 13th International Conference on Electrical Engineering/Electronics, Computer, Telecommunications and Information Technology (ECTI-CON), Chiang Mai, Thailand, 28 June–1 July 2016; pp. 1–6.
- Ren, G.; Wen, S.; Yan, Z.; Hu, R.; Zeng, Z.; Cao, Y. Power load forecasting based on support vector machine and particle swarm optimization. In Proceedings of the 2016 12th World Congress on Intelligent Control and Automation (WCICA), Guilin, China, 12–15 June 2016; pp. 2003–2008.
- Wang, X.; Lee, W.J.; Huang, H.; Szabados, R.L.; Wang, D.Y.; van Olinda, P. Factors that Impact the Accuracy of Clustering-Based Load Forecasting. IEEE Trans. Ind. Appl. 2016, 52, 3625–3630. [Google Scholar] [CrossRef]
- Yang, H.P.; Yan, F.F.; Wang, H.; Zhang, L. Short-term load forecasting based on data mining. In Proceedings of the 2016 IEEE 20th International Conference on Computer Supported Cooperative Work in Design (CSCWD), Nanchang, China, 4–6 May 2016; pp. 170–173.
- Quilumba, F.L.; Lee, W.-J.; Huang, H.; Wang, D.Y.; Szabados, R.L. Using smart meter data to improve the accuracy of intraday load forecasting considering user behavior similarities. IEEE Trans. Smart Grid 2015, 6, 911–918. [Google Scholar] [CrossRef]
- Wang, Y.; Li, L.; Yang, Q. Application of clustering technique to electricity user classification for load forecasting. In Proceedings of the 2015 IEEE International Conference on Information and Automation, Lijiang, China, 8–10 August 2015; pp. 1425–1430.
- Rogers, D.F.; Polak, G.G. Optimal clustering of time periods for electricity demand-side management. IEEE Trans. Power Syst. 2013, 28, 3842–3851. [Google Scholar] [CrossRef]
- Loganathan, N.; Lakshmi, K. Demand side energy management system using ANN based linear programming approach. In Proceedings of the 2014 IEEE International Conference on Computational Intelligence and Computing Research (ICCIC), Coimbatore, India, 18–20 December 2014; pp. 1–5.
- Luo, L. Research on Categorized Time-of-Use Power Price Based on Fuzzy C-Means Clustering; Shandong University: Jinan, China, 2013. [Google Scholar]
- Lin, X.; Wang, Y.; Pedram, M. Designing the optimal pricing policy for aggregators in the smart grid. In Proceedings of the 2014 Sixth Annual IEEE Green Technologies Conference (GreenTech), Corpus Christi, TX, USA, 3–4 April 2014; pp. 75–80.
- Mori, H.; Nakano, K. EPSO-based Gaussian Process for electricity price forecasting. In Proceedings of the 2015 IEEE Congress on Evolutionary Computation (CEC), Sendai, Japan, 25–28 May 2015; pp. 291–296.
- Okawa, Y.; Namerikawa, T. Dynamic electricity pricing via the H∞ control considering uncertainties in market participants’ behavior. In Proceedings of the 2015 European Control Conference (ECC), Linz, Austria, 15–17 July 2015; pp. 1064–1069.
- Kakhki, I.N.; Taherian, H.; Aghaebrahimi, M.R. Short-term price forecasting under high penetration of wind generation units in smart grid environment. In Proceedings of the 2013 3th International Conference on Computer and Knowledge Engineering (ICCKE), Mashhad, Iran, 31 October–1 November 2013; pp. 158–163.
- Humeau, S.; Wijaya, T.K.; Vasirani, M.; Aberer, K. Electricity load forecasting for residential users: Exploiting aggregation and correlation between households. In Proceedings of the Sustainable Internet and ICT for Sustainability (SustainIT), Palermo, Italy, 30–31 October 2013; pp. 1–6.
- Zhang, Y.; Zhang, F.; Zhu, B. A novel ultra-short term load forecasting method based on load trend and fuzzy c-means clustering algorihm. In Proceedings of the 2014 International Conference on Power System Technology (POWERCON), Chengdu, China, 20–22 October 2014; pp. 1–7.
- Liu, J.; Zhao, J.; Ouyang, Y.; Wang, B.; Liu, Y.; Ouyang, H.; Hao, Q.; Lu, Y. Short-term load forecasting based on parallel frameworks. In Proceedings of the 2016 12th International Conference on Natural Computation, Fuzzy Systems and Knowledge Discovery (ICNC-FSKD), Changsha, China, 13–15 August 2016; pp. 1474–1478.
- Sauhats, A.; Varfolomejeva, R.; Lmkevics, O.; Petrecenko, R.; Kunickis, M.; Balodis, M. Analysis and prediction of electricity consumption using smart meter data. In Proceedings of the 2015 IEEE 5th International Conference on Power Engineering, Energy and Electrical Drives (POWERENG), Riga, Latvia, 11–13 May 2015; pp. 17–22.
- Chaouch, M. Clustering-based improvement of nonparametric functional time series forecasting: Application to intra-day household-level load curves. IEEE Trans. Smart Grid 2014, 5, 411–419. [Google Scholar] [CrossRef]
- Shahzadeh, A.; Khosravi, A.; Nahavandi, S. Improving load forecast accuracy by clustering consumers using smart meter data. In Proceedings of the 2015 International Joint Conference on Neural Networks (IJCNN), Killarney, Ireland, 12–17 July 2015; pp. 1–7.
- Zhang, P.; Wu, X.; Wang, X.; Bi, S. Short-term load forecasting based on big data technologies. CSEE J. Power Energy Syst. 2015, 1, 59–67. [Google Scholar] [CrossRef]
- Commission for Energy Regulation (CER). Smart Metering Trial Data Publication. Available online: http://www.cer.ie/electricity-gas/smart-metering (accessed on 10 July 2015).
- Huang, G.-B.; Chen, L.; Siew, C.-K. Universal approximation using incremental constructive feedforward networks with random hidden nodes. IEEE Trans. Neural Netw. 2006, 17, 879–892. [Google Scholar] [CrossRef] [PubMed]
- Rong, H.-J.; Huang, G.-B.; Sundararajan, N.; Saratchandran, P. Online sequential fuzzy extreme learning machine for function approximation and classification problems. IEEE Trans. Syst. Man Cybern. B Cybern. 2009, 39, 1067–1072. [Google Scholar] [CrossRef] [PubMed]
- Maliha, A.; Yusof, R.; Madani, A. Online sequential-extreme learning machine based detector on training-learning-detection framework. In Proceedings of the 2015 10th Asian Control Conference (ASCC), Kota Kinabalu, Malaysia, 31 May–3 June 2015; pp. 1–5.
- Zhai, J.; Wang, J.; Wang, X. Ensemble online sequential extreme learning machine for large data set classification. In Proceedings of the 2014 IEEE International Conference on Systems, Man and Cybernetics (SMC), San Diego, CA, USA, 5–8 October 2014; pp. 2250–2255.
- Weather Forecast and Report. Available online: http://www.wunderground.com (accessed on 18 November 2016).
Figure 1.
Load curves of the system and one domestic user on 18 August 2009.
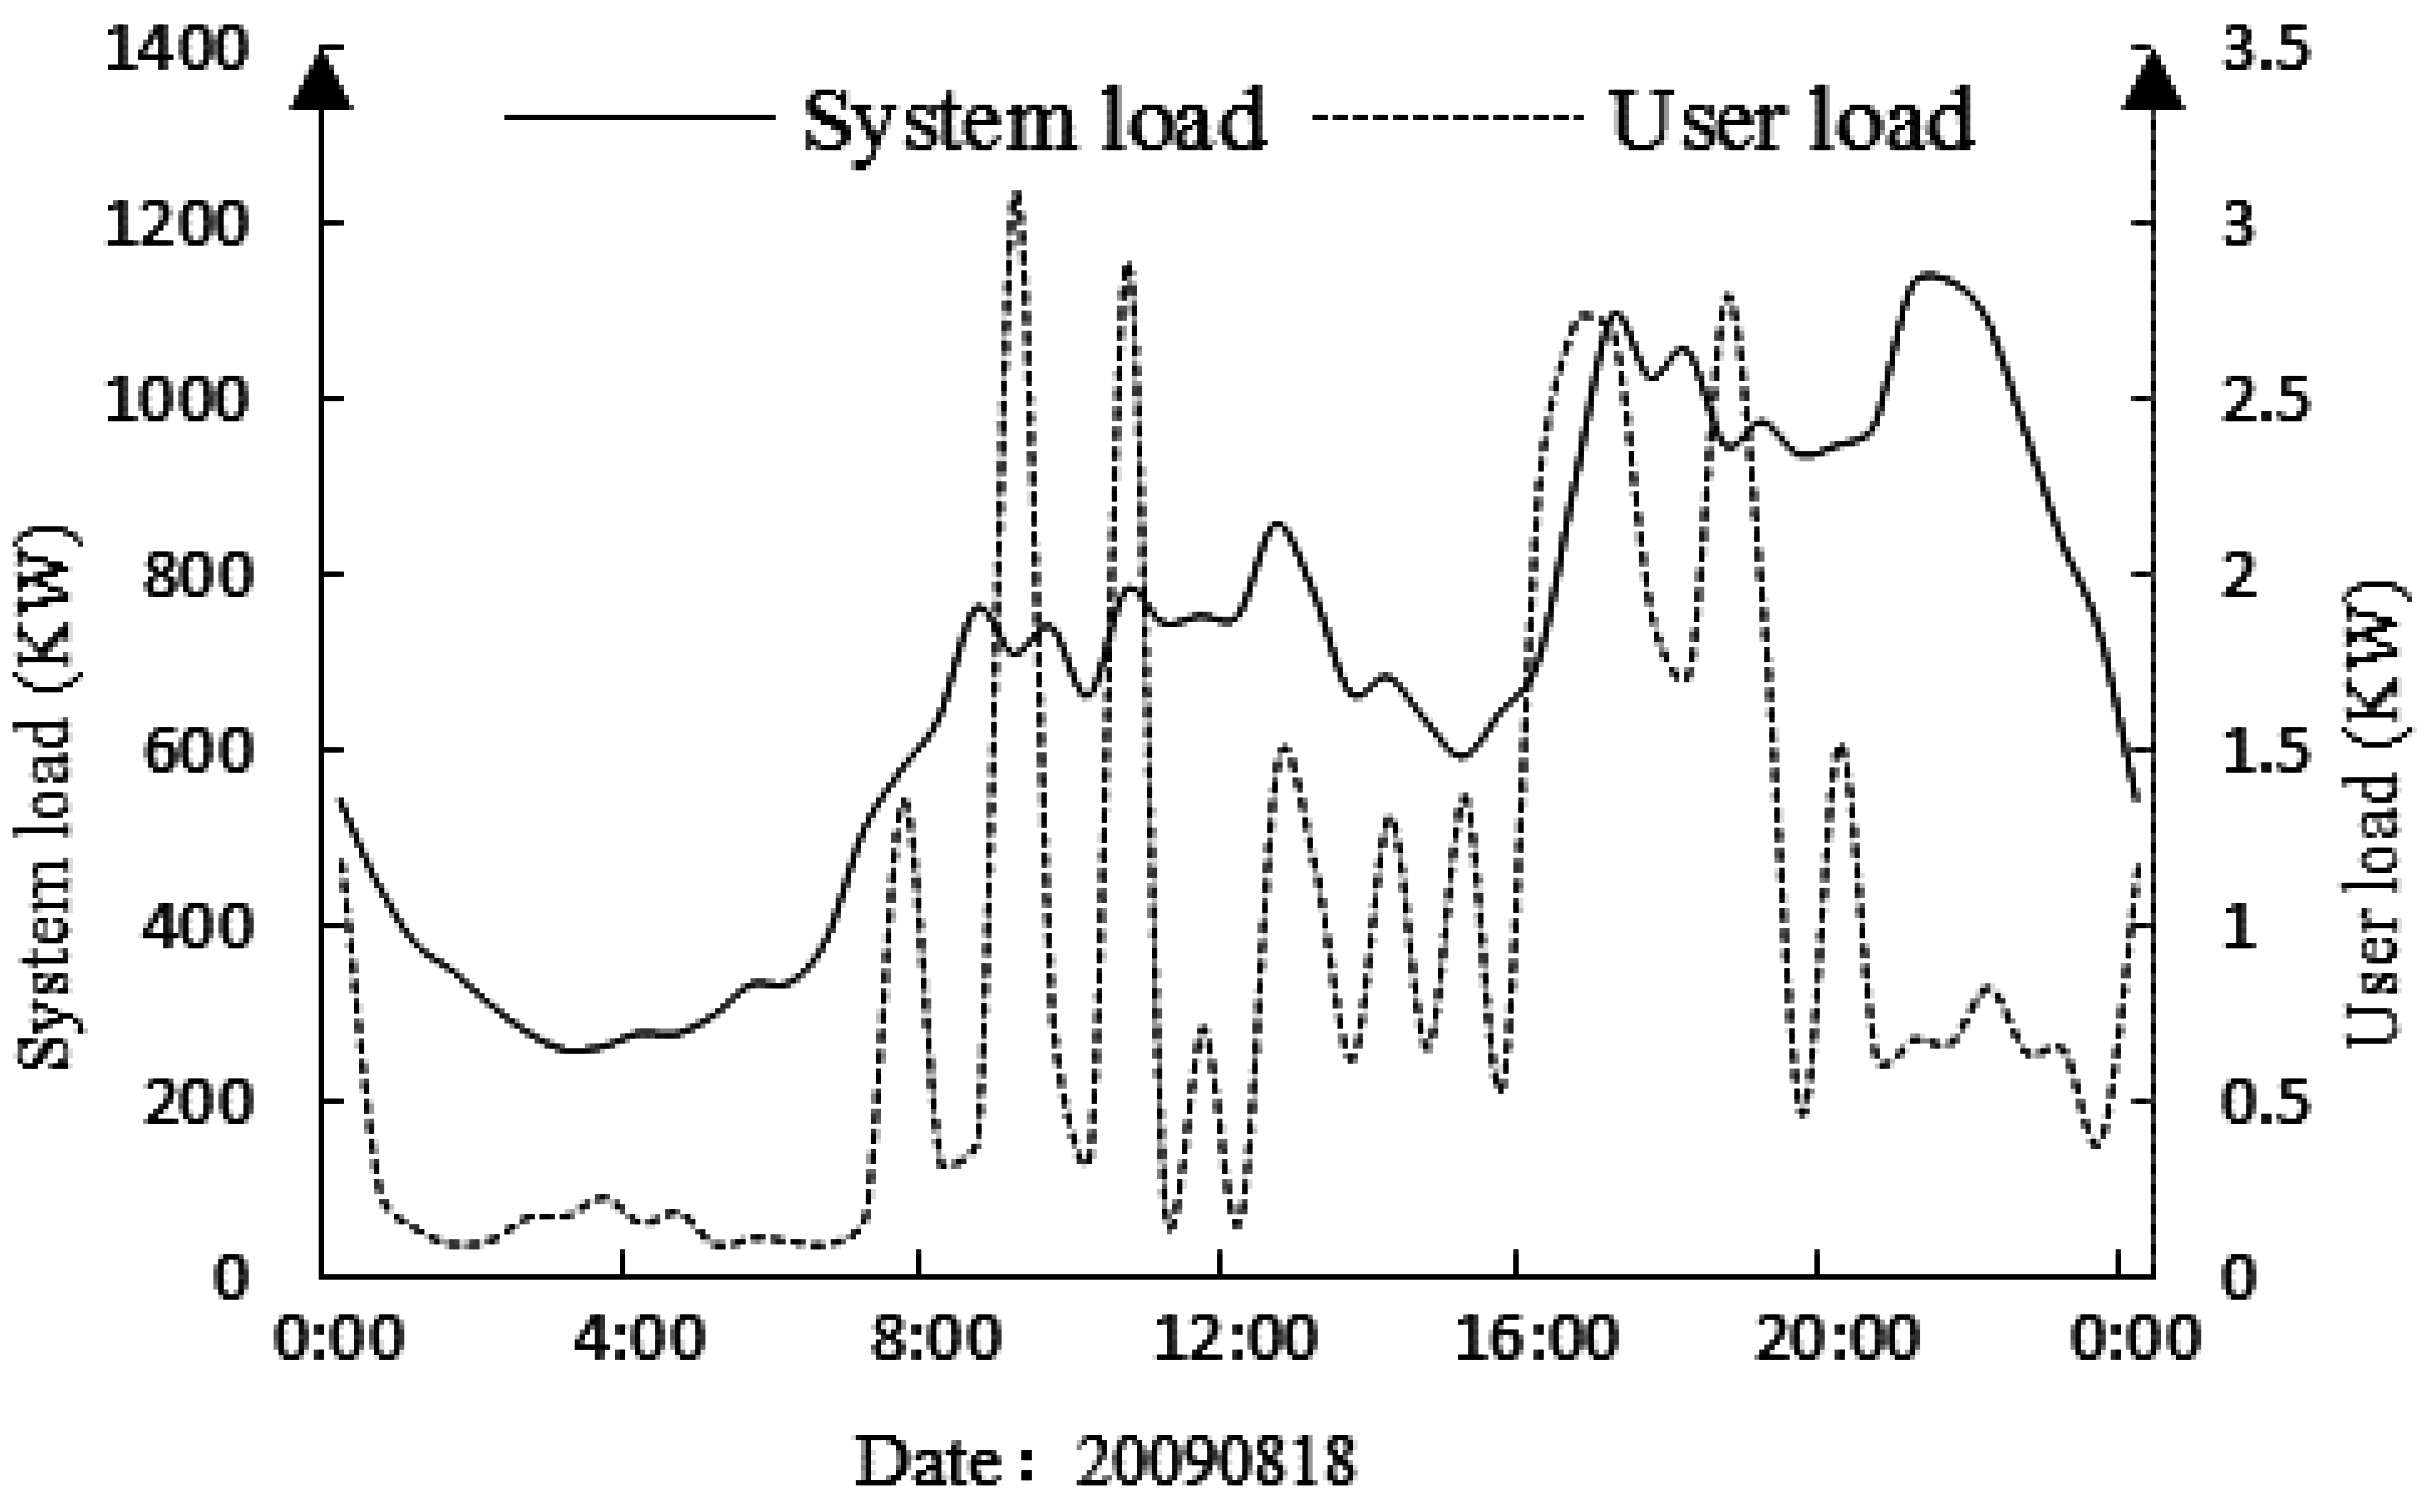
Figure 2.
Load curves of two different domestic users on 16 September 2009.

Figure 3.
Load curves of a domestic user from 19 July 2009 to 25 July 2009. (a) The user load curve on 20 July; (b) The user load curve on 21 July; (c) The user load curve on 22 July; (d) The user load curve on 23 July; (e) The user load curve on 24 July; (f) The user load curve on 25 July; (g) The user load curve on 19 July.
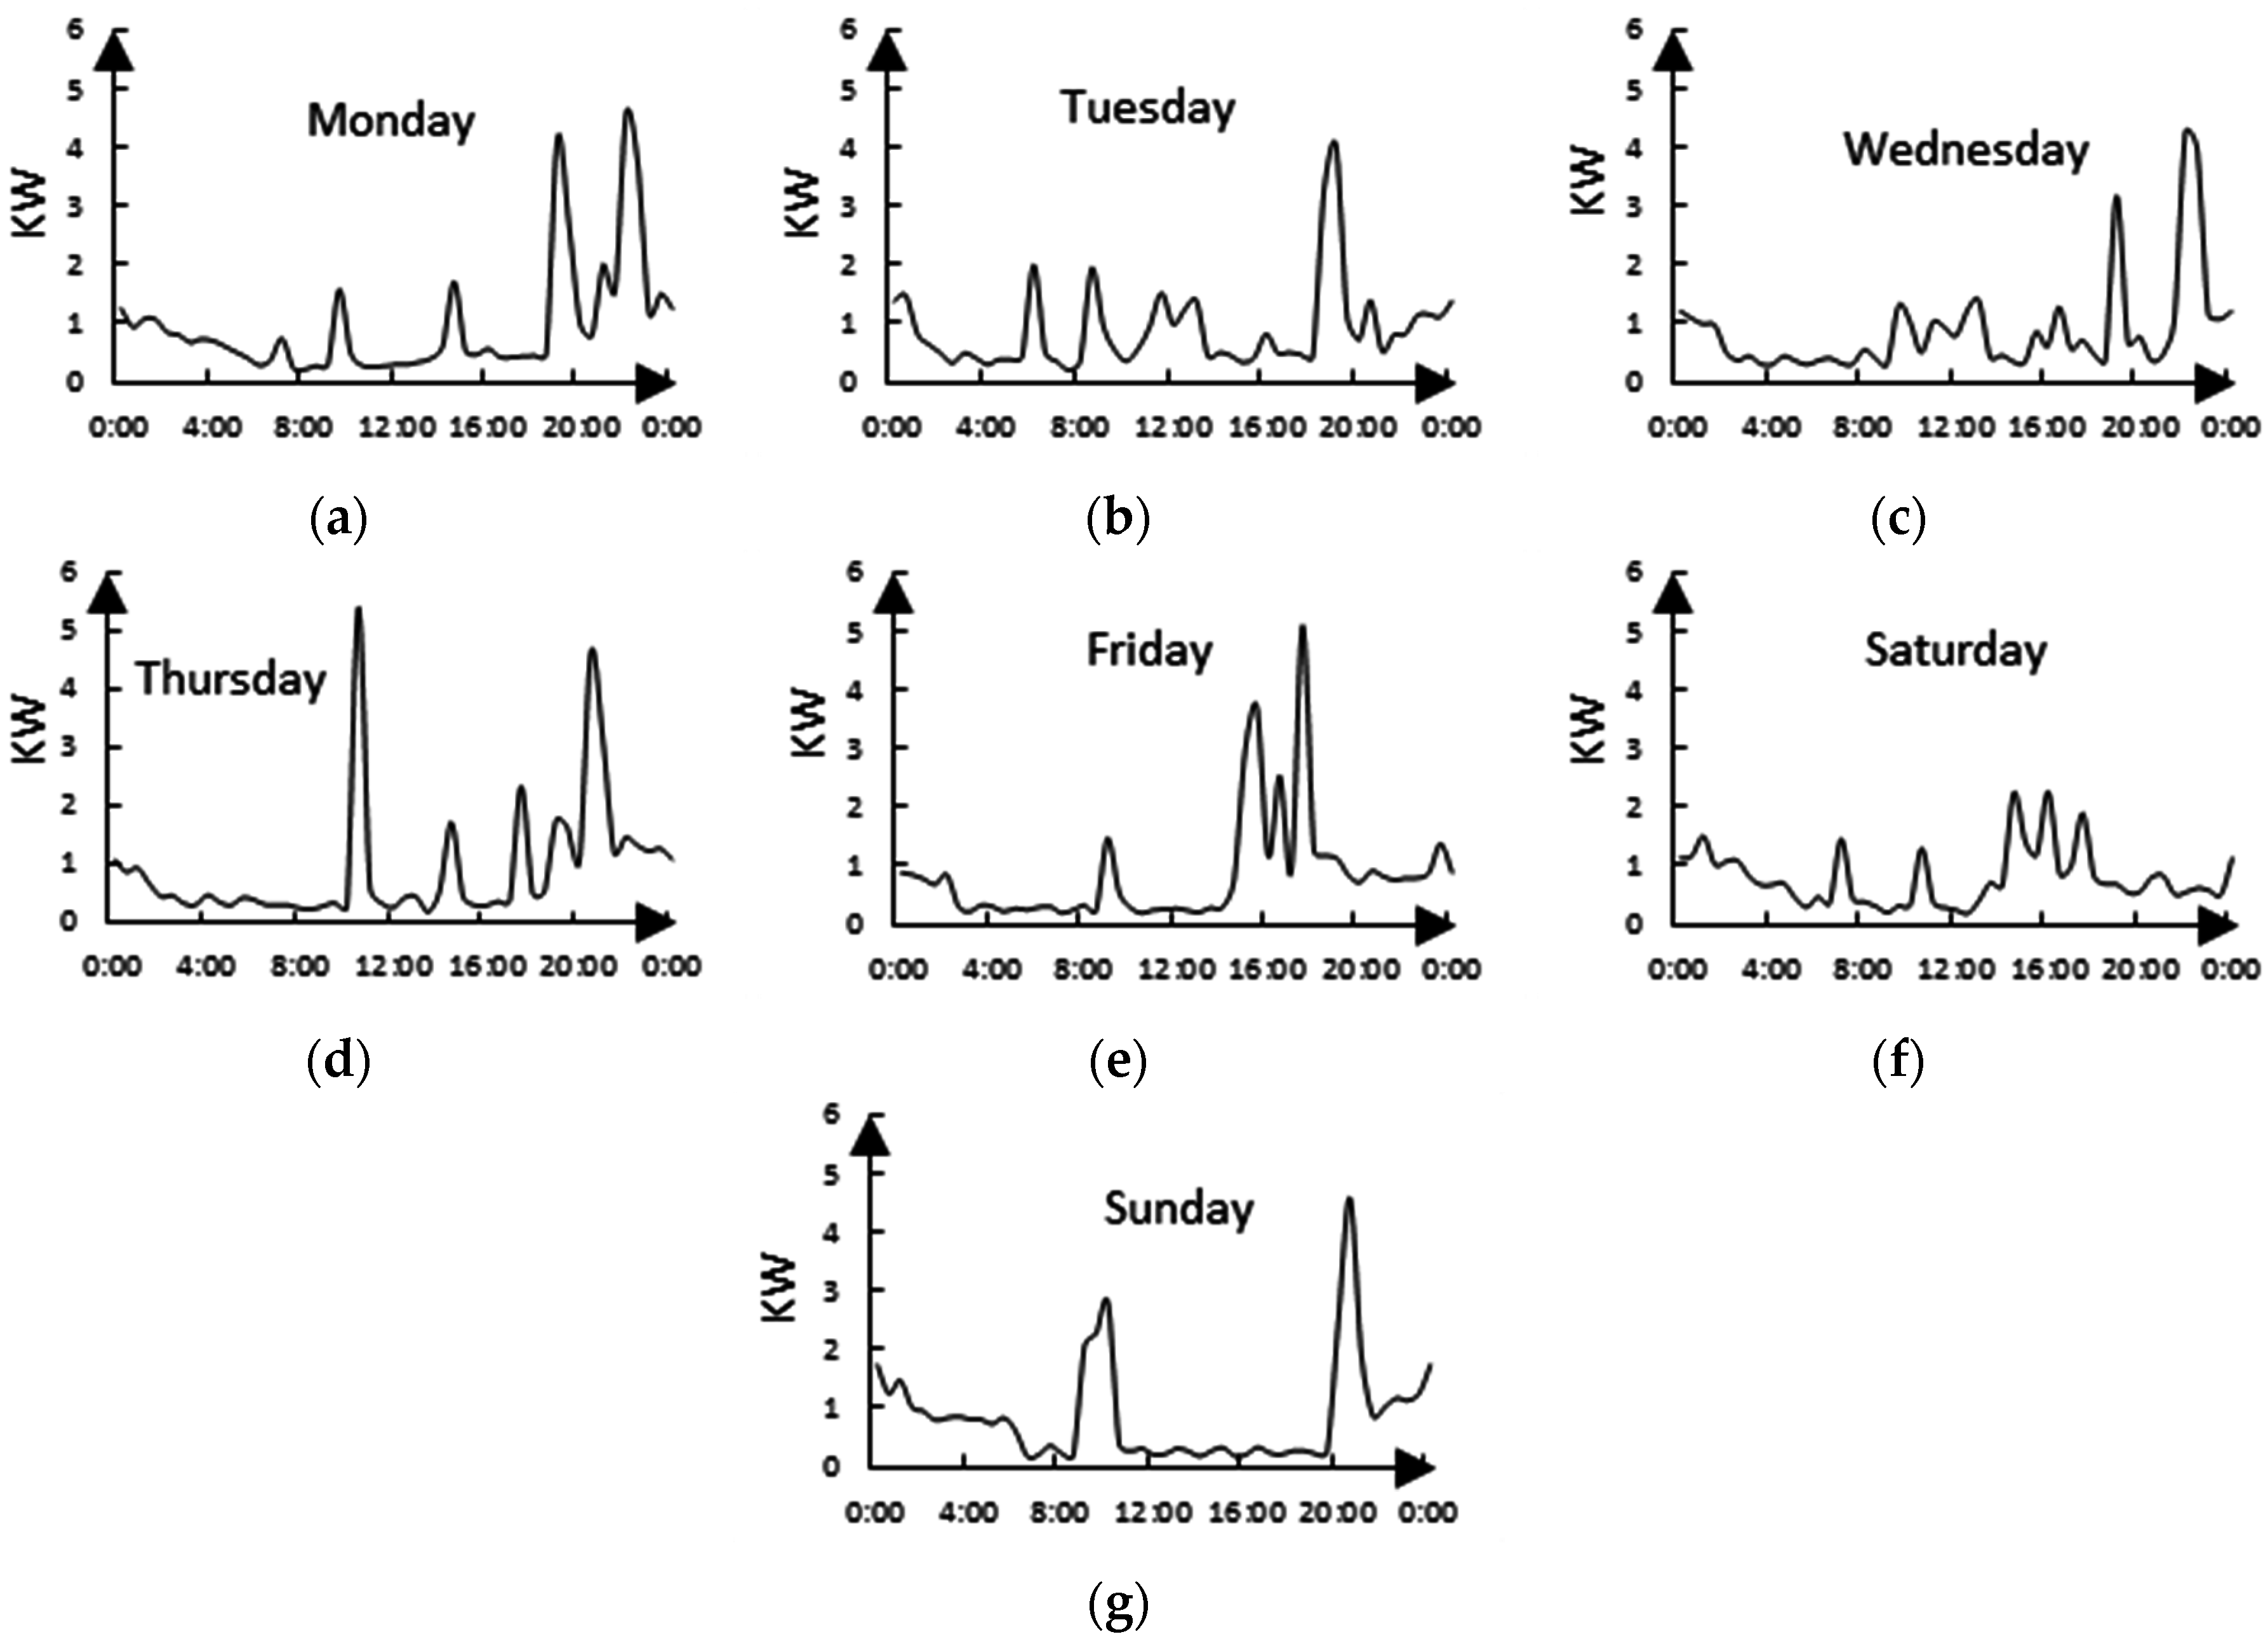
Figure 4.
The normalized load curve of a domestic user.
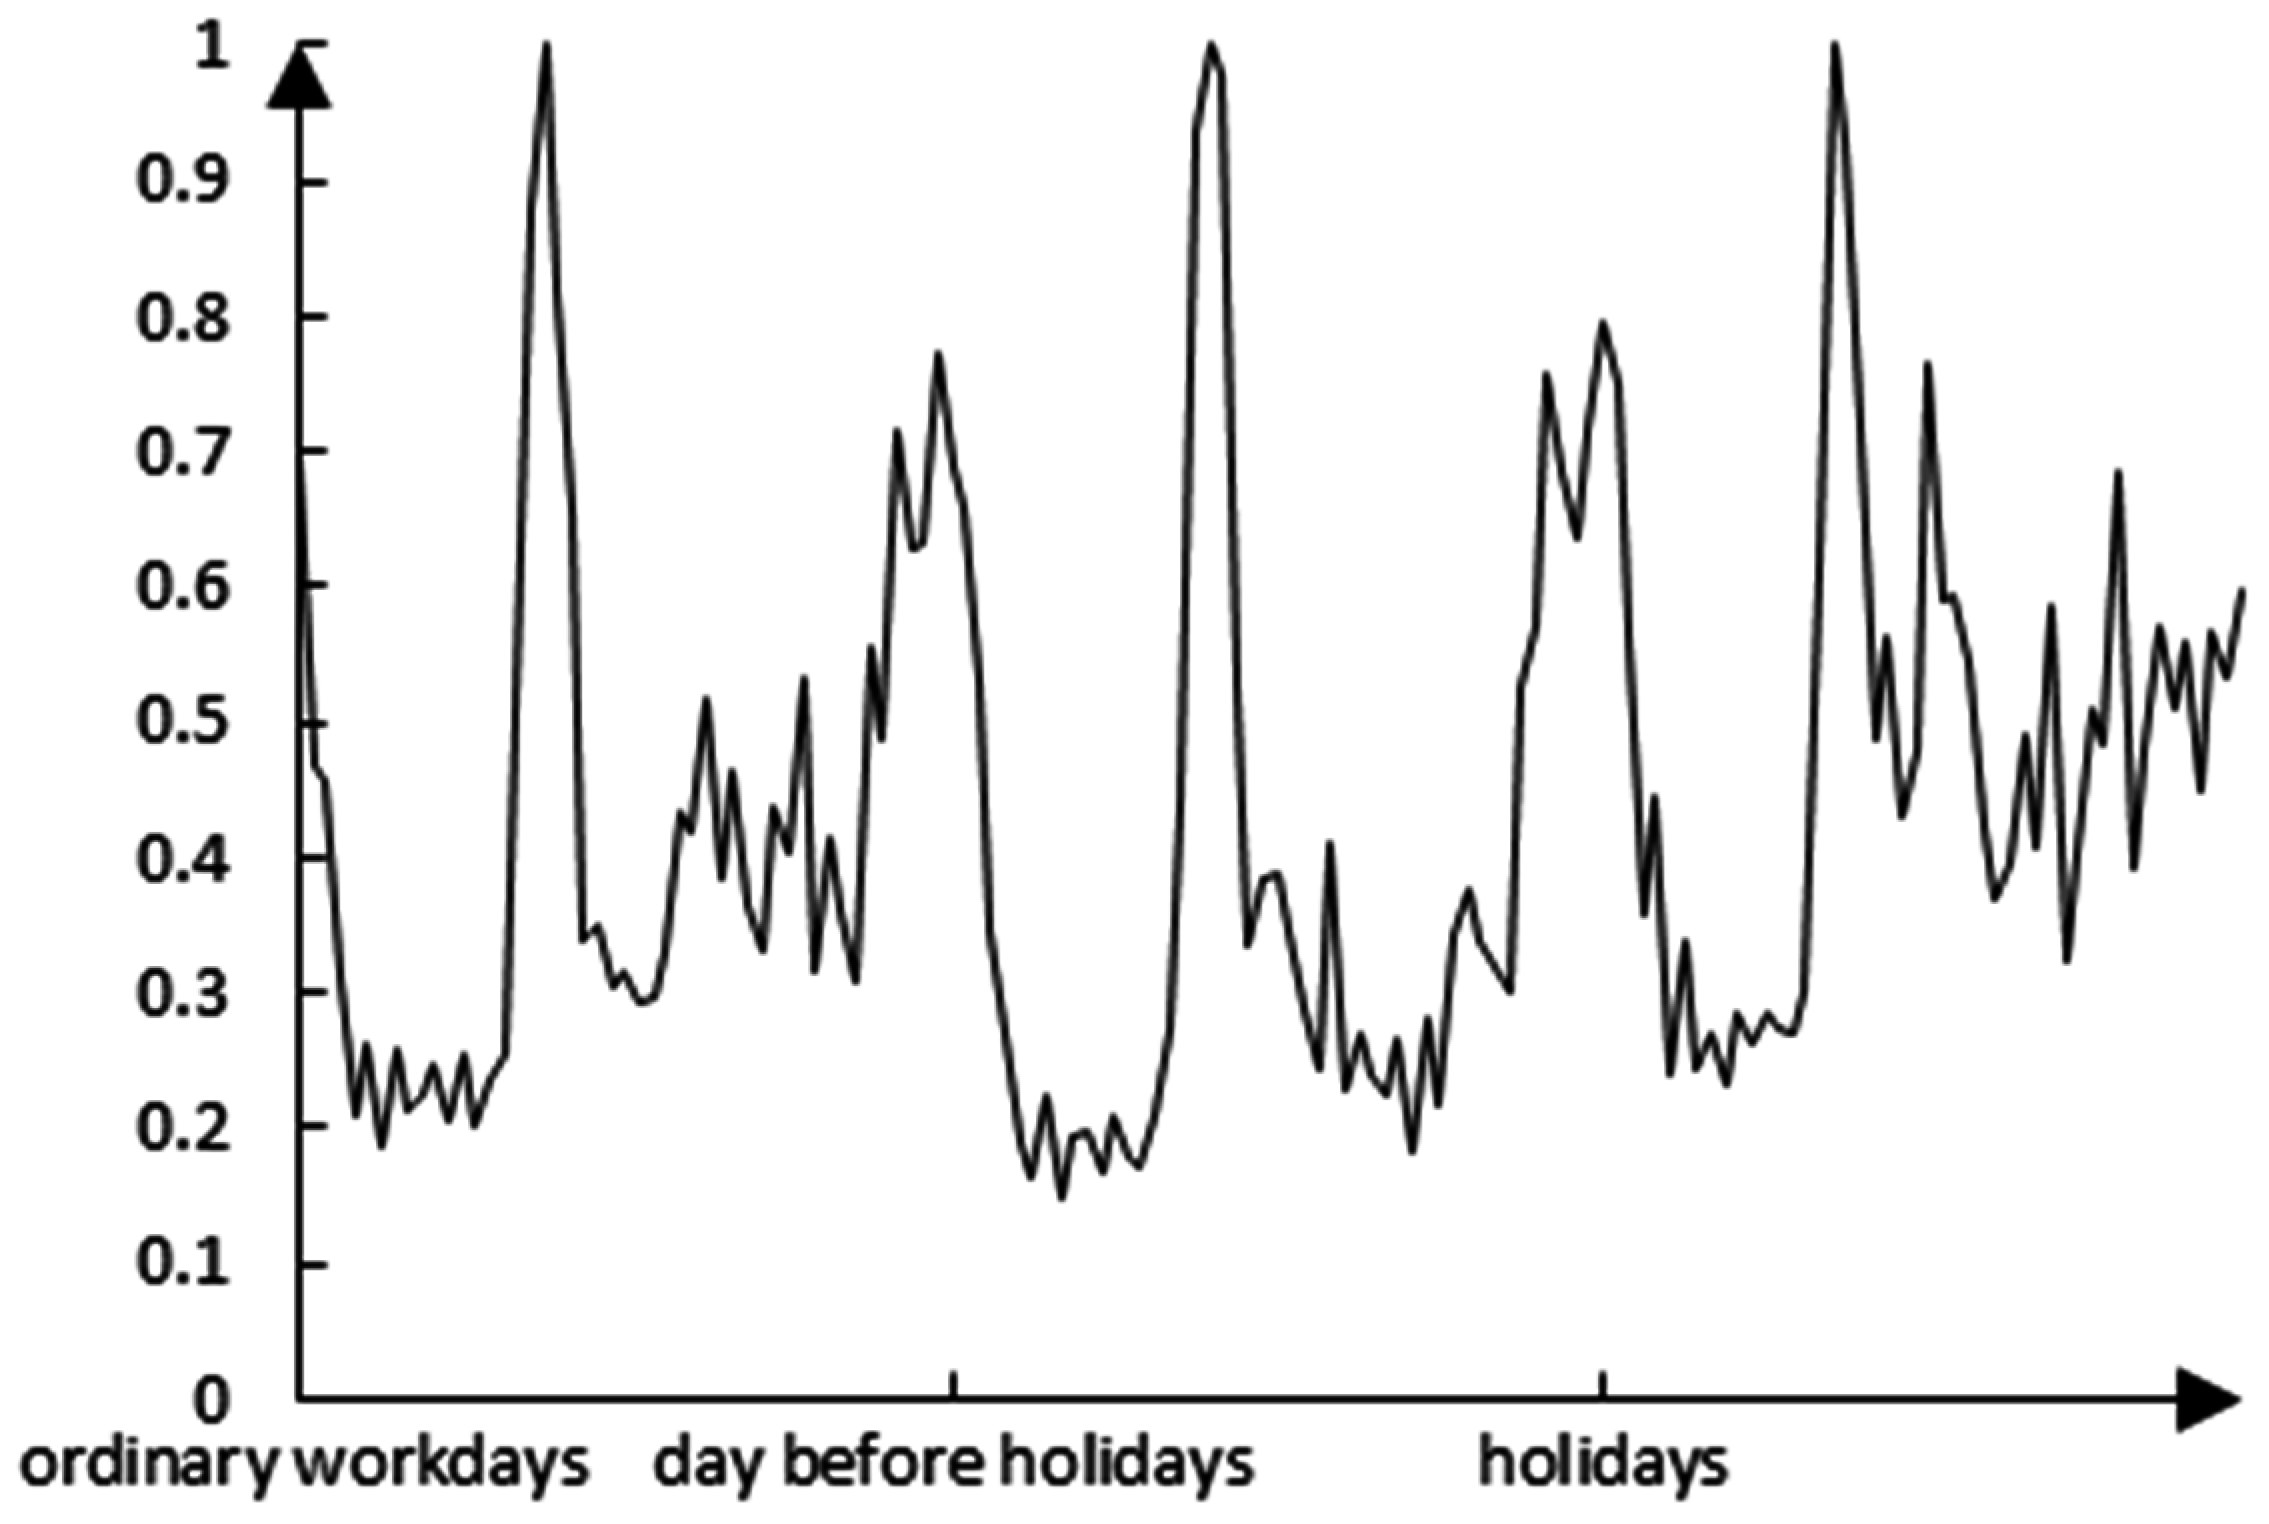
Figure 5.
The flowchart of the forecasting model based on OS-ELM (Online Sequential Extreme Learning Machine).
Figure 5.
The flowchart of the forecasting model based on OS-ELM (Online Sequential Extreme Learning Machine).

Figure 6.
The variation curves of MAPE (Mean Absolute Percent Error) under different clustering conditions in experiment A.
Figure 6.
The variation curves of MAPE (Mean Absolute Percent Error) under different clustering conditions in experiment A.
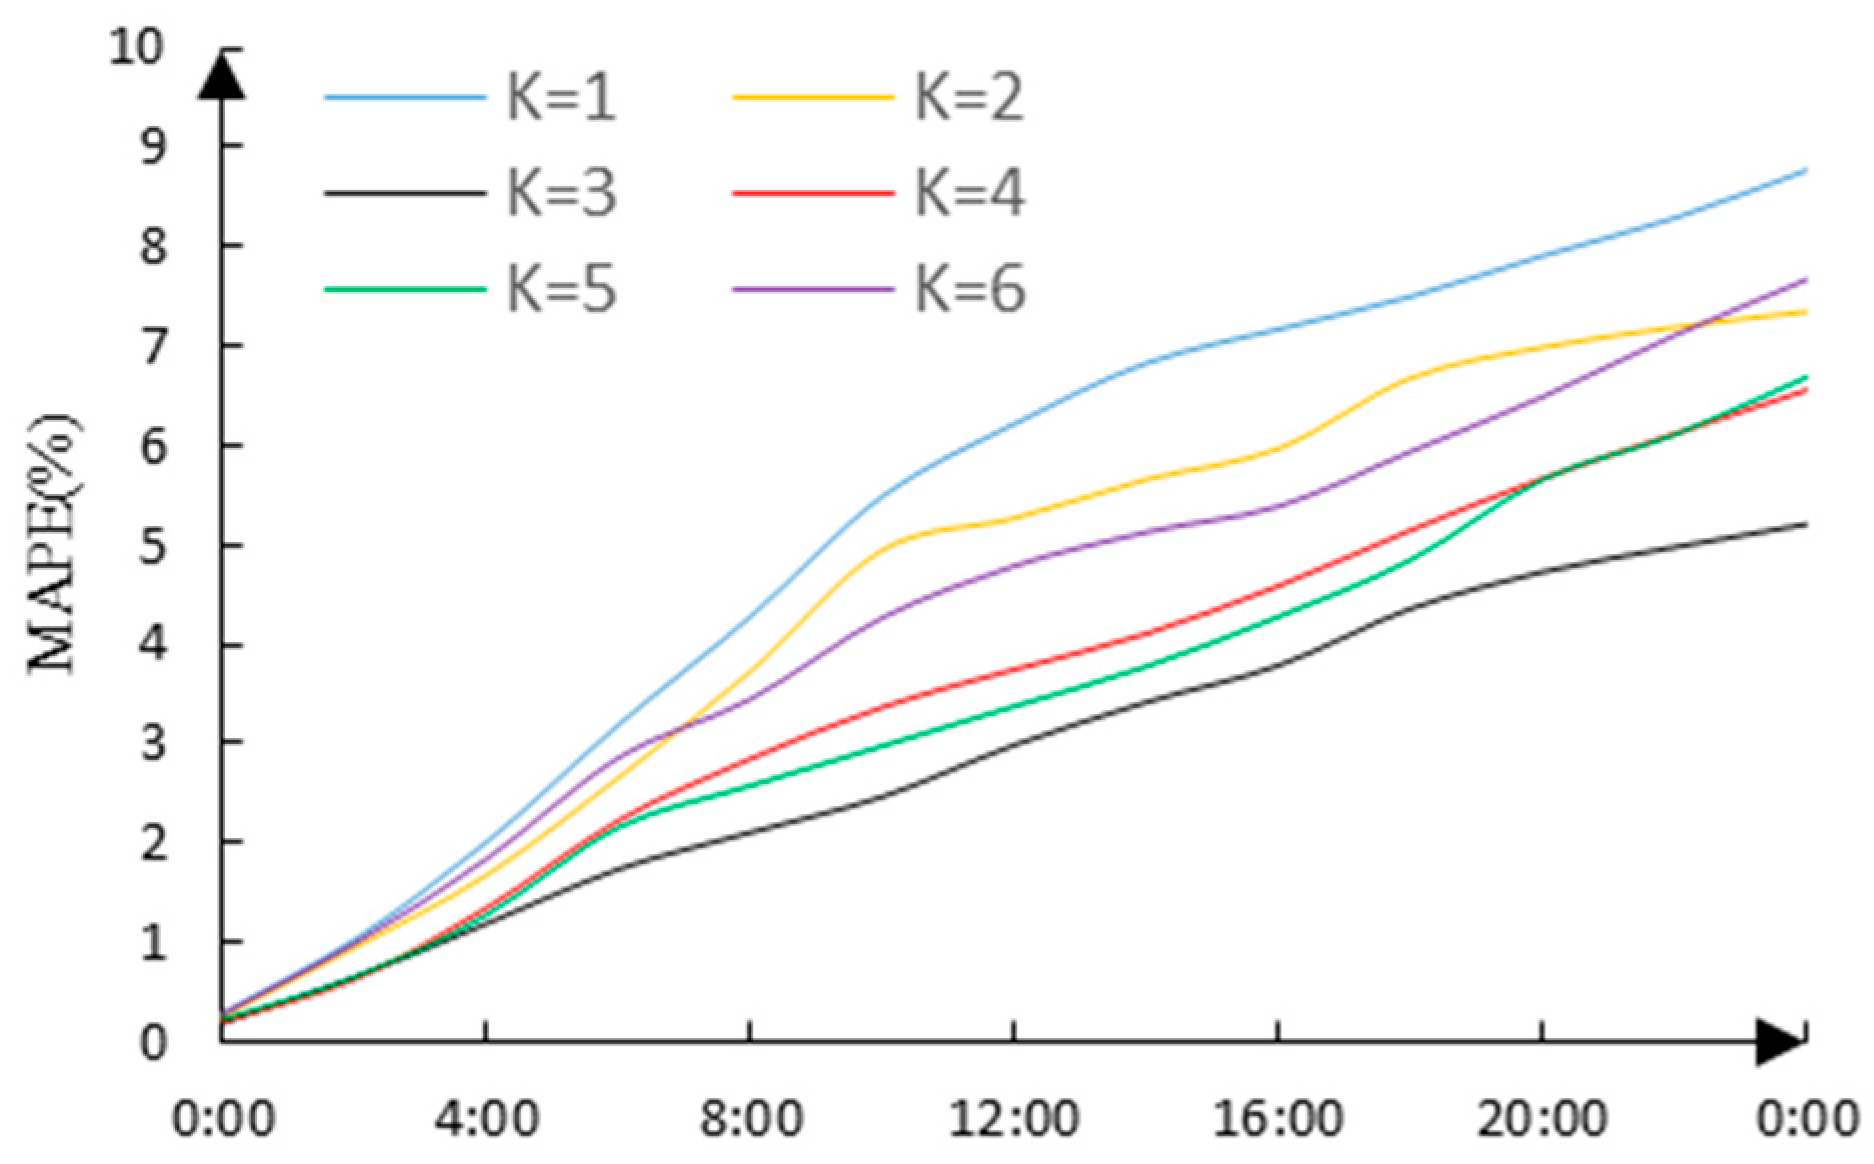
Figure 7.
The variation curves of MAPE under different clustering conditions in experiment B.
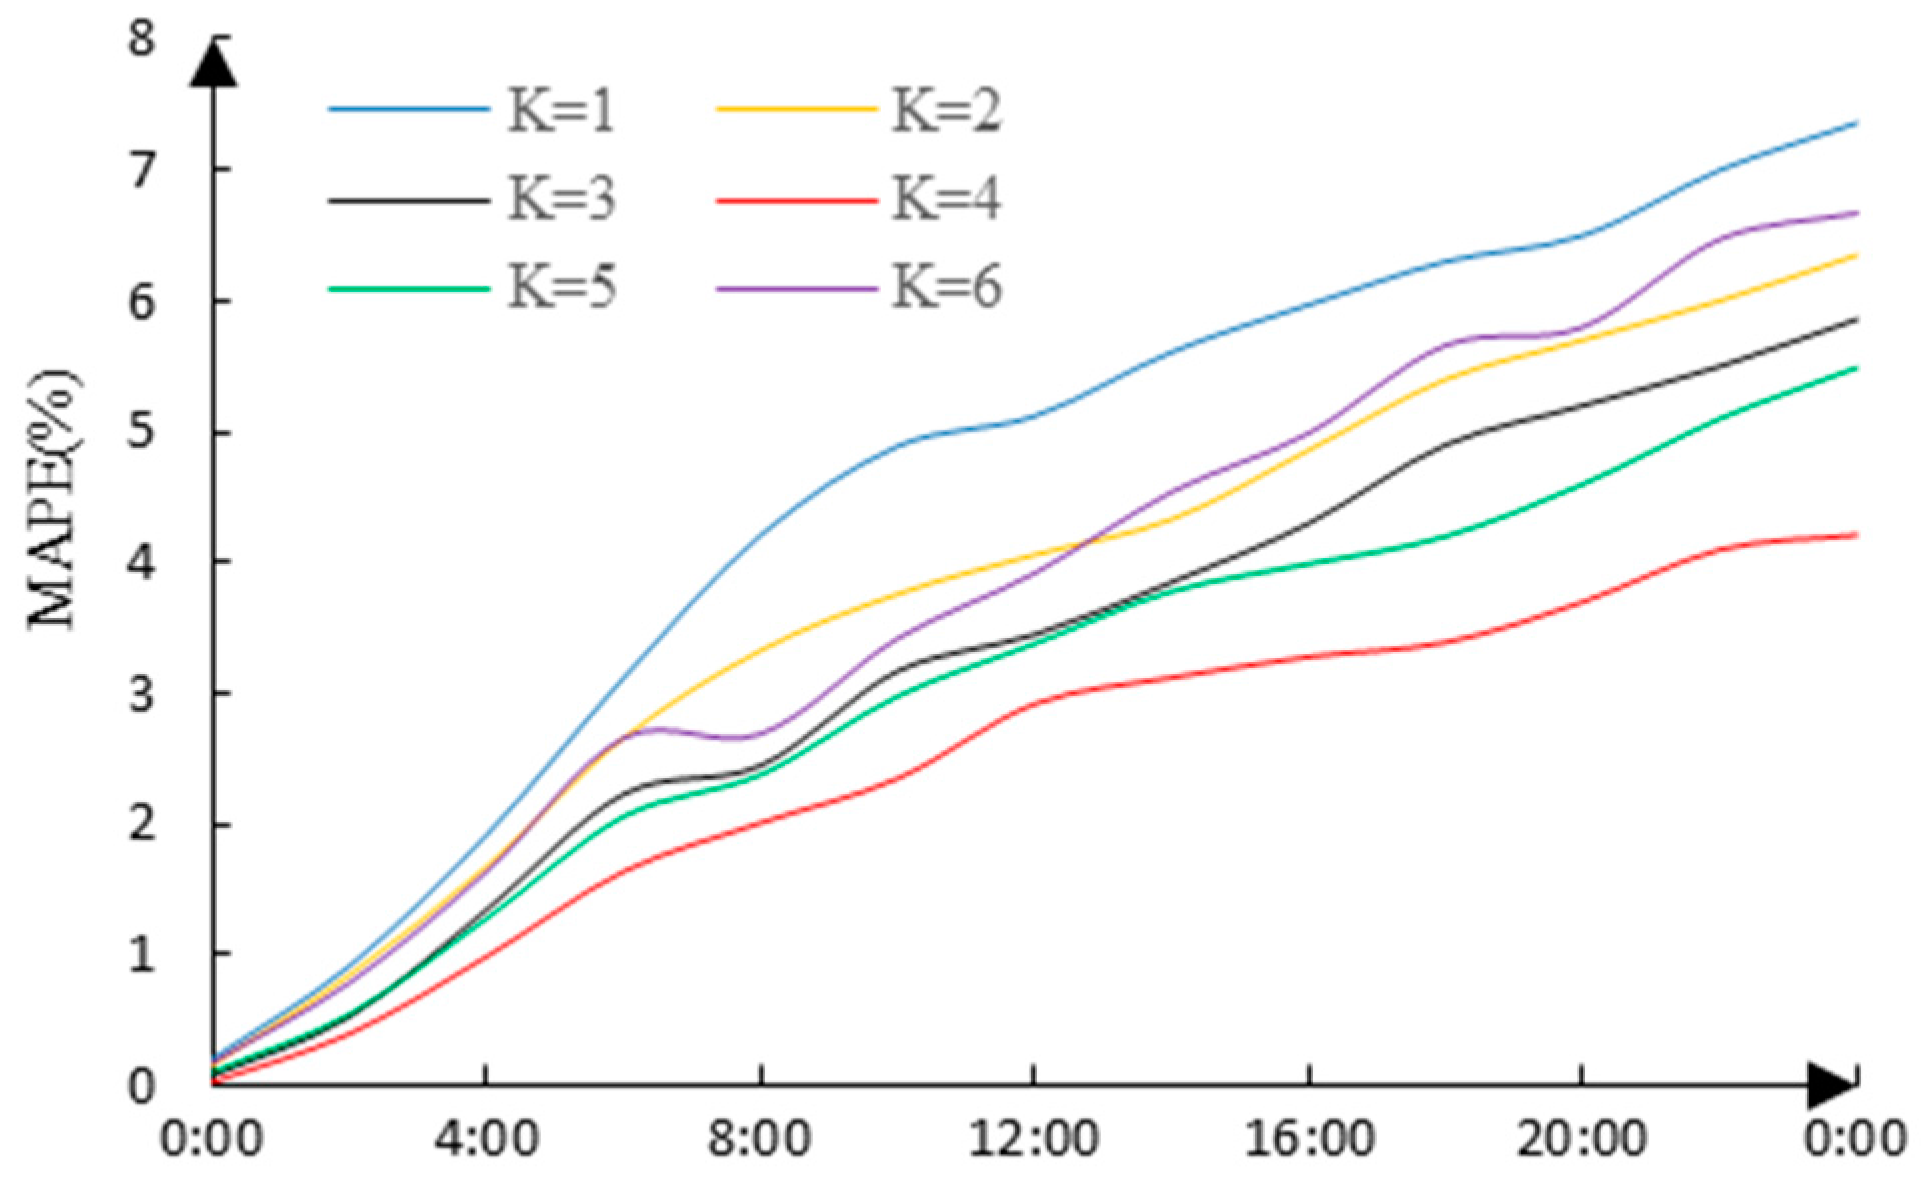
Figure 8.
The variation curves of MAPE under different clustering conditions in experiment C.
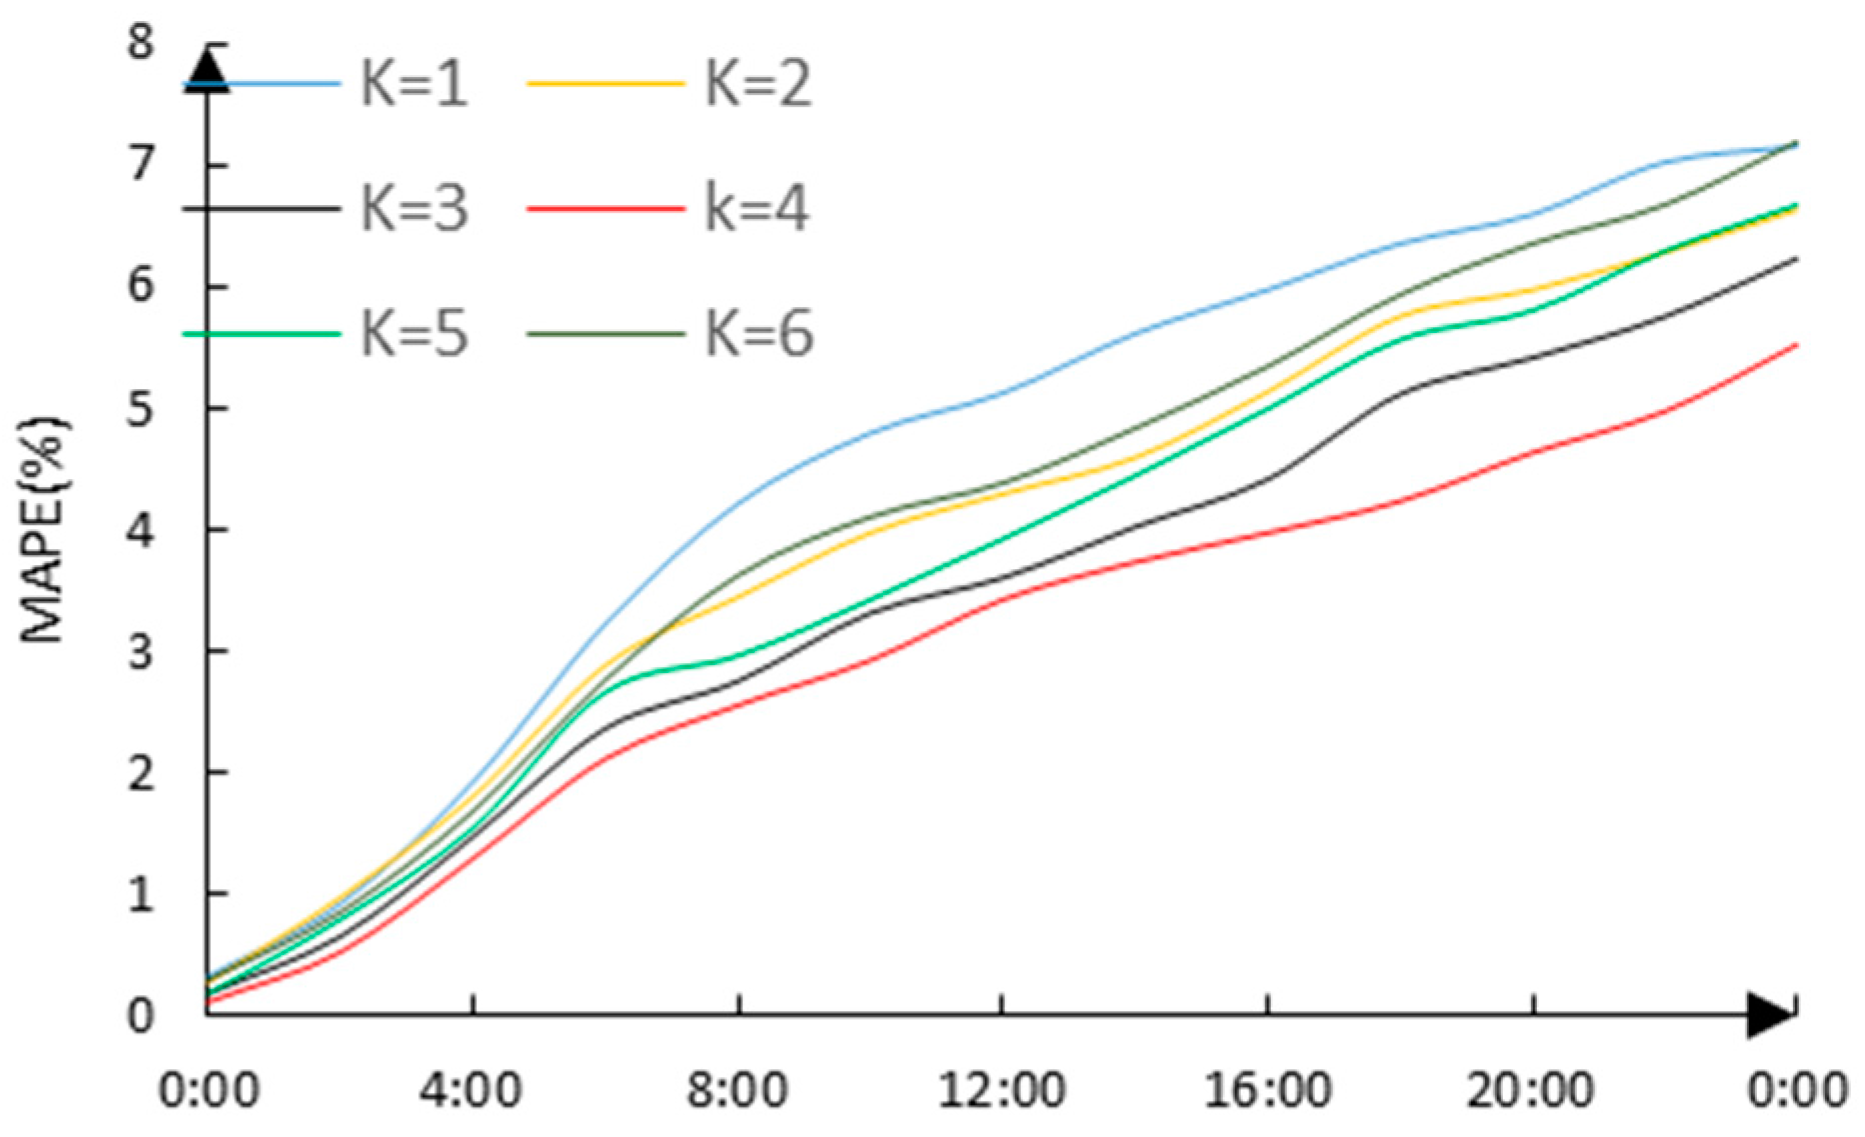
Figure 9.
The effect pictures as the number of clusters is four. (a) The first cluster; (b) The second cluster; (c) The third cluster; (d) The fourth cluster.
Figure 9.
The effect pictures as the number of clusters is four. (a) The first cluster; (b) The second cluster; (c) The third cluster; (d) The fourth cluster.

| Dimension | Variables | Description |
|---|---|---|
| Historical Load | The load from two hours before the current time | |
| Historical Load | The load from 5 days with the same date type and time before the current time | |
| Temperature | The highest temperature, the lowest temperature, and average temperature of the current day |
Table 2.
The maximum and average MAPE of the load forecasting under different clustering conditions in experiment A.
| K | MAX-MAPE (%) | MID-MAPE (%) |
|---|---|---|
| K = 1 | 8.77 | 5.31 |
| K = 2 | 7.35 | 4.56 |
| K = 3 | 5.21 | 2.91 |
| K = 4 | 6.56 | 3.58 |
| K = 5 | 6.69 | 3.43 |
| K = 6 | 7.67 | 4.32 |
Table 3.
The maximum and average MAPE of load forecasting under different clustering conditions in experiment B.
| K | MAX-MAPE (%) | MID-MAPE (%) |
|---|---|---|
| K = 1 | 7.36 | 4.55 |
| K = 2 | 6.42 | 3.78 |
| K = 3 | 5.84 | 3.30 |
| K = 4 | 4.21 | 2.47 |
| K = 5 | 5.49 | 3.06 |
| K = 6 | 6.67 | 3.81 |
Table 4.
The maximum and average MAPE of load forecasting under different clustering conditions in experiment C.
| K | MAX-MAPE (%) | MID-MAPE (%) |
|---|---|---|
| K = 1 | 7.15 | 4.56 |
| K = 2 | 6.63 | 3.99 |
| K = 3 | 6.23 | 3.48 |
| K = 4 | 5.52 | 3.07 |
| K = 5 | 6.67 | 3.79 |
| K = 6 | 7.19 | 4.15 |
© 2016 by the authors; licensee MDPI, Basel, Switzerland. This article is an open access article distributed under the terms and conditions of the Creative Commons Attribution (CC-BY) license (http://creativecommons.org/licenses/by/4.0/).
Share and Cite
MDPI and ACS Style
Li, Y.; Guo, P.; Li, X. Short-Term Load Forecasting Based on the Analysis of User Electricity Behavior. Algorithms 2016, 9, 80. https://doi.org/10.3390/a9040080
AMA Style
Li Y, Guo P, Li X. Short-Term Load Forecasting Based on the Analysis of User Electricity Behavior. Algorithms. 2016; 9(4):80. https://doi.org/10.3390/a9040080
Chicago/Turabian StyleLi, Yuancheng, Panpan Guo, and Xiang Li. 2016. "Short-Term Load Forecasting Based on the Analysis of User Electricity Behavior" Algorithms 9, no. 4: 80. https://doi.org/10.3390/a9040080
Note that from the first issue of 2016, this journal uses article numbers instead of page numbers. See further details here.