Variation in the Canadian Fire Weather Index Thresholds for Increasingly Larger Fires in Portugal


Centro de Investigação e Tecnologias Agroambientais e Biológicas, CITAB, Universidade de Trás-os-Montes e Alto Douro (UTAD), Quinta dos Prados, Apartado 1013, 5000-801 Vila Real, Portugal
Forests 2019, 10(10), 838; https://doi.org/10.3390/f10100838
Submission received: 21 August 2019
/
Revised: 16 September 2019
/
Accepted: 23 September 2019
/
Published: 24 September 2019
(This article belongs to the Special Issue Forest Fire Risk Prediction)
Abstract
:Forest fire management relies on fire danger rating to optimize its suite of activities. Limiting fire size is the fire management target whenever minimizing burned area is the primary goal, such as in the Mediterranean Basin. Within the region, wildfire incidence is especially acute in Portugal, a country where fire-influencing anthropogenic and landscape features vary markedly within a relatively small area. This study establishes daily fire weather thresholds associated to transitions to increasingly larger fires for individual Portuguese regions (2001–2011 period), using the national wildfire and Canadian fire weather index (FWI) databases and logistic regression. FWI thresholds variation in relation to population density, topography, land cover, and net primary production (NPP) metrics is examined through regression and cluster analysis. Larger fires occur under increasingly higher fire danger. Resistance to fire spread (the fire-size FWI thresholds) varies regionally following biophysical gradients, and decreases under more complex topography and when NPP and occupation by flammable forest or by shrubland increase. Three main clusters synthesize these relationships and roughly coincide with the western north-central, eastern north-central and southern parts of the country. Quantification of fire-weather relationships can be improved through additional variables and analysis at other spatial scales.
1. Introduction
Exposure to increasingly severe and anomalous fire weather makes fire disasters a growing global concern, especially where flammable vegetation and developed areas intermingle [1]. Such is the case of the Mediterranean Basin, where forest fires are prominent and an average of 360 kha burn every year in the Iberian Peninsula, southern France, Italy, and Greece, with northern and central Portugal being the hotspot of fire incidence [2]. Combination of an oceanic-influenced Mediterranean climate favoring high plant productivity and fast fuel build-up, prevalence of flammable vegetation types, rough terrain, and particularly high ignition density are credited to account for the high annual burn rates (up to 6%) observed in Portugal [3].
Forest fire management comprises a suite of activities that seek to minimize the socioeconomic and environmental impacts of fire, namely ignition prevention, fire detection, initial attack resource deployment and dispatch, large fire management, strategic planning, and fuel management (e.g., through prescribed burning) [4]. Fire danger rating supports all these activities [5] through indices calculated from current and past weather that express the individual and combined effects of atmospheric conditions and drought, as in the systems developed in Canada [6], the USA [7], and Australia [8] that describe how easily a fire will ignite and spread, and how difficult its control will be.
The Canadian forest fire weather index system (CFFWIS) [9] is commonly used in research and management applications across the world and consists of six fuel moisture and fire behavior indices calculated from ambient temperature, relative humidity, wind speed, and 24-h rainfall. Operational fire danger rating in Portugal relies on the fire weather index (FWI) of the CFFWIS, calibrated to indicate fire suppression difficulty as determined by fireline intensity in maritime pine (Pinus pinaster Ait.) stands, and considers five classes, respectively low (FWI < 8.4), moderate (8.5 < FWI < 17.1), high (17.2 < FWI < 24.5), very high (24.6 < FWI < 38.2), and extreme (FWI > 38.2) [10]. This approach offers an objective and quantitative indication of fire potential, albeit generic as it does not consider variation in fuel and terrain conditions. Consequently, outputs of fire weather systems benefit from regional interpretation and statistical evaluation against historical fire activity that lead to probabilistic assessments of fire likelihood and threshold values to define fire danger classes [5,11]. In Europe, the CFFWIS has been calibrated to depict distinct fire activity levels [12,13,14,15] and has been used to model fire activity (number of fires, burned area) across various spatiotemporal scales [16,17,18,19,20,21,22,23] and to assess the likelihood and characteristics of large fires [24,25,26,27,28].
Fire management often seeks to minimize the area burned by unplanned fire, as it equates to abating its environmental and societal negative impacts. Since fire size distribution is highly uneven, most of the burned area is accounted for by a small fraction of the total number of fires, e.g., [29], those that escape initial control efforts, are driven by extreme weather conditions, and can become catastrophic if wildland-urban interfaces are impacted [1,30]. Fire size distribution is thus useful to evaluate fire management policies and for strategic planning [31], and operational planning of pre-suppression and suppression activities can be guided by fire danger rating such that individual fires do not exceed predefined size targets [32]. Fire size depends of fire behavior characteristics, namely rate of spread (determined by weather, topography, and fuel), landscape barriers, and fire suppression effort and effectiveness, which are affected respectively by the amount of simultaneous wildfires and fire behavior [31]. The relative importance of the numerous factors involved is variable and can change depending on fire-size class or across the fire size continuum [24,26,27,33,34,35]. The need for achieving progress on the understanding of fire weather (and other influences) roles on fire growth to increasingly larger sizes is obvious, given the impacts associated to larger fires [36].
Fire activity and fire regimes, including fire-size distribution [31], vary along climatic and land use gradients [37] and result from the interaction of biophysical and social factors, hence are subject to substantial anthropogenic-induced change, through modified vegetation and ignition patterns and fire suppression [37,38,39] capable of overriding background fire-climate [40] and fire-weather [41] relationships. The regional scale context is thus relevant to better understand how fire activity (including fire size) is connected to fire weather [21,42] and, more generally, to climate [40,43].
Marked spatial contrasts in fire activity in Portugal [44] and the concomitant influence of biophysical and socioeconomic factors [45,46,47] motivates this study examination of regional fire activity in relation to fire weather. I hypothesize that larger fire development in response to increasingly severe fire weather is dependent on land use and vegetation, topography, and variables affecting human fire initiation and control, which should be reflected in regionally variable fire size-weather relationships.
2. Materials and Methods
2.1. Data
This study relates to mainland Portugal (89,089 km2) and the 2001–2011 period, which is relatively short but was selected to ensure consistency in record keeping standards and minimize variability in fire management policies and land-use changes that could affect fire activity, e.g., [48]. The study period includes both extremely high (2003, 2005) and extremely low (2007, 2008) fire years in terms of burned area, ranging from 20.0 kha to 471.8 kha. Individual fire data (date, duration, location, and size) was sourced from the Portuguese rural fire database [49] and comprised 333,378 records for 2001–2011, corresponding to a burned area of 1671.4 kha (Figure 1a), according to the national fire atlas [50].
Fire weather was described through the FWI of the CFFWIS, calculated daily from noon weather observations acquired by the Portuguese Sea and Atmosphere Institute network of automatic weather stations. Distrito (n = 18, Figure 1b) is the administrative regional scale that underpins fire preparedness and suppression organization and decision-making in Portugal. The FWI at the region (i.e., distrito) level was obtained by averaging the FWI values of the stations (between 2 and 7) located within each region. The fraction of fire starts that attained or exceeded increasingly larger size thresholds were calculated for each combination of region and day of the time series, respectively 0.01, 0.1, 1, 10, 100, 500, and 1000 ha. Those fractions were then recoded as 0 or 1, respectively for days with none and one or more fires belonging to a given size class; no-fire days were also attributed 0. Thus, each fire size-based partition divided the whole dataset in two subsets.
A number of variables expected to influence fire-weather relationships were calculated for each region. Population density, as a strong determinant of ignition density [51], correlation with unburnable land and road network density, and a relevant factor in fire control response time and available resources, was obtained by averaging the 2001 and 2011 national census.
Topography and terrain characteristics influence ignition patterns, fire behavior, and fire suppression operations and were derived from a 25-m resolution digital elevation model: Elevation, slope, and the topographic ruggedness index (TRI) [52] that expresses the average elevation change between any point on a digital grid and the surrounding area.
Net primary productivity (NPP, t C year−1) was used as a generic indicator of potential fuel load and was calculated for each region from the gridded (0.25° resolution) spatial data product global patterns in net primary productivity [53,54]. Data from the 5th National Forest Inventory [55] was used to calculate the regional fractions of land covered by agriculture, shrubland, and forest. Additionally, a “flammable forest” category was calculated as the fraction of forest cover comprised of maritime pine or eucalypt (mostly Eucalyptus globulus Labill.). These species tend to occupy large and continuous tracts of the landscape, often in the form of naturally-regenerated and highly-flammable low and dense stands [56], and are more prone to fire than any other forest type [57,58].
2.2. Data Analyses
Summary statistics were calculated for the regional variation of daily FWI and percentages of days with fires ≥0.01, 0.1, 1, 100, 500, and 1000 ha. Most fires in Portugal are short-lived, as expected in an anthropogenic landscape under a full fire suppression policy, e.g., only 4.1% of the fires in the database lasted more than 8 h, and only 0.9% extended beyond 24 h; Table S1 gives percentiles of fire duration for each of the binned fire-size classes. The duration of active fire spread is even smaller, as fire duration in the database is the time elapsed between fire detection and fire extinction. Consequently, I reasonably assumed that fire weather on the day a fire starts determines whether it will grow to a size larger than the thresholds considered [59], which is further supported by the fact that in Portugal fires larger than 2500 ha typically (interquartile range) attain 1000 ha in 2 h to 10 h [25].
Logistic regression [60] with the FWI of the fire-start day as the independent variable was employed to model the daily likelihood of fires ≥0.01, 0.1, 1, 10, 100, 500, and 1000 ha at the regional level. The χ2 likelihood ratio test was used to assess statistical significance (p < 0.05). Model classification performance was assessed with the area under the receiver operating characteristic (ROC) curve (AUC) and the misclassification rate (fraction of the observations incorrectly classified by the model) was calculated. A probability of 0.5 was the cut-off assumed for a fire-day event and the corresponding FWI was calculated from the fitted models for each region and fire size class. Correlations between the FWI thresholds for the various fire size classes were inspected, as well as between those and the regional median and 90th percentile of the FWI.
A correlation analysis was carried out between the variables expected to explain patterns in fire-FWI relationships, i.e., population density and the biophysical variables previously described. The regional variation in FWI thresholds allowing increasingly larger fires was examined as a function of those variables, but only the classes more relevant for fire management were retained, i.e., ≥1, 100, and 1000 ha, respectively FWI_1, FWI_100 and FWI_1000. Univariate least-squares regression analysis was carried out on log-transformed variables, to achieve more Gaussian distributions and because visual inspection indicated adequate fit by power functions. Residuals were checked for normality and homoscedasticity. To aid in interpretation, and anticipating common fire-FWI relationships, the 18 regions were allocated to three higher-level regions, respectively North and Central West (NCW), North and Central East (NCE), and South (S).
Combining the independent context variables with the FWI thresholds and applying hierarchical cluster analysis enabled the identification of similar regions in respect to fire-FWI relationships; as fires ≥1000 ha were very scarce in some regions, the corresponding FWI threshold was excluded from the analysis.
3. Results
Regional diversity in the putative factors related with fire activity in Portugal was manifest (Table 1). In particular, variation in population density approached two orders of magnitude. The remaining variables varied at least approximately two-fold (NPP and agriculture land cover) and up to 10- and 12-fold, respectively shrubland and flammable forest cover.
Correlation analysis indicates that regions characterized by rougher terrain tended to have less agriculture, more flammable forest, and, especially, more shrubland; forest and shrubland fractions were negatively correlated; and the flammable forest fraction increased with NPP (Table S2). Northwestern and southern Portugal were dissimilar in population density, terrain, NPP, and land cover patterns, indicating potential enhancement of ignition density and fire spread and intensity in the former.
Inter-regional fire weather variability was relevant (Figure 2), given altitudinal differences and the east to west and south to north gradients of increasing oceanic influence that moderates the fire-prone Mediterranean climate. Northwestern Portugal regions (Viana do Castelo, Braga, Porto, Aveiro), with more temperate climate, were characterized by lower FWI values and narrower FWI ranges in contrast with the drier and warmer south of the country (Évora, Beja). Regardless of these differences, and noting that annual fire activity concentrates on a short number of days [61], the 90th percentile of the FWI was higher than the threshold for extreme fire behavior (FWI = 38) in all regions but one (Viana do Castelo).
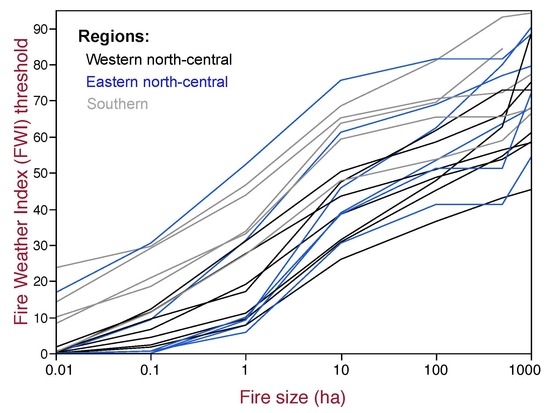
Increasingly larger fires consistently occurred on an increasingly smaller number of days (Table 2). Such a decreasing trend was particularly noticeable for fires surviving to ≥10 ha and ≥100 ha. Comparatively with other regions, large fires (≥100 ha) were a greater portion (≥3%) of the total number of fires in a few regions of the northern half of the country, namely Guarda, Vila Real, Bragança, and Viseu. Increasingly larger fires corresponded to increasingly higher FWI values (Table 3). The relative increase in FWI thresholds was especially relevant for fires ≥1 ha and ≥10 ha. Variation in the FWI thresholds among regions was quite high up to 10–99 ha fires, ranging from 26 to 76, but declined for the subsequent fire-size partition classes. While the FWI threshold for fires ≥1 ha corresponded to quite mild fire weather conditions in some regions, particularly Viana do Castelo, Vila Real, and Guarda, it increased to very high and extreme fire danger levels in others, namely Portalegre, Évora, and Faro.
The probability of distinguishing between fire and no-fire days as per the AUC varied between 0.67 and > 0.99 among the fitted logistic models, and misclassification rates ranged from < 1% to 36% (Table 3). AUC and misclassification rate tended to respectively increase and decrease with fire size, primarily reflecting the increasingly higher prevalence of no-fire days.
All fire-size FWI thresholds were significantly (p < 0.05) correlated, but the strength of the correlations diminished with fire-size dissimilarity (Table 4), e.g., r = 0.93 between the thresholds for fires ≥1 ha and fires ≥10 ha, but only r = 0.50 between the former and the threshold for fires ≥1000 ha. Nearly all FWI thresholds were strongly and positively coupled with the median FWI for all sample days (both fire and no-fire days), more closely associated with the thresholds for fires <100 ha, and with the 90th percentile of the FWI, better correlated with large-fire thresholds (Table 4).
The daily FWI threshold for fires ≥1 ha in size decreased with TRI, elevation, and the fractions of shrubland, flammable forest, and forest in general, by decreasing order of importance (Table 5). Flammable forest fraction had the strongest association with the FWI threshold for fires ≥100 ha, followed by TRI, NPP, and population density, but the p-value for the latter was just 0.052; increases in these variables implied lower thresholds. The FWI threshold for fires ≥1000 ha increased with agricultural land cover and decreased with the fraction of flammable forest and with NPP, but the amount of variation accounted for by these variables was inferior to what was attained for fires ≥1 ha and ≥100 ha using the best univariate relationships. Figure 3 shows the best fitting relationships.
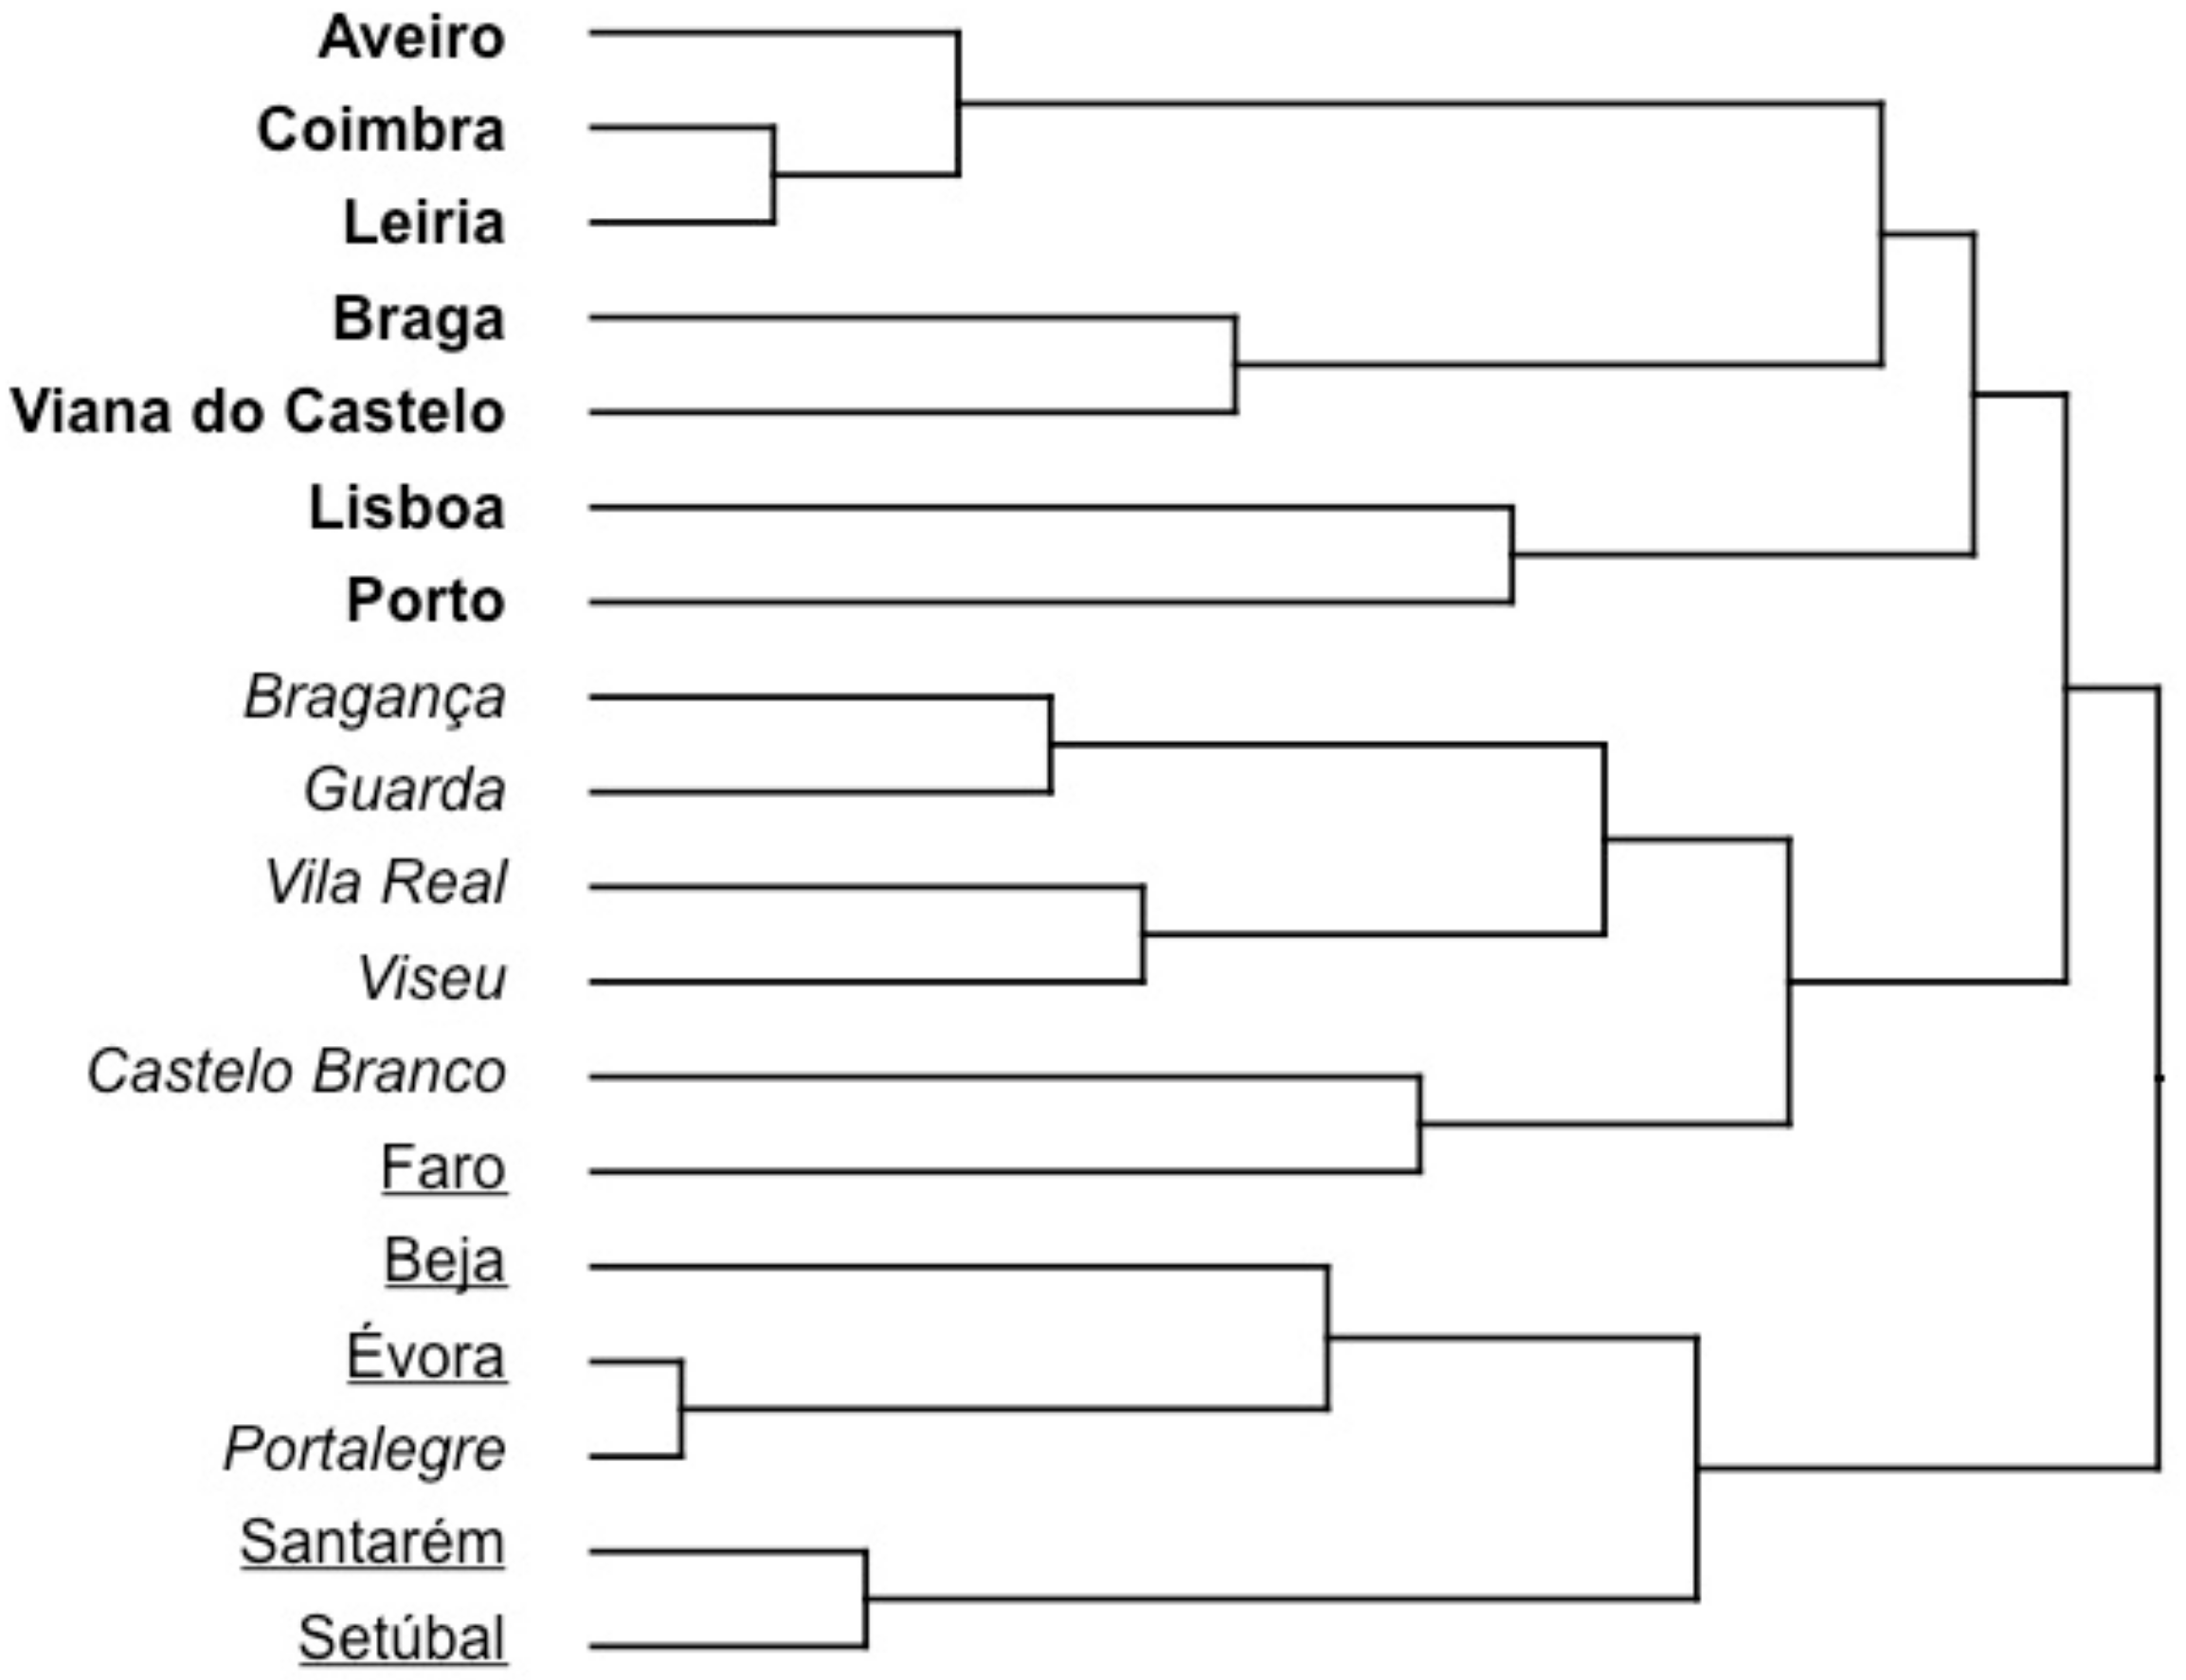
Three major groups of regions emerged from the cluster analysis that mostly conformed to the a priori supra regions (Figure 4). Low FWI thresholds, the highest population density, NPP and flammable forest fraction, and intermediate shrubland cover characterize the NCW cluster (n = 7). The NCE cluster (n = 6) did not differ from the former regarding FWI_1 but fires ≥100 ha occurred under more severe fire weather conditions, in landscapes with lower NPP, intermediate cover of flammable forest types and the highest incidence of shrubland. The uppermost FWI thresholds corresponded to the S cluster (n = 5), in association with the lowest elevation, slope, TRI, NPP and fractions of flammable forest types and shrubland, and the highest proportion of farmland. The bottom end of the clustering hierarchy was composed of contiguous regions, with two exceptions (Lisboa, Porto; and Castelo Branco, Faro).
4. Discussion
4.1. FWI Thresholds for Increasingly Larger Fires and Fire Danger Rating
As expected, increasingly larger fires are gradually restricted to a lesser number of days (Table 2), those characterized by increasingly higher FWI (Table 3). Ability of the fire danger classification [10] in operational use in Portugal to match fire activity depends on whether its representation of fire behavior can be reasonably generalized and, overall, to what extent it captures the compounded influences involved. While regional FWI thresholds for the occurrence of fires ≥10 ha were either within the very high or the extreme fire danger classes [10], all thresholds for fires ≥100 ha were within the extreme class. This operational fire danger classification indicates fire control difficulty in case a fire occurs, rather than whether it will occur and overall fire activity. Still, the current nationwide fire danger thresholds were able to signal daily conditions for significant fires (≥10 ha) and, especially, for large fires (≥100 ha), despite the existing regional variability in FWI thresholds. Lower relative differences among regions were also found in the FWI thresholds required for the occurrence of large fires versus fires <100 ha. Both findings might arise from an overriding effect of fire weather, through which fire behavior is gradually equalized among the existing forest and shrubland vegetation types [62]; differential fire preference for vegetation types disappear [57]; and fire development to significant dimensions is fast if the initial attack fails when fire behavior is above the extinction capacity, partially cancelling interregional differences in ignition density, vegetation, and terrain.
Within-region discrimination between FWI thresholds was lower for fires ≥100, ≥500, and ≥1000 ha in comparison with smaller fires. This indicates that, within a given landscape context, the response in large fire size is less than proportional to increasingly severe weather conditions reflected in the FWI. A limitation, as with any fire danger rating system, is that the FWI does not encapsulate all weather influences on fire growth, namely atmosphere structure and stability [25,63] and rapidly changing conditions or fine-scale variability resulting from thunderstorm outflows, frontal passages, or wind–terrain interactions [59]. However, results align with previous work revealing control of fire size by landscape structure [27,64]. This does not preclude weather-fuel synergies: Towards the upper end of the fire size range the response to increased meteorological fire danger is greater when fuel hazard is uniformly high across the landscape [25] and the largest fires coincide with extreme fire weather coupled with high fuel build-up [65,66].
Contemporary fire-weather relationships have been extensively examined in Portugal and the Mediterranean Basin, as described in the Introduction section. Nonetheless, there is a paucity of operationally oriented work with straightforward application to fire management decision-making. The FWI thresholds for the daily occurrence of fires of different sizes determined in this study can be viewed as an initial step in the development of a predictive system tailored to regional specificities. Additional variables are probably warranted for improved predictive performance in an operational context, namely seasonal patterns of fire occurrence, a descriptor of fire load, i.e., the suppression effort needed to tackle the fires occurring in a given region during a given time interval [4], and the ability to predict short-duration strong winds [67]. I used distrito as the regional stratification unit, to conform to the current and merely political fire-management zoning of the country, but usage of more coherent land units, e.g., phytoclimatic zones [42] or ecoregions [65], would probably result in more robust fire–weather relationships [20].
4.2. Regional Variation in Fire-Size Response to the FWI
Mainland Portugal offers an interesting opportunity to examine the interaction of natural and anthropogenic influences in determining the fire regime, given their variability within a relatively small area, roughly 600 km by 200 km. The substantial regional variation in fire weather thresholds required for wildfire development to different sizes was consistent with gradients in biophysical factors (Table 5, Figure 3). The FWI threshold for fire growth to a given size can be seen as the resistance of the human-landscape system to fire spread. Thus, resistance to fire spread decreased under rougher terrain, higher plant productivity, or higher coverage by shrubland, forest, and flammable forest, and was enhanced by the extent of farming, with the relative relevance of these individual influences depending on the fire-size partition considered. Generally, larger fires were fostered by the concomitance of more and better-connected fuel in topographically complex landscapes; these features are correlated, and are expected to match with less inhabited regions, but correlation analysis overlooks it (Table S2), possibly because of substantial intra-regional variation in population density and human influence [47].
Decreased correlation between FWI thresholds for increasingly distant fire-size partitions (Table 4) suggests that, as one example, changes in the relative importance of fire drivers across the fire size range [68] that may be a consequence of interactions between population density and landscape structure. The regions of Porto and Bragança offer clear-cut examples in this respect. Both have a low FWI_1 threshold, in Porto due to extremely high population density within landscapes dominated by wildland-urban interfaces (hence very high ignition pressure), in Bragança because of landscape dominance by farmland and shrubland, which presumes the use of fire in land management. These regions also share very high FWI_1000 thresholds, as the burnable landscape is either limited in extent or is substantially fragmented and particularly large fires will only develop under particularly severe and uncommon fire weather.
Data scatter in Figure 3, along with Table 1, allow some discussion on the relative role of human versus natural influences on FWI thresholds. For example, the Faro distrito deviates from the relationships between TRI and shrubland fraction with FWI_1, and from the FWI_100-TRI relationship, exhibiting high resistance to fire in relation to what would be expected. Vila Real shares similar NPP with Portalegre and Évora, but their respective FWI_100 are in the opposite extremes of the distribution, respectively corresponding to low and high resistance to fire spread. Population density is the distinguishing factor in both cases, presumably conferring higher resistance to fire when it is lower. Likewise, Viana do Castelo and Castelo Branco are similar in their fractions of flammable forest but contrast in FWI_100, respectively denoting low and high resistance to fire, possibly because of higher population density and marginally lower agricultural land use in the former. This suggests that population density, as a surrogate for ignition density [45,51,69], contributes to distinguish FWI-fire thresholds among similarly fire-prone landscapes.
The interaction of biophysical and human factors with the likelihood of weather conditions conducive to significant fire activity should introduce further complexity and nuance in fire–weather relationships. However, strong correlations between regional FWI thresholds and the corresponding median and 90th percentile of the FWI (Table 4) suggest that regional distinctions in the prevalence of more extreme fire weather (Figure 2) did not affect the fire-size FWI thresholds, likely because in Mediterranean climates the NPP gradient controls how fire activity responds to fire-inducing weather [70]. A study in southern France found that only 25% of the variation in wildfire spatial patterns was attributed to spatial variation in fire weather [35].
Cluster analysis revealed three broad pyroregions (Figure 4), roughly corresponding to the NCW, NCE, and S supra regions of the country, and representing differential resistance to fire spread, from low to high, as determined by land use, topography, NPP, and population density. This supplements previous analyses examining regional or spatial patterns of fire activity metrics that highlighted the role of climate [44], recognized the existence of synergistic effects [69], and carried out explicit modeling [25]. However, within-cluster variation was substantial down to adjacent regions. Further advances in understanding and systematizing fire-weather relationships from a fire management perspective and, more generally, in typifying fire regimes, can be achieved by working at finer spatial scales and using landscape-level metrics of fuel structure [27,71,72].
5. Conclusions
Fires grow in the landscape to increasingly large sizes as allowed by the composite influences of atmospheric and fuel dryness conditions, which in this study were expressed by the FWI of the Canadian forest fire weather index system. Larger fires require progressively more extreme fire weather, which occurs on a limited set of days. However, fire–weather relationships, as expressed by FWI-thresholds associated to the fire-size classes considered, show important regional variation in Portugal, even if the operationally-used fire danger rating classification is satisfactory at discriminating days with large fire (≥100 ha) occurrence. Relative differences between FWI thresholds for large fire-size classes variants decreased both within and among regions as compared with smaller fires, possibly signaling a greater control of fire spread exerted by landscape structure and a decrease in the anthropogenic-related ability to restrain fire development, but also fire–atmosphere–terrain influences and interactions unaccounted for by the analysis.
FWI thresholds as a function of fire size are an expression of resistance to fire spread. Such levels of resistance followed biophysical gradients. Coincidence of higher NPP and flammable forest fraction enabled fire development to larger sizes under comparatively mild fire weather. Decrease in NPP and flammable forest cover and high shrubland cover signaled intermediate resistance. Finally, decreased terrain roughness with less forest and shrubland and more agriculture corresponded with the highest resistance to fire spread. Population density is both a source of ignitions and a facilitator of fire suppression and its potential role warrants further research. Future improvements in fire-weather relationships analysis will likely result from the inclusion of additional variables, examined at the scales most coherent with the objective, i.e., fire management versus understanding of processes.
Supplementary Materials
The following are available online at https://www.mdpi.com/1999-4907/10/10/838/s1, Table S1: Percentiles of fire duration (days) for fires ≥0.01, 0.1, 1, 100, 500, and 1000 ha during the study period (2001–2011); Table S2: Correlation matrix between regional population density and biophysical variables among Portugal regions.
Funding
This work is financed by the ERDF—European Regional Development Fund through the COMPETE Program and by national funds through the FCT (Fundação para a Ciência e a Tecnologia) within project FIRE ENGINE—Flexible Design of Forest Fire Management Systems (MIT/FSE/0064/2009) and project UID/AGR/04033/2019.
Acknowledgments
I am indebted to Marco Magalhães and Tiago Monteiro-Henriques, who respectively derived the terrain metrics and NPP at regional level.
Conflicts of Interest
The author declares no conflict of interest.
References
- Bowman, D.M.J.S.; Williamson, G.J.; Abatzoglou, J.T.; Kolden, C.A.; Cochrane, M.A.; Smith, A.M.S. Human exposure and sensitivity to globally extreme wildfire events. Nat. Ecol. Evol. 2017, 1, 0058. [Google Scholar] [CrossRef] [PubMed]
- Turco, M.; Herrera, S.; Tourigny, E.; Chuvieco, E.; Provenzale, A. A comparison of remotely-sensed and inventory datasets for burned area in Mediterranean Europe. Int. J. Appl. Earth Obs. 2019, 82, 101887. [Google Scholar] [CrossRef] [Green Version]
- Mateus, P.; Fernandes, P.M. Forest Fires in Portugal: Dynamics, Causes and Policies. In Forest Context and Policies in Portugal; Reboredo, F., Ed.; Springer International Publishing: Cham, Switzerland, 2014; pp. 97–115. [Google Scholar]
- Martell, D.L. Forest Fire Management. In Handbook of Operations Research In Natural Resources; Weintraub, A., Romero, C., Bjørndal, T., Epstein, R., Miranda, J., Eds.; Springer: Boston, MA, USA, 2007; pp. 489–509. [Google Scholar]
- Wotton, B.M. Interpreting and using outputs from the Canadian Forest Fire Danger Rating System in research applications. Environ. Ecol. Stat. 2009, 16, 107–131. [Google Scholar] [CrossRef]
- Stocks, B.J.; Lynham, T.J.; Lawson, B.D.; Alexander, M.E.; Wagner, C.V.; McAlpine, R.S.; Dube, D.E. Canadian forest fire danger rating system: An overview. For. Chron. 1989, 65, 258–265. [Google Scholar] [CrossRef]
- Burgan, R.E. 1988 Revisions to the 1978 National Fire-Danger Rating System; US Department of Agriculture, Forest Service, Southeastern Forest Experiment Station: Asheville, NC, USA, 1988; p. 144.
- Matthews, S. A comparison of fire danger rating systems for use in forests. Aust. Meteorol. Ocean. 2009, 58, 41. [Google Scholar] [CrossRef]
- Van Wagner, C.E. Development and Structure of the Canadian Forest Fire Weather Index System; Forestry Technical Report 35; Canadian Forest Service: Ottawa, ON, Canada, 1987; p. 35. [Google Scholar]
- Palheiro, P.M.; Fernandes, P.; Cruz, M.G. A fire behaviour-based fire danger classification for maritime pine stands: Comparison of two approaches. For. Ecol. Manag. 2006, 234, S54. [Google Scholar] [CrossRef]
- Andrews, P.L.; Loftsgaarden, D.O.; Bradshaw, L.S. Evaluation of fire danger rating indexes using logistic regression and percentile analysis. Int. J. Wildland Fire 2003, 12, 213–226. [Google Scholar] [CrossRef]
- DaCamara, C.C.; Calado, T.J.; Ermida, S.L.; Trigo, I.F.; Amraoui, M.; Turkman, K.F. Calibration of the Fire Weather Index over Mediterranean Europe based on fire activity retrieved from MSG satellite imagery. Int. J. Wildland Fire 2014, 23, 945–958. [Google Scholar] [CrossRef]
- Davies, G.M.; Legg, C.J. Regional variation in fire weather controls the reported occurrence of Scottish wildfires. PeerJ 2016, 4, e2649. [Google Scholar] [CrossRef] [Green Version]
- De Jong, M.C.; Wooster, M.J.; Kitchen, K.; Manley, C.; Gazzard, R.; McCall, F.F. Calibration and evaluation of the Canadian Forest Fire Weather Index (FWI) System for improved wildland fire danger rating in the United Kingdom. Nat. Hazard Earth Sys. 2016, 16, 1217–1237. [Google Scholar] [CrossRef] [Green Version]
- Šturm, T.; Fernandes, P.M.; Šumrada, R. The Canadian fire weather index system and wildfire activity in the Karst forest management area, Slovenia. Eur. J. For. Res. 2012, 131, 829–834. [Google Scholar] [CrossRef]
- Amatulli, G.; Camia, A.; San-Miguel-Ayanz, J. Estimating future burned areas under changing climate in the EU-Mediterranean countries. Sci. Total Environ. 2013, 450–451, 209–222. [Google Scholar] [CrossRef] [PubMed]
- Carvalho, A.; Flannigan, M.D.; Logan, K.; Miranda, A.I.; Borrego, C. Fire activity in Portugal and its relationship to weather and the Canadian Fire Weather Index System. Int. J. Wildland Fire 2008, 17, 328–338. [Google Scholar] [CrossRef]
- Giannakopoulos, C.; LeSager, P.; Moriondo, M.; Bindi, M.; Karali, A.; Hatzaki, M.; Kostopoulou, E. Comparison of fire danger indices in the Mediterranean for present day conditions. iForest 2012, 5, 197. [Google Scholar] [CrossRef]
- Jiménez-Ruano, A.; Mimbrero, M.R.; Jolly, W.M.; de la Riva Fernández, J. The role of short-term weather conditions in temporal dynamics of fire regime features in mainland Spain. J. Environ. Manag. 2019, 241, 575–586. [Google Scholar] [CrossRef] [PubMed]
- Padilla, M.; Vega-García, C. On the comparative importance of fire danger rating indices and their integration with spatial and temporal variables for predicting daily human-caused fire occurrences in Spain. Int. J. Wildland Fire 2011, 20, 46–58. [Google Scholar] [CrossRef]
- Papakosta, P.; Straub, D. Probabilistic prediction of daily fire occurrence in the Mediterranean with readily available spatio-temporal data. iForest 2016, 10, 32. [Google Scholar] [CrossRef]
- Urbieta, I.R.; Zavala, G.; Bedia, J.; Gutiérrez, J.M.; Miguel-Ayanz, J.S.; Camia, A.; Keeley, J.E.; Moreno, J.M. Fire activity as a function of fire—weather seasonal severity and antecedent climate across spatial scales in southern Europe and Pacific western USA. Environ. Res. Lett. 2015, 10, 114013. [Google Scholar] [CrossRef]
- Venäläinen, A.; Korhonen, N.; Hyvärinen, O.; Koutsias, N.; Xystrakis, F.; Urbieta, I.R.; Moreno, J.M. Temporal variations and change in forest fire danger in Europe for 1960–2012. Nat. Hazards Earth Sys. 2014, 14, 1477–1490. [Google Scholar] [CrossRef]
- Ager, A.A.; Preisler, H.K.; Arca, B.; Spano, D.; Salis, M. Wildfire risk estimation in the Mediterranean area. Environmetrics 2014, 25, 384–396. [Google Scholar] [CrossRef]
- Fernandes, P.M.; Barros, A.M.G.; Pinto, A.; Santos, J.A. Characteristics and controls of extremely large wildfires in the western Mediterranean Basin. J. Geophys. Res. Biogeo 2016, 121, 2141–2157. [Google Scholar] [CrossRef]
- Fernandes, P.M.; Pacheco, A.P.; Almeida, R.; Claro, J. The role of fire-suppression force in limiting the spread of extremely large forest fires in Portugal. Eur. J. For. Res. 2016, 135, 253–262. [Google Scholar] [CrossRef]
- Fernandes, P.M.; Monteiro-Henriques, T.; Guiomar, N.; Loureiro, C.; Barros, A.M.G. Bottom-up variables govern large-fire size in Portugal. Ecosystems 2016, 19, 1362–1375. [Google Scholar] [CrossRef]
- Lahaye, S.; Curt, T.; Fréjaville, T.; Sharples, J.; Paradis, L.; Hély, C. What are the drivers of dangerous fires in Mediterranean France? Int. J. Wildland Fire 2018, 27, 155–163. [Google Scholar] [CrossRef]
- Strauss, D.; Bednar, L.; Mees, R. Do one percent of the forest fires cause ninety-nine percent of the damage? For. Sci. 1989, 35, 319–328. [Google Scholar]
- Lannom, K.O.; Tinkham, W.T.; Smith, A.M.S.; Abatzoglou, J.; Newingham, B.A.; Hall, T.E.; Morgan, P.; Strand, E.K.; Paveglio, T.B.; Anderson, J.W.; et al. Defining extreme wildland fires using geospatial and ancillary metrics. Int. J. Wildland Fire 2014, 23, 322–337. [Google Scholar] [CrossRef]
- Cui, W.; Perera, A.H. What do we know about forest fire size distribution, and why is this knowledge useful for forest management? Int. J. Wildland Fire 2008, 17, 234–244. [Google Scholar] [CrossRef]
- Arienti, M.C.; Cumming, S.G.; Boutin, S. Empirical models of forest fire initial attack success probabilities: The effects of fuels, anthropogenic linear features, fire weather, and management. Can. J. For. Res. 2006, 36, 3155–3166. [Google Scholar] [CrossRef]
- Fang, L.; Yang, J.; Zu, J.; Li, G.; Zhang, J. Quantifying influences and relative importance of fire weather, topography, and vegetation on fire size and fire severity in a Chinese boreal forest landscape. For. Ecol. Manag. 2015, 356, 2–12. [Google Scholar] [CrossRef]
- Moreira, F.; Catry, F.X.; Rego, F.; Bacao, F. Size-dependent pattern of wildfire ignitions in Portugal: When do ignitions turn into big fires? Landsc. Ecol. 2010, 25, 1405–1417. [Google Scholar] [CrossRef]
- Ruffault, J.; Mouillot, F. Contribution of human and biophysical factors to the spatial distribution of forest fire ignitions and large wildfires in a French Mediterranean region. Int. J. Wildland Fire 2017, 26, 498–508. [Google Scholar] [CrossRef] [Green Version]
- Price, O.F.; Penman, T.; Bradstock, R.; Borah, R. The drivers of wildfire enlargement do not exhibit scale thresholds in southeastern Australian forests. J. Environ. Manag. 2016, 181, 208–217. [Google Scholar]
- Whitman, E.; Batllori, E.; Parisien, M.-A.; Miller, C.; Coop, J.D.; Krawchuk, M.A.; Chong, G.W.; Haire, S.L. The climate space of fire regimes in north-western North America. J. Biogeogr. 2015, 42, 1736–1749. [Google Scholar] [CrossRef]
- Bowman, D.M.J.S.; Balch, J.; Artaxo, P.; Bond, W.J.; Cochrane, M.A.; D’Antonio, C.M.; DeFries, R.; Johnston, F.H.; Keeley, J.E.; Krawchuk, M.A.; et al. The human dimension of fire regimes on Earth: The human dimension of fire regimes on Earth. J. Biogeogr. 2011, 38, 2223–2236. [Google Scholar] [CrossRef]
- Parisien, M.-A.; Miller, C.; Parks, S.A.; DeLancey, E.R.; Robinne, F.-N.; Flannigan, M.D. The spatially varying influence of humans on fire probability in North America. Environ. Res. Lett. 2016, 11, 075005. [Google Scholar] [CrossRef] [Green Version]
- Syphard, A.D.; Keeley, J.E.; Pfaff, A.H.; Ferschweiler, K. Human presence diminishes the importance of climate in driving fire activity across the United States. Proc. Natl. Acad. Sci. USA 2017, 114, 13750–13755. [Google Scholar] [CrossRef] [Green Version]
- Ruffault, J.; Mouillot, F. How a new fire-suppression policy can abruptly reshape the fire-weather relationship. Ecosphere 2015, 6, art199. [Google Scholar] [CrossRef]
- Bedia, J.; Herrera, S.; Gutiérrez, J.M. Assessing the predictability of fire occurrence and area burned across phytoclimatic regions in Spain. Nat. Hazards Earth Sys. 2014, 14, 53–66. [Google Scholar] [CrossRef] [Green Version]
- Jiménez-Ruano, A.; Mimbrero, M.R.; de la Riva Fernández, J. Understanding wildfires in mainland Spain. A comprehensive analysis of fire regime features in a climate-human context. Appl. Geogr. 2017, 89, 100–111. [Google Scholar] [CrossRef] [Green Version]
- Trigo, R.M.; Sousa, P.M.; Pereira, M.G.; Rasilla, D.; Gouveia, C.M. Modelling wildfire activity in Iberia with different atmospheric circulation weather types. Int. J. Climatol. 2016, 36, 2761–2778. [Google Scholar]
- Costa, L.; Thonicke, K.; Poulter, B.; Badeck, F.-W. Sensitivity of Portuguese forest fires to climatic, human, and landscape variables: Subnational differences between fire drivers in extreme fire years and decadal averages. Reg. Environ. Change 2011, 11, 543–551. [Google Scholar] [CrossRef]
- Marques, S.; Borges, J.G.; Garcia-Gonzalo, J.; Moreira, F.; Carreiras, J.M.B.; Oliveira, M.M.; Cantarinha, A.; Botequim, B.; Pereira, J.M.C. Characterization of wildfires in Portugal. Eur. J. For. Res. 2011, 130, 775–784. [Google Scholar] [CrossRef]
- Sá, A.C.L.; Turkman, M.A.A.; Pereira, J.M.C. Exploring fire incidence in Portugal using generalized additive models for location, scale and shape (GAMLSS). Model. Earth Syst. Environ. 2018, 4, 199–220. [Google Scholar] [CrossRef]
- Moreno, M.V.; Conedera, M.; Chuvieco, E.; Pezzatti, G.B. Fire regime changes and major driving forces in Spain from 1968 to 2010. Environ. Sci. Policy 2014, 37, 11–22. [Google Scholar] [CrossRef]
- ICNF. Available online: http://www2.icnf.pt/portal/florestas/dfci/inc/estat-sgif (accessed on 20 August 2019).
- ICNF—Cartografia da área Ardida. Available online: http://www2.icnf.pt/portal/florestas/dfci/inc/mapas (accessed on 20 August 2019).
- Catry, F.X.; Rego, F.C.; Bação, F.L.; Moreira, F. Modeling and mapping wildfire ignition risk in Portugal. Int. J. Wildland Fire 2010, 18, 921–931. [Google Scholar] [CrossRef]
- Riley, S.J.; DeGloria, S.D.; Elliot, R. A terrain ruggedness index that quantifies topographic heterogeneity. Intermt. J. Sci. 1999, 5, 23–27. [Google Scholar]
- Imhoff, M.L.; Bounoua, L.; Ricketts, T.; Loucks, C.; Harriss, R.; Lawrence, W.T. HANPP Collection: Global Patterns in Net Primary Productivity (NPP); SEDAC: Palisades, NY, USA, 2004. [Google Scholar]
- Imhoff, M.L.; Bounoua, L. Exploring global patterns of net primary production carbon supply and demand using satellite observations and statistical data. J. Geophys. Res.-Atmos. 2006, 111, D22. [Google Scholar] [CrossRef]
- ICNF, Relatório Final IFN5—FloreStat. Available online: http://www2.icnf.pt/portal/florestas/ifn/ifn5/rel-fin (accessed on 20 August 2019).
- Fernandes, P.M. Combining forest structure data and fuel modelling to classify fire hazard in Portugal. Ann. For. Sci. 2009, 66, 415. [Google Scholar] [CrossRef]
- Barros, A.M.G.; Pereira, J.M.C. Wildfire selectivity for land cover type: Does size matter? PLoS ONE 2014, 9, e84760. [Google Scholar] [CrossRef]
- Moreira, F.; Vaz, P.; Catry, F.; Silva, J.S. Regional variations in wildfire susceptibility of land-cover types in Portugal: Implications for landscape management to minimize fire hazard. Int. J. Wildland Fire 2009, 18, 563–574. [Google Scholar] [CrossRef]
- Jolly, W.M.; Freeborn, P.H.; Page, W.G.; Butler, B.W. Severe fire danger index: A forecastable metric to inform firefighter and community wildfire risk management. Fire 2019, 2, 47. [Google Scholar] [CrossRef]
- Hosmer, D.W.; Lemeshow, S. Applied Logistic Regression, 2nd ed.; Wiley: New York, NY, USA, 2000; p. 375. [Google Scholar]
- Amraoui, M.; Pereira, M.G.; DaCamara, C.C.; Calado, T.J. Atmospheric conditions associated with extreme fire activity in the Western Mediterranean region. Sci. Total Environ. 2015, 524–525, 32–39. [Google Scholar]
- Cruz, M.G.; Alexander, M.E. The 10% wind speed rule of thumb for estimating a wildfire’s forward rate of spread in forests and shrublands. Ann. For. Sci. 2019, 76, 44. [Google Scholar]
- Potter, B.E. Atmospheric interactions with wildland fire behaviour—II. Plume and vortex dynamics. Int. J. Wildland Fire 2012, 21, 802–817. [Google Scholar]
- Viedma, O.; Angeler, D.G.; Moreno, J.M. Landscape structural features control fire size in a Mediterranean forested area of central Spain. Int. J. Wildland Fire 2009, 18, 575–583. [Google Scholar] [CrossRef]
- Fernandes, P.M.; Loureiro, C.; Magalhães, M.; Ferreira, P.; Fernandes, M. Fuel age, weather and burn probability in Portugal. Int. J. Wildland Fire 2012, 21, 380–384. [Google Scholar] [CrossRef] [Green Version]
- Koutsias, N.; Arianoutsou, M.; Kallimanis, A.S.; Mallinis, G.; Halley, J.M.; Dimopoulos, P. Where did the fires burn in Peloponnisos, Greece the summer of 2007? Evidence for a synergy of fuel and weather. Agr. For. Meteorol. 2012, 156, 41–53. [Google Scholar]
- Abatzoglou, J.T.; Balch, J.K.; Bradley, B.A.; Kolden, C.A. Human-related ignitions concurrent with high winds promote large wildfires across the USA. Int. J. Wildland Fire 2018, 27, 377–386. [Google Scholar] [CrossRef]
- Slocum, M.G.; Beckage, B.; Platt, W.J.; Orzell, S.L.; Taylor, W. Effect of climate on wildfire size: A cross-scale analysis. Ecosystems 2010, 13, 828–840. [Google Scholar] [CrossRef]
- Nunes, A.N. Regional variability and driving forces behind forest fires in Portugal an overview of the last three decades (1980–2009). Appl. Geogr. 2012, 34, 576–586. [Google Scholar] [CrossRef]
- Pausas, J.G.; Paula, S. Fuel shapes the fire—climate relationship: Evidence from Mediterranean ecosystems. Global Ecol. Biogeogr. 2012, 21, 1074–1082. [Google Scholar] [CrossRef]
- Curt, T.; Borgniet, L.; Bouillon, C. Wildfire frequency varies with the size and shape of fuel types in southeastern France: Implications for environmental management. J. Environ. Manag. 2013, 117, 150–161. [Google Scholar] [CrossRef] [Green Version]
- Loepfe, L.; Martinez-Vilalta, J.; Oliveres, J.; Piñol, J.; Lloret, F. Feedbacks between fuel reduction and landscape homogenisation determine fire regimes in three Mediterranean areas. Forest Ecol. Manag. 2010, 259, 2366–2374. [Google Scholar] [CrossRef]
Figure 1.
Cumulative burned area in Portugal (2001–2011) overlaid on Google Earth imagery (map data courtesy of ©2018 Google) (a) and administrative regions (distritos) (b). Bold, italic, and underlined lettering indicates regions belonging respectively to the North and Central West (NCW), North and Central East (NCE), and South (S) supra regions.

Figure 2.
Boxplots (with outliers) of the fire weather index (FWI) daily variation for the regions (distritos) of Portugal (2001–2011). The box spans the interquartile range and the whiskers extend to the 90th and 10th percentiles. Black, blue, and grey boxplots correspond respectively to the NCW, NCE and S supra regions.
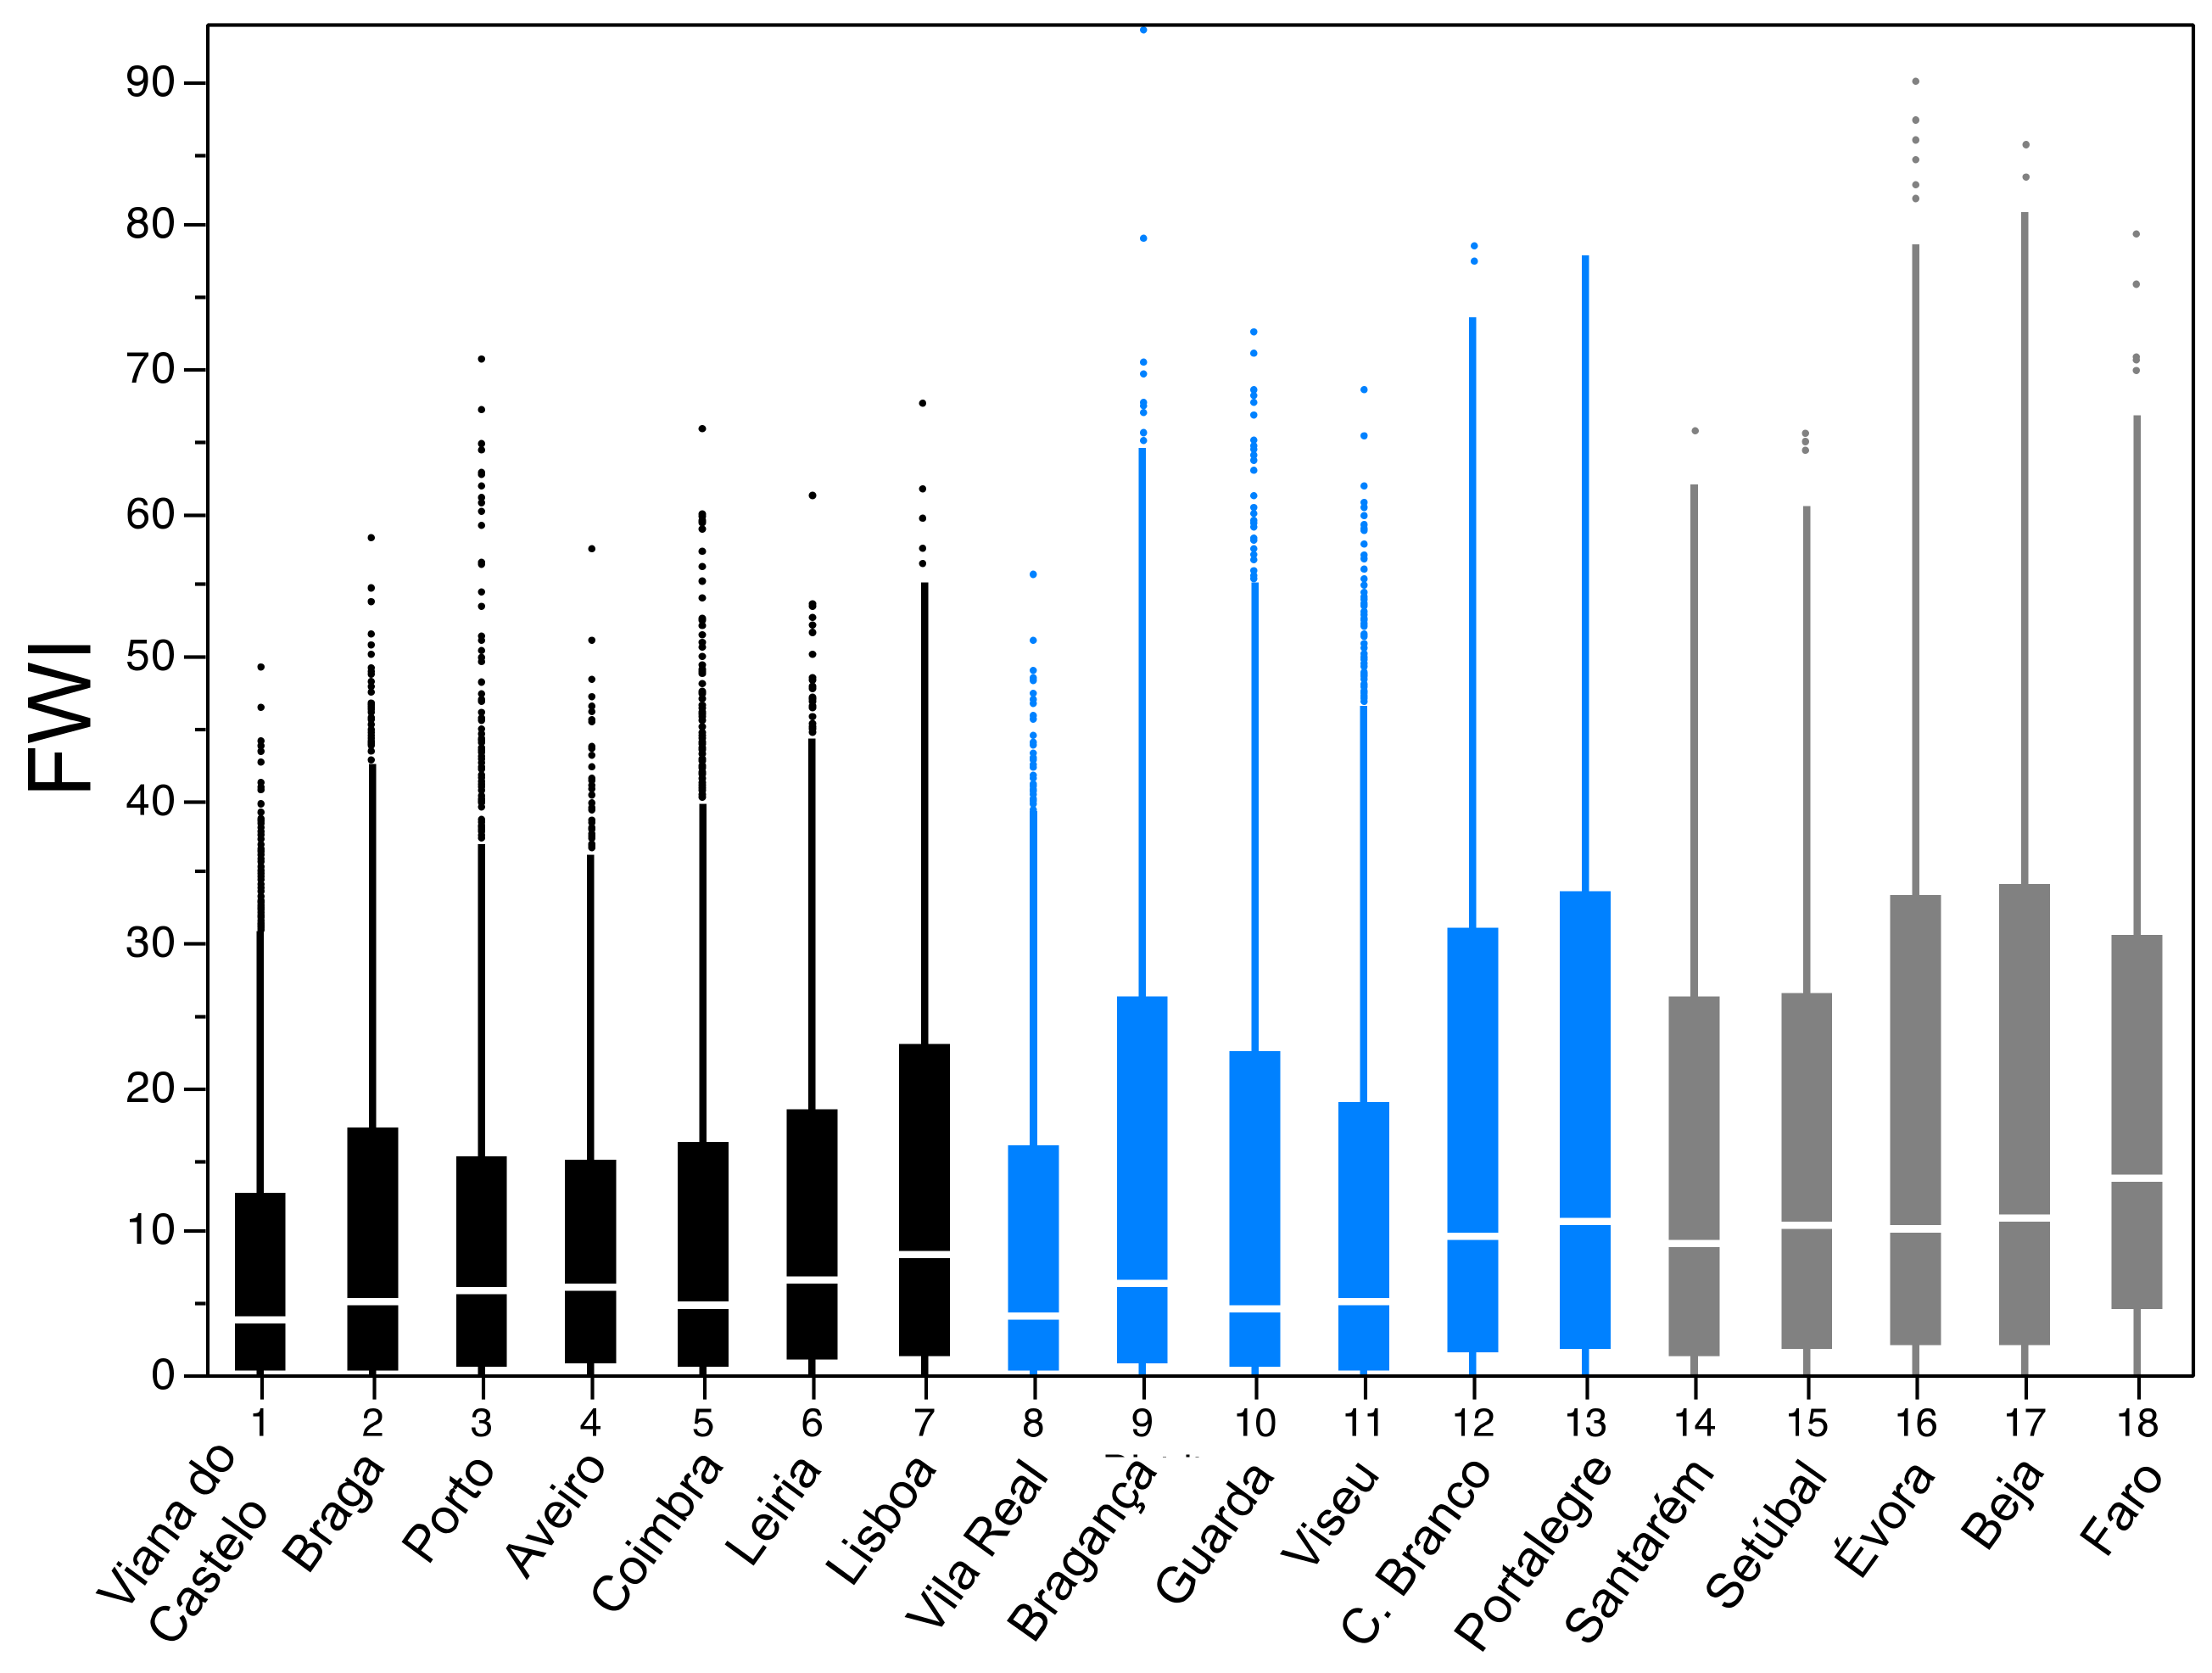
Figure 3.
Selected relationships of the form y = a × x b between regional FWI thresholds for the occurrence of fires ≥ 1 (FWI_1), ≥ 100 (FWI_100), and ≥ 1000 (FWI_1000) ha and biophysical variables, with 95% confidence intervals. Models were fitted on log-transformed variables. Black, white, and grey circles correspond to the NCW, NCE, and S supra regions of Portugal.

Figure 4.
Regional clustering dendrogram as a function of FWI thresholds (≥1 ha, and ≥100 ha), population density, and biophysical variables (TRI, elevation, NPP, land cover fractions of agriculture, shrubland, forest, and flammable forest). Bold, italic, and underlined lettering indicates regions belonging respectively to the NCW, NCE, and S supra regions of Portugal.

Table 1.
Regional means (standard deviations) of variables expected to influence the relationships between fire activity and fire weather in Portugal. TRI is the topographic ruggedness index and NPP is net primary productivity.
Table 1.
Regional means (standard deviations) of variables expected to influence the relationships between fire activity and fire weather in Portugal. TRI is the topographic ruggedness index and NPP is net primary productivity.
| Region | Popul. Density | Elevation | Slope | TRI | NPP | Land Cover Fractions | |||
|---|---|---|---|---|---|---|---|---|---|
| (no. km−2) | (m) | (°) | (t C year−1) | Agriculture | Shrubland | Forest | Flammable Forest * | ||
| Aveiro | 261.2 | 200 (215) | 4.8 (5.0) | 36.0 (33.0) | 4.2 (0.4) | 0.25 | 0.08 | 0.53 | 0.95 |
| Beja | 15.0 | 177 (77) | 2.5 (2.1) | 23.2 (18.8) | 2.9 (0.8) | 0.50 | 0.13 | 0.35 | 0.17 |
| Braga | 323.2 | 356 (276) | 7.7 (5.9) | 53.8 (35.5) | 4.3 (0.3) | 0.30 | 0.27 | 0.32 | 0.82 |
| Bragança | 21.9 | 610 (186) | 6.4 (4.5) | 47.6 (29.8) | 2.6 (0.5) | 0.35 | 0.34 | 0.29 | 0.39 |
| Castelo Branco | 30.2 | 408 (192) | 5.1 (4.6) | 37.1 (29.7) | 3.1 (0.5) | 0.26 | 0.32 | 0.40 | 0.78 |
| Coimbra | 109.5 | 270 (257) | 5.3 (5.4) | 41.5 (38.3) | 3.7 (0.4) | 0.21 | 0.17 | 0.52 | 0.96 |
| Évora | 22.8 | 218 (74) | 1.7 (1.2) | 12.1 (7.7) | 3.2 (0.4) | 0.42 | 0.05 | 0.50 | 0.08 |
| Faro | 87.9 | 176 (137) | 4.7 (3.7) | 46.1 (30.1) | 3.3 (1.1) | 0.26 | 0.38 | 0.26 | 0.26 |
| Guarda | 30.6 | 698 (232) | 6.0 (5.4) | 44.5 (35.7) | 2.6 (0.4) | 0.28 | 0.48 | 0.19 | 0.58 |
| Leiria | 135.0 | 199 (157) | 3.7 (3.2) | 27.3 (20.5) | 3.7 (0.5) | 0.27 | 0.16 | 0.45 | 0.95 |
| Lisboa | 801.1 | 116 (82) | 3.2 (2.8) | 23.5 (17.4) | 3.4 (0.4) | 0.48 | 0.13 | 0.18 | 0.77 |
| Portalegre | 19.8 | 272 (107) | 2.3 (2.0) | 16.2 (13.6) | 3.2 (0.4) | 0.41 | 0.11 | 0.44 | 0.22 |
| Porto | 769.7 | 253 (215) | 6.2 (5.2) | 45.4 (32.7) | 4.0 (0.3) | 0.29 | 0.17 | 0.31 | 0.87 |
| Santarém | 66.7 | 133 (94) | 2.4 (2.2) | 17.8 (14.7) | 3.4 (0.3) | 0.33 | 0.12 | 0.49 | 0.53 |
| Setúbal | 164.4 | 78 (56) | 1.8 (1.9) | 14.1 (12.9) | 3.1 (0.7) | 0.29 | 0.07 | 0.56 | 0.29 |
| Viana do Castelo | 110.3 | 386 (3249) | 10.1 (6.3) | 68.0 (36.8) | 4.5 (0.2) | 0.21 | 0.38 | 0.30 | 0.74 |
| Vila Real | 49.5 | 698 (245) | 8.3 (5.4) | 58.2 (32.4) | 3.2 (0.4) | 0.25 | 0.39 | 0.32 | 0.74 |
| Viseu | 77.3 | 562 (239) | 7.5 (5.8) | 53.5 (33.5) | 3.3 (0.7) | 0.24 | 0.26 | 0.45 | 0.84 |
* As a fraction of total forest cover.
Table 2.
Regional percentages of days with fires ≥0.01, 0.1, 1, 100, 500, and 1000 ha during the study period (2001–2011).
Table 2.
Regional percentages of days with fires ≥0.01, 0.1, 1, 100, 500, and 1000 ha during the study period (2001–2011).
| Region | Fire Size (ha) | ||||||
|---|---|---|---|---|---|---|---|
| 0.01 | 0.1 | 1 | 10 | 100 | 500 | 1000 | |
| Aveiro | 59.4 | 45.1 | 23.7 | 4.9 | 0.9 | 0.3 | 0.2 |
| Beja | 28.6 | 24.8 | 18.3 | 6.2 | 1.3 | 0.3 | 0.1 |
| Braga | 57.3 | 51.1 | 38.2 | 11.9 | 2.3 | 0.4 | 0.1 |
| Bragança | 51.3 | 47.7 | 36.6 | 11.7 | 3.3 | 0.8 | 0.4 |
| Castelo Branco | 44.5 | 36.0 | 24.1 | 5.9 | 2.3 | 1.1 | 0.7 |
| Coimbra | 45.2 | 32.1 | 14.9 | 3.3 | 1.3 | 0.6 | 0.4 |
| Évora | 23.9 | 20.8 | 13.5 | 4.1 | 1.0 | 0.3 | 0.2 |
| Faro | 34.3 | 23.3 | 13.8 | 2.6 | 0.9 | 0.4 | 0.3 |
| Guarda | 54.4 | 49.2 | 41.1 | 15.6 | 5.2 | 1.5 | 0.8 |
| Leiria | 50.2 | 36.3 | 18.0 | 3.4 | 1.2 | 0.5 | 0.2 |
| Lisboa | 62.8 | 47.6 | 35.6 | 3.6 | 0.5 | 0.1 | 0.1 |
| Portalegre | 25.9 | 20.9 | 13.1 | 3.2 | 0.7 | 0.3 | 0.2 |
| Porto | 62.0 | 51.3 | 35.5 | 9.4 | 1.9 | 0.5 | 0.1 |
| Santarém | 55.1 | 42.4 | 25.9 | 5.0 | 1.9 | 0.8 | 0.3 |
| Setúbal | 50.9 | 33.8 | 21.1 | 2.9 | 0.6 | 0.1 | 0.1 |
| Viana do Castelo | 51.0 | 44.8 | 34.4 | 11.5 | 2.6 | 0.6 | 0.2 |
| Vila Real | 58.3 | 48.4 | 40.9 | 13.1 | 3.9 | 1.1 | 0.4 |
| Viseu | 59.5 | 52.4 | 39.4 | 11.5 | 3.6 | 1.1 | 0.5 |
Table 3.
FWI thresholds resulting from logistic regression for the daily occurrence of increasingly larger fires in Portugal regions. Numbers within brackets respectively indicate the area under the curve (AUC) and misclassification rate. Italics denote thresholds exceeding the maximum observed FWI. Missing FWI values correspond to thresholds lower than the previous fire-size threshold.
| Region | Fire Size (ha) | ||||||
|---|---|---|---|---|---|---|---|
| 0.01 | 0.1 | 1 | 10 | 100 | 500 | 1000 | |
| Aveiro | 0.6 (0.88; 0.11) | 6.6 (0.83; 0.24) | 19.1 (0.76; 0.29) | 38.5 (0.80; 0.07) | 48.7 (0.89; 0.01) | 53.7 (0.93; <0.01) | 58.8 (0.91; <0.01) |
| Beja | 10.0 (0.73; 0.24) | 18.5 (0.71; 0.29) | 33.8 (0.71; 0.35) | 63.7 (0.73; 0.16) | 69.5 (0.89; 0.03) | 84.3 (0.89; 0.01) | - |
| Braga | 0.0 (0.89; 0.11) | 2.3 (0.87; 0.14) | 9.5 (0.80; 0.28) | 30.8 (0.84; 0.14) | 45.1 (0.92; 0.04) | 54.6 (0.94; 0.01) | 61.0 (0.36; <0.01) |
| Bragança | 0.0 (0.76; 0.10) | 0.0 (0.75; 0.16) | 9.2 (0.72; 0.32) | 45.8 (0.79; 0.20) | 62.4 (0.86; 0.06) | 79.9 (0.83; 0.01) | 90.1 (0.86; 0.01) |
| Castelo Branco | 0.0 (0.74; 0.12) | 9.3 (0.72; 0.28) | 31.3 (0.70; 0.35) | 61.2 (0.81; 0.18) | 68.9 (0.87; 0.05) | 76.9 (0.89; 0.02) | 79.5 (0.90; 0.01) |
| Coimbra | 0.0 (0.77; 0.22) | 12.2 (0.75; 0.33) | 31.1 (0.76; 0.22) | 50.3 (0.84; 0.06) | 58.5 (0.83; 0.02) | 66.0 (0.88; 0.01) | 75.0 (0.85; 0.01) |
| Évora | 23.7 (0.75; 0.29) | 29.6 (0.74; 0.32) | 46.6 (0.73; 0.30) | 68.5 (0.80; 0.10) | 81.1 (0.88; 0.02) | 93.1 (0.93; 0.01) | 94.2 (0.96; 0.01) |
| Faro | 14.1 (0.76; 0.24) | 29.1 (0.72; 0.34) | 43.8 (0.73; 0.26) | 65.2 (0.80; 0.05) | 78.5 (0.86; 0.02) | - | - |
| Guarda | 0.0 (0.76; 0.17) | 0.0 (0.78; 0.24) | 7.8 (0.75; 0.31) | 38.9 (0.79; 0.21) | 53.4 (0.87; 0.08) | 63.6 (0.92; 0.02) | 77.9 (0.93; 0.01) |
| Leiria | 1.7 (0.82; 0.17) | 11.4 (0.77; 0.25) | 27.6 (0.76; 0.24) | 43.5 (0.89; 0.06) | 50.9 (0.93; 0.02) | 56.3 (0.94; 0.01) | 58.3 (0.97; <0.01) |
| Lisboa | 0.5 (0.88; 0.12) | 9.5 (0.86; 0.23) | 17.1 (0.83; 0.24) | 47.4 (0.88; 0.04) | 61.7 (0.94; 0.01) | 72.9 (0.93; <0.01) | - |
| Portalegre | 16.8 (0.68; 0.33) | 30.5 (0.68; 0.36) | 52.3 (0.67; 0.32) | 75.6 (0.77; 0.08) | 81.5 (0.85; 0.02) | - | 88.3 (0.92; 0.01) |
| Porto | 0.2 (0.91; 0.09) | 4.4 (0.90; 0.15) | 11.1 (0.87; 0.21) | 31.4 (0.87; 0.12) | 47.8 (0.94; 0.03) | 62.7 (0.96; 0.01) | 88.2 (0.97; <0.01) |
| Santarém | 0.4 (0.84; 0.13) | 11.3 (0.78; 0.26) | 27.4 (0.77; 0.29) | 47.8 (0.88; 0.08) | 53.7 (0.32; 0.03) | 58.9 (0.93; 0.01) | 66.3 (0.93; 0.01) |
| Setúbal | 8.2 (0.86; 0.19) | 20.9 (0.80; 0.27) | 33.1 (0.77; 0.27) | 59.3 (0.82; 0.04) | 65.4 (0.91; 0.01) | 65.5 (0.98; <0.01) | 67.7 (>0.99; <0.01) |
| Viana do Castelo | 0.0 (0.82; 0.12) | 1.7 (0.79; 0.20) | 7.8 (0.77; 0.32) | 26.0 (0.78; 0.17) | 36.5 (0.88; 0.04) | 43.0 (0.94; 0.01) | 45.3 (0.99; 0.01) |
| Vila Real | 0.0 (0.85; 0.07) | 0.6 (0.79; 0.19) | 5.8 (0.76; 0.29) | 30.5 (0.80; 0.18) | 41.2 (0.88; 0.06) | 50.6 (0.91; 0.02) | 54.2 (0.95; 0.01) |
| Viseu | 0.0 (0.83; 0.10) | 0.6 (0.81; 0.19) | 10.0 (0.77; 0.30) | 38.5 (0.82; 0.16) | 51.2 (0.90; 0.05) | 62.6 (0.92; 0.02) | 71.8 (0.91; 0.01) |
Table 4.
Correlation matrix (r values) between FWI thresholds for each fire size class, and between the latter and the median and 90th percentile of the FWI (n = 18). All correlations are significant at p < 0.001, except * (p < 0.05) and ** (p < 0.01).
Table 4.
Correlation matrix (r values) between FWI thresholds for each fire size class, and between the latter and the median and 90th percentile of the FWI (n = 18). All correlations are significant at p < 0.001, except * (p < 0.05) and ** (p < 0.01).
| Fire-Size Thresholds | FWI | |||||||
|---|---|---|---|---|---|---|---|---|
| 0.1 | 1 | 10 | 100 | 500 | 1000 | Median | 90th Perc. | |
| 0.01 | 0.902 | 0.819 | 0.789 | 0.794 | 0.673 ** | 0.541 * | 0.719 | 0.666 ** |
| 0.1 | 0.963 | 0.889 | 0.827 | 0.655 ** | 0.483 * | 0.853 | 0.620 ** | |
| 1 | 0.928 | 0.851 | 0.677 ** | 0.501 * | 0.828 | 0.668 ** | ||
| 10 | 0.969 | 0.834 | 0.659 ** | 0.875 | 0.859 | |||
| 100 | 0.922 | 0.786 | 0.819 | 0.888 | ||||
| 500 | 0.879 | 0.697 ** | 0.839 | |||||
| 1000 | 0.525 * | 0.717 | ||||||
Table 5.
Univariate explanation (r2) of regional variability in daily FWI thresholds for fires attaining 1, 100, and 1000 ha through regional descriptors and relationships of the form log(y) = a + b log(x). Missing values indicate non-significant (p > 0.05) effects. Negative and positive influences are represented respectively by (−) and (+).
| Variable | 1 ha | 100 ha | 1000 ha |
|---|---|---|---|
| Popul. density | *0.22 (−) | ||
| Elevation | 0.44 (−) | ||
| TRI | 0.56 (−) | 0.48 (−) | |
| NPP | 0.33 (−) | 0.29 (−) | |
| Land cover fractions | |||
| Agriculture | 0.33 (+) | ||
| Shrubland | 0.39 (−) | ||
| Forest | 0.24 (−) | ||
| Flammable forest | 0.32 (−) | 0.54 (−) | 0.32 (−) |
* p = 0.052.
© 2019 by the author. Licensee MDPI, Basel, Switzerland. This article is an open access article distributed under the terms and conditions of the Creative Commons Attribution (CC BY) license (http://creativecommons.org/licenses/by/4.0/).
Share and Cite
MDPI and ACS Style
Fernandes, P.M. Variation in the Canadian Fire Weather Index Thresholds for Increasingly Larger Fires in Portugal. Forests 2019, 10, 838. https://doi.org/10.3390/f10100838
AMA Style
Fernandes PM. Variation in the Canadian Fire Weather Index Thresholds for Increasingly Larger Fires in Portugal. Forests. 2019; 10(10):838. https://doi.org/10.3390/f10100838
Chicago/Turabian StyleFernandes, Paulo M. 2019. "Variation in the Canadian Fire Weather Index Thresholds for Increasingly Larger Fires in Portugal" Forests 10, no. 10: 838. https://doi.org/10.3390/f10100838
Note that from the first issue of 2016, this journal uses article numbers instead of page numbers. See further details here.