Phosphorus Availabilities Differ between Cropland and Forestland in Shelterbelt Systems


1
442 Earth Sciences Building, Department of Renewable Resources, University of Alberta, Edmonton, AB T6G 2E3, Canada
2
School of Science, Beijing Forestry University, Beijing 100083, China
*
Author to whom correspondence should be addressed.
Forests 2019, 10(11), 1001; https://doi.org/10.3390/f10111001
Submission received: 6 October 2019
/
Revised: 2 November 2019
/
Accepted: 5 November 2019
/
Published: 8 November 2019
(This article belongs to the Special Issue Agroforestry Systems: The Role of Trees in Ecosystem Services—A Special Issue in Collaboration with the 4th World Congress on Agroforestry)
Abstract
:Shelterbelt systems play pivotal roles in providing goods and services to the rural community and the society at large, but phosphorus (P) cycling in shelterbelt systems is poorly studied, while P cycling and availability would be linked to the ecological function and services of shelterbelt systems. This study was conducted to understand how long-term (>30 years) land-use between cropland and forestland in shelterbelt systems affect soil P status. We investigated modified Kelowna (PKelowna) and Mehlich-3 (PMehlich) extractable P, P fractions (by sequential chemical fractionation), P sorption properties in the 0–10 and 10–30 cm soils and their relationship in six pairs of the cropland areas and adjacent forestland (each pair constitutes a shelterbelt system) in central Alberta. Both PKelowna and PMehlich in the 0–10 cm soil were greater in the cropland than in the forestland. The PKelowna ranged from 10 to 170 and 2 to 57 mg kg−1 within the cropland areas and forestland, respectively. The inorganic P fraction in the 0–30 cm depth was significantly related to PKelowna (R2 = 0.55) and PMehlich (R2 = 0.80) in cropland, but organic P fraction was not significantly related with neither PKelowna nor PMehlich. The iron (Fe) and aluminum (Al) associated P (Fe/Al-P) explained ~50% and ~45% of the variation of PKelowna in the 0–30 cm soil in the cropland and forestland, respectively. The Fe/Al-P and organic P fractions in the 0–10 cm soil were greater in the cropland than in the forestland. The differences in availability and P forms depending on the land use type in shelterbelts suggest that P management needs to be land-use type-specific for shelterbelt systems.
1. Introduction
Agroforestry is an alternative land-use system to monocultural cropping systems to achieve sustainable agricultural production. Shelterbelt systems are one of the most important agroforestry systems. There was an estimated 0.2 million km of shelterbelt within the three Canadian Prairie Provinces of Alberta, Saskatchewan, and Manitoba [1]. Ecological benefits of shelterbelts, including modification of microclimate [2], influence on the quality of litter input [3], and effects on carbon (C) sequestration have been extensively studied [4,5]. In addition, competition with trees for soil available nutrients and water causing yield reduction in adjacent croplands in shelterbelt systems [6] and nitrate accumulation in deeper soil layers in croplands as compared to forestlands have also been reported [7]. However, how soil test phosphorus (P) and P availability differ between cropland and forestland in shelterbelt systems has not been studied, even though shelterbelts have been established on the Canadian prairies since the early nineteenth century and P is the second most limiting plant nutrient after nitrogen (N) in agricultural production systems.
Most soils in Alberta are low in soil-test P as quantified by the modified Kelowna (PKelowna) and Mehlich-3 (PMehlich) methods [8,9]. The Mehlich-3 method is more aggressive in extracting P fractions [10], even though the modified Kelowna method is most widely used in Alberta to determine soil available P [11]. A study by Manunta et al., [8] with more than 56,000 soil analysis, has shown that the majority of Alberta soils had a mean soil test P (PKelowna) of 25–30 mg kg−1 in the top 15 cm that is markedly below the agronomic threshold of 60 mg kg−1 for most crops [12]. Therefore significant efforts have been made to investigate soil test P and P fractionation in agricultural soils [13,14]. Accumulation of different soil P forms is related to the land-use type, and several abiotic and biotic processes control the accumulation of different soil P species within land-use types. For instance, organic matter inputs associated with tree growth following grassland afforestation affected soil P dynamics over time [15]. Moreover, long-term soil management results in the transformation of Fe oxides in the soil [16] and that inevitably alters the related P retention and bioavailability in the soil. Decreasing soil-water content in cropland with increasing proximity to the forestland in shelterbelt systems [17] may also decrease crop P uptake.
Phosphorus is expected to accumulate in agricultural soils where P-fertilizer is repeatedly applied [18], which would increase the potential loss of P into surface waters and cause eutrophication [19]. Phosphorus in the soil exists in several geochemical forms: exchangeable, Ca and Mg-bound (Ca/Mg-P), Fe and Al-bound (Fe/Al-P) and organically bound P (Org-P) [20]. The distribution of P forms is strongly dependent on soil type [21], and management practices affect P bioavailability in the soil [22], some of those effects are related to changes in soil pH as pH has a strong control on P availability. For instance, most of the P applied to pasture, and cultivated soils were transformed into Fe/Al-P and the Ca/Mg-P fractions, respectively [23], and P is known to be a nutrient that should be studied in with regard to the changes in land-use [24]. In this context, it is helpful to study various P forms that govern P availability in adjacent cropland and forestland in the same land unit to determine if any difference exists between the two land-use types.
Integrating trees into the agricultural landscape enhances organic matter input to the soil from litterfall [25], which can result in a high proportion of Org-P in the soil [26]. Although nearly 70% of P in forest soil was Org-P, crop production and fertilizer P application resulted in decreased Org-P concentrations and increased inorganic P in soils [27]. Inorganic and Org-P fractions in soils vary in terms of their bioavailability and mobility and Org-P forms in general increase with decreasing soil particle size in forest and cropland soils [28]. Although the Org-P and inorganic P fractions are likely to change due to prolonged P fertilizer application in cropland, the relationship between inorganic and organic P fractions and the plant-available P in soil is not always understood, and the land-use effect on soil P fractions has not been studied in shelterbelt systems.
This study was conducted to evaluate the extent to which agricultural practices have altered the inorganic and organic fractions of P in the land cultivated for crop production as compared to the adjacent forestland in a shelterbelt system in Central Alberta, no such study has been done in the past. The objectives of this research were to determine the effect of land-use type on inorganic and organic P fractions and to identify the P fraction mostly related to the available P based on the study of selected shelterbelt systems in central Alberta. Improved knowledge of the effect of land-use type on the distribution of P forms will inform better management practices of soil P in shelterbelt systems that could benefit agricultural production as well as environmental quality.
2. Materials and Methods
2.1. Site Description and Soil Sampling
This study was conducted at six sites (or six replications) located in three counties in central Alberta: Sturgeon, Thorhild, and Lacombe (Figure S1). Two sites were selected from each county and each site comprised of a cropland and forestland pair, allowing a pairwise comparison to be made. Within each pair, the site conditions (e.g., soil properties and climatic conditions) for the two land-use types (cropland vs forestland) were similar before the land diverged into cropland and forestland. In the sites located in the north end (Thorhild) and south end (Lacombe) sampling area, the mean annual air temperature based on the 1981–2010 tri-decadal climate period was 1.9 °C and 2.4 °C, respectively, and mean annual precipitation was 463 mm and 448 mm, respectively [29]. Having the six pairs distributed widely allows our study results to be applicable over a broad geographic region, rather than just for a single site. Luvisols (Boralfs in the USDA soil classification system [30], same below), Dark Gray Chernozems (Boralfic Boroll), and Black Chernozems (Udic Boroll) [30] were the dominant soils in the north, central and south areas, respectively, and the soils have a loam texture [31].
In each site, trees were planted in 1–2 rows (3–5 m wide) to establish the forestland around the edge of agricultural lands. Forestland was comprised of 20–50-year-old trees, and white spruce (Picea glauca Moench) was the dominant species [32]. Adjacent to the forestland, the cropland was typically rotated among barley (Hordeum vulgare), wheat (Triticum aestivum), canola (Brassica napus), or pea (Pisum sativum) crops. Agricultural management practices included annual fertilizer application up to 120 kg N ha−1 year−1 and 25 kg P ha−1 year−1 and minimum tillage [31]. At the minimum, those forestlands had been out of the influence of direct agricultural management (such as P fertilization) for 30 years.
Soil samples were collected after crop harvest in September–October 2012. First, a transect of 30–50 m long was established in both the cropland and forestland. The transect in the cropland was established at least one tree height (~30 m) away from the nearest tree to reduce the immediate impact of trees at the proximity to cropland, while the transect in the forestland was located in the center of the treed area. The paired cropland and forestland transects were located on the same ecosite with similar slope, elevation, landform, and drainage class as much as possible. Mineral soil samples were then collected along each transect from 0–10 and 10–30 cm depths using a 3.2 cm diameter corer, after removing the surficial organic layer in soil and fresh litter. A composite sample for each depth and each transect was obtained by mixing ten soil cores, and fresh soil samples were air-dried in the laboratory at room temperature (20–25 °C) and then passed through a 2 mm sieve.
2.2. Analysis of Basic Soil Chemical and Physical Properties
Soil pH was measured in a 1:2 (w:v) mixture of soil to 0.01 mol L−1 CaCl2 solution with a PHH-200 pH meter (Omega Eng. Inc., Stamford CT, USA. Total C was measured with the use of an ECS 4010 Elemental Analyzer (Costech International Strumatzione, Florence, Italy). Soil samples were taken per depth in triplicate using metal rings (106 cm3 volume) and oven-dried at 105 °C to determine soil bulk density. The hydrometer method [33] was used to determine soil texture by dispersing 40 g of soil (100 g for sandy or loamy sand soils) in 400 mL of Calgon® [(NaPO3)6] solution (50 g L−1). Cation exchange capacity was determined by extracting 3 g of air-dried soil with 30 mL of 0.1 mol L−1 BaCl2 solution. The sample was slowly shaken for 2 h (15 rpm), centrifuged for 23 min, filtered using Whatman No. 41 filter papers (20 μm pore size) and atomic absorption spectrophotometry was used to measure cations in the soil extract. Mehlich-3 extraction of soil samples was conducted to determine extractable P, Ca2+, Mg2+, Fe3+ and Al3+ [34]. A 2.5-g sample of soil was extracted using 25 mL of the Mehlich-3 solution that was composed of 0.2 mol L−1 CH3COOH, 0.25 mol L−1 NH4NO3, 0.015 mol L−1 NH4F, 0.013 mol L−1 HNO3, and 0.001 mol L−1 EDTA. The soil and solution mixture was shaken for 5 min at 120 strokes per minute, and then soil extract was filtered with a Whatman No. 40 filter paper. A PerkinElmer Optima 3000 DV inductively coupled plasma mass spectrometer (ICP-MS) (PerkinElmer Inc., Shelton, CT) was used to measure cation concentrations in the soil extract.
2.3. Soil P extraction and Fractionation
The PKelowna extraction was done by extracting soil using the modified Kelowna reagent that was composed of 0.015 mol L−1 NH4F, 0.25 mol L−1 CH3COONH4, and 0.25 mol L−1 CH3COOH [35]. A 2.5 g of soil was extracted with 25 mL of the reagent by shaking for 15 min, and then the molybdate-ascorbic acid method was used to measure P in the filtered solution colorimetrically at a wavelength of 882 nm [36] using a spectrophotometer (GENESYSTM 10 Series). The PMehlich was determined together with the analysis of Mehlich extractable cations by extracting the soil with Mehlich-3 solution. The P adsorption maximum was estimated using a single point P adsorption (P150) determined at 150 mg P L−1 concentration (made in 0.01 mol L−1 KCl) by extracting 2 g of air-dried soil with 20 mL of the 150 mg P L−1 solution [37]. The soil suspension was shaken for 24 h at room temperature after adding two drops of toluene to inhibit microbial activity and then centrifuged at 3000× g for 10 min. The soil suspension was filtered using a 0.45 µm Fisherbrand™ syringe filter and P concentration was determined using the molybdate-ascorbic acid method as described above. The P saturation index (Psi) was determined as the molar ratio of Mehlich-3 extractable P to Mehlich-3 extractable (Al + Fe) in mmol kg−1 [38].
Chemical fractionation of P was conducted by sequentially extracting 2 g of soil with 20 mL of extractants in the following order: deionized water, 0.1 mol L−1 NaOH, and 0.5 mol L−1 HCl to determine water-extractable P, Fe/Al-P, and Ca/Mg-P, respectively [39]. The amount of Org-P was calculated by the difference between the total P concentration in the digested and undigested NaOH extracts. Inorganic P determination in soil extracts and digests was carried out colorimetrically according to the molybdate-ascorbic acid method. The Kjeldahl digestion (HClO4 and HNO3 acid digestion) of soil samples [40] and the colorimetric method were used to measure pseudototal P in the soil. The sum of Water-P, Fe/Al-P, and Ca/Mg-P will be named as the inorganic P fraction hereafter. The difference between total P and the total extractable P was identified as Residual P.
2.4. Statistical Analysis
All statistical analyses were performed using the SAS software (SAS 9.2, SAS Institute Inc., Cary, NC, USA. Analysis of variance was conducted based on a split-plot design to determine the effects of land-use type (main plot) and soil depth (subplot) and their interaction on soil physical and chemical properties. Normality of distribution was tested using Shapiro–Wilk’s and log transformation was applied to PKelowna, PMehlich, Water-P, Fe/Al-P, total P and Residual P to make the distribution normal prior to statistical analysis. The transformation was conducted to meet the assumptions (e.g., normality of distribution) for statistical analysis. However, untransformed data are presented in this paper. A Pearson correlation analysis was performed between P150, soil properties, and concentrations of soil P fractions in the 0–10 cm layer of both cropland and forestland. Linear regression analysis was conducted between PKelowna, PMehlich, Psi and concentrations of P fractions in both soil layers in each land-use type. Tukey’s multiple comparison test was conducted for multiple comparisons. Given the study was conducted across a wide geographic range with large variation in soil properties as well as vegetation composition, a p-value of 0.10 was used to evaluate the significance so that the risk for committing a type II error is reduced [31,41].
A principal component analysis (PCA) was conducted to reveal the differences between cropland and forestland within each site. The PCA was applied to PKelowna, PMehlich, concentrations of P fractions and Mehlich extractable cations of 0–10 cm layer in all sites using the PROC FACTOR procedure. A correlation matrix was used to derive principal components (PC), and the final component structure was unrotated. Only PCs with eigenvalues greater than one were considered.
3. Results
3.1. Subsection Soil Properties and P Status in Cropland and Forestland
There were no differences in soil properties in the 0–10 cm layer except that the bulk density was greater in cropland than in forestland (Table 1). The mean pH in the 0–10 cm soil was 6 in both the cropland and forestland. A land-use by depth interaction was found for PKelowna, PMehlich, P150, and Psi. The PKelowna ranged from 10 to 170 and 2 to 57 mg kg−1 in cropland and forestland, respectively. As expected PKelowna, PMehlich and P150 in the 0–10 cm layer were greater in cropland than in forestland, but this was not the case in the 10–30 cm layer (Figure 1a). Moreover, PKelowna and PMehlich were greater in the 0–10 cm than in the 10–30 cm layer only in cropland (Figure 1a). The PMehlich was greater than PKelowna in the soil samples measured when the total sampling depth (0–30 cm) was considered in each land-use type given the slope for the regression line was less than one (Figure S2). The extractability of Mehlich-3 solution was approximately two-fold greater than that of the modified Kelowna solution (Figure S2). The inorganic P fraction was greater in the 0–10 cm depth of cropland compared to that of forestland (Figure 1c).
The P150 was different between the cropland and forestland in the 0–10 cm layer but did not differ between the two layers in each land-use type (Figure 1a). The P150 in the 0–10 cm layer was positively correlated with total C in cropland and Fe, Al and Fe/Al-P in the forestland (Table 2). The Psi was greater in the 0–10 cm than in the 10–30 cm layer only in the cropland. The C:P (based on total P) ratio was higher in the forestland than in the cropland while the C:P did not differ with depth in each land-use type (Figure 1b).
3.2. Soil P Fractionation in Cropland and Forestland
The Water-P was greater in the 0–10 cm than in the 10–30 cm layer in both land-use types (Table 3). Among all P fractions, a soil depth by land-use type interaction was found only for Fe/Al-P and Org-P. Both P fractions were greater in the 0–10 cm than in the 10–30 cm layer of the cropland but were not different in the forestland (Table 3). The inorganic P fraction in the 0–30 cm depth was significantly related to PKelowna in both land-use types (Table 4). The Fe/Al-P explained about 50 and 45% of the variations of PKelowna in the 0–30 cm layer in the cropland and forestland, respectively (Table 4). Moreover, the difference between PKelowna and PMehlich in each site was positively related to Ca/Mg-P, Fe/Al-P and Org-P in the 0–30 cm layer in the cropland but not in the forestland (Figure 3). The Psi was also positively related to inorganic P fraction in the cropland (0–30 cm) but not in the forestland (Figure 2b).
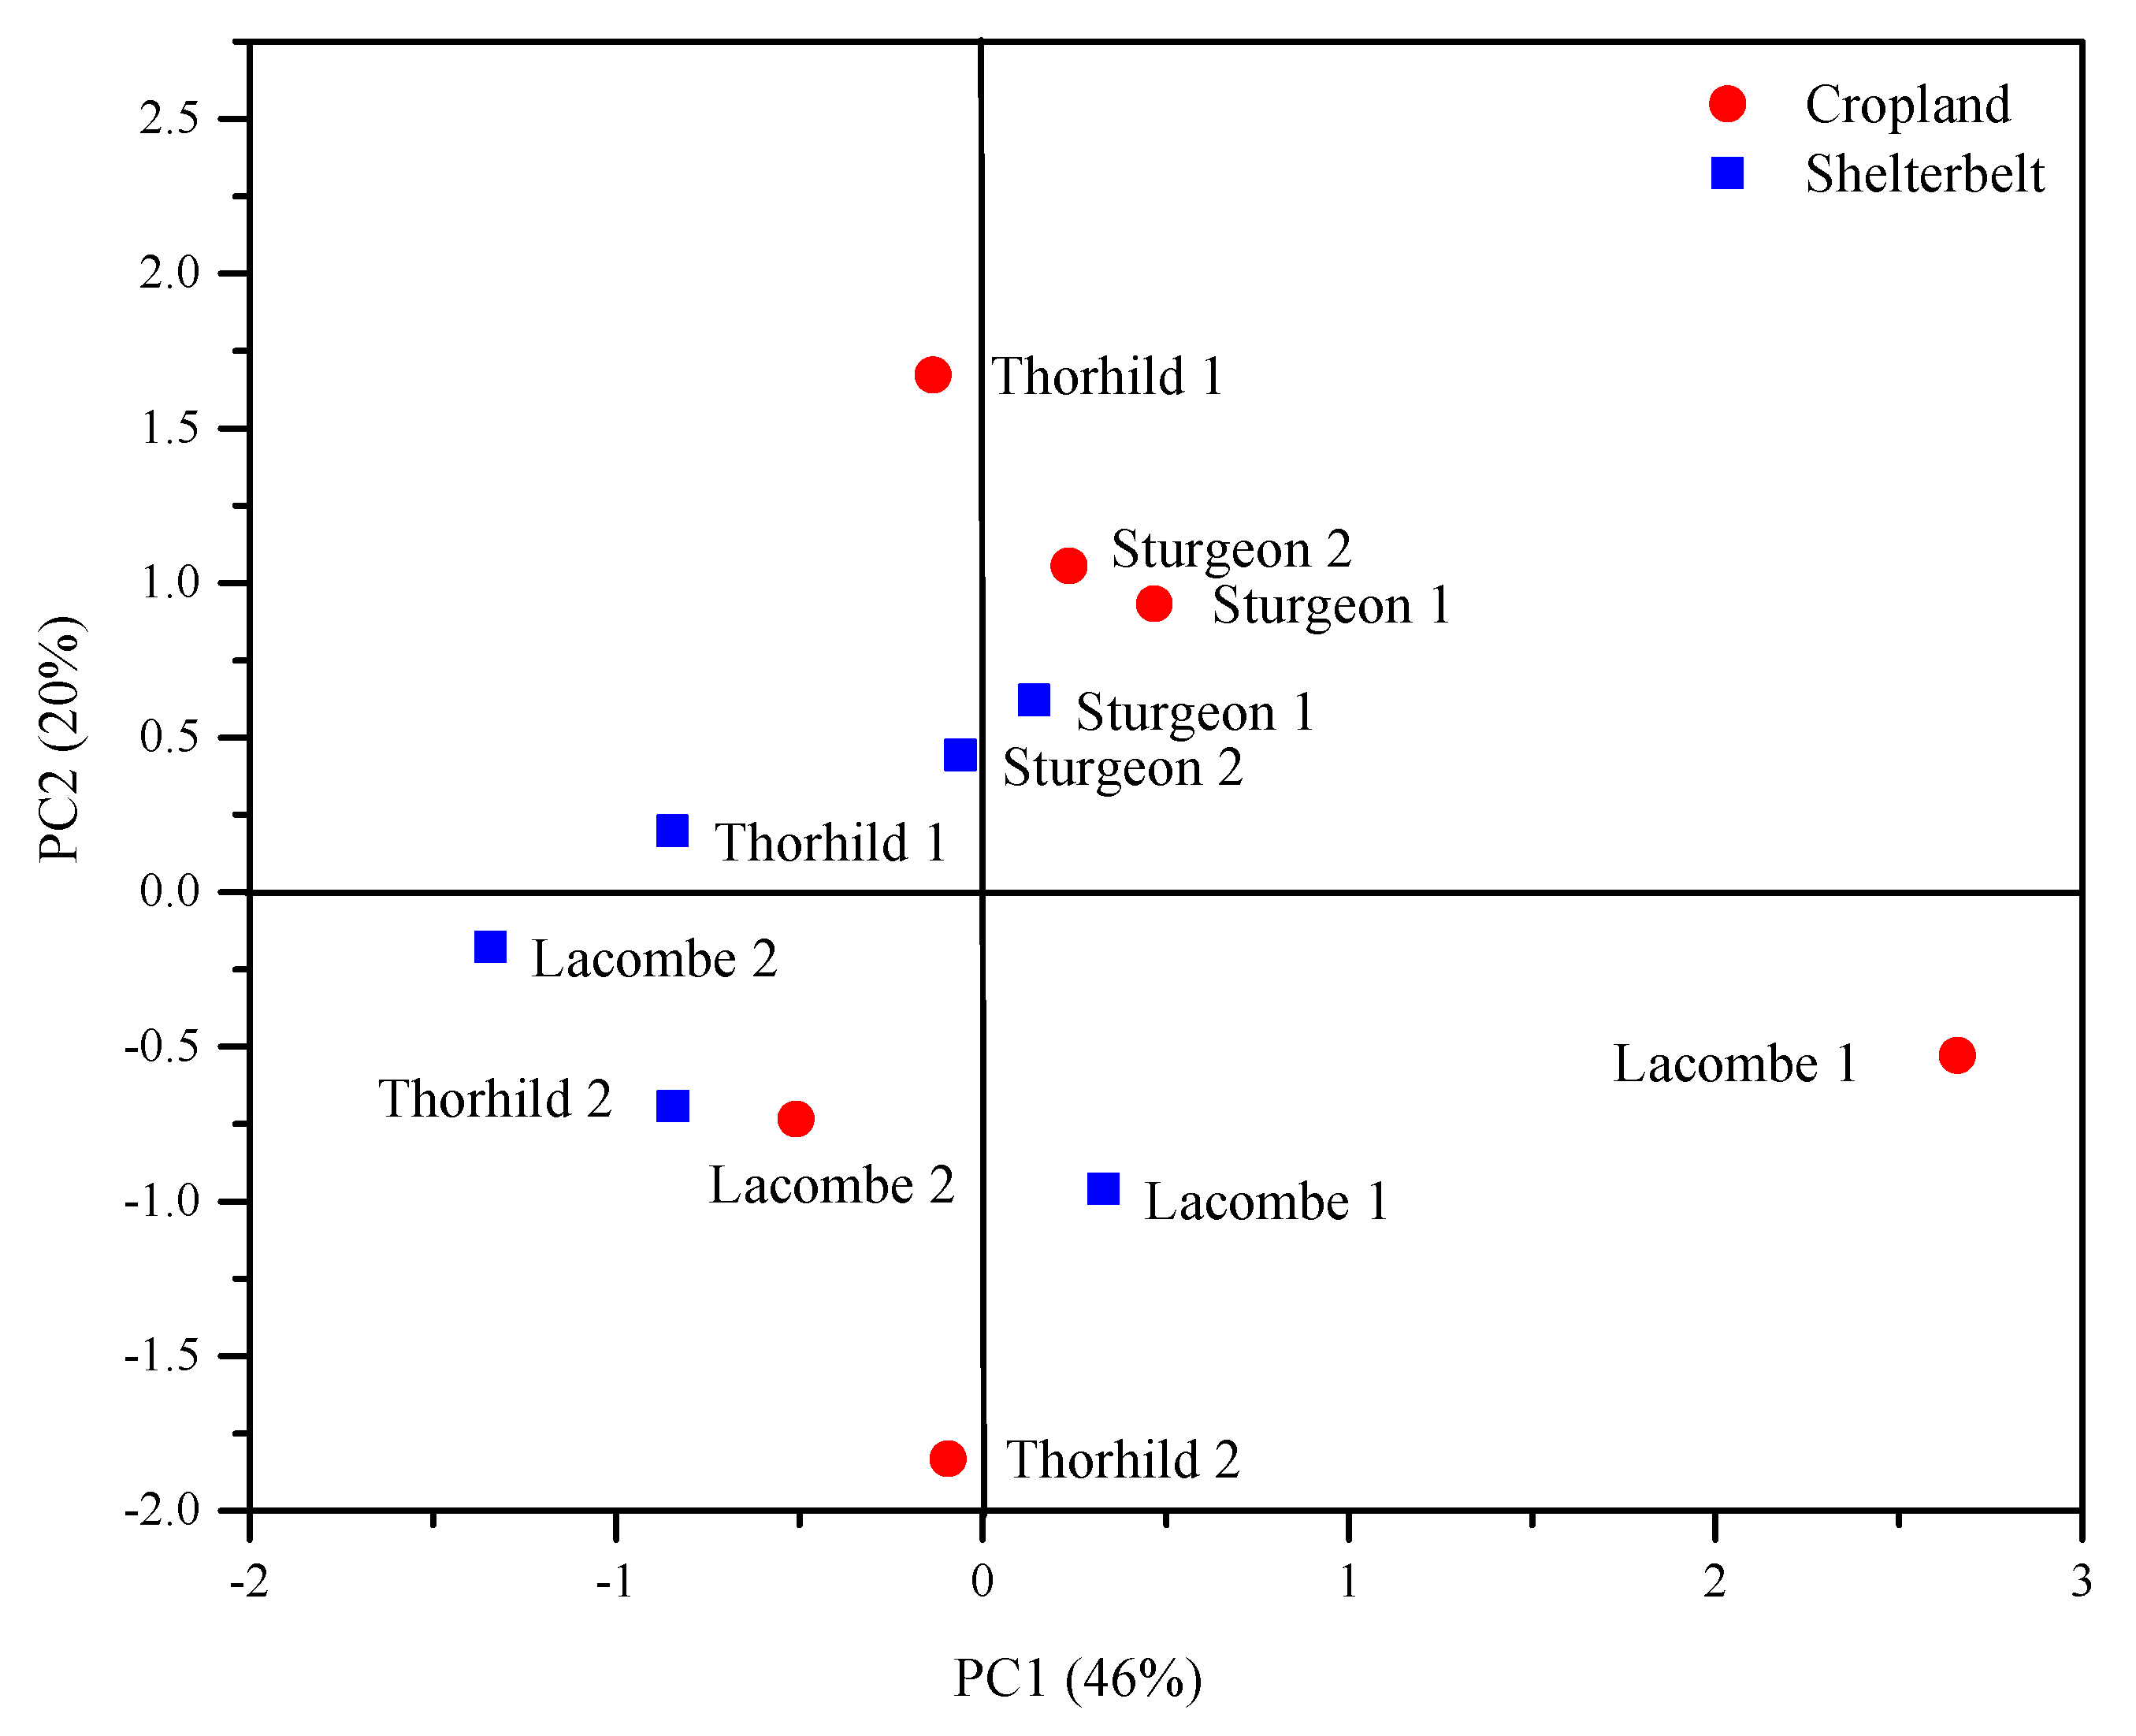
The PCA analysis of soil properties revealed differences between cropland and forestland in three sites based on the coefficients of the first two PCs (Figure 3). Two significant PC were extracted from the PCA, which explained 46% (PC1) and 20% (PC2) of the variance (Figure 3). Cropland and forestland sites were segregated along the two PCs reflecting differences between two land-use types with respect to soil P solubility, fractionation, Fe, Al, Ca and Mg concentration. The PC1 showed high loadings of PKelowna, PMehlich, Ca/Mg-P, Fe/Al-P, Org-P and Fe concentrations with a positive effect (Table 5). The PC2 was associated with Al and Ca with a negative and a positive effect, respectively.
4. Discussion
4.1. Greater P Build-up in the Surface Soil in the Cropland than in the Forestland
The PKelowna in the 0–10 cm layer of cropland was twice as high as that in the forestland, indicating that soil P was built up by agricultural practices such as P-fertilizing and minimum tillage (Figure 1a), suggesting greater P solubility in the cropland than in the forestland. The limited mobility of P in soils leads to the accumulation of P in surface soils [42] and increased plant-available P in the soil was related to the long-term P fertilizer application [43]. In addition to P inputs, the lower C:P ratio in the 0–10 cm layer of cropland may result in organic P mineralization [44], which would further enhance available P in the cropland than in the forestland. Fine roots of Picea glauca might be present up to the 45 cm depth in the soil [45], and thus greater root exploitation and lack of P input caused lower soil test P in forestland than in cropland. The similar soil test P in both soil layers indicated the utilization of P over the 0–30 cm depth by Picea species in the studied forestland. We acknowledge that these results are in line with what we expected from soils that have diverged in land use 30–40 years ago and that croplands have more P because of fertilization practices and the tendency of soils to adsorb PO43−.
The upper-level agronomic threshold of PKelowna in the top 15 cm of soil is 60 mg kg−1 for most crops grown in Alberta [12]. Three cropland sites (one site in Sturgeon county and both sites in Lacombe county) contained high PKelowna (60–170 mg kg−l) in the 0–10 cm layer while the other three sites had PKelowna (10–46 mg kg−1) lower than the agronomic threshold. The low PKelowna in some cropland sites is consistent with findings reported by [8] where the mean extractable P concentrations varied between 25 and 30 mg kg−1 in the top 15 cm soil for the majority of eco-districts in Alberta.
Phosphorus sorption capacity in soils is related to the clay content [46], and the strong relationship between clay content and P150 (Table 2) in cropland implied that clay particles were more reactive and more effective in retaining P in the cropland than in the forestland. Interestingly, P150 was positively related to Al in the forestland (Table 2), and this calls for further investigations on the compositional differences of Al forms given the similar pH and Al concentrations between the two land-use types. Unlike in the forestland, greater PKelowna with high P150 suggests saturation of P sorption sites in some croplands or reflects the degree of desorption of retained P in cropland soils (Figure S3). Although the inherent P sorption capacity seemed to be similar in the two land-use types (Figure S3), P input caused the saturation of P sorption sites in the cropland in contrast to that in the forestland. The high Psi and soil test P are related to the ecological risk associated with inorganic P loss (surface run-off and/or leaching) from the cropland [9,47]. Excessive P loss from cropland soils can decrease the quality of surface water. Although the increasing inorganic P resulted in increasing Psi in cropland (Figure 2b), soil test P in forestland was not influenced by the adjacent cropland with high Psi and soil test P that was greater than the agronomic threshold. The two land-use types had the same ecosite type and were on a flat topography. In the cropland, both soil test P, P150 and Psi were related to the inorganic P fraction and indicated P build-up in the surface soil.
4.2. Soil Test P (PKelowna) is Related to Fe/Al-P
The greater inorganic P concentration in the 0–10 cm soil in the cropland than in the forestland was a remarkable difference between two land-use types (Figure 1c) caused by agricultural practices. Phosphorus fertilizer treatments showed a positive effect on the inorganic P fractions in-long-term crop rotation plots on a Luvisolic soil and a Chernozemic soil in Alberta, indicating that most inorganic P fractions were related to P fertility in the long-run [13]. Moreover, inorganic P was increased in the 0–20 cm soil in managed grasslands [48] and croplands as compared to natural forestlands [49]. The increased availability of inorganic P in the cropland was evident in the strong relationship between inorganic P fraction and PKelowna and the greater amount of P that was extracted by the modified Kelowna method in the cropland than in the forestland (i.e., 58 vs. 46% of the total P). Although the Org-P comprised a larger fraction of total P than the inorganic P in the cropland (Table 3), PKelowna was not related to Org-P in the cropland (Table 4). A high level of the recalcitrance of the organic P pool that acts as a sink for inorganic P has been reported [50]. The weak correlation between available P and Org-P in Alberta soils [14] and the strongest correlation between P150 and soil C are consistent with the lack of relationships between PKelowna and Org-P in the cropland in our study. The stable soil organic matter pool may be related to the low availability of Org-P in Picea based forestlands in shelterbelt systems [14].
The readily extractable P associated with Fe and Al strongly contributed to PKelowna in the cropland and forestland. However, it was interesting to note that P150 was positively correlated with Fe and Al in the forestland but not in the cropland (Table 2), indicating that Fe and Al played a greater role in affecting P availability in the soil under forestland than that in the cropland soil. However, the geochemical investigation of Fe/Al-P in the forestland may provide better insights into the P behavior in the forestland. The weak relationship between PKelowna or PMehlich and Ca/Mg-P (Table 4) cannot be related to the low solubility of calcium phosphates since soil pH was around 6 in both land-use types where calcium phosphates are soluble [51]. In addition, Mehlich 3 and Kelowna are acid extractants, which can dissolve more Ca-P and the above relationships weak. However, the extractability of P by the Mehlich-3 solution was greater than the modified Kelowna solution with increasing Fe/Al-P and Ca/Mg-P concentrations in the 0–30 cm soil layer in the cropland (Figure 2a), indicating the greater solubility of the inorganic P fraction in the cropland than in the forestland, likely related to the external P input and the lower organic C content in the cropland soil that decreases P fixation by organic matter. Therefore, the fraction of inorganic P that was not extracted by the modified Kelowna method (i.e., non-available P) may consist of extractable P that could be released into the soil solution through desorption as the amount of available P decreases in the soil [50]. The importance of plant non-available P forms as P reserves may contribute to the P nutrition of crops [52] since desorption, mineralization, and weathering may change non-available P forms into available forms in the cropland. Unlike inorganic P, the lack of relationship between Org-P and soil test P in the cropland and forestland may be due to the recalcitrant nature of the Org-P fraction in the soil (Figure 2a and Table 4). Given the low soil test P, replenishment of inorganic P by mineralization of soil organic P fraction seems to be important to provide available P for trees in the forestland as the Org-P is the largest fraction of the extractable P in the soil.
The PC1 in the PCA plots indicated that croplands were distinct from the forestland, but such difference between land-use types was site-dependent. The least difference between the cropland and the forestland was found in sites located in Sturgeon County (Figure 3) while, the cropland and forestland in Lacombe and Thorhild counties were mainly differentiated by PC1 and PC2, respectively (Figure 3). According to the PC1, the differentiation between cropland and forestland in different counties was increased in the following order: Sturgeon > Thorhild > Lacombe. The absence of clear segregation between the cropland and forestland in all sites supported that P availability and forms depend on the inherent characteristic of each site [53]. Moreover, accumulation of P species in soils with different land-uses was attributed to the collective influence of biotic and abiotic factors such as variation between soil, site, and management factors within a land use [54]. The PC1 tended to be positively contributed by extractable P and Fe/Al-P having the largest PC loading (Table 5). Therefore, in addition to the strong positive relationship between Fe/Al-P fraction and PKelowna (i.e., available P) (Table 4), the Fe/Al-P fraction is also related to the difference between the studied shelterbelt systems regarding P status in soil (Table 5).
5. Conclusions
Our study provides insights into the linkages among soil test P, P fractions and P sorption properties in cropland and forestland in shelterbelt systems. The difference in the P status between the cropland and the forestland in shelterbelt systems was dependent on the site location but soil test P was mainly governed by soluble inorganic P that was associated with Fe and Al in both the cropland and the forestland. A direct impact of the P build-up in the cropland on the P status in forestland was not evident in this study as seen by low soil test P in the forestland. However, given the low soil test P in the forestland as compared to the cropland, competition for available P may exist between trees and crops at the boundary between the cropland and the forestland. Such relationships are worth to be studied in the future. Moreover, considering a large amount of P associated with the organic fraction in cropland and forestland, further exploitation of organically bound P as a potential source of available P is worthwhile in future P management plans. Improved knowledge of the sources and types of organic P and factors controlling organic P mineralization is needed in developing management strategies to promote organic P availability for plant production.
Supplementary Materials
The following are available online at https://www.mdpi.com/1999-4907/10/11/1001/s1, Figure S1: Map of Canada and the Province of Alberta showing the location of six study sites of shelterbelt systems. Figure S2: The relationship between Mehlich-3 extractable P and modified Kelowna extractable P in the 0–30 cm depth of selected cropland and forestland in shelterbelt systems in central Alberta. Figure S3: The relationship between P sorption index and P extracted by the modified Kelowna method.
Author Contributions
Conceptualization, S.X.C. and M.C.W.M.W.; methodology, M.C.W.M.W.; formal analysis, M.C.W.M.W.; resources, S.X.C.; writing—original draft preparation, M.C.W.M.W.; writing—review and editing, S.X.C., M.C.W.M.W., and F.M.; visualization, M.C.W.M.W.; funding acquisition, S.X.C.
Funding
This research was funded by the Natural Science and Engineering Research Council of Canada (NSERC), grant number 249664-2013.
Acknowledgments
We thank the China Scholarship Council (grant #201406515044) for supporting FXM’s visit to Canada and Mark Baah-Acheamfour for assistance in sample collection.
Conflicts of Interest
The authors declare no conflict of interest.
References
- Thevathasan, N.V.; Gordon, A.M.; Bradley, R. Agroforestry research and development in Canada: The way forward. In The Future of Global Land Use; Nair, P.K.R., Garrity, D.P., Eds.; Springer: Dordrecht, The Netherlands, 2012; pp. 247–283. [Google Scholar]
- McNaughton, K.G. Effects of windbreaks on turbulent transport and microclimate. Agric. Ecosyst. Environ. 1988, 22–23, 17–39. [Google Scholar] [CrossRef]
- Lorenz, K.; Lal, R. Soil organic carbon sequestration in agroforestry systems. Rev. Agron. Sustain. Dev. 2014, 34, 443–454. [Google Scholar] [CrossRef]
- Kort, J.; Turnock, R. Carbon reservoir and biomass in Canadian prairie shelterbelts. Agrofor. Syst. 1998, 44, 175–186. [Google Scholar] [CrossRef]
- Dhillon, G.S.; Van Rees, K.C.J. Soil organic carbon sequestration by shelterbelt agroforestry systems in Saskatchewan. Can. J. Soil Sci. 2017, 97, 394–409. [Google Scholar] [CrossRef]
- Kowalchuk, T.E.; de Jong, E. Shelterbelts and their effect on crop yield. Can. J. Soil Sci. 1995, 75, 543–550. [Google Scholar] [CrossRef]
- Qiao, Y.; Fan, J.; Wang, Q. Effects of farmland shelterbelts on accumulation of soil nitrate in agro-ecosystems of an oasis in the Heihe River Basin, China. Agric. Ecosyst. Environ. 2016, 235, 182–192. [Google Scholar] [CrossRef]
- Manunta, P.; Kryzanowski, L.; Keyes, D. Preliminary Assessment of Available Soil P in Alberta: Status and Trends; Soil Quality Program, Conservation and Development Branch; Alberta Agriculture, Food and Rural Development: Edmonton, AB, Canada, 2000; p. 64.
- Paterson, B.A.; Olson, B.M.; Bennett, D.R. Alberta Soil Phosphorus Limits Project; Volume 1: Summary and recommendations; Alberta Agriculture, Food and Rural Development: Lethbridge, AB, Canada, 2006; p. 82.
- Zhang, M.; Wright, R.; Heaney, D.; Vanderwe, D. Comparison of different phosphorus extraction and determination methods using manured soils. Can. J. Soil Sci. 2004, 84, 469–475. [Google Scholar] [CrossRef]
- McKenzie, R.H.; Kryzanowski, L.; Cannon, K.; Solberg, E.; Penney, D.; Coy, G.; Heaney, D.; Harapiak, J.; Flore, N. Field Evaluation of Laboratory Tests for Soil Phosphorus; Alberta Agricultural Research Institute Report No. 90 M230; Alberta Innovation and Science: Edmonton, AB, Canada, 1995. [Google Scholar]
- Howard, A.E. Agronomic thresholds for soil phosphorus in Alberta: A review. In Alberta Soil Phosphorus Limits Project; Alberta Agriculture, Food and Rural Development: Lethbridge, AB, Canada, 2016; Volume 5, p. 42. [Google Scholar]
- McKenzie, R.H.; Stewart, J.W.B.; Dormaar, J.F.; Schaalje, G.B. Long-term crop rotation and fertilizer effects on phosphorus transformations: I. In a Chernozemic soil. Can. J. Soil Sci. 1992, 72, 569–579. [Google Scholar] [CrossRef] [Green Version]
- McKenzie, R.H.; Bremer, E. Relationship of soil phosphorus fractions to phosphorus soil tests and fertilizer response. Can. J. Soil Sci. 2003, 83, 443–449. [Google Scholar] [CrossRef]
- Chirino-Valle, M.R.D.; Condron, L.M. Impact of different tree species on soil phosphorus immediately following grassland afforestation. J. Soil Sci. Plant Nutr. 2016, 16, 477–489. [Google Scholar] [CrossRef]
- Li, J.; Richter, D.; Mendoza, A.; Heine, P. Four-decade responses of soil trace elements to an aggrading old-field forest: B, Mn, Zn, Cu, and Fe. Ecology 2008, 89, 2911–2923. [Google Scholar] [CrossRef]
- Liversley, S.J.; Gregory, P.J.; Buresh, R.J. Competition in tree row Agroforestry systems. 3. Soil water distribution and dynamics. Plant Soil 2004, 264, 129–139. [Google Scholar] [CrossRef]
- Bünemann, E.K.; Heenan, D.P.; Marschner, P.; McNeill, A.M. Long-term effects of crop rotation, stubble management and tillage on soil phosphorus dynamics. Soil Res. 2006, 44, 611–618. [Google Scholar] [CrossRef]
- Sharpley, A.N.; Kleinman, P.J.A.; McDowell, R.W.; Gitau, M.; Bryant, R.B. Modeling phosphorus transport in agricultural watersheds: Processes and possibilities. J. Soil Water Conserv. 2002, 57, 425–439. [Google Scholar]
- Hedley, M.J.; Stewart, J.W.B.; Chauhan, B.S. Changes in inorganic and organic soil phosphorus fractions by cultivation practices and by laboratory incubations. Soil Sci. Soc. Am. J. 1982, 46, 970–976. [Google Scholar] [CrossRef]
- Tiessen, H.; Stewart, J.W.B.; Cole, C.V. Pathways of phosphorus transformations in soils of differing pedogenesis. Soil Sci. Soc. Am. J. 1984, 48, 853–858. [Google Scholar] [CrossRef]
- Motavalli, P.P.; Miles, R.J. Soil phosphorus fractions after 111 years of animal manure and fertilizers applications. Biol. Fertil. Soils 2002, 36, 35–42. [Google Scholar] [CrossRef]
- Castillo, M.S.; Wright, A.L. Microbial activity and phosphorus availability in a subtropical soil under different land uses. World J. Agric. Sci. 2008, 4, 314–320. [Google Scholar]
- Garcia-Montiel, D.C.; Nelly, C.H.; Melillo, J.; Thomas, S.; Steudler, P.A.; Cerri, C.C. Soil phosphorus transformation following forest clearing for pasture in the Brazilian Amazon. Soil Sci. Soc. Am. J. 2000, 64, 1792–1804. [Google Scholar] [CrossRef]
- Paul, K.I.; Polglase, P.J.; Nyakuengama, J.G.; Khanna, P.K. Change in soil carbon following afforestation. For. Ecol. Manag. 2002, 168, 241–257. [Google Scholar] [CrossRef]
- Frossard, E.; Stewart, J.W.B.; St. Arnaud, R.J. Distribution and mobility of phosphorus in grassland and forest soils of Saskatchewan. Can. J. Soil Sci. 1989, 69, 401–416. [Google Scholar] [CrossRef]
- Vaithiyanathan, P.; Correll, D.L. The Rhode River Watershed: Phosphorus Distribution and Export in Forest and Agricultural Soils. J. Environ. Qual. 1992, 21, 280–288. [Google Scholar] [CrossRef]
- Frossard, E.; Condron, L.M.; Oberson, A.; Sinaj, S.; Fardeau, J.C. Processes governing phosphorus availability in temperate soils. J. Environ. Qual. 2000, 29, 15–23. [Google Scholar] [CrossRef]
- Environment Canada. Alberta Weather Condition. 2012. Available online: http://weather.gc.ca/forecast/canada/index e.html?id=AB (accessed on 2 May 2017).
- Soil Classification Working Group. The Canadian System of Soil Classification; NRC Research Press: Ottawa, ON, Canada, 1998; p. 187. [Google Scholar]
- Baah-Acheamfour, M.; Chang, S.X.; Cameron, N.C.; Bork, E.W. Carbon pool size and stability are affected by trees and grassland cover types within agroforestry systems of western Canada. Agric. Ecosyst. Environ. 2015, 213, 105–113. [Google Scholar] [CrossRef]
- Lim, S.S.; Baah-Acheamfour, M.; Choi, W.J.; Arshad, M.A.; Fatemi, F.; Banerjee, S.; Carlyle, C.N.; Bork, E.W.; Park, H.J.; Chang, S.X. Soil organic carbon stocks in three Canadian agroforestry systems from surface organic to deeper mineral soils. For. Ecol. Manag. 2018, 417, 103–109. [Google Scholar] [CrossRef]
- Carter, M.R.; Gregorich, E.G. Soil Sampling and Methods of Analysis, 2nd ed.; Francis and Taylor Group LLC/CRC Press: Boca Raton, FL, USA, 2006; pp. 334887–342742. [Google Scholar]
- Mehlich, A. Mehlich 3 soil test extractant: A modification of Mehlich 2 extractant. Commun. Soil Sci. Plant Anal. 1984, 15, 1409–1416. [Google Scholar] [CrossRef]
- Qian, P.; Schoenau, J.J.; Karamanos, R.E. Simultaneous extraction of available phosphorus and potassium with a new soil test: A modification of the Kelowna extraction. Commun. Soil Sci. Plant Anal. 1994, 25, 627–635. [Google Scholar] [CrossRef]
- Murphy, J.; Riley, J.P. A modified single solution methods for the determination of phosphate in natural water. Anal. Chim. Acta 1962, 27, 31–36. [Google Scholar] [CrossRef]
- Ige, D.V.; Akinremi, O.O.; Flaten, D.N.; Ajiboye, B.; Kashem, M.A. Phosphorus sorption capacity of alkaline Manitoba soils and its relationship to soil properties. Can. J. Soil Sci. 2005, 85, 417–426. [Google Scholar] [CrossRef] [Green Version]
- Kleinman, P.J.A.; Sharpley, A.N. Estimation soil phosphorus sorption saturation from Mehlich-3 data. Commun. Soil Sci. Plant Anal. 2002, 33, 1825–1839. [Google Scholar] [CrossRef]
- Nair, V.D.; Graetz, D.A.; Portier, K.M. Forms of phosphorus in soil profiles from dairies of south Florida. Soil Sci. Soc. Am. J. 1995, 59, 1244–1249. [Google Scholar] [CrossRef]
- Sparks, D.L.; Page, A.L.; Helmke, P.A.; Loeppert, R.H. Methods of Soil Analysis Part 3—Chemical Methods; SSSA Book Ser. 5.3; SSSA, ASA: Madison, WI, USA, 1996. [Google Scholar]
- Baah-Acheamfour, M.; Cameron, N.C.; Bork, E.W.; Chang, S.X. Forest and perennial herbland cover reduce microbial respiration but increase root respiration in agroforestry systems. Agric. For. Meteorol. 2020, 280, 107790. [Google Scholar] [CrossRef]
- Sharpley, A.N. Depth of surface soil-runoff interaction as affected by rainfall, soil slope and management. Soil Sci. Soc. Am. J. 1985, 49, 1010–1015. [Google Scholar] [CrossRef]
- McCollum, R.E. Buildup and decline in soil-phosphorus—30-year trends on a Typic Umprabuult. Agron. J. 1991, 83, 77–85. [Google Scholar] [CrossRef]
- Spohn, M.; Kuzyakov, Y. Phosphorus mineralization can be driven by microbial need for carbon. Soil Biol. Biochem. 2013, 61, 69–75. [Google Scholar] [CrossRef]
- Safford, L.O.; Bell, S. Biomass of fine roots in a white spruce plantation. Can. J. For. Res. 1972, 2, 169–172. [Google Scholar] [CrossRef]
- Soon, Y.K. Solubility and retention of phosphate in soils of the northwestern Canadian prairie. Can. J. Soil Sci. 1991, 71, 453–463. [Google Scholar] [CrossRef]
- Sims, J.T.; Maguire, R.O.; Leyten, A.B.; Gartley, K.L.; Pautler, M.C. Evaluation of Mehlich 3 as an agri-environmental soil phosphorus test for the mid-Atlantic United States of America. Soil Sci. Soc. Am. J. 2002, 66, 2016–2032. [Google Scholar] [CrossRef]
- Von Sperber, C.; Stallforth, R.; Du Preez, C.; Amelung, W. Changes in soil phosphorus pools during prolonged arable cropping in semiarid grasslands. Eur. J. Soil Sci. 2017, 68, 462–471. [Google Scholar] [CrossRef]
- Yang, W.; Cheng, H.; Hao, F.; Ouyang, W.; Liu, S.; Lin, C. The influence of land-use change on the forms of phosphorus in soil profiles from the Sanjiang Plain of China. Geoderma 2012, 189–190, 207–214. [Google Scholar] [CrossRef]
- Costa, M.; Gama-Rodrigues, A.; Gonçalves, J.; Gama-Rodrigues, E.; Sales, M.; Aleixo, S. Labile and non-labile fractions of phosphorus and its transformations in soil under eucalyptus plantations, Brazil. Forests 2016, 7, 15. [Google Scholar] [CrossRef]
- Lindsay, W.L. Chemical Equilibria in Soils; John Wiley and Sons: New York, NY, USA, 1979. [Google Scholar]
- Reddy, D.D.; Rao, A.S.; Takkar, P.N. Effects of repeated manure and fertilizer phosphorus additions on soil phosphorus dynamics under a soybean-wheat rotation. Biol. Fertil. Soils 1999, 28, 150–155. [Google Scholar] [CrossRef]
- Xavier, F.A.D.S.; Almeida, E.F.; Cardoso, I.M. Soil phosphorus distribution in sequentially extracted fractions in tropical coffee-agroecosystems in the Atlantic Forest biome, Southeastern Brazil. Nutr. Cycl. Agroecosyst. 2011, 89, 31–44. [Google Scholar] [CrossRef]
- Stutter, M.I.; Shand, C.A.; George, T.S.; Blackwell, M.S. Land use and soil factors affecting accumulation of phosphorus species in temperate soils. Geoderma 2015, 257, 29–39. [Google Scholar] [CrossRef]
Figure 1.
(a) The average concentrations of modified Kelowna extractable P (phosphorus), Mehlich-3 extractable P and P sorption index, (b) P saturation index and total C:P ratio, (c) inorganic P and organic P concentrations in 0–10 and 10–30 cm depths in studied cropland and forestland in shelterbelt systems in central Alberta. PKelowna and PMehlich are P extracted with modified Kelowna and Mehlich-3 extractions, P150, P sorption index, Psi, P saturation index. Different lower-case letters indicate a significant difference between two depths for a particular soil parameter in cropland at p < 0.01 and asterisks indicate significant differences of particular soil parameters between two land-use types in the 0–10 cm depth at p < 0.01 (n = 6).

Figure 2.
The relationship between (a) the differences between P extracted by Mehlich-3 and modified Kelowna methods and the concentration of different P fractions in the 0–30 cm depth in cropland, and (b) the inorganic P concentration and the P saturation index in the 0–30 cm soil in selected cropland and forestland in shelterbelt systems in central Alberta. Ca/Mg-P, Fe/Al-P, and Org-P indicate P fractions associated with Ca and Mg, Fe and Al and organic compounds, respectively. PKelowna and PMehlich are P extracted with modified Kelowna and Mehlich-3 methods, respectively. Psi stands for P saturation index.
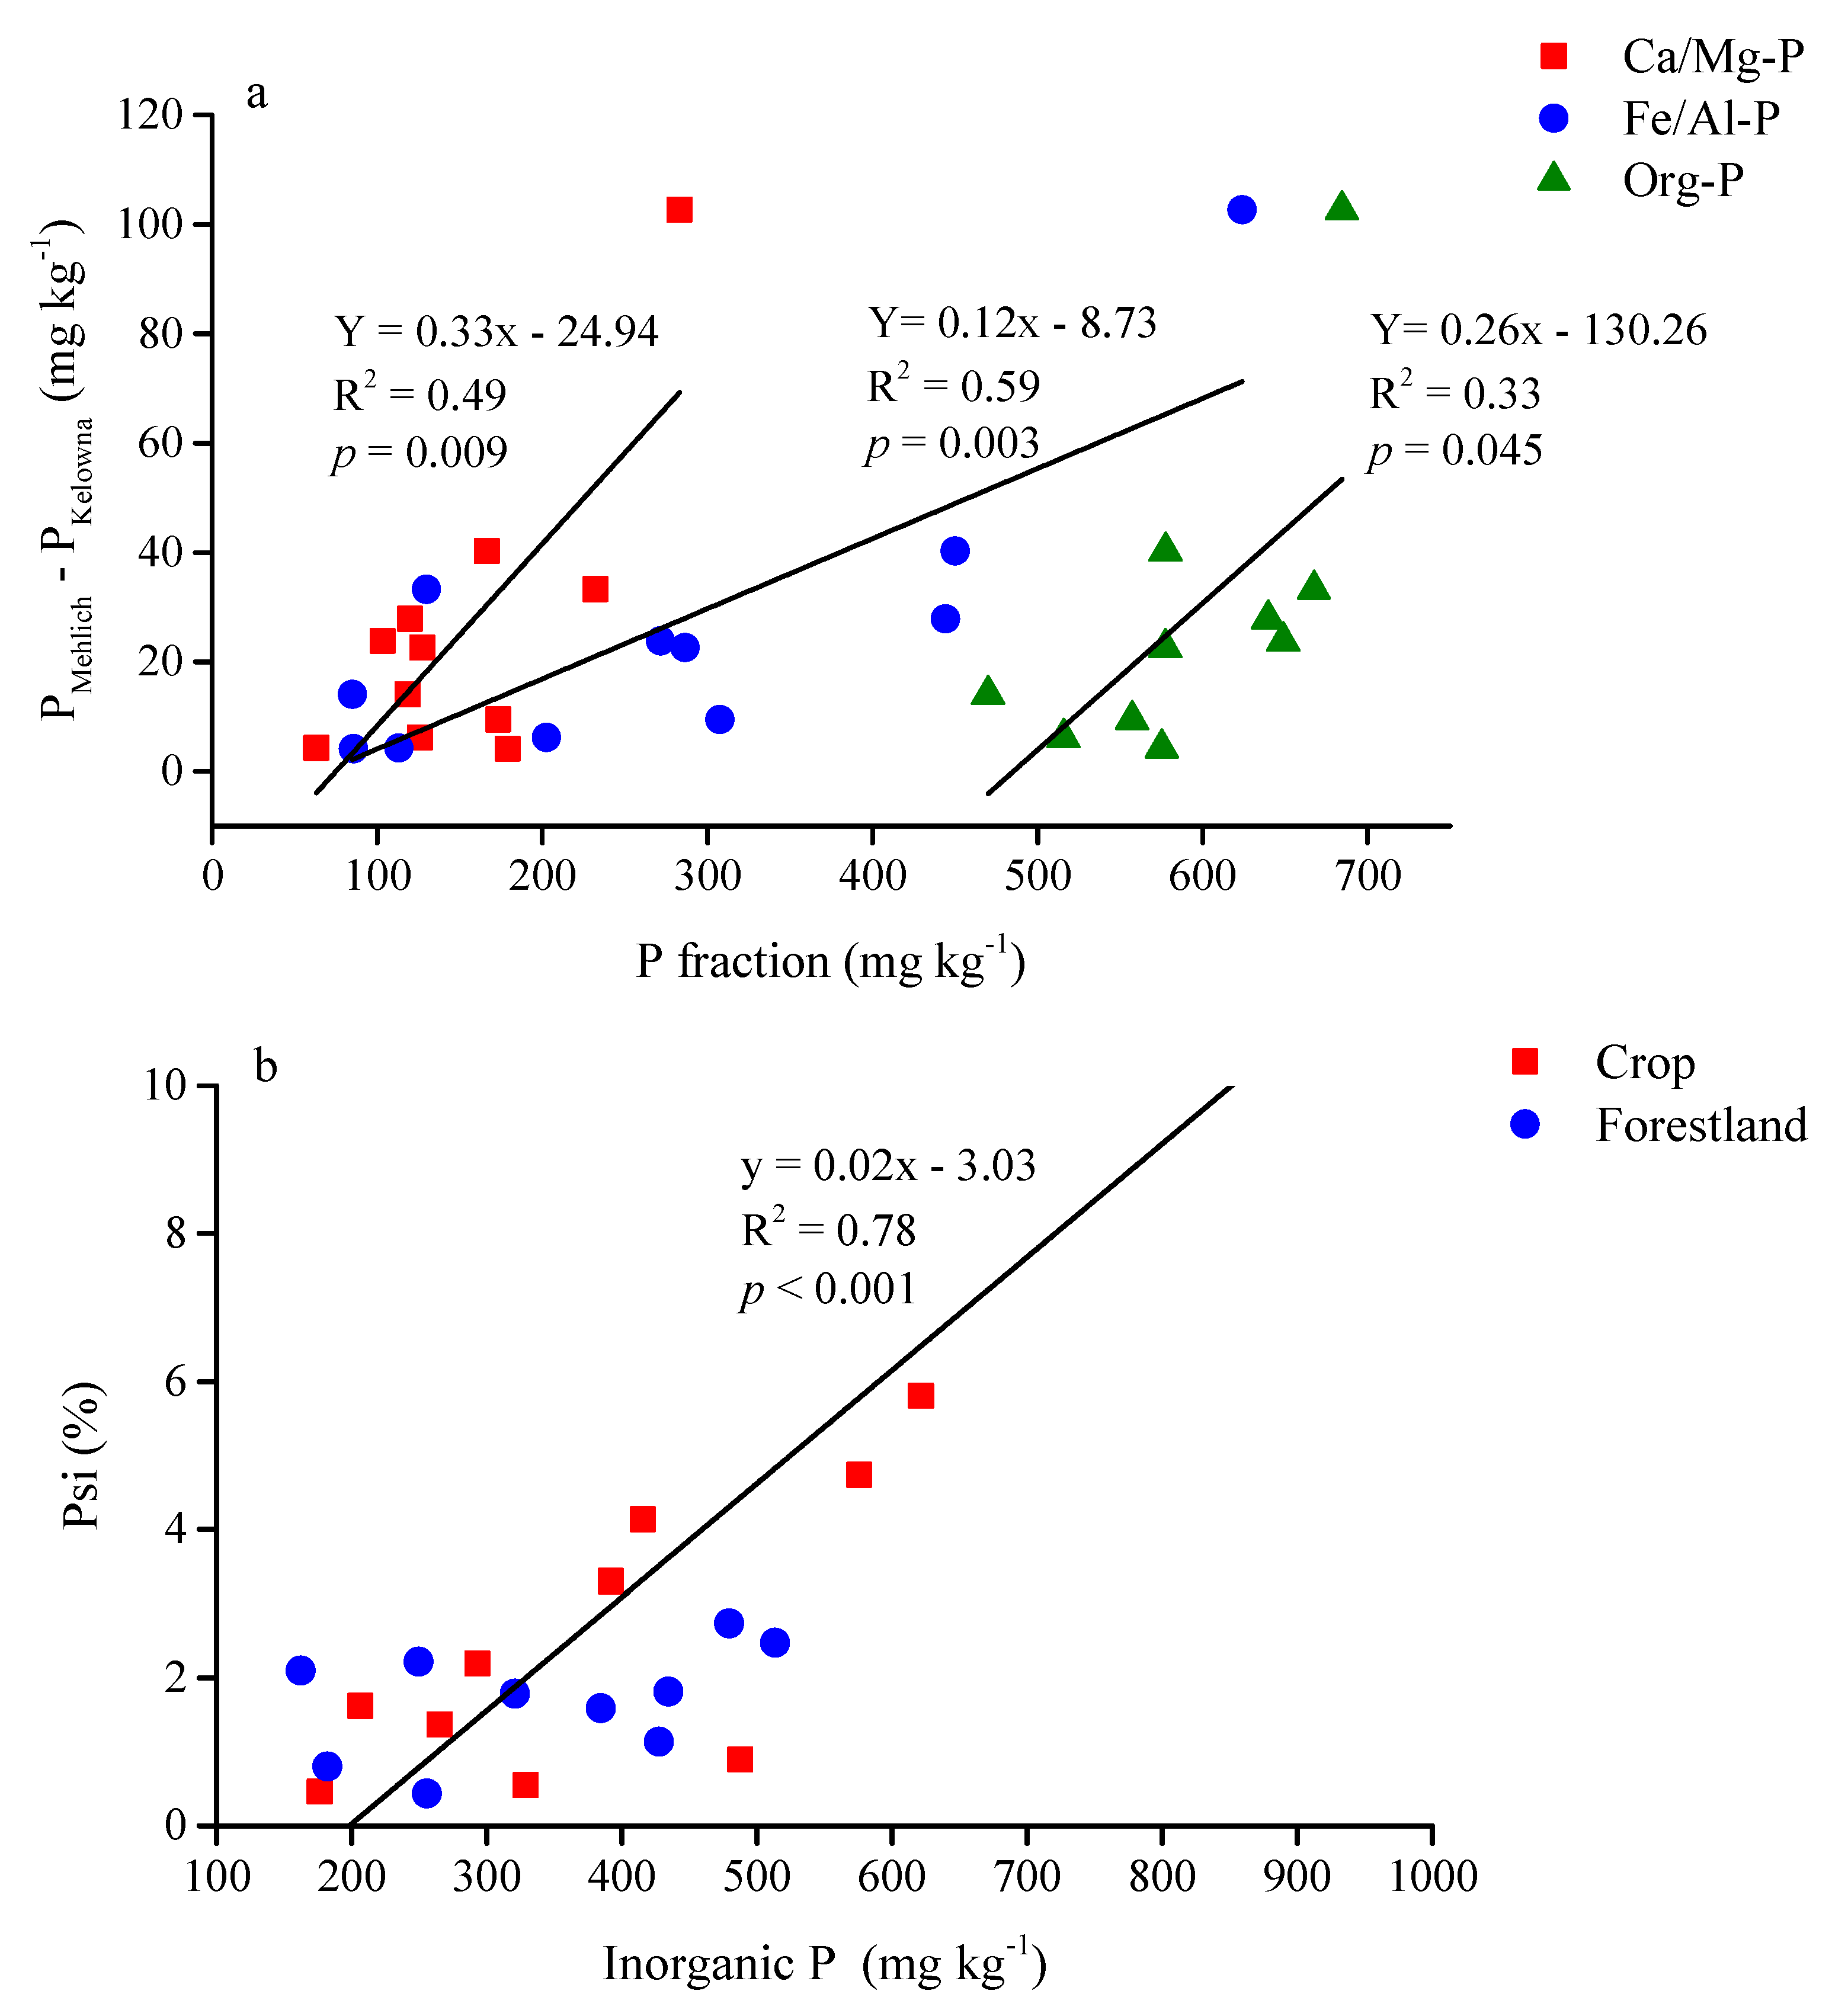
Figure 3.
Principal component analysis of soil parameters related to P status in soils of six cropland and forestland in shelterbelt systems.
Figure 3.
Principal component analysis of soil parameters related to P status in soils of six cropland and forestland in shelterbelt systems.

Table 1.
Soil properties in the 0–10 cm layer of selected cropland and forestland in shelterbelt systems in central Alberta. Standard deviations are given in parenthesis (n = 6).
Table 1.
Soil properties in the 0–10 cm layer of selected cropland and forestland in shelterbelt systems in central Alberta. Standard deviations are given in parenthesis (n = 6).
| Land-Use Type | Soil Properties | |||||
|---|---|---|---|---|---|---|
| Sand | Silt | Clay | Total C | pH | Bulk Density (Mg m−3) | |
| (g kg−1) | ||||||
| Cropland | 27.74(14.76) | 46.73(5.88) | 25.51(11.0) | 47.88(9.75) | 6.07(0.85) | 1.47(0.10)a 2 |
| Forestland | 29.50(10.07) | 44.07(12.8) | 26.44(6.96) | 65.75(23.95) | 6.04(0.67) | 1.24(0.20)b |
| Land-use type | Soil Properties | |||||
| Cation exchange capacity (cmolc kg−1) | Ca | Mg | Al | Fe | Mn | |
| (mg kg−1) 1 | ||||||
| Cropland | 41.58(11.93) | 4.83(0.84) | 0.83(0.66) | 0.57(0.18) | 0.30(0.84) | 0.06(0.84) |
| Forestland | 42.91(12.80) | 4.98(0.77) | 0.69(0.18) | 0.52(0.06) | 0.24(0.05) | 0.06(0.03) |
1 Mehlich-3 extractable concentration. 2 Lower case letters indicate significant difference between the land-use types at p < 0.1. No significant difference was found where there is no mean separation indicated.
Table 2.
Pearson correlation coefficients (r) and p values (in brackets) for correlation analysis between P sorption index (P150) and some soil properties in the 0–10 cm layer of cropland and forestland in shelterbelt systems (n = 6).
Table 2.
Pearson correlation coefficients (r) and p values (in brackets) for correlation analysis between P sorption index (P150) and some soil properties in the 0–10 cm layer of cropland and forestland in shelterbelt systems (n = 6).
| Land-Use Type | Soil Property | ||||||||
|---|---|---|---|---|---|---|---|---|---|
| Sand | Clay | Total C | pH | Al 1 | Fe 1 | Mn 1 | Fe/Al-P 1 | Org-P 1 | |
| (g kg−1) | (mg kg−1) | ||||||||
| Cropland | −0.77 | 0.77 | 0.94 | −0.82 | NS | NS | NS | NS | −0.77 |
| (0.07) | (0.07) | (<0.01) | (0.04) | (0.07) | |||||
| Forestland | −0.82 | NS 2 | NS | −0.82 | 0.88 | 0.77 | −0.82 | 0.77 | NS |
| (0.04) | (0.04) | (0.01) | (0.07) | (0.04) | (0.07) | ||||
1 Mehlich-3 extractable Al, Fe and Mn concentrations and P fractions associated with Fe and Al and organic compounds, respectively. 2 NS non-significant.
Table 3.
Average concentration of P fractions and total P in cropland and forestland in shelterbelt systems (n = 6).
Table 3.
Average concentration of P fractions and total P in cropland and forestland in shelterbelt systems (n = 6).
| Land-Use Type | Depth (cm) | Water-P | Ca/Mg-P a | Fe/Al-P 1 | Org-P 1 | Residual P | Total P |
|---|---|---|---|---|---|---|---|
| (mg kg−1) | |||||||
| Cropland | 0–10 | 7.68 a | 170.0 a | 328.0 aA 2 | 626.3 aA | 1339.1 a | 2467.0 a |
| 10–30 | 1.97 b | 130.0 a | 203.8 b | 489.7 b | 1272.2 a | 2097.7 a | |
| Forestland | 0–10 | 6.82 a | 149.6 a | 215.6 aB | 581.5 aB | 1326.3 a | 2279.9 a |
| 10–30 | 1.74 b | 100.6 b | 225.6 a | 501.9 a | 1049.9 a | 1879.8 a | |
1 Ca/Mg-P, Fe/Al-P, and Org-P denote P fractions associated with Ca and Mg, Fe and Al and organic compounds, respectively. 2 Lower and upper case letters in the same column indicate significant difference at p < 0.1 between two depth levels within a particular land-use type and between the two land-use types in the 0–10 cm soil, respectively.
Table 4.
Linear regression models that describe the modified Kelowna and Mehlich-3 extractable P (Y) as a function of P fractions (X) over the 0–30 cm depth in cropland and forestland in shelterbelt systems (n = 6).
Table 4.
Linear regression models that describe the modified Kelowna and Mehlich-3 extractable P (Y) as a function of P fractions (X) over the 0–30 cm depth in cropland and forestland in shelterbelt systems (n = 6).
| Land-Use Type | Soil Test P Method | P Fraction 1 | Linear Regression Model | R2 | p-Value |
|---|---|---|---|---|---|
| Cropland | Kelowna | Fe/Al-P | Y = 0.22x − 9.77 | 0.50 | 0.005 |
| Ca/Mg-P | Y = 0.41x − 20.14 | 0.24 | 0.051 | ||
| Inorganic P | Y = 0.19x − 30.68 | 0.55 | 0.003 | ||
| Mehlich-3 | Fe/Al-P | Y = 0.37x − 31.27 | 0.67 | <0.001 | |
| Ca/Mg-P | Y = 0.88x − 65.52 | 0.48 | 0.007 | ||
| Inorganic P | Y = 0.32x − 70.98 | 0.80 | <0.001 | ||
| Forestland | Kelowna | Fe/Al-P | Y = 0.09x − 4.96 | 0.45 | 0.009 |
| Inorganic P | Y = 0.08x − 12.75 | 0.47 | <0.001 | ||
| Org-P | Y = 0.09x − 32.52 | 0.24 | 0.051 | ||
| Mehlich-3 | Ca/Mg-P | Y = 0.39x − 12.23 | 0.22 | 0.061 | |
| Inorganic P | Y = 0.15x − 16.61 | 0.29 | 0.031 |
1 Ca/Mg-P, Fe/Al-P, and Org-P stand for P fractions associated with Ca and Mg, Fe and Al and organic compounds, respectively.
Table 5.
Principal components extracted from a correlation matrix based on soil properties in six shelterbelt systems located in central Alberta.
Table 5.
Principal components extracted from a correlation matrix based on soil properties in six shelterbelt systems located in central Alberta.
| Soil Property a | PC1 b | PC2 |
|---|---|---|
| PKelowna | 0.76 | 0.20 |
| PMehlich | 0.89 | 0.29 |
| Fe/Al-P | 0.92 | −0.24 |
| Ca/Mg-P | 0.72 | 0.35 |
| Org-P | 0.78 | 0.37 |
| Fe | 0.70 | −0.22 |
| Al | 0.42 | −0.84 |
| Ca | −0.30 | 0.78 |
| Eigenvalue | 4.11 | 1.82 |
| % Variance | 46 | 20 |
a PKelowna and PMehlich refer to P extracted using water, modified Kelowna and Mehlich-3 extractants, respectively, Fe/Al-P, Ca/Mg-P, Org-P, indicate P associated with Fe and Al, Ca and Mg, organic compounds, respectively, and Fe, Al, Ca and Mg are Mehlich-3 extractable cations. b Values in the table are the component loading of each variable with each principal component. Bold values indicate the strongest component loadings.
© 2019 by the authors. Licensee MDPI, Basel, Switzerland. This article is an open access article distributed under the terms and conditions of the Creative Commons Attribution (CC BY) license (http://creativecommons.org/licenses/by/4.0/).
Share and Cite
MDPI and ACS Style
Manimel Wadu, M.C.W.; Ma, F.; Chang, S.X. Phosphorus Availabilities Differ between Cropland and Forestland in Shelterbelt Systems. Forests 2019, 10, 1001. https://doi.org/10.3390/f10111001
AMA Style
Manimel Wadu MCW, Ma F, Chang SX. Phosphorus Availabilities Differ between Cropland and Forestland in Shelterbelt Systems. Forests. 2019; 10(11):1001. https://doi.org/10.3390/f10111001
Chicago/Turabian StyleManimel Wadu, Mihiri C.W., Fengxiang Ma, and Scott X. Chang. 2019. "Phosphorus Availabilities Differ between Cropland and Forestland in Shelterbelt Systems" Forests 10, no. 11: 1001. https://doi.org/10.3390/f10111001
Note that from the first issue of 2016, this journal uses article numbers instead of page numbers. See further details here.