Leaf Nitrogen and Phosphorus Stoichiometry of Chinese fir Plantations across China: A Meta-Analysis
by
Ran Tong
1,2,3, 
Benzhi Zhou
1,3,*,
Lina Jiang
1,
Xiaogai Ge
1,3,
Yonghui Cao
1,3 and
Zhenya Yang
1,3 1
Research Institute of Subtropical Forestry, Chinese Academy of Forestry, Hangzhou 311400, China
2
College of Biology and the Environment, Nanjing Forestry University, Nanjing 210037, China
3
Qiangjiangyuan Forest Ecosystem Research Station, State Forestry Administration, Hangzhou 311400, China
*
Author to whom correspondence should be addressed.
Forests 2019, 10(11), 945; https://doi.org/10.3390/f10110945
Submission received: 18 September 2019
/
Revised: 12 October 2019
/
Accepted: 22 October 2019
/
Published: 24 October 2019
(This article belongs to the Section Forest Ecophysiology and Biology)
Abstract
:Leaf nitrogen (N) and phosphorus (P) stoichiometry at a large geographical scale is the result of long-term adaptation to the environment. Therefore, the patterns of leaf N and P spatial distributions and their controlling factors represent an important issue in current ecological research. To explore the leaf stoichiometry of Chinese fir at a national level, we conducted a meta-analysis based on the dataset of the leaf nitrogen (N) and phosphorus (P) concentrations and the N:P ratio from 28 study sites across China. For all of the age groups considered, the average concentrations of the leaf N and P concentrations and the N:P ratio were 11.94 mg g−1, 1.04 mg g−1, and 12.93, respectively. Significant differences were found in the leaf P concentration and N:P ratio between the five age groups, while the differences in the leaf N concentration between the groups were not significant. Linear fitting results indicated that the leaf P concentration decreased, and the leaf N:P ratio increased with the increase of the MAT (mean annual temperature) and soil N concentration. Redundancy analysis (RDA) revealed that the first axis, with an explanatory quantity of 0.350, indicated that the MAT (mean annual temperature), soil nitrogen concentration and stand age had a good relationship with the leaf P concentration and N:P ratio, while the second axis, with an explanatory quantity of 0.058, indicated that the leaf N concentration was less affected by the environmental factors. These results demonstrate that the leaf P concentration and N:P ratio are affected by the stand age, an uneven distribution of the heat and soil nutrient concentration status, and N, as the limiting element, remaining relatively stable. Overall, our findings revealed the response of leaf stoichiometric traits to environment change, which benefits the management of Chinese fir plantations.
1. Introduction
Leaf N and P stoichiometry have certain indicative effects on the growth rate, adaptation strategy, nutrient limitation, and community function of plants [1,2,3,4]. Leaf stoichiometry is likely affected by changes in the environment, including biotic and abiotic factors [5,6]. Among the abiotic factors, geographical and climatic factors play important roles in driving the changes of leaf stoichiometry at regional or global scales [7,8]. In addition, the soil nutrient condition can also affect leaf stoichiometry in most cases [9,10]. To date, several theories have been proposed to explain the relationship between leaf stoichiometry and these abiotic factors. Among them, the Temperature-Plant Physiology Hypothesis (TPPH) and the Temperature-Biogeochemistry Hypothesis (TBH), which were proposed to explain the effects of temperature on terrestrial plants’ nutrient concentrations and their stoichiometric ratios, are the most widely accepted and applied [11,12]. The former suggests that plants require more N and P to maintain biochemical efficiency in cold habitats [5,11], while the latter argues that there is a positive relationship between leaf N and P concentrations and temperature [12]. Specifically, a low temperature in cold regions restricts the release of nutrients from organic matter and their uptake by plants, leading to nutrient limitation [11]. Based on the large-scale study of the geographical patterns of leaf stoichiometry, another hypothesis, the Stability of Limiting Elements Hypothesis, was proposed in recent years. This hypothesis suggests that, due to the restriction of physiological and nutrient balance, the concentrations of limitation elements in plants is relatively stable, and their responses to environmental changes are also stable [13].
In recent years, many studies were carried out that explored the relationships between flora nutrient composition and climatic and geographical factors at regional or global scales, providing abundant data for the establishment of large-scale models [10,11,14]. Reich and Oleksyn found that the leaf N and P concentrations declined with the decrease of Latitude (LAT) and MAT (mean annual temperature) at a global scale, while the leaf N:P ratio showed the opposite trend [11]. In addition, the studies carried out in China found that the leaf N and P declined with the increase of temperature, while the leaf N:P ratio showed no marked change [10,14]. Furthermore, some studies found that precipitation could also affect the geographical pattern of the distribution of leaf N and P concentrations. Ren et al. found that the leaf N and P concentrations were negatively correlated with precipitation [15], while He et al. found that precipitation had no relationship with leaf N and P concentrations [14]. In a word, the effect of temperature and precipitation on the geographical pattern of leaf N and P was still uncertain and requires further study.
Chinese fir (Cunninghamia lanceolata (lamb.) Hook.) is a unique tree species in China, with a long history of cultivation and wide distribution [16]. The economic value of Chinese fir is mainly due to its characteristics of a rapid growth and good material quality. The large-area plantations also have excellent ecological benefits. Many studies on the leaf stoichiometry of Chinese fir plantations have been carried out, but most of them were based on single-site investigation [17,18]. Studies at a regional scale have not been reported so far. In view of this, we conducted a meta-analysis based on a nationwide dataset, collected from the published literature on the leaf N and P concentrations and N:P ratio, as well as the data on external environmental factors. The objectives of this study were: (1) to determine the leaf stoichiometry of Chinese fir plantations at a regional scale; (2) to explore the difference in the leaf stoichiometry among different stand age groups; and (3) to find out the impact patterns of environmental factors on leaf stoichiometry.
2. Materials and Methods
2.1. Dataset
Data were collected from published studies on the leaf and soil nutrients of Chinese fir plantations. Leaf samples, used for determining the leaf N, P and N:P ratio, were all collected during the growing season (July–October). All of the studies that we collected included data on the leaf N and P concentration, and part of them included data on the leaf N:P ratio, while the other studies excluded data on the leaf N:P ratio. In the cases where data on the leaf N:P ratio were absent, we calculated the ratio using the leaf N and P concentrations data to remedy this lack. Additionally, we also collected data on the stand age, as well as data on geographical/climatic factors and soil nutrient concentrations, such as the Longitude (LON), LAT, Altitude (ALT), mean annual precipitation (MAP), MAT, and soil N and P concentrations at a layer of 20–30 cm. If the studies excluded data on the soil N or P concentrations, we used the arithmetic mean value of the data in a single age group to remedy this lack in order to avoid the influence of the stand age on the soil nutrient concentrations [19]. Overall, we collected 47 observations from 28 sampling sites across eight provinces in the main production regions of Chinese fir across subtropical China (Figure 1).
The sampling stands of Chinese fir, included in our dataset, fell within the range of 106° E and 120° E in LON, 23° N and 30° N in LAT, and 100 m and 977 m in ALT, with the MAT and MAP ranging from 15.6 ℃ to 22 ℃ and 1200 mm to 2000 mm, respectively. The sampling stands were all located in the traditional cultivation area, covering 8 major provinces. By including the missing values, we obtained a complete list of the leaf N and P concentrations and N:P ratio, as well as the environmental variables, in our data analysis (Appendix A).
2.2. Data Analysis
The metric for the variation of the leaf N and P concentrations and N:P ratio at a spatial scale was usually represented as the coefficient of variation (CV) [13]. An analysis of variance (ANOVA) was used, with SPSS software (2013, ver. 22.0; SPSS Inc., Chicago, IL, USA), to analyze the differences in the leaf N and P concentrations and N:P ratio among the age groups. To make sure that the data on the leaf N and P concentrations and N:P ratio obeyed a normal distribution, we transformed all the data into a natural logarithm of ln (N + 1) and used the scatter plots to visualize the relationships between leaf stoichiometry and environmental factors, based on which linear or quadratic regression equations were developed using the regression analysis in Origin software (2011, ver. 8.6; Origin Inc., Venice, FL, USA). A redundancy analysis (RDA) in Canoco software (2002, ver. 4.5; Canoco Inc., Ithaca, NY, USA) was used to evaluate the intensity correlation between the leaf stoichiometry, stand age and environmental factors. In this part, all of the data used were also transformed into a natural logarithm of ln (N + 1).
3. Results
3.1. Patterns of the Leaf N and P Concentrations and N:P Ratio of Chinese fir across China
For all of the age groups, the mean N and P concentrations and N:P ratio were 11.94 mg g−1, 1.04 mg g−1, and 12.29 mg g−1, respectively, with a variation range of 11.07–14.28 mg g−1, 0.71–1.37 mg g−1, and 10.54–15.83 mg g−1, respectively. The coefficient of variation (CV) of the leaf N and P concentrations and N:P were 0.184, 0.306, and 0.242, respectively (Table 1). The leaf N and P concentrations were positively correlated with each other (R2 = 0.191, p < 0.01) (Figure 2).
Significant differences in the leaf P concentration and N:P ratio were found among the five age groups; however, no significant difference in the leaf N concentration was found (Table 1).
3.2. Variations of the Leaf N and P Concentrations and N:P Ratio with Geographic Factors
With the increase of LON, the leaf N concentration increased from 106° E to 113° E and then decreased from 113° E to 120° E (quadratic regression; R2 = 0.11, p < 0.05) (Figure 3a). However, the leaf P concentration and N:P ratio exhibited no marked trend (Figure 3b,c).
A marginally quadratic relationship was found between the leaf P concentration and LAT (R2 = 0.09, p < 0.05), with a relatively low P concentration occurring between 26° N and 28° N (Figure 3e). No relationship was found between the N concentration, N:P ratio and LAT (Figure 3d,f).
The leaf stoichiometry seemed not to be related to the ALT (Figure 3g–i).
3.3. Variations of the Leaf N and P Concentrations and N:P Ratio with Climatic Factors
No relationship was observed between the leaf stoichiometry and MAP (Figure 4a–c). The leaf P concentration showed a negative correlation with MAT (R2 = 0.11, p < 0.05) (Figure 4e), while the leaf N:P ratio showed a positive correlation with MAT (R2 = 0.17, p < 0.01) (Figure 4f). No relationship was found between the leaf N concentration and MAT (Figure 4d).
3.4. Variations of the Leaf N and P Concentrations and N:P Ratio with Soil Nutrient Concentrations
No linear or nonlinear relationships were found between the leaf N concentration and soil N concentration (Figure 5a), while the leaf P concentration and the leaf N:P ratio showed a negative and positive correlation with the soil N concentration, respectively (Figure 5b,c). It seemed that the variation of the soil P concentration did not cause changes in the leaf N and P concentrations and N:P ratio (Figure 5d–f).
3.5. Redundancy Analysis (RDA)
RDA was performed to determine the relationships between the leaf stoichiometry and eight variables, including the stand age, geographical factors, climatic factors, and soil nutrients, and to obtain explanations for the factors that have an influence on leaf stoichiometry (Table 2). The explanations of the first and second axes for the leaf stoichiometry were 0.350 and 0.058, respectively, with accumulative explanations reaching 0.408. The accumulative explanations of the first two axis for the relationship between the leaf stoichiometry and variables was 0.997, indicating that the first two axis could considerably reflect the relationship between the leaf stoichiometry and environmental factors, since the first axis was the determinant (0.350).
Furthermore, we also obtained a bidimensional ordering chart of the RDA for the relationships between the leaf stoichiometry and influencing factors (Figure 6). In the chart, the angle between the arrow line and sorting axis represented the correlation level between the leaf stoichiometry and sorting axis, and generally speaking, a small angel indicated a high correlation [20]. The arrow line of the MAT, SN (soil N concentration) and SA (stand age) were the longest, as shown in Figure 6, indicating that the three influencing factors could explain the leaf stoichiometry well. The three influencing factors had positive relationships with the leaf N:P and a negative relationship with the leaf P. No relationships were found between the leaf N and the influencing factors.
4. Discussion
4.1. Patterns of the Leaf N and P Concentrations and N:P Ratio of Chinese Fir across China
Plant nutrient concentrations have been widely used for estimating the efficiency of nutrient utilization. In this study, the average concentrations of leaf N and P of Chinese fir across China were both found to be lower than those of Quercus L. in China, where 13 species have been studied [8]; the flora in the North–South Transect of Eastern China (NSTEC), where 654 species have been studied [15]; in the whole of China, where 753 species have been studied [10]; and the global flora, where 1251 species have been studied [11] (Table 3). Significant differences were found in the leaf nutrient concentrations among different life forms [10,14,15]. Generally, leaf N and P concentrations of evergreen woody plants are lower than those of deciduous woody plants and herbaceous species, which are considered an adaptation to a nutrient-deficient habitat. Moreover, the low leaf P concentration in Chinese fir could also be attributed to the P shortage in the soils of subtropical China, as the leaf and soil P had a good coupling relationship at an ecosystem scale, according to Hedin [21]. Moreover, the means of the leaf N and P concentrations of Chinese fir across China were also lower than those of Picea abies L. across Europe, which probably resulted from the differences in habitat [7]. In other words, plants in cold regions at a high latitude need more N and P to maintain their normal life activities, as the TPPH has suggested [11]. Overall, the low leaf N and P concentrations of Chinese fir across China could be attributed to the evergreen feature, relatively warm habitat and nutrient deficiency in the soil.
In our study, leaf N concentration varied much less than leaf P concentration, and the variability of leaf N:P ratio was intermediate, which was consistent with the result of Güswell and Koerselman for wetland plants [22]. A positive correlation was found between the leaf N and P concentrations of Chinese fir. This was consistent with He et al., who reported that the leaf N and P were typically correlated with each other across all grassland species in China [14]. The positive correlation between N and P could be due to N and P being the basic nutrient elements of plants and important composition elements of various protein and genetic materials, with similar biochemical pathways [23,24].
Koerselman and Meuleman suggested that the leaf N:P ratio was an important indicator of the nutrient limitations in an environment. Specifically, a leaf N:P < 14 indicated an N limitation, and a leaf N:P > 16 indicated a P limitation [25]. In this study, the leaf N:P ratio significantly lower than 14 (One-sample T test), with an average value of 12.29, implied that the growth of Chinese fir across China had an N limitation. This was inconsistent with the general view that P was the major limiting nutrient of plants growing in older tropical soils, while it is consistent with Zheng et al., who suggested that N was the limiting factor in the rapid growth period of Chinese fir [26,27]. At present, the causes of the N limitation of Chinese fir growth are still uncertain. Therefore, more nutrient cycling pathways should be considered in relation to Chinese fir, such as the N and P resorption from senesced leaves (i.e., nutrient resorption efficiency and proficiency) and the N and P uptake from soils [26,27,28].
4.2. Stand Age Effect on the Leaf N and P Concentrations and N:P Ratio
The leaf N and P concentrations usually display different variations within a forest chronosequence, which has been found in many studies at a local scale [29,30,31], whereas the patterns at a regional scale are not known. In this study, the leaf N concentration remained constant within the forest chronosequence, which is consistent with some previous studies [28,31]. A possible reason could be that the limitation element remained relatively stable not only at a spatial scale, but also within a time chronosequence. In spite of the great variation in the leaf P concentration among the five age groups, the leaf P concentration showed an overall decreasing trend with the stand age. The pattern was consistent with the Growth-rate Hypothesis, which suggested that fast-growing organisms need more P-rich RNA to support rapid rates of protein synthesis [32,33]. Moreover, the soil P concentration reduction caused by soil degradation might be another important cause, as plant and soil P concentrations always maintain a good relationship at the ecosystem scale [21]. Additionally, the leaf N:P ratio exhibited an increasing trend within the forest chronosequence, which indicated that the N limitation had been relieved to some extent. This result is consistent with the view that plants usually suffer more a serious nutrient supply and demand contradiction at their rapid growth stage [26,27,34].
4.3. Relationships between the Leaf Stoichiometry and Environmental Factors for Chinese Fir
The correlation between leaf traits and the environment have been a constant research topic for many scientists [35,36]. Generally, temperature and latitude played a regulative role for the leaf N and P concentrations and N:P ratio at the global scale [11]. Whereas, studies at different scales have arrived at different conclusions [10,11,15].
In this study, we found marginal relationships or none at all between the geographic factors and leaf stoichiometry, which was inconsistent with some previous studies [10,11,37,38]. This result might be due to the small study area and dense sampling sites. All the same, non-linear patterns were found between LON and the leaf N concentration, as well as LAT and the leaf P concentration. These trends indicated that the growth of Chinese fir, with high N and low P concentrations in the middle production area, was less limited by N. This is consistent with the study of Wu [39], who reported that the growth status of plants in the middle production area was better than in the northern and southern production areas.
Compared with the leaf stoichiometry–geography relationships, the leaf stoichiometry–climate relationships usually showed a slight complication, which might be explained by the higher sensitivity of leaf stoichiometry to climate factors [8]. In our study, a negative linear pattern was found between MAT and the leaf P concentration, consistent with TPPH that plants in low-temperature habitats develop an adaptive strategy, absorbing more nutrients to enhance their metabolic activity and growth rates [36,40,41]. The leaf N:P ratio had a positive linear relationship with MAT, indicating that temperature might be an important regulation climatic factor for plants’ nutrient limitation status, and it could be used as a guideline for the cultivation of Chinese fir. The leaf N concentration showed a non-significant trend with MAT, which was inconsistent with previous studies [7,10]. This result might be due to the low N variability, which covered up the changed regulation between the leaf N concentration and temperature. Rainfall could drive the variation of some leaf traits, especially in study areas with obvious precipitation gradients [14,42,43]. Nevertheless, a non-significant trend was found for the leaf stoichiometry and MAP in this study. This could be attributed to the fact that our sampling sites were all located in the subtropical area, with abundant rainfall (generally above 1200 mm each year), which fully satisfied the growth demand for Chinese fir. In general, the leaf stoichiometry of Chinese fir was more sensitive to temperature than rainfall, which was also found in other studies [36,44,45]. Plant–soil interaction has been a study hotspot for a long time, and many previous studies suggested that the flora N and P concentrations always remain in a close relationship with the soil nutrient concentrations [21,41,46]. In this study, we found that the soil N concentration had a negative relationship with the leaf P concentration and a positive relationship with the leaf N:P ratio. These results are different from those of most previous studies, but they confirmed that the soil N supply might be an important factor for adjusting the leaf P concentration and further influence plants’ nutrient limitation status. Previous studies have shown that the plant P concentration often remains in a positive relationship with the soil P concentration at the ecosystem scale [10,21]. Conversely, in this study, the variation of the soil P concentration did not lead to a significant variation in the leaf stoichiometry or even the leaf P concentration. This result was probably because of the high P resorption efficiency of Chinese fir, which made up for the soil P shortage, as Chen et al. have suggested [28].
5. Conclusions
The leaf N and P concentrations of Chinese fir across China were both low. The low leaf N:P indicated N was limiting the growth of Chinese fir. The leaf stochiometry was found to be mainly driven by forest chronosequence and the heat and soil nutrient status of plants. Abundant precipitation did not cause a significant change in the leaf stoichiometry. These findings are essential for identifying the pattern of the variation of the leaf nutrient concentrations and its controlling factors. Moreover, they would be beneficial in the establishment of scientific management measures for Chinese fir plantations.
Author Contributions
R.T. and B.Z. conceived and designed the experiments; L.J. performed charts making; X.G., Y.C. and Z.Y. participated in data collecting; R.T. analyzed the data, and wrote the manuscript.
Funding
This research was funded by the National Key Research and Development Program of China (2016YFD0600202-4), and the Fundamental Research Funds for the Central Non-profit Research Institution (CAFYBB2017ZX002-2).
Conflicts of Interest
The authors declare there are no conflicts of interest.
Appendix A

Table A1.
References list with associated information on leaf and soil chemical concentrations, and geographical and climatic variables.
Table A1.
References list with associated information on leaf and soil chemical concentrations, and geographical and climatic variables.
| Sampling Area | Stand Age | Leaf | Soil | Longitude | Latitude | Altitude | MAP | MAT | Reference | |||
|---|---|---|---|---|---|---|---|---|---|---|---|---|
| N | P | N:P | N | P | ||||||||
| Huitong, Hunan | 8 | 9.59 | 0.89 | 10.7752809 | 1.9 | 0.46 | 109.75 | 26.83 | 400 | 1300 | 16.8 | [47] |
| Huitong, Hunan | 10 | 7.66 | 0.89 | 8.606741573 | 1.4 | 0.29 | 109.5 | 26.95 | 473 | 1250 | 16.7 | [48] |
| Huitong, Hunan | 7.5 | 12.52 | 1.14 | 12.41 | 1.51 | 0.35 | 109.6 | 26.79 | 264 | 1422 | 16.8 | [17] |
| Nanping, Fujian | 5.5 | 12.74 | 0.91 | 14 | 1.47 | 0.3 | 117.99 | 26.77 | 525 | 1645 | 20 | [49] |
| Nanping, Fujian | 5.5 | 11.72 | 0.79 | 15.08 | 1.57 | 0.4189 | 117.99 | 26.8 | 237.5 | 1644 | 20 | [50] |
| Nanping, Fujian | 8 | 10.13 | 0.69 | 14.64 | 1.41 | 0.31 | 117.99 | 26.8 | 444 | 1653 | 20 | [51] |
| Youxi, Fujian | 7.5 | 9.53 | 0.93 | 10.24731183 | 1.5472 | 0.4189 | 118.2 | 26.1 | 230 | 1323.4 | 18.96 | [52] |
| Shanxian, Fujian | 9 | 9 | 0.71 | 12.67605634 | 1.98 | 0.38 | 117.72 | 26.51 | 100 | 1628 | 19.2 | [53] |
| Xuanwu, Guangxi | 8.5 | 12.56 | 0.85 | 14.77647059 | 2.2 | 0.8 | 109.17 | 23.75 | 285 | 1400 | 21.1 | [54] |
| Yunfu, Guangdong | 5 | 16.63 | 1.48 | 11.23648649 | 1.5472 | 0.4189 | 114.6 | 23.13 | 350 | 1537.2 | 21 | [55] |
| Jingdezhen, Jiangxi | 7.5 | 10.27 | 1.22 | 8.418032787 | 0.51 | 0.4189 | 117.33 | 29.39 | 175 | 1756.7 | 17.1 | [56] |
| Liping, Guizhou | 8 | 12.29 | 1.36 | 9.25 | 1.41 | 0.54 | 109.18 | 26.33 | 447.67 | 1200 | 17.5 | [34] |
| Foshan, Guangdong | 5 | 12.14 | 0.97 | 12.07 | 1.5472 | 0.4189 | 112.67 | 22.72 | 213.33 | 2000 | 22 | [57] |
| Taihe, Jiangxi | 10 | 15.95 | 1.32 | 12.08333333 | 1.66 | 0.34 | 114.52 | 26.91 | 180 | 1370.5 | 18.6 | [48] |
| Linan, Zhejiang | 10 | 8.97 | 1.69 | 5.41 | 1.5472 | 0.4189 | 120.12 | 30.35 | 275 | 1420 | 15.6 | [58] |
| Huitong, Hunan | 14 | 13.32 | 0.85 | 15.67058824 | 1.9 | 0.46 | 109.75 | 26.83 | 400 | 1300 | 16.8 | [47] |
| Huitong, Hunan | 20 | 9.71 | 0.86 | 11.29069767 | 1.21 | 0.21 | 109.6 | 26.86 | 500 | 1250 | 16.7 | [48] |
| Huitong, Hunan | 17.5 | 11.82 | 0.97 | 13.82 | 1.59 | 0.35 | 109.59 | 26.89 | 304.5 | 1422 | 16.8 | [17] |
| Nanping, Fujian | 14 | 12.83 | 0.97 | 13.22680412 | 1.27 | 0.33 | 117.99 | 26.77 | 525 | 1645 | 20 | [49] |
| Nanping, Fujian | 14 | 10.79 | 0.77 | 14.3 | 2.08 | 0.3467 | 117.99 | 26.8 | 237.5 | 1644 | 20 | [50] |
| Nanping, Fujian | 14 | 11.68 | 0.65 | 17.88 | 1.9 | 0.37 | 117.99 | 26.8 | 444 | 1653 | 20 | [51] |
| Nanping, Fujian | 20 | 10.43 | 1.24 | 8.46 | 1.26 | 0.36 | 117.33 | 27.67 | 545 | 1864 | 17.6 | [59] |
| Youxi Fujian | 17.5 | 9.83 | 1.14 | 8.622807018 | 1.406 | 0.3467 | 118.2 | 26.1 | 285 | 1323.4 | 18.96 | [52] |
| Sanming, Fujian | 12 | 13.8 | 0.92 | 10.44 | 1.406 | 0.3467 | 117.73 | 26.51 | 200 | 1628 | 19.2 | [60] |
| Fenyi, Jiangxi | 19 | 9.65 | 1.11 | 8.693693694 | 1.406 | 0.3467 | 114.5 | 27.67 | 130 | 1600 | 17.2 | [61] |
| Jingdezhen, Jiangxi | 20 | 14.46 | 1.57 | 9.210191083 | 1.13 | 0.3467 | 117.33 | 29.39 | 175 | 1756.7 | 17.1 | [56] |
| Yishan, Guangxi | 11 | 10.51 | 0.76 | 13.82894737 | 0.96 | 0.2 | 108.68 | 24.45 | 220 | 1259.6 | 19.2 | [62] |
| Taihe, Jiangxi | 20 | 12.06 | 0.87 | 13.86206897 | 0.99 | 0.12 | 115.06 | 26.73 | 140 | 1370.5 | 18.6 | [48] |
| Liping, Guizhou | 16 | 14.19 | 1.55 | 9.32 | 1.18 | 0.38 | 109.18 | 26.33 | 445 | 1200 | 17.5 | [34] |
| Foshan, Guangdong | 11 | 13.87 | 1.41 | 11.29 | 1.406 | 0.3467 | 112.67 | 22.72 | 213.33 | 2000 | 22 | [57] |
| Anlong, Guizhou | 11 | 10.27 | 1.59 | 7.31 | 1.406 | 0.3467 | 105.82 | 24.9 | 976.8 | 1352.8 | 16.6 | [63] |
| Nanping, Fujian | 21 | 11.82 | 0.97 | 12.18556701 | 1.21 | 0.26 | 117.99 | 26.77 | 525 | 1645 | 20 | [49] |
| Nanping, Fujian | 21 | 11.73 | 0.78 | 15.17 | 2.45 | 0.446 | 117.99 | 26.8 | 237.5 | 1644 | 20 | [50] |
| Nanping, Fujian | 21 | 10.51 | 0.72 | 14.68 | 1.95 | 0.32 | 117.99 | 26.8 | 444 | 1653 | 20 | [51] |
| Huitong, Hunan | 25 | 13.41 | 1.13 | 12.62 | 1.77 | 0.36 | 109.59 | 26.79 | 318 | 1422 | 16.8 | [17] |
| Huitong, Hunan | 25 | 10.66 | 0.69 | 15.44927536 | 1.9 | 0.46 | 109.75 | 26.83 | 400 | 1300 | 16.8 | [47] |
| Shitai, Anhui | 20 | 15.33 | 0.928 | 16.91 | 3.57 | 0.83 | 117.33 | 30.08 | 665 | 1444 | 15.9 | [64] |
| Huitong, Hunan | 30 | 10.07 | 1.05 | 9.59047619 | 1.9 | 0.28 | 109.65 | 26.87 | 467 | 1250 | 16.7 | [48] |
| Huitong, Hunan | 29 | 15.76 | 1.88 | 7.73 | 0.6 | 0.23 | 109.6 | 26.85 | 541.6 | 1300 | 16.5 | [65] |
| Datian, Fujian | 26 | 15.46 | 1.4 | 11.22 | 0.71 | 0.4 | 117.56 | 25.76 | 605.3 | 1651 | 16.6 | [65] |
| Taihe, Jiangxi | 30 | 15.81 | 1.26 | 12.54761905 | 1.99 | 0.37 | 114.52 | 26.78 | 210 | 1370.5 | 18.6 | [48] |
| Liping, Guizhou | 28 | 14.32 | 1.27 | 11.6 | 1.38 | 0.47 | 109.18 | 26.33 | 482.67 | 1200 | 17.5 | [34] |
| Huitong, Hunan | 45.5 | 10.23 | 0.6 | 17.05 | 1.98 | 0.28 | 109.75 | 26.83 | 400 | 1300 | 16.8 | [47] |
| Nanping, Fujian | 46 | 10.76 | 0.75 | 14.34666667 | 1.71 | 0.27 | 117.99 | 26.77 | 525 | 1645 | 20 | [49] |
| Nanping, Fujian | 46 | 10.14 | 0.63 | 16.0952381 | 2.24 | 0.28 | 117.99 | 26.8 | 237.5 | 1644 | 20 | [50] |
| Nanping, Fujian | 46 | 10.01 | 0.58 | 17.32 | 1.99 | 0.29 | 117.99 | 26.8 | 444 | 1653 | 20 | [51] |
| Sanming, Fujian | 50 | 14.22 | 1 | 14.35 | 1.98 | 0.28 | 117.48 | 26.19 | 427.1 | 1750 | 19.1 | [18] |
Note: the values of soil N and P concentrations with blue color represent the mean value of single age group.
References
- Niklas, K.J.; Owens, T.; Reich, P.B.; Edward, D.C. NitrogeN:Phosphorus leaf stoichiometry and the scaling of plant growth. Ecol. Lett. 2005, 8, 636–642. [Google Scholar] [CrossRef]
- Branco, P.; Stomp, M.; Egas, M.; Huisman, J. Evolution of Nutrient Uptake Reveals a Trade-Off in the Ecological Stoichiometry of Plant-Herbivore Interactions. Am. Nat. 2010, 176, E162–E176. [Google Scholar] [CrossRef] [PubMed]
- Xu, X.; Wanek, W.; Zhou, C.P.; Richter, A. Nutrient limitation of alpine plants: Implications from leaf N:P stoichiometry and leaf δ15N. J. Soil Sci. Plant Nutr. 2014, 177, 378–387. [Google Scholar] [CrossRef]
- Yu, Q.; Chen, Q.S.; Elser, J.J.; He, N.P.; Wu, H.H.; Zhang, G.M.; Wu, J.G.; Bai, Y.F.; Han, X.G. Linking stoichiometric homoeostasis with ecosystem structure, functioning and stability. Ecol. Lett. 2010, 13, 1390–1399. [Google Scholar] [CrossRef] [PubMed]
- Li, X.; Zeng, Q.C.; An, S.S.; Dong, Y.Y.; Li, Y.Y. Ecological stoichiometry in leaf and litter under different vegetation types of Zhifanggou watershed on the Loess Plateau, China. Environ. Sci. 2015, 36, 1084–1091. [Google Scholar]
- Esmeijer-liu, A.J.; Aerts, R.; Kürschner, W.M.; Bobbink, R.; Lotter, A.F.; Verhoeven, J.T.A. Nitrogen enrichment lowers Betula pendula green and yellow leaf stoichiometry irrespective of effects of elevated carbon dioxide. Plant Soil 2009, 316, 311–322. [Google Scholar] [CrossRef]
- Kang, H.Z.; Zhuang, H.L.; Wu, L.L.; Liu, Q.L.; Shen, G.R.; Berg, B.; Man, R.Z.; Liu, C.J. Variation in leaf nitrogen and phosphorus stoichiometry in Picea abies across Europe: An analysis based on local observations. For. Ecol. Manag. 2011, 261, 195–202. [Google Scholar] [CrossRef]
- Wu, T.G.; Dong, Y.; Yu, M.K.; Wang, G.G.; Zeng, D.H. Leaf nitrogen and phosphorus stoichiometry of Quercus species across China. For. Ecol. Manag. 2012, 284, 116–123. [Google Scholar] [CrossRef]
- Lin, Y.M.; Chen, A.M.; Yan, S.W.; Rafay, L.; Du, K.; Wang, D.J.; Ge, Y.G.; Li, J. Available soil nutrients and water content affect leaf nutrient concentrations and stoichiometry at different ages of Leucaena leucocephala forests in dry-hot valley. J. Soil. Sediment 2019, 19, 511–521. [Google Scholar] [CrossRef]
- Han, W.X.; Fang, J.Y.; Guo, D.L.; Zhang, Y. Leaf nitrogen and phosphorus stoichiometry across 753 terrestrial plant species in China. New Phytol. 2005, 168, 377–385. [Google Scholar] [CrossRef]
- Reich, P.B.; Oleksyn, J. Global patterns of plant leaf N and P in relation to temperature and latitude. Proc. Natl. Acad. Sci. USA 2004, 101, 11001–11006. [Google Scholar] [CrossRef] [PubMed] [Green Version]
- Wang, Z.; Xia, C.X.; Yu, D.; Wu, Z.G. Low-temperature induced leaf elements accumulation in aquatic macrophytes across Tibetan Plateau. Ecol. Eng. 2015, 75, 1–8. [Google Scholar] [CrossRef]
- Han, W.X.; Fang, J.Y.; Reich, P.B.; Woodward, F.I.; Wang, Z.H. Biogeography and variability of eleven mineral elements in plant leaves across gradients of climate, soil and plant functional type in China. Ecol. Lett. 2011, 14, 788–796. [Google Scholar] [CrossRef] [PubMed]
- He, J.S.; Wang, L.; Flynn, D.F.B.; Wang, X.P.; Ma, W.H.; Fang, J.Y. Leaf nitrogen:phosphorus stoichiometry across Chinese grassland biomes. Oecologia 2008, 155, 301–310. [Google Scholar] [CrossRef] [PubMed]
- Ren, S.J.; Yu, G.R.; Tao, B.; Wang, S.Q. Leaf nitrogen and phosphorus stoichiometry across 654 terrestrial plant species in NSTEC. Environ. Sci. 2007, 28, 2665–2673. [Google Scholar]
- Li, M.H.; Ritchie, G.A. Eight hundred years of clonal forestry in China: I. traditional afforestation with Chinese fir (Cunninghamia lanceolata (Lamb.) Hook.). New For. 1999, 18, 131–142. [Google Scholar]
- Chen, A.N.; Wang, G.J.; Chen, C.; Li, S.Y.; Li, W.J. Variation in the N and P stoichiometry of leaf-root-soil during stand development in a Cunninghamia lanceolata plantation in subtropical China. Acta Ecol. Sin. 2018, 38, 4027–4036. [Google Scholar]
- Meng, Q.Q.; Ge, L.L.; Yang, X.M.; Wang, J.; Lin, Y.; He, Z.M.; Qiu, L.J.; Hu, H.T. Seasonal variation of C, N, and P stoichiometric characteristics in leaves of two plantations in Sanming, Fujian. Chin. J. Appl. Environ. Biol. 2019, 25, 1–10. [Google Scholar]
- Cao, J.; Yan, W.D.; Xiang, W.D.; Chen, X.Y.; Lei, P.F. Stoichiometry characterization of soil C, N, and P of Chinese fir plantations at three different ages in Huitong, Hunan province, China. Sci. Silv. Sin. 2015, 51, 1–8. [Google Scholar]
- Majarenkov, V.; Legendre, P. Nonlinear redundancy analysis and canonical correspondence analysis based on polynomial regression. Ecology 2002, 83, 1146–1161. [Google Scholar] [CrossRef]
- Hedin, L.O. Global organization of terrestrial plant-nutrient interactions. Proc. Natl. Acad. Sci. USA 2004, 101, 10849–10850. [Google Scholar] [CrossRef] [PubMed]
- Güsewell, S.; Koerselman, W. Variation in nitrogen and phosphorus concentrations of wetland plant. Perspect. Plant Ecol. 2002, 5, 37–61. [Google Scholar] [CrossRef]
- Zhang, L.X.; Bai, Y.F.; Han, X.G. Application of N: P Stoichiometry to Ecology Studies. Acta Bot. Sin. 2003, 45, 1009–1018. [Google Scholar]
- Niklas, K.J. Plant Allometry, Leaf Nitrogen and Phosphorus Stoichiometry, and Interspecific Trends in Annual Growth Rates. Ann. Bot. 2005, 97, 155–163. [Google Scholar] [CrossRef] [Green Version]
- Koreselman, W.; Meuleman, A.M. The vegetation N:P ratio: A new tool to detect the Nature of nutrient limitation. J. Appl. Ecol. 1996, 33, 1441–1450. [Google Scholar] [CrossRef]
- Zheng, L.J.; Huang, Z.Q.; He, Z.M.; Liu, R.Q.; Xiao, H.Y.; Du, T. δ15N in fine roots of Cunninghamia lanceolata plantations of different ages and implications for soil nitrogen cycling rates. Acta Ecol. Sin. 2016, 36, 2185–2191. [Google Scholar]
- Zheng, L.J.; Huang, Z.Q.; He, Z.M.; Wang, X.Y.; Liu, Z.M. Influence of forest and foliar ages on the composition of stable carbon and nitrogen isotope of Cunninghamia lanceolata in subtropical China. Sci. Silv. Sin. 2015, 51, 22–28. [Google Scholar]
- Chen, F.; Niklas, K.J.; Liu, Y.; Fang, X.M.; Wan, S.Z.; Wang, H.M. Nitrogen and phosphorus additions alter nutrient dynamics but not resorption efficiencies of Chinese fir leaves and twigs differing in age. Tree Physiol. 2015, 35, 1106–1117. [Google Scholar] [CrossRef] [Green Version]
- Zhou, L.L.; Addo-Danso, S.D.; Wu, P.F.; Li, S.B.; Zou, X.H.; Ma, X.Q. Leaf resorption efficiency in relation to foliar and soil nutrient concentrations and stoichiometry of Cunninghamia lanceolata with stand development in southern China. J. Soil. Sediment 2016, 16, 1448–1459. [Google Scholar] [CrossRef]
- Liang, X.Y.; Liu, S.R.; Wang, H.; Wang, J.X. Variation of carbon and nitrogen stoichiometry along a chronosequence of natural temperature forest in northeastern China. J. Plant Ecol. 2018, 11, 339–350. [Google Scholar] [CrossRef]
- Zhang, H.; Wang, J.N.; Wang, J.Y.; Guo, Z.W.; Wang, G.; Zeng, D.H.; Wu, T.G. Tree stoichiometry and nutrient resorption along a chronosequence of Metasequoia glyptostroboides forests in coastal China. For. Ecol. Manag. 2018, 430, 445–450. [Google Scholar] [CrossRef]
- Matzek, V.; Vitousek, P.M. N:P stoichiometry and protein: RNA ratios in vascular plants: An evaluation of the growth-rate hypothesis. Ecol. Lett. 2010, 12, 765–771. [Google Scholar] [CrossRef] [PubMed]
- Rivas-Ubach, A.; Sardans, J.; Pérez-Trujillo, M.; Estiarte, M.; Peñuelas, J. Strong relationship between elemental stoichiometry and metabolome on plants. Proc. Natl. Acad. Sci. USA 2012, 109, 4181–4186. [Google Scholar] [CrossRef] [PubMed]
- Li, M.J.; Yu, M.F.; Huang, Z.S.; Shi, J.H.C. C, N, and P stoichiometry and their interaction with plants, litter, and soil in a Cunninghamia lanceolata plantations with different ages. Acta Ecol. Sin. 2018, 38, 7772–7781. [Google Scholar]
- Waal, D.V.; Verschoor, A.M.; Verspagen, J.M.H.; Donk, E.V.; Huisman, J. Climate-driven changes in the ecological stoichiometry of aquatic ecosystems. Front. Ecol. Environ. 2010, 8, 145–152. [Google Scholar] [CrossRef] [Green Version]
- He, M.; Dijkstra, F.A.; Zhang, K.; Li, X.; Tan, H.; Li, G. Leaf nitrogen and phosphorus of temperate desert plants in response to climate and soil nutrient availability. Sci. Rep. 2014, 4, 6932. [Google Scholar] [CrossRef]
- Chen, Y.H.; Han, W.X.; Tang, L.Y.; Tang, Z.Y.; Fang, J.Y. Leaf nitrogen and phosphorus concentrations of woody plants differ in response to climate, soil and plant growth form. Ecography 2013, 36, 178–184. [Google Scholar] [CrossRef]
- Zhang, S.B.; Zhang, J.L.; Slik-Ferry, J.W.; Cao, K.F. Leaf element concentrations of terrestrial plants across China are influenced by taxonomy and the environment. Glob. Ecol. Biogeogr. 2012, 21, 809–818. [Google Scholar] [CrossRef]
- Wu, Z.L. (Ed.) Cunninghmia Lancelata; China Forestry Publishing House: Beijing, China, 1984; pp. 309–311. [Google Scholar]
- Reich, P.B.; Oleksyn, J.; Wright, I.J. Leaf phosphorus influences the photosynthesis-nitrogen relation: A cross-biome analysis of 314 species. Oecologia 2009, 160, 207–212. [Google Scholar] [CrossRef]
- Liu, Y.; Liu, Q.L.; Wang, T.L.; Fang, S.Z. Leaf nitrogen and phosphorus stoichiometry of Cyclocarya paliurus across China. Forests 2018, 9, 771. [Google Scholar] [CrossRef]
- Lin, Y.L.; Mao, W.; Zhao, X.Y.; Zhang, T.H. Leaf nitrogen and phosphorus stoichiometry in typical desert and desertified region, north China. Chin. Environ. Sci. 2010, 31, 1716–1725. [Google Scholar]
- Rentería, L.Y.; Jaramillo, V.J. Rainfall drives leaf traits and leaf nutrient resorption in a tropical dry forest in Mexico. Oecologia 2011, 165, 201–211. [Google Scholar] [CrossRef] [PubMed]
- Moles, A.T.; Perkins, S.E.; Laffan, S.W.; Flores-Moreno, H.; Awasthy, M.; Tindall, M.L.; Sack, L.; Pitman, A.; Kattge, J.; Aarssen, L.W.; et al. Which is a better predictor of plant traits: Temperature or precipitation? J. Veg. Sci. 2014, 25, 1167–1180. [Google Scholar] [CrossRef]
- Du, M.Y.; Fan, S.H.; Liu, G.L.; Feng, H.Y.; Guo, B.H.; Tang, X.L. Stoichiometric characteristics of carbon, nitrogen and phosphorus in Phyllostachys edulis forests of China. Chin. J. Plant Ecol. 2016, 40, 760–774. [Google Scholar]
- Reimann, C.; Englmaier, P.; Fabian, K.; Gough, L.; Lamothe, P.; Smith, D. Biogeochemical plant-soil interaction: Variable element composition in leaves of four plant species collected along a south-north transect at the southern tip of Norway. Sci. Total Environ. 2015, 506, 480–495. [Google Scholar] [CrossRef]
- Pan, W.T.; Tian, D.L.; Li, L.C.; Gao, Z.H. Studies on the nutrient cycling in the Chinese fir plantations (I) The yield structure and nutrient dynamics of Chinese fir forests in different growth stages. J. Cent. South For. Coll. 1981, 1, 1–21. [Google Scholar]
- Yang, Z.A. A Study of Root Characteristics and Nutrients of Different-aged Chinese Fir Plantations. Master’s Thesis, Northwest A & F University, Xianyang, China, May 2014. [Google Scholar]
- Liu, Z.M. Research on the Nutrient Dynamics and Internal Absorption of Cunninghamia lanceolota Foliar. Master’s Thesis, Fujian Agriculture and Forestry University, Fuzhou, China, April 2014. [Google Scholar]
- Kong, L.L.; Huang, Z.Q.; He, Z.M.; Zheng, L.J.; Liu, Z.M.; Wang, M.H. Variations of water use efficiency and foliar nutrient concentrations in Cunninghamia lanceolata plantations at different ages. Chin. J. Appl. Ecol. 2017, 28, 1069–1076. [Google Scholar]
- Qiu, L.J.; Hu, H.T.; Lin, B.P.; Wang, F.L.; Lin, Y.; He, Z.M.; Liu, Z.M. Nutrient resorption efficiency and C:N:P stoichiometry of Cunninghamia lanceolata plantations with different ages. J. Northwest For. Univ. 2017, 32, 22–27. [Google Scholar]
- Ma, X.Q.; Liu, A.Q.; Ma, Z. A comparative study on nutrient accumulation and distribution of different generations of Chinese fir plantations. Chin. J. Appl. Ecol. 2000, 11, 501–506. [Google Scholar]
- Lei, X.M. The Influence of Simulated Nitrogen Deposition and Understory Removal on Available N and P Dynamics in a Cunninghamia lanceolata Plantation. Master’s Thesis, Nanchang Institute of Technology, Nanchang, China, December 2017. [Google Scholar]
- Pan, W.C.; Tian, D.L.; Lei, Z.X.; Kang, W.X. Studies on the nutrient cycling in the Chinese fir plantations (II) Content, accumulation rate and biological cycling of nutrient elements in the fast-growing Chinese fir forest in the hill regions. J. Cent. South For. Coll. 1983, 3, 1–17. [Google Scholar]
- Liu, K.C.; Zeng, T.X. An investigation on the translocation and cycling of main nutrient elements in young mixed stand of Cunninghamia lanceolata and Michelia macclurei. For. Res. 1990, 3, 618–623. [Google Scholar]
- Zhong, A.L.; Xiong, W.Y. Seasonal changes of nutrient concentrations and nutrient interactions in needles of Chinese fir plantations. J. Nanjing For. Univ. 1993, 17, 1–8. [Google Scholar]
- Xian, G.B.; Huang, Y.H.; Xian, W.G.; Wang, M.; Tang, H.H.; Gan, X.H. Ecological stoichiometry characteristics of leaf nitrogen, phosphorus and sulfur of trees species of plantation on South China. Guangdong For. Sci. Technol. 2015, 31, 28–34. [Google Scholar]
- Wang, Q.; Zhang, J.B.; Lei, Z.F.; Liu, M.; Li, Q.; Huang, H.H.; Song, X.Z. Effects of simulated nitrogen deposition and phosphorus addition on ecological stoichiometry of Chinese fir leaves. Chin. J. Ecol. 2019, 38, 368–375. [Google Scholar]
- Liao, Z.H. Comparative analyses of macro nutrient elements in various organs of twenty-year-old Cunninghamia lanceolata under different site conditions. J. Fujian For. Sci. Tech. 1999, 26, 22–25. [Google Scholar]
- Liu, W.F.; Fan, H.B.; Zhang, Z.W.; Yang, Y.L.; Wang, Q.Q.; Xu, L. Foliar nutrient contents of Chinese fir in response to simulated nitrogen deposition. Chin. J. Appl. Environ. Biol. 2008, 14, 319–323. [Google Scholar]
- Nie, D.P. A comparasion of the productivity and nutrient cycling of Chinese fir plantation in different site conditions. For. Res. 1993, 6, 643–649. [Google Scholar]
- Xue, L.; Luo, S. Concentration and distribution of nutrients in an artificial Cunninghamia lanceolata stand ecosystem at Yishan. J. South China Agric. Univ. 2002, 23, 24–26. [Google Scholar]
- Lv, W.Q.; Zhou, C.Y.; Yan, J.H.; Li, S.J. Leaf C, N, and P stoichiometry for four typical artificial forests in the karst region of Guihou Province. J. Zhejiang A F Univ. 2016, 33, 984–990. [Google Scholar]
- Liu, F.; Luo, R.Y.; Jiang, J.P. Soil nutritive conditions and tree growth of Chinese fir. J. Nanjing For. Univ. 1991, 15, 41–46. [Google Scholar]
- Fan, J. Stand Structure Influence on Phosphorus Functional Fractions and Vegetative Organ Nitrogen and Phosphorus Stoichiometric Ratio in Cunninghamia lanceolata Plantations. Master’s Thesis, Jiangxi Agricultural University, Nanchang, China, June 2015. [Google Scholar]
Figure 1.
Distribution of the study areas. The small square stands in the Nansha Islands in China.
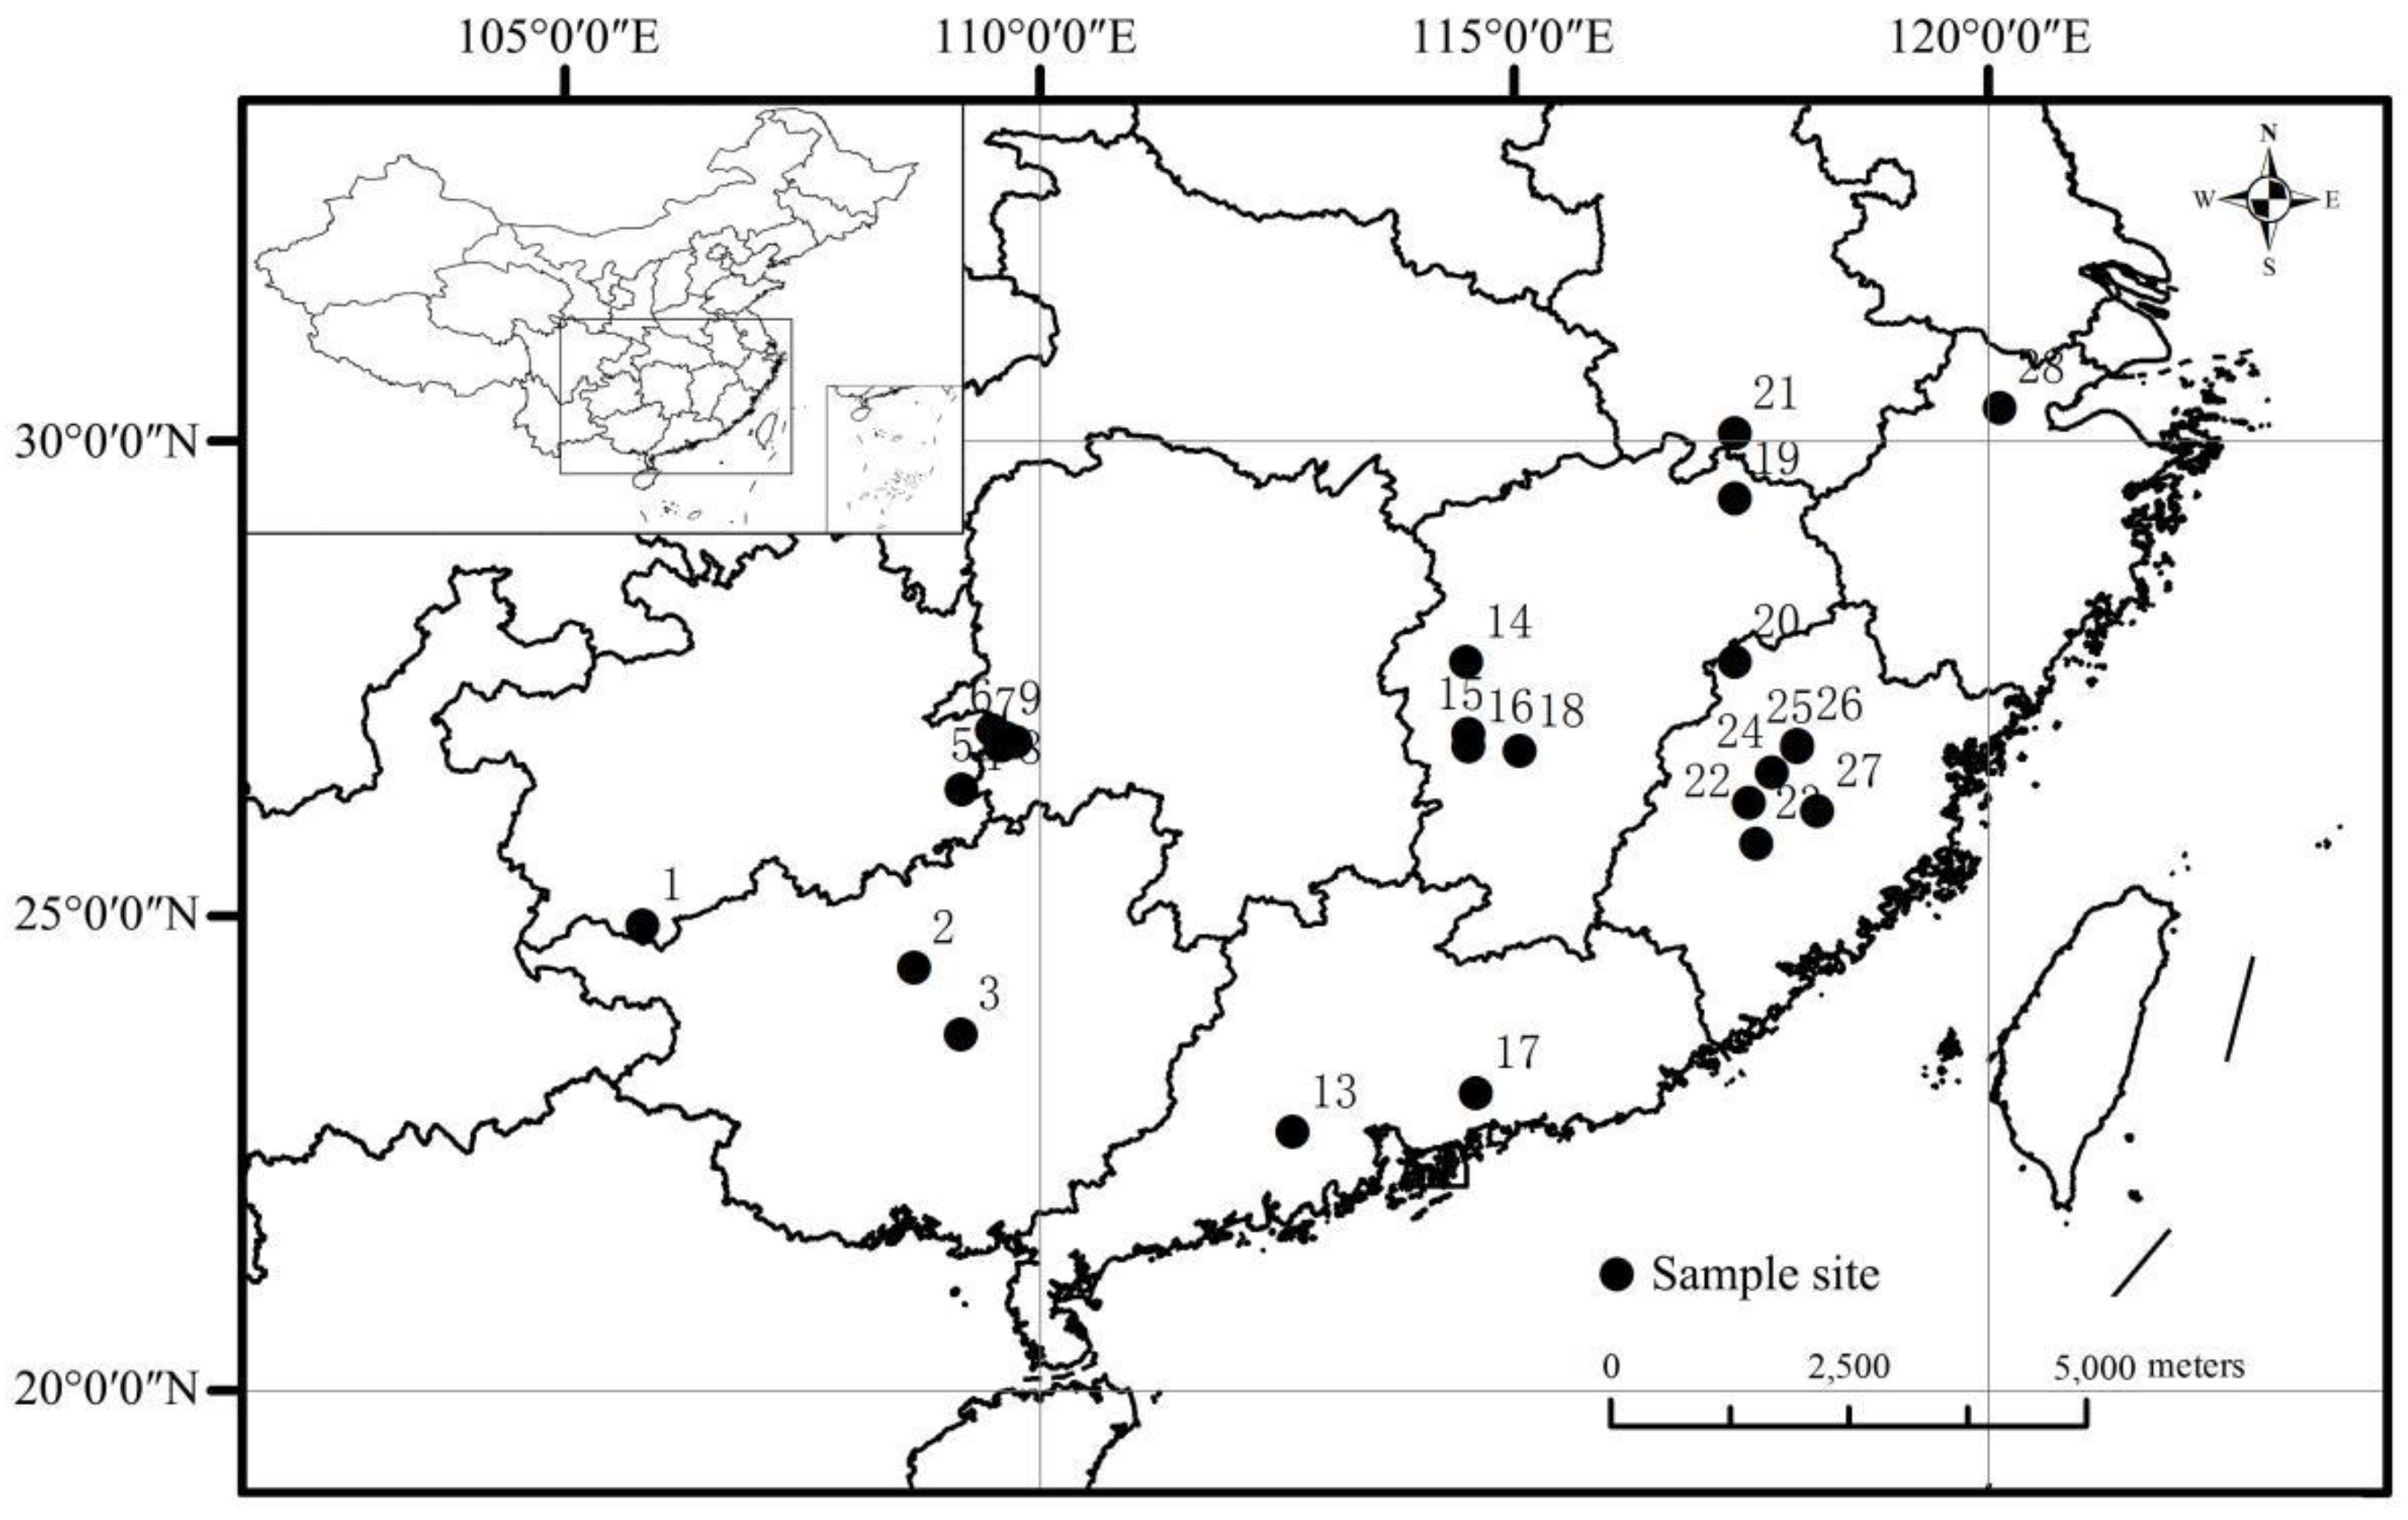
Figure 2.
Relationships between the leaf N and P concentrations for Chinese fir in the study. Each data point represents an ln (N + 1)-transformed leaf N or P concentration. Linear regressions are shown for the leaf N and P (R2 = 0.19, p < 0.01).
Figure 2.
Relationships between the leaf N and P concentrations for Chinese fir in the study. Each data point represents an ln (N + 1)-transformed leaf N or P concentration. Linear regressions are shown for the leaf N and P (R2 = 0.19, p < 0.01).

Figure 3.
Relationships between the leaf stoichiometry and geographical factors for Chinese fir. Each data point represents an ln (N + 1)-transformed leaf N or P concentration or leaf N:P ratio. Quadratic fit for (a) the leaf N and LON (Longitude) (R2 = 0.11, p < 0.05); and (e) the leaf P and LAT (Latitude) (R2 = 0.09, p < 0.05). No fit for (b) the leaf P and LON; (c) the leaf N:P ratio and LON; (d) the leaf N and LAT; (f) the leaf N:P ratio and LAT; (g) the leaf N and ALT; (h) the leaf P and ALT; and (i) the leaf N:P ratio and ALT.
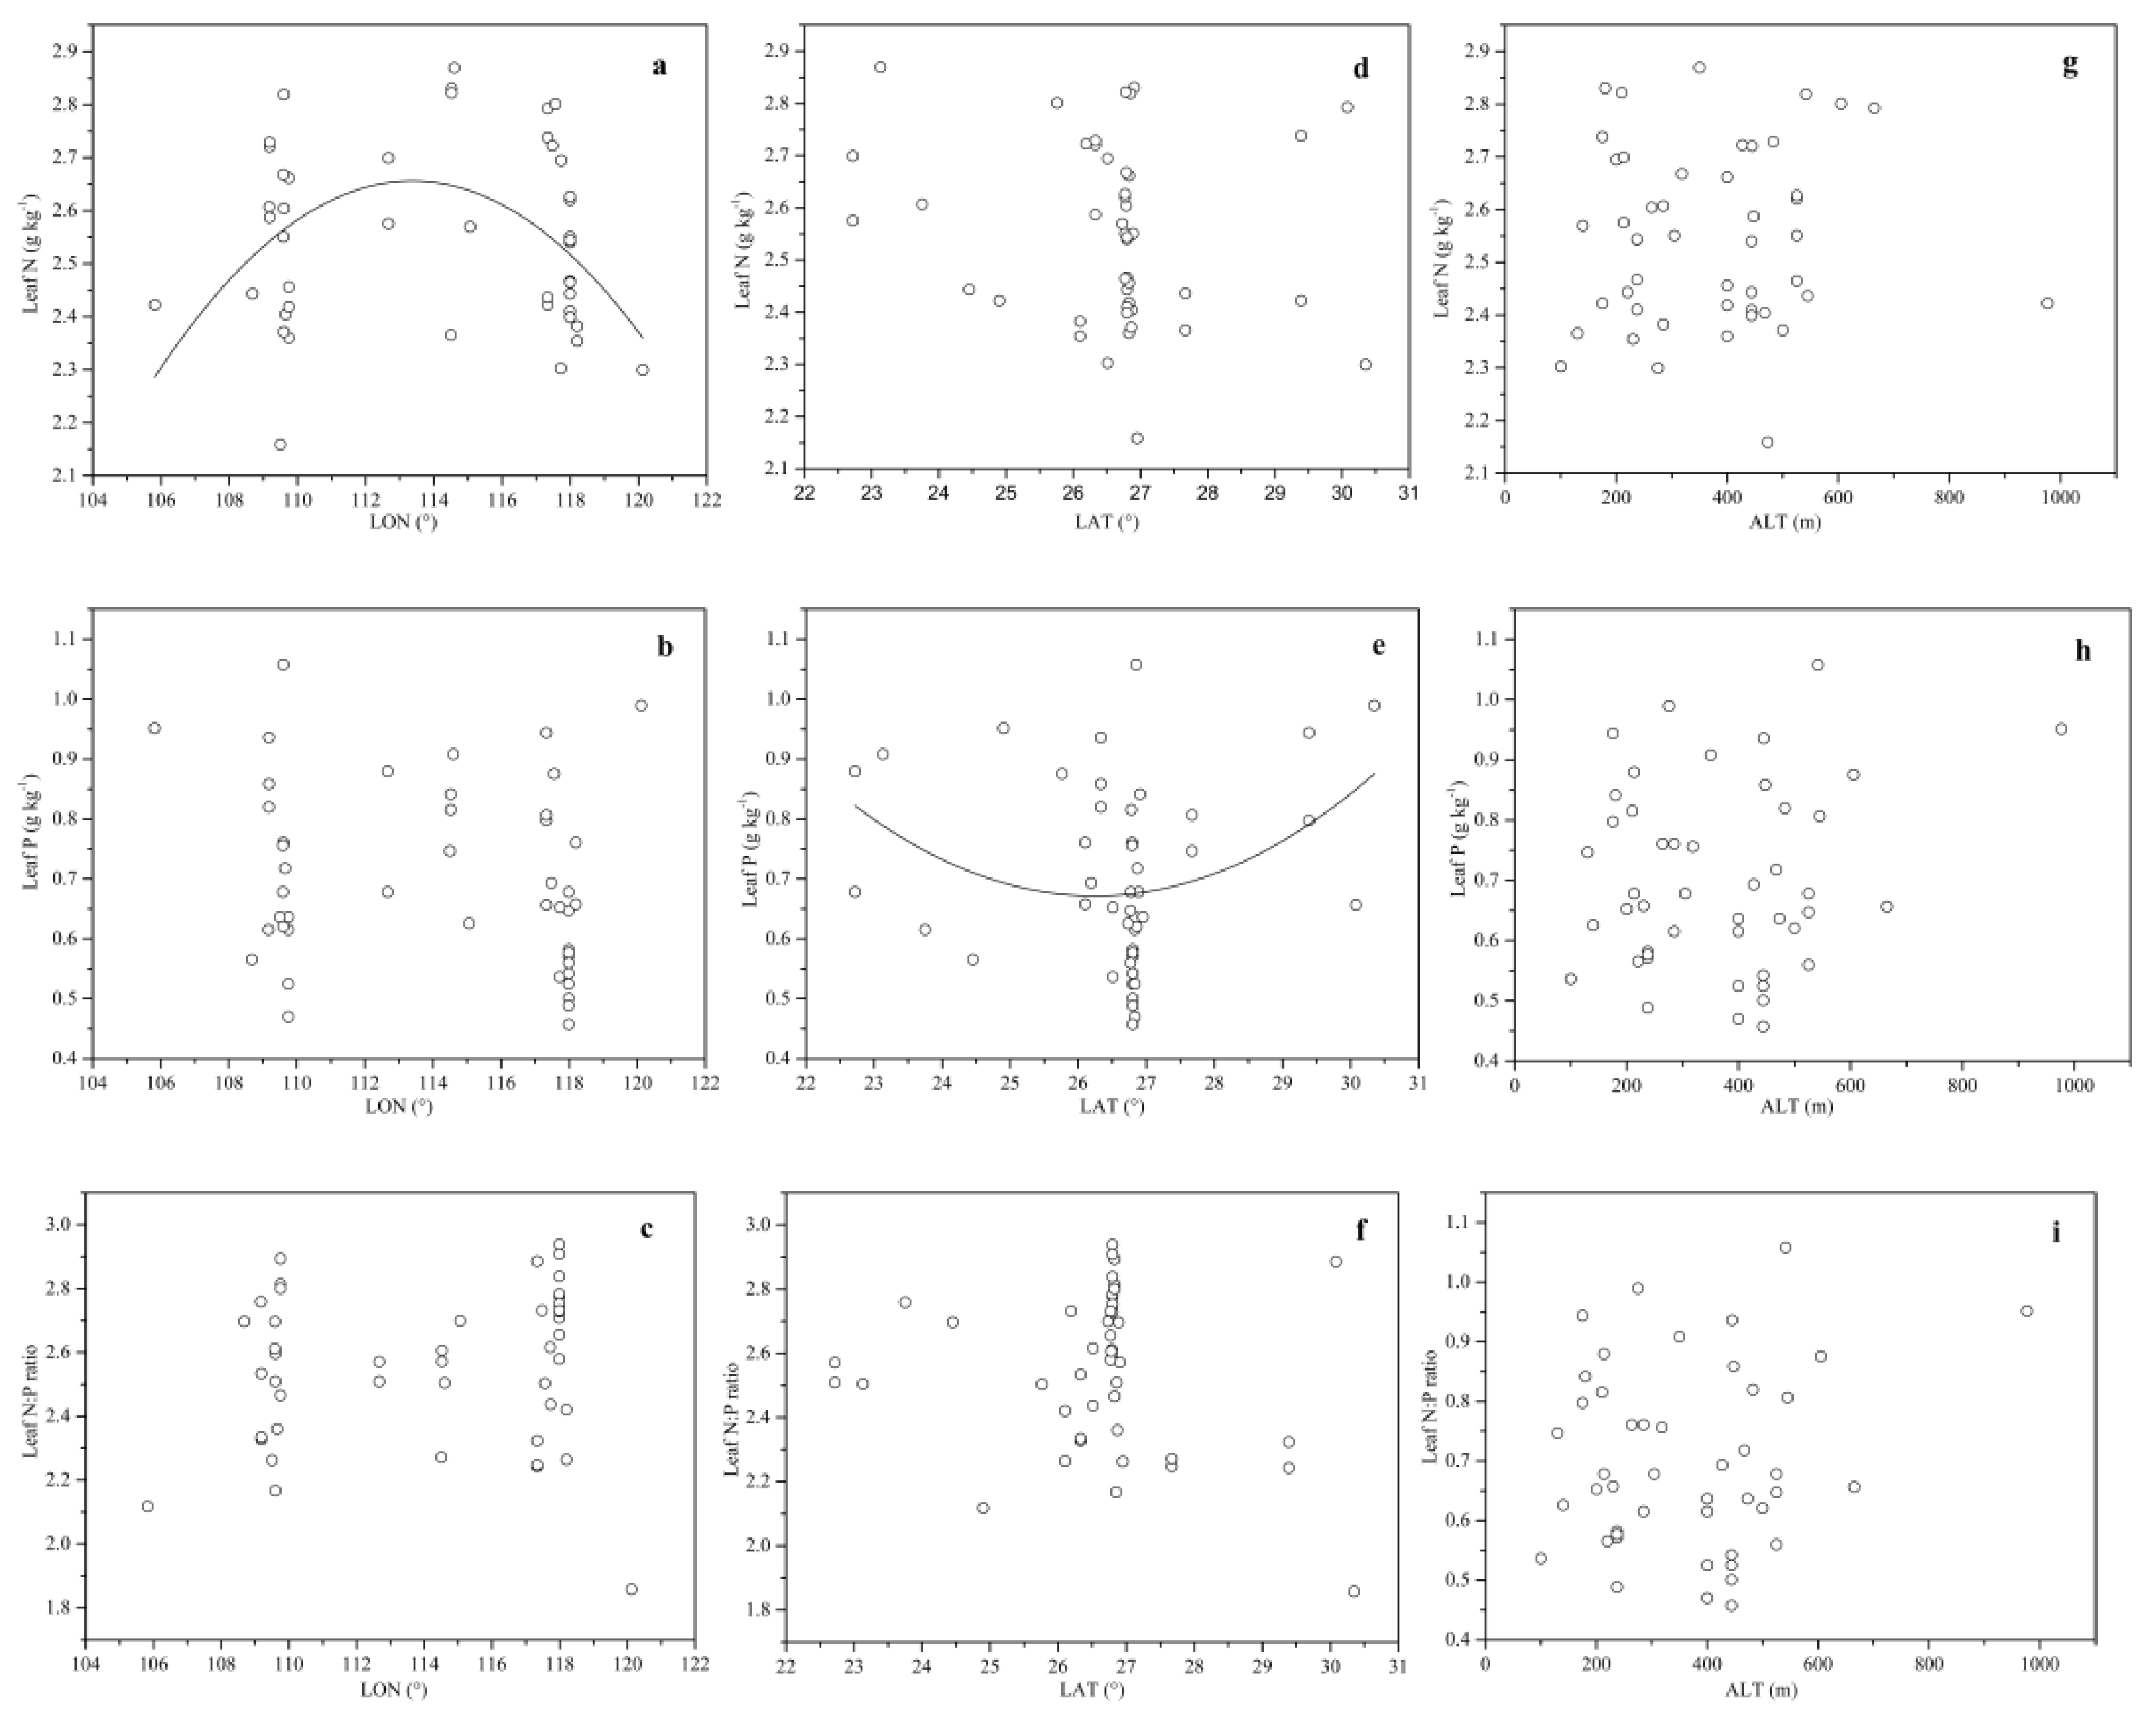
Figure 4.
Relationships between the leaf stoichiometry and climatic variables for Chinese fir. Each data point represents an ln (N + 1)-transformed leaf N or P concentration or leaf N:P ratio. Linear fit for (e) the leaf P and MAT (mean annual temperature) (R2 = 0.11, p < 0.05); and (f) the leaf N:P ratio and MAT (R2 = 0.17, p < 0.01). No fit for (a) the leaf N and MAP (mean annual precipitation); (b) the leaf P and MAP; (c) the leaf N:P ratio and MAP; and (d) the leaf N and MAT.

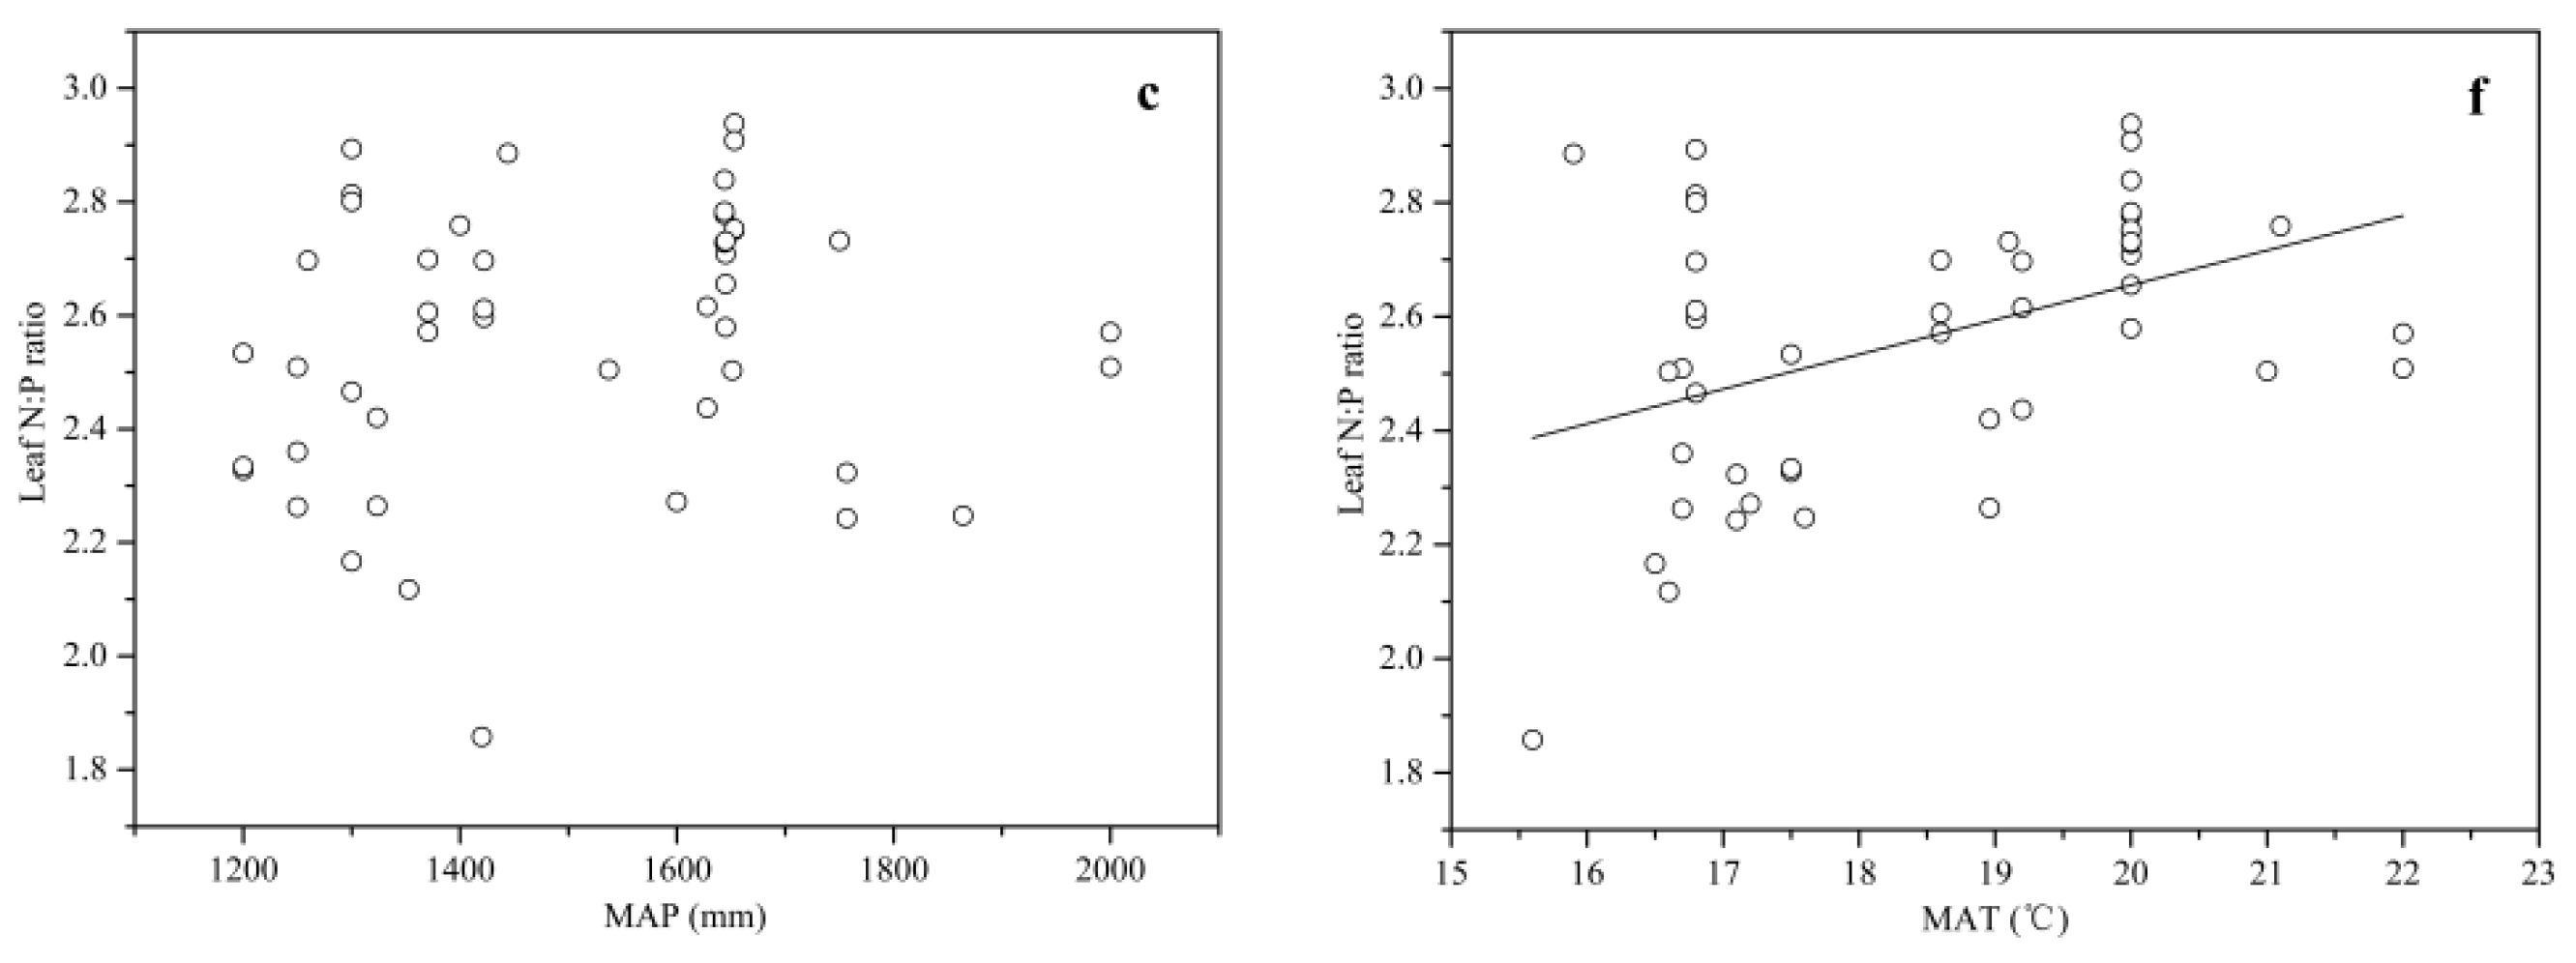
Figure 5.
Relationships between the leaf stoichiometry and soil nutrients variables for Chinese fir. Each data point represents an ln (N + 1)-transformed leaf and soil N, leaf and soil P concentration, or leaf N:P ratio. Linear fit for (b) the leaf P and soil N (R2 = 0.23, p < 0.001); and linear fit for (c) the leaf N:P ratio and soil N (R2 = 0.28, p < 0.001). No fit for (a) the leaf N and Soil N; (d) the leaf N and Soil P; (e) the leaf P and Soil P; and (f) the leaf N:P ratio and Soil P.

Figure 6.
Bidimensional ordering chart of the RDA for the relationships between the leaf stoichiometry and influencing factors. LN is the leaf N concentration; LP is the leaf P concentration; L(N:P) is the leaf N:P ratio; SA is the stand age; LAT is the Latitude; LON is the Longitude; ALT is the Altitude; MAT is the mean annual temperature; MAP is the mean annual precipitation; SN is the soil N concentration; and SP is the soil P concentration. The leaf stoichiometry and influencing factors are represented by the solid and dotted line, respectively. The length of the arrow line represents the correlation level between the leaf stoichiometry and influencing factors. A longer line indicates a higher correlation. The angel between the two arrow lines can be considered an evaluation of the correlation level between the leaf stoichiometry and influencing factors. An angle between 0 and 90 degrees indicates a positive correlation between the two variables; an angle between 90 and 180 degrees indicates a negative correlation between the two variables shown; and an angle of 90 degrees shows no relationship between the two variables.

Table 1.
Leaf nitrogen (N) and phosphorous (P) concentrations and N:P ratio for Chinese fir.
| Age Groups | Age Range (a) | N | P | N:P | ||||||
|---|---|---|---|---|---|---|---|---|---|---|
| Mean (mg g−1) | SD (mg g−1) | CV | Mean (mg g−1) | SD (mg g−1) | CV | Mean | SD | CV | ||
| AAG (n = 47) | 11.94 | 2.20 | 0.184 | 1.04 | 0.32 | 0.306 | 12.29 | 2.97 | 0.242 | |
| YAG (n = 15) | ≤10 | 11.45 | 2.52 | 0.221 | 1.06 | 0.30 | 0.282 | 11.46 | 2.73 | 0.239 |
| MAG (n = 16) | 11–20 | 11.83 | 1.72 | 0.145 | 1.08 | 0.31 | 0.288 | 11.70 | 3.04 | 0.260 |
| NMAG (n = 6) | 21–25 | 12.24 | 1.84 | 0.150 | 0.87 | 0.17 | 0.195 | 14.50 | 1.79 | 0.124 |
| MAG (n = 5) | 26–35 | 14.28 | 2.43 | 0.170 | 1.37 | 0.31 | 0.226 | 10.54 | 1.90 | 0.180 |
| OMAG (n = 5) | ≥36 | 11.07 | 1.78 | 0.160 | 0.71 | 0.17 | 0.224 | 15.83 | 1.43 | 0.090 |
| F | 2.01 | 4.06 | 4.604 | |||||||
| P | 0.111 | 0.007 | 0.004 | |||||||
AAG: All age groups; YAG: Young age group; MAG: Middle age group; NMAG: Near mature age group; MAG: Mature age group; OMAG: Over mature age group; SD: standard deviation; CV: coefficient of variation.
Table 2.
RDA analysis (redundancy analysis) of the leaf N and P stoichiometry.
| Axis | Axis I | Axis II | Axis III | Axis IV |
|---|---|---|---|---|
| Eigenvalues Explained variation of the leaf stoichiometry | 0.350 | 0.058 | 0.001 | 0.326 |
| Correlations between the leaf stoichiometry and influencing factors | 0.721 | 0.427 | 0.363 | 0.000 |
| Cumulative explained variation of the leaf stoichiometry | 0.350 | 0.408 | 0.409 | 0.735 |
| Cumulative explained variation of the relations between the leaf stoichiometry and influencing factors | 0.855 | 0.997 | 1.000 | 0.000 |
| Canonical eigenvalues | 0.409 | |||
| Sum of all eigenvalues | 1 | |||
Table 3.
Leaf N and P concentrations and N:P ratio for Chinese fir in the present study and flora in Europe, North–South Transect of Eastern China (NSTEC), China, and globe.
Table 3.
Leaf N and P concentrations and N:P ratio for Chinese fir in the present study and flora in Europe, North–South Transect of Eastern China (NSTEC), China, and globe.
| Data Source | Species Type | Species Number | N mg g−1 | P mg g−1 | N:P | Reference |
|---|---|---|---|---|---|---|
| Present study | Chinese fir | 1 | 11.94 | 1.04 | 12.29 | |
| Europe | Picea abies L. | 1 | 13.37 | 1.41 | 9.76 | [7] |
| China | Quercus L. | 13 | 17.27 | 1.54 | 13.96 | [8] |
| NSTEC | Whole trees | 654 | 19.09 | 1.56 | 15.39 | [15] |
| China | Whole trees | 753 | 20.24 | 1.45 | 16.35 | [10] |
| Global | Whole trees | 1251 | 20.1 | 1.77 | 13.8 | [11] |
© 2019 by the authors. Licensee MDPI, Basel, Switzerland. This article is an open access article distributed under the terms and conditions of the Creative Commons Attribution (CC BY) license (http://creativecommons.org/licenses/by/4.0/).
Share and Cite
MDPI and ACS Style
Tong, R.; Zhou, B.; Jiang, L.; Ge, X.; Cao, Y.; Yang, Z. Leaf Nitrogen and Phosphorus Stoichiometry of Chinese fir Plantations across China: A Meta-Analysis. Forests 2019, 10, 945. https://doi.org/10.3390/f10110945
AMA Style
Tong R, Zhou B, Jiang L, Ge X, Cao Y, Yang Z. Leaf Nitrogen and Phosphorus Stoichiometry of Chinese fir Plantations across China: A Meta-Analysis. Forests. 2019; 10(11):945. https://doi.org/10.3390/f10110945
Chicago/Turabian StyleTong, Ran, Benzhi Zhou, Lina Jiang, Xiaogai Ge, Yonghui Cao, and Zhenya Yang. 2019. "Leaf Nitrogen and Phosphorus Stoichiometry of Chinese fir Plantations across China: A Meta-Analysis" Forests 10, no. 11: 945. https://doi.org/10.3390/f10110945
Note that from the first issue of 2016, this journal uses article numbers instead of page numbers. See further details here.