Tree-Rings Reveal Accelerated Yellow-Cedar Decline with Changes to Winter Climate after 1980
by
Vanessa M. Comeau
1,*, 
Lori D. Daniels
1,
Garrett Knochenmus
1,
Raphaël D. Chavardès
1,2 and
Stefan Zeglen
3 1
Department of Forest and Conservation Sciences, Faculty of Forestry, University of British Columbia, Vancouver, BC V6T 1Z4, Canada
2
NSERC-UQAT-UQAM Industrial Chair in Sustainable Forest Management, 445 boulevard de l’Université Rouyn-Noranda, Québec J9X 5E4, Canada
3
West Coast Region, British Columbia Ministry of Forests, Lands, Natural Resource Operations and Rural Development, Nanaimo, BC V9T 6E9, Canada
*
Author to whom correspondence should be addressed.
Forests 2019, 10(12), 1085; https://doi.org/10.3390/f10121085
Submission received: 25 October 2019
/
Revised: 20 November 2019
/
Accepted: 27 November 2019
/
Published: 29 November 2019
(This article belongs to the Special Issue Dieback on Drought-Prone Forest Ecosystems)
Abstract
:Research Highlights: Yellow-cedar decline on the island archipelago of Haida Gwaii is driven by warm winter temperatures and low winter precipitation, which is caused by anthropogenic climate change and exacerbated by the positive phase of the Pacific Decadal Oscillation (PDO). Background and Objectives: Declining yellow-cedars are limited by physiological drought during the growing season, caused by freezing damage to fine roots through a complex pathway identified by research in Alaska. Given this, we hypothesized: (1) yellow-cedars on Haida Gwaii were limited by the winter climate. (2) Trees of different health classes were responding differently to climatic variation. (3) Changing climate-growth relations would vary among phases of the PDO. Materials and Methods: We sampled 15 stands exhibiting crown symptoms and developed three regional chronologies from trees that were healthy, had crown or tree-ring symptoms of decline, and trees that had died. We tested for growth responses to inter-annual and multi-decadal variation in climate among trees of different health statuses using correlation functions and wavelet analyses. Results: The three chronologies had similar patterns from the early 1500s to 1900s and responded to climate in the same way, with multi-decadal variability, and common narrow marker years. Climate-growth responses among trees of different health statuses diverged after the 1976/1977 switch in the PDO. Warm growing season temperatures facilitated the growth of trees in the healthy chronology. By contrast, growth of trees that showed symptoms of decline or had died was negatively associated with low winter precipitation. After 1986, growth of trees in the declining chronology decreased sharply and mortality increased, which is concurrent with the warmest winter temperatures and consistent with the root-freezing hypothesis from Alaska. Conclusions: Yellow-cedar decline is driven by climate change, exacerbated by the PDO. Warming winter temperatures, accelerated by anthropogenic climate change, have led to dieback and death of yellow-cedars, even with the temperate ocean-moderated climate of Haida Gwaii.
1. Introduction
Climatic warming over the 20th century has led to widespread forest dieback around the globe [1,2]. Many of these diebacks are driven by drought. Yet, forests have also exhibited dieback in direct response to heat stress, indirect temperate influences on insects and pathogens, or more complex drivers mediated by climate change [3]. Forest dieback now affects all forested continents worldwide [1] and these events have far-reaching effects on ecosystem dynamics. Drought exacerbated by climate warming has had a major impact on forests in semi-arid regions at low latitude, such as Pinus spp. in southern Europe [4] and Pinus edulis Engelm. in southwestern United States [5]. However, climate warming also poses a serious threat to forests of higher latitudes, such as the Canadian interior where the dieback of Populus tremuloides Michx. is of great concern [6] and the circumpolar boreal forests, where a diverse range of genera have exhibited dieback [7].
In the Pacific Northwest, climate warming has driven yellow-cedar (Callitropsis nootkatensis (D. Don) D.P. Little) decline, which is one of the largest forest declines in North America and includes 400,000 ha of forest in the mid to northern range of the species’ distribution [8]. However, rather than direct drought limitation, declining yellow-cedars are limited by physiological drought during the growing season, when trees suffer drought conditions despite there being sufficient water in the soil [9]. This is the result of freezing damage to fine roots through a complex pathway identified by research in Alaska [10]. Warming temperatures during the 20th century have reduced snowpacks, exposing shallow fine roots to freezing damage [11,12]. Local microsite conditions predispose trees to freezing injury during years when a low snowpack coincides with thaw-freeze events in the late winter and early spring [10,13]. While large areas have experienced high levels of mortality, a subpopulation of surviving, apparently healthy trees coexist with dying and dead trees in the same stands [14,15].
On the island archipelago of Haida Gwaii, yellow-cedar decline was unexpected due to the milder temperatures, moderated by the Pacific Ocean, and the lack of persistent snowpack [16]. However, many stands of yellow-cedar on Haida Gwaii now exhibit moderate-severity to high-severity decline, in which an average of 70% of trees are dying or dead [17]. All declining stands studied had trees of varying health status, including trees that appeared healthy, those with crown dieback, and trees recently to long dead. In addition to crown dieback, many declining trees exhibited decreasing radial growth rates or cessation of ring formation [17]. Dendrochronology can be used to pinpoint the timing of dieback and death of individual trees [18] and quantify rates and magnitude of decline across populations at stand and landscape scales [19]. Tree-rings can also reveal relationships between climate and growth, which includes limiting factors [20].
We hypothesized that yellow-cedars in declining stands on Haida Gwaii were limited by and respond to climate variables, with common growth patterns across sites. Within sites, we hypothesized that yellow-cedars of different health classes were responding differently to climate variables, given that the proposed driver of decline is associated with climate warming [10] and that the timing of decline on Haida Gwaii parallels the greatest warming [21]. Following this hypothesis, trees that were declining or had died, would be expected to respond negatively to warmer temperatures, whereas healthy trees would be expected to respond positively to warmer temperatures. We tested for evidence of growth response to climate indicated by common year-to-year growth patterns across the region. We differentiated growth patterns and responses to climate among trees that were healthy, had a crown and/or tree-ring symptoms of decline, and trees that had died. Lastly, we determined whether yellow-cedars of different health classes responded differently to climate over time. Concurrent with yellow-cedar decline, the climate of Haida Gwaii has been affected by the multi-decadal climate regime known as the Pacific Decadal Oscillation (PDO) and anthropogenic warming [21,22]. If changing climate is leading to decline, we expect changing climate-growth relations over time and among yellow-cedar subpopulations, both as the climate warms and following the most recent switch of the PDO to the warm phase. This phenomenon has been observed in Picea glacuca (Moench) Voss forests in the Yukon, where trees were limited by different factors during the warm and cool phases of the PDO [20]. Similarly, Wiles et al. documented a loss in temperature sensitivity following the 1976/1977 shift in PDO in three stands of healthy yellow-cedar in southeast Alaska [23]. Determining if this is true for yellow-cedars on Haida Gwaii as well will help uncover the drivers of decline and determine whether they are the same as those on the mainland. Identifying the mechanism that leads to decline is crucial for the management and conservation of this important tree species.
2. Materials and Methods
2.1. Study Sites
To address the causes of yellow-cedar decline, we selected stands exhibiting crown symptoms. Thirteen study sites were located on the southern portion of Graham Island, Haida Gwaii (Figure 1). The sites are distributed across multiple watersheds and over a range of elevations where decline has been documented. The sites were wet, with boggy soils, often adjacent to a water feature such as a stream or wetland. The sampled stands contained yellow-cedar as a codominant species, with Sitka spruce (Picea sitchensis (Bong.) Carrière), western hemlock (Tsuga heterophylla (Raf.) Sarg.), and western red cedar (Thuja plicata Donn ex D. Don). The climate of Haida Gwaii is wet hyper-maritime, strongly influenced by proximity to the Pacific Ocean.
Yellow-cedar were sampled in 100 m by 20 m transects bisecting the forest most heavily affected by decline. Increment cores from 30 trees at each site enabled tree-ring analyses to detect internal evidence of decline, growth patterns, and relationships to climate. Tree diameter at breast height (DBH, 1.3 m) and health status were recorded. Trees were classified as healthy if they had full, green crowns, declining if they had discolored foliage, or were partly defoliated, or dead if they lacked foliage or had only brown foliage. To objectively select trees, we cored the first 15 healthy yellow-cedars (except one site where only 10 healthy trees were available to sample), and the first 15 declining yellow-cedars or snags. Downed trees were not sampled. To maximize the number of trees and sites sampled, we took only one core from each tree. Cores were sampled at standing height (c. 115 cm above the ground) in 2014 or 2016. We aimed to intercept the pith and included the bark or outer cambium whenever it was present. Highly decayed trees were not sampled. Instead we cored the next tree along the transect in the same health status class. For transects with fewer than 15 healthy or 15 declining or dead yellow-cedars that were suitable to the core, additional trees were sampled and cored from outside of the transect.
2.2. Dendrochronological Methods
Cores were mounted on wooden supports, sanded with progressively finer grains (120–600 grit), and scanned at high resolution (2400 or 3200 dpi). We measured ring widths to 0.001 mm using the program CooRecorder [24]. Cores with particularly suppressed or difficult to distinguish rings were cross-checked under a microscope. We crossdated each ring-width series using the program CDendro [25], and created ring-with chronologies for each site. We confirmed crossdating accuracy using the program COFECHA [26]. Crossdating allowed us to account for missing or false rings and assign a calendar year to each ring. The year of the outermost ring represents cessation of growth of living trees and the year of death of snags.
Chronologies were developed for each of the 13 sites using trees with highly correlated ring-width series. Only trees with series intercorrelations >0.32 were included. A cross correlation matrix of these chronologies was calculated for the 13 sites, to test for similarity in growth patterns. Positive and negative marker years were also identified for each site-level chronology, using the ‘pointer’ function of dplR in R [27,28,29,30]. A marker year was defined as years when >75% of ring-width series showed an increase/decrease of >10% radial growth compared to the previous year. Marker rings were reported beginning in 1798, when a minimum of 10 chronologies were made up of 10 or more samples.
We built three regional ring-width chronologies based on health class (healthy, declining, and dead) using the subset of cores that were highly correlated, with a strong common signal. Trees in the ‘healthy’ category that exhibited internal tree-ring symptoms of decline, including suppressed outer rings or cessation of ring formation, were moved to the ‘declining’ category (Table S1). Trees with low correlations (<0.23) between 1901 and 2015 relative to the regional ‘health status’ chronologies were removed. The program CRUST was used to detrend the ring-with series [31]. We used signal-free curve-fitting standardization, which accounts for fluctuations in the sample depth and iteratively improves the fit of the standardization curves to minimize the effect of trend distortion and maintain the common climate-forcing signal [32]. We chose a 100-year spline, which leaves 99% of variance at 31.69 years (50% variance at 100 years, 1% of variance at 315.43 years). This detrending method removes longer-term variation and retains variation at the ~30-year level. The Pacific Decadal Oscillation (PDO) has also had approximately 30-year periodicity during the 20th century [22]. This will effectively retain the PDO signal in the ring-width series and remove the longer-term variability at the multi-century level. For climate-growth analysis, we used the residual chronologies, which were created by applying an autoregressive time series model.
For all chronologies, we calculated the mean series intercorrelation, mean sensitivity, and expressed population signal (EPS). The mean series intercorrelation (r) is the coefficient derived from a correlation matrix of all ring-width series in the chronology [33]. High values indicate that trees respond similarly to coarse-scale climate and environmental variation. Mean sensitivity measures ring-width variability between successive years [33]. High values indicate a high degree of inter-annual variation in tree growth. The EPS estimates how closely a mean chronology based on a finite number of trees expresses its hypothetically perfect chronology based on an infinite number of trees [34]. EPS values ≥ 0.85 indicate a coherent stand-level signal.
2.3. Climate-Growth Relations
We compared climate-growth relations among the trees of the three health statuses (using the three residual chronologies) for 1901–2015, which includes the beginning of the climate record to the year of sampling. We obtained monthly total precipitation and mean/minimum/maximum monthly temperature records for each of the 13 sites using the software ClimateNA [35] and averaged the records for each climate attribute to represent the dominant regional climate of the study area. ClimateNA uses bilinear interpolation and elevation adjustments to downscale historical climate data to scale-free point estimates of climate values [35]. To assess relationships between the annual index values of the three residual ring-width chronologies and the regional monthly precipitation and temperature records, we conducted bootstrap correlation function analysis [36] using the R package treeclim [30,37]. Twelve months from October prior to ring formation through September of the year of ring formation were analyzed. The period of analysis, 1901–2015, was split into three segments based on the two major switches in the PDO. The PDO switched from a warm-dry to cool-wet phase in 1946–1947 and back to a warm-dry phase in 1976–1977 [22]. Therefore, the three segments were 1902–1945, 1946–1976, and 1977–2015. We compared monthly temperatures and total monthly precipitation in the three time-periods using a Kruskal-Wallis one-way analysis of variance (ANOVA) on ranks with a Dunn’s post-hoc test.
2.4. Wavelet Transform Analysis
Wavelet analysis is a useful tool for analyzing time series with many different timescales or changes in variance [38]. Cross-wavelet analysis additionally analyzes the coherency of two time series. We conducted cross-wavelet analyses on the standard chronologies for the three health status groups against the annual PDO index using the R package WaveletComp [39]. The annual PDO index was calculated for a biological year (September of the previous year through August of the year of ring formation) using the mean of the monthly PDO index from NOAA (National Oceanic and Atmospheric Administration) [40]. Cross-wavelet analyses were conducted for the common period from 1855 to 2015 by applying the Morlet wavelet with a temporal resolution of one year and a selected range of Fourier periods for wavelet decomposition of two to 64 years. The significance of frequencies in the wavelet and cross-wavelet power spectra was calculated using 100 Monte Carlo simulations. By applying wavelet analysis to the health status chronologies and PDO index, we were able to determine the dominant frequency modes of variability and how the modes varied through time. By calculating the cross-wavelet analysis, we were able to assess the relationship between the tree-ring records and the PDO.
3. Results
3.1. Site Chronologies
The 13 site-level chronologies contained 276 highly correlated trees, with 16 to 28 trees in each chronology (Table S2). Trees, which had low correlations (n = 95) or could not be crossdated (n = 21), were not included in these chronologies. The chronologies were 451 to 903 years in length reaching as far back as the calendar year 1112 AD. Mean series intercorrelations ranged from 0.342 to 0.461, which indicates robust crossdating among trees whose ring-width series exhibited both complacent periods and suppressions with locally absent rings over time. In general, during periods when there are sufficient resources, environmental conditions support optimum growth, the ring pattern of trees is complacent, and there is little variation in ring-width year-to-year [41]. Conversely, in years of extremely little growth, when trees are limited by some factor, rings are suppressed and a ring may not appear at every point around the circumference of the tree, which leads to a locally absent ring [41]. Given this temporal variation within and among sites, these intercorrelation values are lower than those reported for other yellow-cedar chronologies (r = 0.46–0.51 [15], r = 0.46–0.50 [42], r = 0.50 [43]), but are comparable to those associated with yellow-cedar trees found in more temperate locations, such as Vancouver Island, BC (r = 0.30–0.47 [44]). Mean sensitivity was 0.236 to 0.308, which indicates modest and variable changes in ring-width from one year to the next. The pairs of chronologies for the 13 sites from the southern portion of Graham Island were significantly and positively correlated (r = 0.08 to 0.86, Table 1).
Trees from different sites often exhibited the same positive and negative marker years between 1798 and 2015 when at least 10 chronologies (sites) included sufficient trees (Figure 2). Five to 12 of the 13 chronologies exhibited positive marker years in 1989 (5 chronologies), 1967 (7), 1929 (12), 1927 (11), 1890 (6), 1889 (5), 1876 (5), and 1857 (8). Chronologies exhibited negative marker years in 1986 (11 chronologies), 1926 (8), 1885 (6), and 1872 (7).
3.2. Regional Chronologies
Grouping trees from the 13 sites by health status yielded three regional chronologies made up of trees that were healthy (n = 99), declining (n = 64), or dead (n = 57) when sampled in 2016 (Figure 3). Mean series intercorrelations ranged from 0.377 to 0.381 and mean sensitivity was 0.260 to 0.273, which is similar to the site-level chronologies (Table 2). All three chronologies followed similar patterns of growth from the 1500s to the late 1900s, with the same multi-decadal variation (Figure 3, Figure S1). After a narrow growth ring in 1986, the declining chronology exhibited decreasing growth, which diverged from the other two chronologies (Figure 3, Figure S1).
3.3. Climate and Yellow-Cedar Growth
Among the three periods associated with PDO phases, monthly minimum, average, and maximum temperatures differed significantly. However, monthly total precipitation values were similar (Figure 4). Growth was significantly associated with temperature and precipitation even though these relations varied among chronologies and through time (Figure 5 and Figure 6). Results for minimum temperature are presented, since it had the strongest and most consistent outcomes of the three temperature variables. Results for average and maximum temperature are shown for the three residual chronologies in Figures S2–S4. Statistically significant (α = 0.05) outcomes are summarized below.
Overall, 1946–1976 was the coolest of the three periods and 1977–2015 was the warmest (Figure 4). Consequently, 1946–1976 had more precipitation as snow (mean = 446 ± 149 mm/year modeled in ClimateNA [35]), while 1977–2015 had the least precipitation as snow (mean = 322 ± 110 mm/year). The mean precipitation as snow during the 1901–1945 period was 392 ± 149 mm/year. Values from the three periods are significantly different (p <0.001). The 1977–2015 period was warmer than the two earlier periods during the growing season, with significant monthly increases of 0.65 to 0.76 °C from May through August. Additionally, January, March, and April were warmer on average during the 1977–2015 period than 1946–1976, but not different from 1902–1945. February was warmer on average during 1977–2015 than 1902–1945, but not different from 1946–1976. The greatest warming in average monthly minimum temperature over the three time periods occurred in January and February, with a change of more than 1.3 °C.
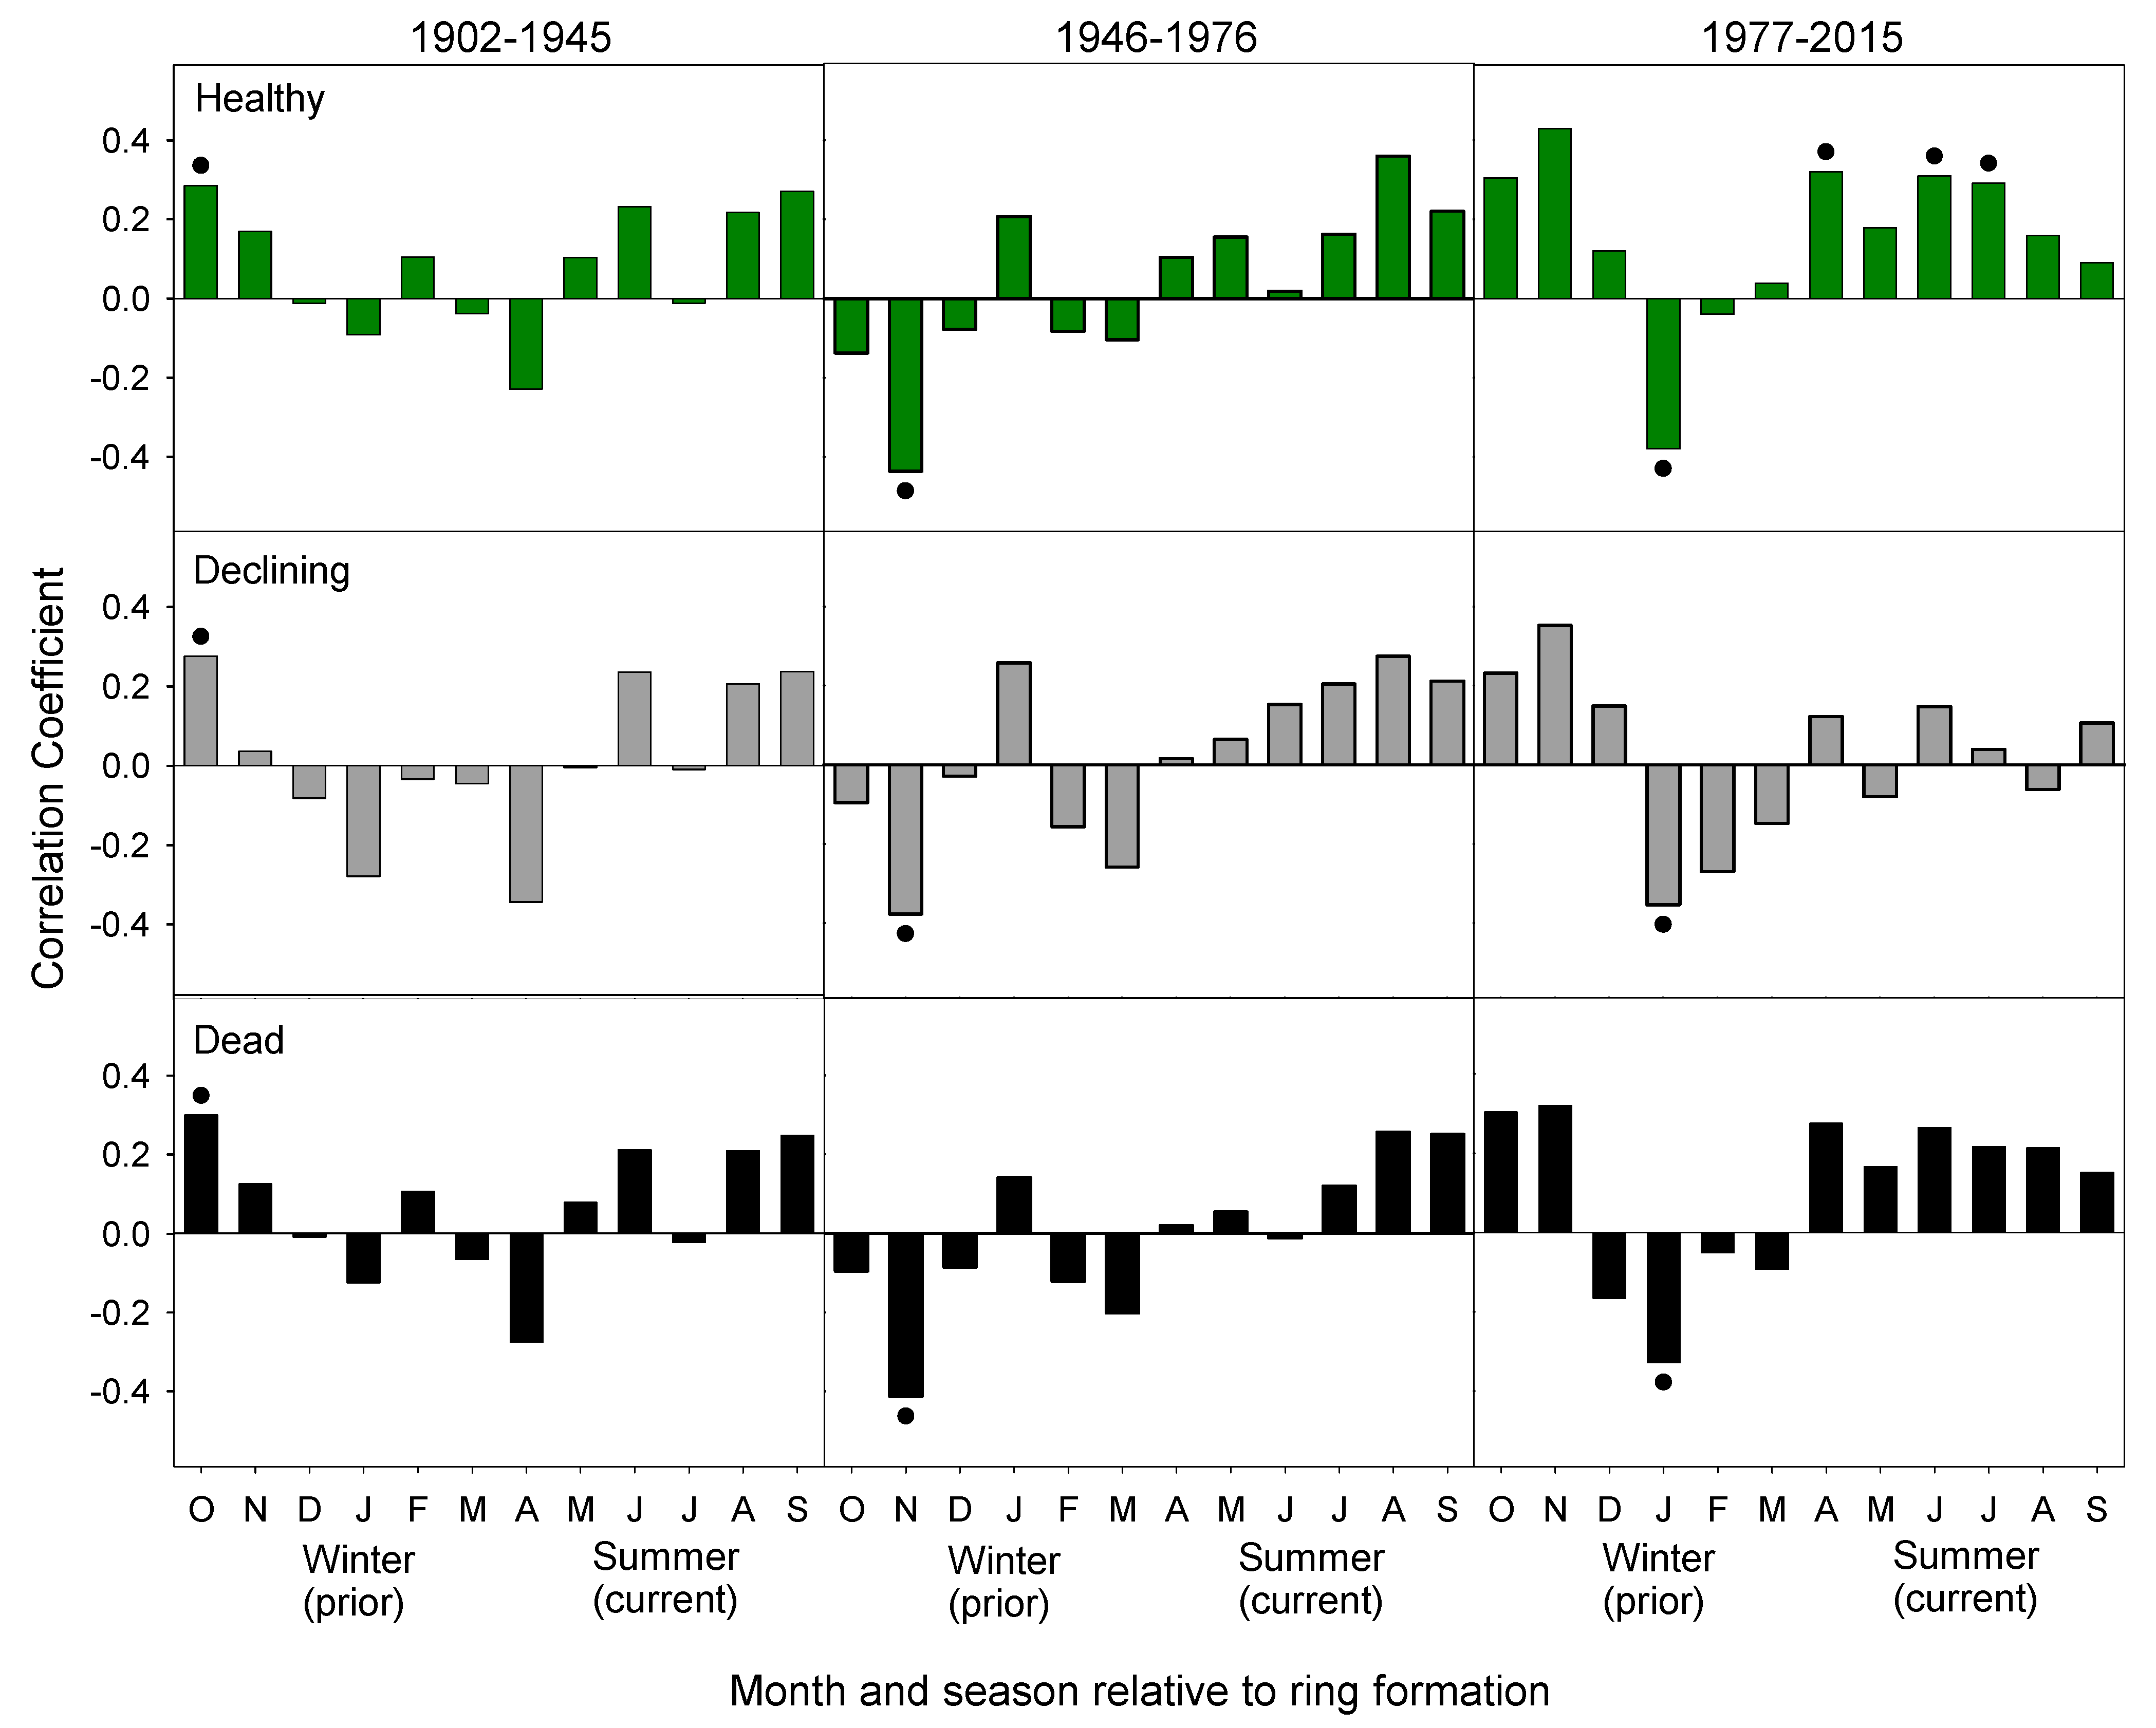
The three chronologies exhibit similar climate-growth responses in the two earlier periods (1902–1945, 1946–1976), which was followed by divergent climate-growth responses in the most recent period (1977–2015, Figure 7). There were fewer significant climate-growth relations in the two earlier periods. In the 1902–1945 period, warm October and dry May were positively associated with growth of trees in all three chronologies (Figure 5 and Figure 7). In the 1946–1976 period, lower May precipitation continued to be positively associated with growth. Additionally, wet and warm November was negatively associated with growth and wet October was positively associated with growth.
There were many more significant relationships in the most recent period from 1977–2015 (Figure 5 and Figure 7). Warm January temperatures became negatively associated with growth for all three chronologies (Figure 7). However, other climate-growth relationships diverged between the three chronologies. Growth of trees in the healthy and dead chronologies was positively associated with spring and summer temperatures. However, this relationship was only significant for the healthy chronology in April, June, and July. Growth of trees in the declining chronology was not associated with spring and summer temperatures. Higher November and December precipitation was positively associated with the growth of trees in the healthy and declining chronologies (Figure 5). Conversely, growth was negatively associated with wet springs for the healthy and dead chronologies, which is significant in April (healthy and dead) and May (healthy).
3.4. Temporal Frequency
Variation in tree growth was concentrated at similar temporal frequencies among the three chronologies. The wavelet analysis highlighted modes of variability in the 8-year to 60-year frequencies, even though they were not stable over time (Figure 5). The cross-wavelet analyses revealed significant relationships from ~1850 to 1950 when all three tree-ring records and the PDO were in-phase at frequencies of 32–64 years. After the mid-20th century, the relationship ended for healthy and dead trees. For declining trees, the relationship weakened but persisted at frequencies of >32 years.
4. Discussion
4.1. Common Growth Signal Present across Sites
Yellow-cedar is one of the longest-lived species in British Columbia. It is important culturally to the Indigenous peoples of the region and an integral part of the ecosystem [45]. On Haida Gwaii, we sampled yellow-cedar trees up to 1004 years old [17] and all 13 site-level chronologies equaled or exceeded 451 years. Over the long term, yellow-cedar exhibited common growth patterns consistent with mesoclimate and regional climate. The 13 site-level chronologies were highly correlated. Marker rings, common across the site-level chronologies on Haida Gwaii, were also shared at a broader regional scale, spanning nine degrees of latitude (50°–59°N) from southern Alaska to Vancouver Island [15]. This included 17 years with common negative marker rings between one to 11 sites on Haida Gwaii and one to three other yellow-cedar studies [15]. The three years with the greatest number of sites with negative marker rings on Haida Gwaii that corresponded to other studies (1986, 1936, and 1926) had common negative marker rings with the declining chronologies (declining site from References [46] and [15]), but not with the healthy stands (from Reference [44,47], and healthy site from Reference [46]). Suggesting that climate conditions had anomalous impacts on trees at declining sites during these three years.
4.2. Separating Trees by Health Status
We tested the hypothesis that climate is the driving mechanism behind yellow-cedar decline on Haida Gwaii. If this is the case, we would expect trees of a different health status to have responded differently to climate variables over time. We stratified all trees by health-class and grouped them into ‘healthy,’ ‘declining,’ and ‘dead’ chronologies to shed light on the drivers of decline. This strategy has been applied successfully across a diversity of species, including broad-leaved deciduous Nothofagus pumilio (Poepp. & Endl.) Krasser [48] and coniferous Austrocedrus chilensis (D. Don) Pic. Serm. & Bizzarri [19] in Patagonia, which both exhibited multiple growth patterns based on whether trees were affected by decline. Two other examples are Pinus species in the northern hemisphere, in which the climate interacted with biotic disturbances. Pinus albicaulis Engelm. trees in the Rocky Mountains exhibited different growth patterns based on whether they were healthy or affected by the mountain pine beetle, Ips species, and/or white pine blister rust [49]. Similarly, Pinus mugo Turra in the Swiss Alps exhibited different growth patterns when affected by two different pathogens [18]. Combining all trees within a stand can mask the multiple growth patterns that can exist based on the health status of trees. Separating trees by health status can uncover divergent growth patterns of trees affected by pathogens, disease, or decline [18].
To classify the health status of trees, we used a two-pass system, assessing crown dieback (external symptoms of decline) and radial growth decline (internal symptoms), to be as robust as possible. Tree-ring analysis revealed that more than half of trees with external crown symptoms, had internal tree-ring symptoms of decline, including narrow suppressed outer rings and cessation of ring formation [17]. Additionally, a proportion of trees with no crown symptoms had tree-ring symptoms. This suggests that radial growth decline can develop before external symptoms become apparent. In many gymnosperm species, decreasing growth is a common indicator of decline and often precedes mortality [18]. Yellow-cedars exhibited periods of suppression through their lifespan, including many rings that were locally absent or discontinuous, which is common in extremely slow growing trees in harsh environments [50]. However, yellow-cedars affected by decline entered decreasing growth, which exhibited extremely narrow and suppressed rings, and did not recover, or stopped forming rings all together. Furthermore, species in the Cupressaceae family are known to exhibit partial cambial mortality, documented in Thuja plicata [51], Austrocedrus chilensis [52], and yellow-cedar [15,53]. Cessation of ring formation was common in yellow-cedars with crown symptoms of decline (56%), and it appeared in an additional 9% of yellow-cedars lacking crown symptoms [17]. This can also be used as an early warning signal of tree decline.
4.3. Divergent Growth of Trees of Different Health Classes
The divergence of growth among trees of different health status is a recent phenomenon, which emerged after a strong negative marker year in 1986. All three chronologies had similar patterns from the early 1500s to 1900s, responding to climate in the same way, with multi-decadal variability and common narrow marker years. This includes very narrow growth in 1986, after which growth of trees in the declining chronology decreased sharply and the mortality rate of trees also increased [17]. Declining trees survived to 2016 with decreased growth rates. However, trees that died after 1986 did not exhibit a slower growth rate and had weaker associations with climate prior to death. Beier et al. [46] found that 1986 was the fourth highest year of high thaw-freeze magnitude and impact in south-eastern Alaska from 1950 to 2004. Although the top three years did not correspond with marker rings, this could be due to the differences in the weather systems between Alaska and Haida Gwaii; a better understanding of the timing and extent of these weather events is needed. The 1986 marker ring on Haida Gwaii is consistent with the Alaska hypothesis, which outlines that thaw-freeze events during years of low snowpack lead to fine root damage, moisture stress, and tree dieback and death [10].
4.4. Climatic Drivers of Yellow-Cedar Decline
Regional warming due to climate change, enhanced by multi-decadal variation resulting from the PDO, is the most likely driver of yellow-cedar decline on Haida Gwaii. Increases in decline and mortality of yellow-cedar beginning in the late 20th century coincide with the greatest increases in temperature [21]. The wavelet analysis revealed evidence of multi-decadal periodicity in the 30–60 range for all three chronologies, even though much of it was not significant and it was not stable over time. The signal was most stable in the middle of the 20th century. This suggests that the trees have responded to multi-decadal climatic regimes. Regionally, the most important is the ocean-atmospheric climate regime known as the PDO [22]. The cross-wavelet analysis highlighted synchrony between the tree-ring records and the PDO from the mid-19th to the mid-20th century. However, this relationship breaks down for the healthy and dead chronologies and weakens for the declining chronology during the second half of the 20th century. The PDO operated at the ~30-year scale over the 20th century and played a significant role in the regional climate of Haida Gwaii. Climatic shifts related to the PDO have been shown to influence the growth and limiting factors of conifer species in northwestern North America [20,49]. Additionally, the 1976/1977 shift in PDO corresponded with a notable shift in temperature sensitivity to maximum growing season temperature of healthy stands of yellow-cedar in southeast Alaska [23]. The most dramatic warming has occurred after this switch in the PDO to a positive (warm) phase in 1976/1977. On Haida Gwaii, the rates of both mortality and the onset of decline of yellow-cedars have increased since then [17]. Given this evidence and the ~30-year periodicity observed in yellow-cedar growth on Haida Gwaii, we analysed climate-growth relations over three time-periods divided based on the major switches in the PDO. Importantly, we detected a change in climate-growth responses around the 1976/1977 switch in the PDO.
From 1902–1945, all chronologies responded to the climate in a similar way. Longer growing seasons facilitated increased growth, shown by a positive relationship with warm October and dry May. This is consistent with observations from many other high latitude forests, which are typically thought to be temperature limited [54]. Many tree species have exhibited increasing growth over the 20th century in response to warmer and longer growing seasons, with earlier snowmelt and warmer fall temperatures [55,56,57].
Similarly, in the 1946–1976 period, which was cooler overall, there was a positive relationship between growing season temperatures and growth of all chronologies, though it was not significant. This relationship was significant during the most recent period (1977–2015), which was the warmest of the three periods, with warmer growing season temperatures facilitating growth of trees in the healthy chronology. This follows the trend of many northern plant species that have experienced increased growth rates since the 1980s [58] in response to warming temperatures. Additionally, many high latitude and high elevation tree species include subpopulations, which have responded positively to warmer growing season temperatures over the late 20th century [7,57,59]. One striking example of this is the increased growth rate of Pinus longaeva D.K. Bailey in upper elevations near the treeline in response to warming temperatures, with trees exhibiting greater ring growth during the second half of the 20th century than any 50-year period over the past 3700 years [60].
Conversely, trees in the declining chronology have not responded positively to increasing growing season temperatures. This parallels trends of species across the north, where a subpopulation of trees exhibited a weakened or negative response to warming growing season temperatures [7,55,61,62,63]. In most species, this is due to moisture limitation or heat stress in association with warmer growing season temperatures [7,64]. However, yellow-cedars at our study sites were not water-limited in any of the three time periods, and did not benefit from increased precipitation in the spring or summer. Moreover, growth was limited by high May precipitation from 1902–1976 and high March/April precipitation from 1977–2015. This is not surprising since all stands were located on wetter sites and were not moisture limited. Therefore, increased spring precipitation would not be beneficial. Instead, the limiting factors of yellow-cedar on Haida Gwaii are unique. Growth was negatively associated with low winter precipitation, which is consistent with the root-freezing hypothesis from Alaska.
4.5. Consistent with Alaska Hypothesis
Rather than direct drought limitation due to warmer or drier growing seasons, yellow-cedars are limited by physiological drought stemming from damaged roots. When yellow-cedar’s shallow fine roots are not protected by an insulating snowpack, thaw-freeze cycles can cause damage to fine roots [13,65]. This leads to moisture stress during the growing season, and eventual dieback and death of the tree [10]. Following this hypothesis, winter conditions are more biologically relevant than growing season conditions. Buma identified the mean temperature of the coldest month as being particularly relevant, with mortality of yellow-cedar centered around the −5 °C to 0 °C coldest month temperature band [66]. Warmer winter conditions lead to more precipitation as rain than as snow [8], earlier melting of snowpack [67], and more frequent thaw-freeze cycles [46]. Low winter precipitation leads to less snow and, therefore, less snowpack.
The limiting factors to yellow-cedar growth on Haida Gwaii during the two most recent periods are consistent with the root-freezing hypothesis. In Alaska, growth of yellow-cedars at declining sites was limited by warm and dry winter conditions [42,46]. Similarly, growth on Haida Gwaii was limited by warm dry Novembers as early as 1946–1976 and mortality rates began increasing in the 1960s [17]. After 1977, significant relationships shifted to later in the winter, with growth limited by warm January and dry November and December. At the same time, the correlations between the chronology derived from dead trees and precipitation were not significant, which suggests a decoupling of the climate-growth relationships prior to tree death.
The wavelet analysis highlighted evidence that yellow-cedars in declining stands on Haida Gwaii are responding to a PDO-length signal. However, the decline does not appear to be driven primarily by the PDO. The latter two periods analyzed had similar climate-growth relations, spanning both the negative and positive phases of the PDO. Instead, the likely primary driver of decline is climate warming over the 20th century. Support for the root-freezing hypothesis is evident in the second half of the 20th century, which becomes apparent in the middle period and stronger in the most recent period instead of the two periods that correspond to the positive phases of the PDO. Evidence of yellow-cedar decline from decreasing radial growth and increased mortality begins during the negative phase of the PDO, in the 1940s and 1960s, respectively [17]. Following the 1976/1977 switch to a positive PDO phase, yellow-cedar decline was exacerbated, as both onset of decline and mortality rates increased after this time [17]. We suggest that decline was driven by increasing temperatures over the 20th century, and intensified after the switch to a positive PDO phase in the late 1970s.
Given multiple lines of corroborating evidence, it is clear that winter climatic conditions drive yellow-cedar decline on Haida Gwaii, which is consistent with the proposed mechanism of Hennon et al. [10]. While snowpack largely modulates temperature effects on the mainland, Haida Gwaii is distinct since snow is more ephemeral. Additionally, given the milder climate on Haida Gwaii, fine roots are likely active throughout the winter and, therefore, are continuously exposed to freezing damage. As winter temperatures have increased, confounded by the PDO and climate change, yellow-cedar’s fine roots are exposed to varying degrees of freezing damage over time. These periodic thaw-freeze events may cause damage that accumulates over time, in addition to more acute events. The effects are especially severe on sites with wet soils and open canopy conditions, where roots are more shallowly rooted and the soil is exposed to greater temperature extremes [12,14]. This climate-induced decline is complex and somewhat counterintuitive. Ultimately, warming winter temperatures increase susceptibility to freezing damage of yellow-cedar’s fine roots, which leads to drought-induced dieback and death, concentrated on wet sites in the coastal temperate rainforests of Haida Gwaii.
5. Conclusions
Multiple lines of evidence corroborate the hypothesis that freezing damage to roots during years of warm winter temperatures and low winter precipitation have driven yellow-cedar decline on Haida Gwaii. This decline is driven by climate change, exacerbated by the PDO rather than being associated with the positive phases of the PDO. Identifying this mechanism of decline allows for greater understanding of which stands may be at risk, though tree-level factors that protect trees from decline or predispose trees to decline remain unknown. Ultimately, warming winter temperatures, accelerated by anthropogenic climate change, have led to dieback and death of yellow-cedars on wet sites, even with the temperate ocean-moderated climate of the Haida Gwaii archipelago.
Supplementary Materials
The following are available online at https://www.mdpi.com/1999-4907/10/12/1085/s1. Table S1: Summary of sample size for site-level and regional chronologies, and the reasons for which trees were removed from the regional chronologies. Table S2: Characteristics of the site-level ring width chronologies. Mean series intercorrelation and sensitivity are for the full length of the chronology. Figure S1: Ring width index of standard chronologies for healthy (green), declining (grey). and dead (black) trees, from 1524 to 2015, beginning when all three chronologies had ≥10 samples (n = 99, 64, and 57 for the healthy, declining, and dead chronologies, respectively). Figure S2: Correlation between monthly average precipitation, monthly mean temperature, monthly maximum temperature, monthly minimum temperature, and the residual chronology for the ‘healthy’ group, over the time periods 1902–1945 (left), 1946–1976 (middle), and 1977–2015 (right). Bars are the correlation coefficients. A dot indicates significance (α = 0.05). Figure S3: Correlation between monthly average precipitation, monthly mean temperature, monthly maximum temperature, monthly minimum temperature, and the residual chronology for the ‘declining’ group, over the time periods 1902–1945 (left), 1946–1976 (middle), and 1977–2015 (right). Bars are the correlation coefficients. A dot indicates significance (α = 0.05) in Figure S4. Correlation between monthly average precipitation, monthly mean temperature, monthly maximum temperature, monthly minimum temperature, and the residual chronology for the ‘dead’ group, over the time periods 1902-1945 (left), 1946–1976 (middle), and 1977–2015 (right). Bars are the correlation coefficients. A dot indicates significance (α = 0.05).
Author Contributions
L.D.D., V.M.C., G.K., and S.Z. conceptualized the research, developed, and implemented the field methods. V.M.C., R.D.C., G.K., and L.D.D. selected and tested the software for analyses and visualization of results. V.M.C. conducted formal analyses and wrote the original and final drafts. L.D.D. and S.Z. reviewed and edited the drafts. L.D.D. was responsible for supervision, project administration, funding acquisition, and data curation.
Funding
A Natural Sciences and Engineering Research Council (NSERC) Engage Grant sponsored by Taan Forest Ltd. (NSERC EGP 492488-15), NSERC Discovery Grant to L.D.D. (RPIN-2014-06387), Grant in Aid of Research from the British Columbia Ministry of Forests, Lands, Natural Resource Operations and Rural Development, and scholarships to V.M.C. from the Faculty of Forestry, NSERC, Peter Rennie Memorial, and VanDusen Graduate Fellowship funded this research.
Acknowledgments
We would like to acknowledge our collaborators N. Reynolds and the research team at the Council of the Haida Nation. Thank you also to research assistants S. Bronson, J. Coutu, D. Fluharty, J. Heredia, D. Hornsberger, I. Jarvis, J. Liu, and A. Weixelman.
Conflicts of Interest
V.M.C., L.D.D., R.C.D., and G.K. declare no conflict of interest. S.Z., Coast Area Forest Pathologist with the British Columbia government, provided funding for field work and served on the supervisory committee of V.M.C., contributed to conceptualization, implementation of the field methods, and reviewed and edited the manuscript. Other funders had no role in the design of the study, in the collection, analyses, or interpretation of data, in the writing of the manuscript, or in the decision to publish the results.
References
- Allen, C.D.; Macalady, A.K.; Chenchouni, H.; Bachelet, D.; McDowell, N.; Vennetier, M.; Kitzberger, T.; Rigling, A.; Breshears, D.D.; Hogg, E.H. (Ted); et al. A global overview of drought and heat-induced tree mortality reveals emerging climate change risks for forests. For. Ecol. Manag. 2010, 259, 660–684. [Google Scholar] [CrossRef]
- Peng, C.; Ma, Z.; Lei, X.; Zhu, Q.; Chen, H.; Wang, W.; Liu, S.; Li, W.; Fang, X.; Zhou, X. A drought-induced pervasive increase in tree mortality across Canada’s boreal forests. Nat. Clim. Chang. 2011, 1, 467–471. [Google Scholar] [CrossRef]
- Anderegg, W.R.L.; Kane, J.M.; Anderegg, L.D.L. Consequences of widespread tree mortality triggered by drought and temperature stress. Nat. Clim. Chang. 2013, 3, 30–36. [Google Scholar] [CrossRef]
- Sánchez-Salguero, R.; Navarro-Cerrillo, R.M.; Camarero, J.J.; Fernández-Cancio, Á. Selective drought-induced decline of pine species in southeastern Spain. Clim. Chang. 2012, 113, 767–785. [Google Scholar] [CrossRef]
- Meddens, A.J.H.; Hicke, J.A.; Macalady, A.K.; Buotte, P.C.; Cowles, T.R.; Allen, C.D. Patterns and causes of observed piñon pine mortality in the southwestern United States. New Phytol. 2015, 206, 91–97. [Google Scholar] [CrossRef]
- Michaelian, M.; Hogg, E.H.; Hall, R.J.; Arsenault, E. Massive mortality of aspen following severe drought along the southern edge of the Canadian boreal forest. Glob. Chang. Biol. 2011, 17, 2084–2094. [Google Scholar] [CrossRef]
- Lloyd, A.H.; Bunn, A.G. Responses of the circumpolar boreal forest to 20th century climate variability. Environ. Res. Lett. 2007, 2, 045013. [Google Scholar] [CrossRef]
- Buma, B.; Hennon, P.E.; Harrington, C.A.; Popkin, J.R.; Krapek, J.; Lamb, M.S.; Oakes, L.E.; Saunders, S.; Zeglen, S. Emerging climate-driven disturbance processes: Widespread mortality associated with snow-to-rain transitions across 10° of latitude and half the range of a climate-threatened conifer. Glob. Chang. Biol. 2016, 23, 2903–2914. [Google Scholar] [CrossRef]
- Susiluoto, S.; Berninger, F. Interactions between morphological and physiological drought responses in Eucalyptus microtheca. Silva Fenn. 2007, 41, 221. [Google Scholar] [CrossRef]
- Hennon, P.E.; D’Amore, D.V.; Schaberg, P.G.; Wittwer, D.T.; Shanley, C.S. Shifting climate, altered niche, and a dynamic conservation strategy for yellow-cedar in the north Pacific coastal rainforest. BioScience 2012, 62, 147–158. [Google Scholar] [CrossRef]
- Hennon, P.; Amore, D.D.; Johnson, A.; Schaberg, P.G.; Hawley, G.; Beier, C.; Sink, S.; Juday, G. Climate warming, reduced snow, and freezing injury could explain the demise of yellow-cedar in southeast Alaska, USA. World Resour. Rev. 2006, 18, 24. [Google Scholar]
- Hennon, P.E.; D’Amore, D.V.; Witter, D.T.; Lamb, M.B. Influence of forest canopy and snow on microclimate in a declining yellow-dedar forest of southeast Alaska. Northwest Sci. 2010, 84, 73–87. [Google Scholar] [CrossRef]
- Schaberg, P.G.; Hennon, P.E.; D’Amore, D.V.; Hawley, G.J. Influence of simulated snow cover on the cold tolerance and freezing injury of yellow-cedar seedlings. Glob. Chang. Biol. 2008, 14, 1282–1293. [Google Scholar] [CrossRef]
- D’Amore, D.V.; Hennon, P.E. Evaluation of soil saturation, soil chemistry, and early spring soil and air temperatures as risk factors in yellow-cedar decline. Glob. Chang. Biol. 2006, 12, 524–545. [Google Scholar] [CrossRef]
- Stan, A.B.; Maertens, T.B.; Daniels, L.D.; Zeglen, S. Reconstructing population dynamics of yellow-cedar in declining stands: Baseline information from tree rings. Tree-Ring Res. 2011, 67, 13–25. [Google Scholar] [CrossRef]
- Banner, A.; MacKenzie, W.H.; Pojar, J.; MacKinnon, A.; Saunders, S.C.; Klassen, H. A Field Guide to Ecosystem Classification and Identification for Haida Gwaii; Land management handbook; Province of British Columbia, Ministry of Forests: Victoria, BC, Canada, 2014; ISBN 978-0-7726-6768-7.
- Comeau, V. Freezing to Death in a Warming Climate: Drivers of Yellow-Cedar Decline on Haida Gwaii; University of British Columbia: Vancouver, BC, Canada, 2019. [Google Scholar]
- Cailleret, M.; Jansen, S.; Robert, E.M.R.; Desoto, L.; Aakala, T.; Antos, J.A.; Beikircher, B.; Bigler, C.; Bugmann, H.; Caccianiga, M.; et al. A synthesis of radial growth patterns preceding tree mortality. Glob. Chang. Biol. 2017, 23, 1675–1690. [Google Scholar] [CrossRef] [PubMed]
- Amoroso, M.M.; Daniels, L.D.; Larson, B.C. Temporal patterns of radial growth in declining Austrocedrus chilensis forests in Northern Patagonia: The use of tree-rings as an indicator of forest decline. For. Ecol. Manag. 2012, 265, 62–70. [Google Scholar] [CrossRef]
- Chavardès, R.D.; Daniels, L.D.; Waeber, P.O.; Innes, J.L.; Nitschke, C.R. Unstable climate−growth relations for white spruce in southwest Yukon, Canada. Clim. Chang. 2012, 116, 593–611. [Google Scholar] [CrossRef]
- IPCC. Climate Change 2014: Synthesis Report. Contribution of Working Groups I, II and III to the Fifth Assessment Report of the Intergovernmental Panel on Climate Change; IPCC: Geneva, Switzerland, 2014; p. 151. [Google Scholar]
- Mantua, N.J.; Hare, S.R. The Pacific Decadal Oscillation. J. Oceanogr. 2002, 58, 35–44. [Google Scholar] [CrossRef]
- Wiles, G.C.; Charlton, J.; Wilson, R.J.S.; D’Arrigo, R.; Buma, B.; Krapek, J.; Gaglioti, B.V.; Wiesenberg, N.; Oelkers, R. Yellow-Cedar Blue Intensity Tree Ring Chronologies as Records of Climate, Juneau, Alaska, USA. Can. J. For. Res. 2019, 49, 1483–1492. [Google Scholar] [CrossRef]
- Larsson, L. CooRecorder; Cybis Elektronik & Data: Saltsjöbaden, Sweden, 2014. [Google Scholar]
- Larsson, L. CDendro; Cybis Elektronik & Data: Saltsjöbaden, Sweden, 2014. [Google Scholar]
- Holmes, R.L. Computer-assisted quality control in tree-ring dating and measurement. Tree-Ring Bull. 1983, 43, 69–78. [Google Scholar]
- Bunn, A.G. A dendrochronology program library in R (dplR). Dendrochronologia 2008, 26, 115–124. [Google Scholar] [CrossRef]
- Bunn, A.G. Statistical and visual crossdating in R using the dplR library. Dendrochronologia 2010, 28, 251–258. [Google Scholar] [CrossRef]
- Bunn, A.G.; Biondo, F.; Campelo, F.; Mérian, P.; Qeadan, F.; Zang, C. dplR: Dendrochronology Program Library in R. 2017. Available online: https://rdrr.io/cran/dplR/ (accessed on 1 November 2017).
- R Core Team. R: A Language and Environment for Statistical Computing; R Foundation for Statistical Computing: Vienna, Austria, 2014. [Google Scholar]
- Melvin, T.M.; Briffa, K.R. CRUST: Software for the implementation of Regional Chronology Standardisation: Part 1. Signal-Free RCS. Dendrochronologia 2014, 32, 7–20. [Google Scholar] [CrossRef]
- Melvin, T.M.; Briffa, K.R. A “signal-free” approach to dendroclimatic standardisation. Dendrochronologia 2008, 26, 71–86. [Google Scholar] [CrossRef]
- Fritts, H.C. Tree Rings and Climate; Academic Press: London, UK, 1976. [Google Scholar]
- Wigley, T.M.; Briffa, K.R.; Jones, P.D. On the average value of correlated time series, with applications in dendroclimatology and hydrometeorology. J. Clim. Appl. Meteorol. 1984, 23, 201–213. [Google Scholar] [CrossRef]
- Wang, T.; Hamann, A.; Spittlehouse, D.; Carroll, C. Locally downscaled and spatially customizable climate data for historical and future periods for North America. PLoS ONE 2016, 11, e0156720. [Google Scholar] [CrossRef]
- Blasing, T.J.; Solomon, A.M.; Duvick, D.N. Response functions revisited. Tree-Ring Bull. 1984, 1–15. [Google Scholar]
- Zang, C.; Biondi, F. treeclim: An R package for the numerical calibration of proxy-climate relationships. Ecography 2015, 38, 431–436. [Google Scholar] [CrossRef]
- Torrence, C.; Compo, G.P. A practical guide to wavelet analysis. Bull. Am. Meteorol. Soc. 1998, 79, 61–78. [Google Scholar] [CrossRef]
- Roesch, A.; Schmidbauer, H. WaveletComp: Computational Wavelet Analysis. 2018. Available online: https://rdrr.io/cran/WaveletComp/man/WaveletComp-package.html (accessed on 1 November 2018).
- National Centers for Environmental Information Pacific Decadal Oscillation (PDO); National Oceanic and Atmospheric Administration: Washington, DC, USA, 2019.
- Stokes, M.A.; Smiley, T.L. An Introduction to Tree-Ring Dating; University of Chicago Press: Chicago, IL, USA, 1996. [Google Scholar]
- Wiles, G.C.; Mennett, C.R.; Jarvis, S.K.; D’Arrigo, R.D.; Wiesenberg, N.; Lawson, D.E. Tree-ring investigations into changing climatic responses of yellow-cedar, Glacier Bay, Alaska. Can. J. For. Res. 2012, 42, 814–819. [Google Scholar] [CrossRef]
- Kellner, A.M.E.; Laloque, C.P.; Smith, D.J.; Harestadl, A.S. Chronological dating of high-elevation dead and dying trees on Northern Vancouver Island, British Columbia. Northwest Sci. 2000, 74, 242–247. [Google Scholar]
- Laroque, C.P.; Smith, D.J. Tree-ring analysis of yellow-cedar (Chamaecyparis nootkatensis) on Vancouver Island, British Columbia. Can. J. For. Res. 1999, 29, 115–123. [Google Scholar] [CrossRef]
- Hennon, P.E.; McKenzie, C.M.; D’Amore, D.V.; Wittwer, D.T.; Mulvey, R.L.; Lamb, M.S.; Biles, F.E.; Cronn, R.C. A Climate Adaptation Strategy for Conservation and Management of Yellow-Cedar in Alaska; U.S. Department of Agriculture, Forest Service, Pacific Northwest Research Station: Portland, OR, USA, 2016; p. 382.
- Beier, C.M.; Sink, S.E.; Hennon, P.E.; D’Amore, D.V.; Juday, G.P. Twentieth-century warming and the dendroclimatology of declining yellow-cedar forests in southeastern Alaska. Can. J. For. Res. 2008, 38, 1319–1334. [Google Scholar] [CrossRef]
- Parish, R. Mount Cain, Alaska Yellow-Cedar Tree-Ring Record (CANA175); NOAA/NGDC Paleoclimatology: Boulder, CO, USA, 2005. [Google Scholar]
- Rodríguez-Catón, M.; Villalba, R.; Srur, A.M.; Luckman, B. Long-term trends in radial growth associated with Nothofagus pumilio forest decline in Patagonia: Integrating local- into regional-scale patterns. For. Ecol. Manag. 2015, 339, 44–56. [Google Scholar] [CrossRef]
- Wong, C.M.; Daniels, L.D. Novel forest decline triggered by multiple interactions among climate, an introduced pathogen and bark beetles. Glob. Chang. Biol. 2017, 23, 1926–1941. [Google Scholar] [CrossRef] [Green Version]
- Kelly, P.E.; Cook, E.R.; Larson, D.W. Constrained growth, cambial mortality, and dendrochronology of ancient Thuja occidentalis on cliffs of the Niagara Escarpment: An eastern version of bristlecone pine? Int. J. Plant Sci. 1992, 153, 117–127. [Google Scholar] [CrossRef]
- Daniels, L.D.; Dobry, J.; Klinka, K.; Feller, M.C. Determining year of death of logs and snags of Thuja plicata in southwestern coastal British Columbia. Can. J. For. Res. 1997, 27, 1132–1141. [Google Scholar] [CrossRef]
- Amoroso, M.M.; Daniels, L.D. Cambial mortality in declining Austrocedrus chilensis forests: Implications for stand dynamics studies. Can. J. For. Res. 2010, 40, 885–893. [Google Scholar] [CrossRef]
- Hennon, P.E.; Shaw, C.G.; Hansen, E.M. Symptoms and fungal associations of declining Chamaecyparis nootkatensis in southeast Alaska. Plant Dis. 1990, 74, 267–273. [Google Scholar] [CrossRef]
- Nemani, R.R.; Keeling, C.D.; Hashimoto, H.; Jolly, W.M.; Piper, S.C.; Tucker, C.J.; Myneni, R.B.; Running, S.W. Climate-driven increases in global terrestrial net primary production from 1982 to 1999. Science 2003, 300, 1560–1563. [Google Scholar] [CrossRef] [Green Version]
- Wilmking, M.; Juday, G.P. Longitudinal variation of radial growth at Alaska’s northern treeline—recent changes and possible scenarios for the 21st century. Glob. Planet. Chang. 2005, 47, 282–300. [Google Scholar] [CrossRef]
- Driscoll, W.W.; Wiles, G.C.; D’Arrigo, R.D.; Wilmking, M. Divergent tree growth response to recent climatic warming, Lake Clark National Park and Preserve, Alaska. Geophys. Res. Lett. 2005, 32, L20703. [Google Scholar] [CrossRef] [Green Version]
- Lloyd, A.H.; Bunn, A.G.; Berner, L. A latitudinal gradient in tree growth response to climate warming in the Siberian taiga. Glob. Chang. Biol. 2011, 17, 1935–1945. [Google Scholar] [CrossRef]
- Myneni, R.B.; Keeling, C.D.; Tucker, C.J.; Asrar, G.; Nemani, R.R. Increased plant growth in the northern high latitudes from 1981 to 1991. Nature 1997, 386, 698–702. [Google Scholar] [CrossRef]
- Wang, X.; Zhang, M.; Ji, Y.; Li, Z.; Li, M.; Zhang, Y. Temperature signals in tree-ring width and divergent growth of Korean pine response to recent climate warming in northeast Asia. Trees 2017, 31, 415–427. [Google Scholar] [CrossRef]
- Salzer, M.W.; Hughes, M.K.; Bunn, A.G.; Kipfmueller, K.F. Recent unprecedented tree-ring growth in bristlecone pine at the highest elevations and possible causes. Proc. Natl. Acad. Sci. USA 2009, 106, 20348–20353. [Google Scholar] [CrossRef] [Green Version]
- D’Arrigo, R.D.; Kaufmann, R.K.; Davi, N.; Jacoby, G.C.; Laskowski, C.; Myneni, R.B.; Cherubini, P. Thresholds for warming-induced growth decline at elevational tree line in the Yukon Territory, Canada. Glob. Biogeochem. Cycles 2004, 18. [Google Scholar] [CrossRef]
- D’Arrigo, R.; Wilson, R.; Liepert, B.; Cherubini, P. On the ‘Divergence Problem’ in Northern Forests: A review of the tree-ring evidence and possible causes. Glob. Planet. Chang. 2008, 60, 289–305. [Google Scholar] [CrossRef]
- Schneider, L.; Esper, J.; Timonen, M.; Büntgen, U. Detection and evaluation of an early divergence problem in northern Fennoscandian tree-ring data. Oikos 2014, 123, 559–566. [Google Scholar] [CrossRef]
- Wilmking, M.; Juday, G.P.; Barber, V.A.; Zald, H.S.J. Recent climate warming forces contrasting growth responses of white spruce at treeline in Alaska through temperature thresholds. Glob. Chang. Biol. 2004, 10, 1724–1736. [Google Scholar] [CrossRef]
- Schaberg, P.G.; D’Amore, D.V.; Hennon, P.E.; Halman, J.M.; Hawley, G.J. Do limited cold tolerance and shallow depth of roots contribute to yellow-cedar decline? For. Ecol. Manag. 2011, 262, 2142–2150. [Google Scholar] [CrossRef]
- Buma, B. Transitional climate mortality: Slower warming may result in increased climate-induced mortality in some systems. Ecosphere 2018, 9, 1–16. [Google Scholar] [CrossRef]
- Stewart, I.T.; Cayan, D.R.; Dettinger, M.D. Changes in snowmelt runoff timing in western North America under a ‘business as usual’ climate change scenario. Clim. Chang. 2004, 62, 217–232. [Google Scholar] [CrossRef]
Figure 1.
Location of 13 sites exhibiting yellow-cedar decline on Graham Island, Haida Gwaii.

Figure 2.
Summary of negative and positive marker years (i.e., years when >75% of ring-width series showed an increase/decrease of >10% radial growth compared to the previous year) at the 13 sites from 1798 to 2015 (top) beginning when sample depth reached 10 to the year of sampling. Sample depth over time defined by the number of sites with 10 or more samples contribute to the chronology (bottom).
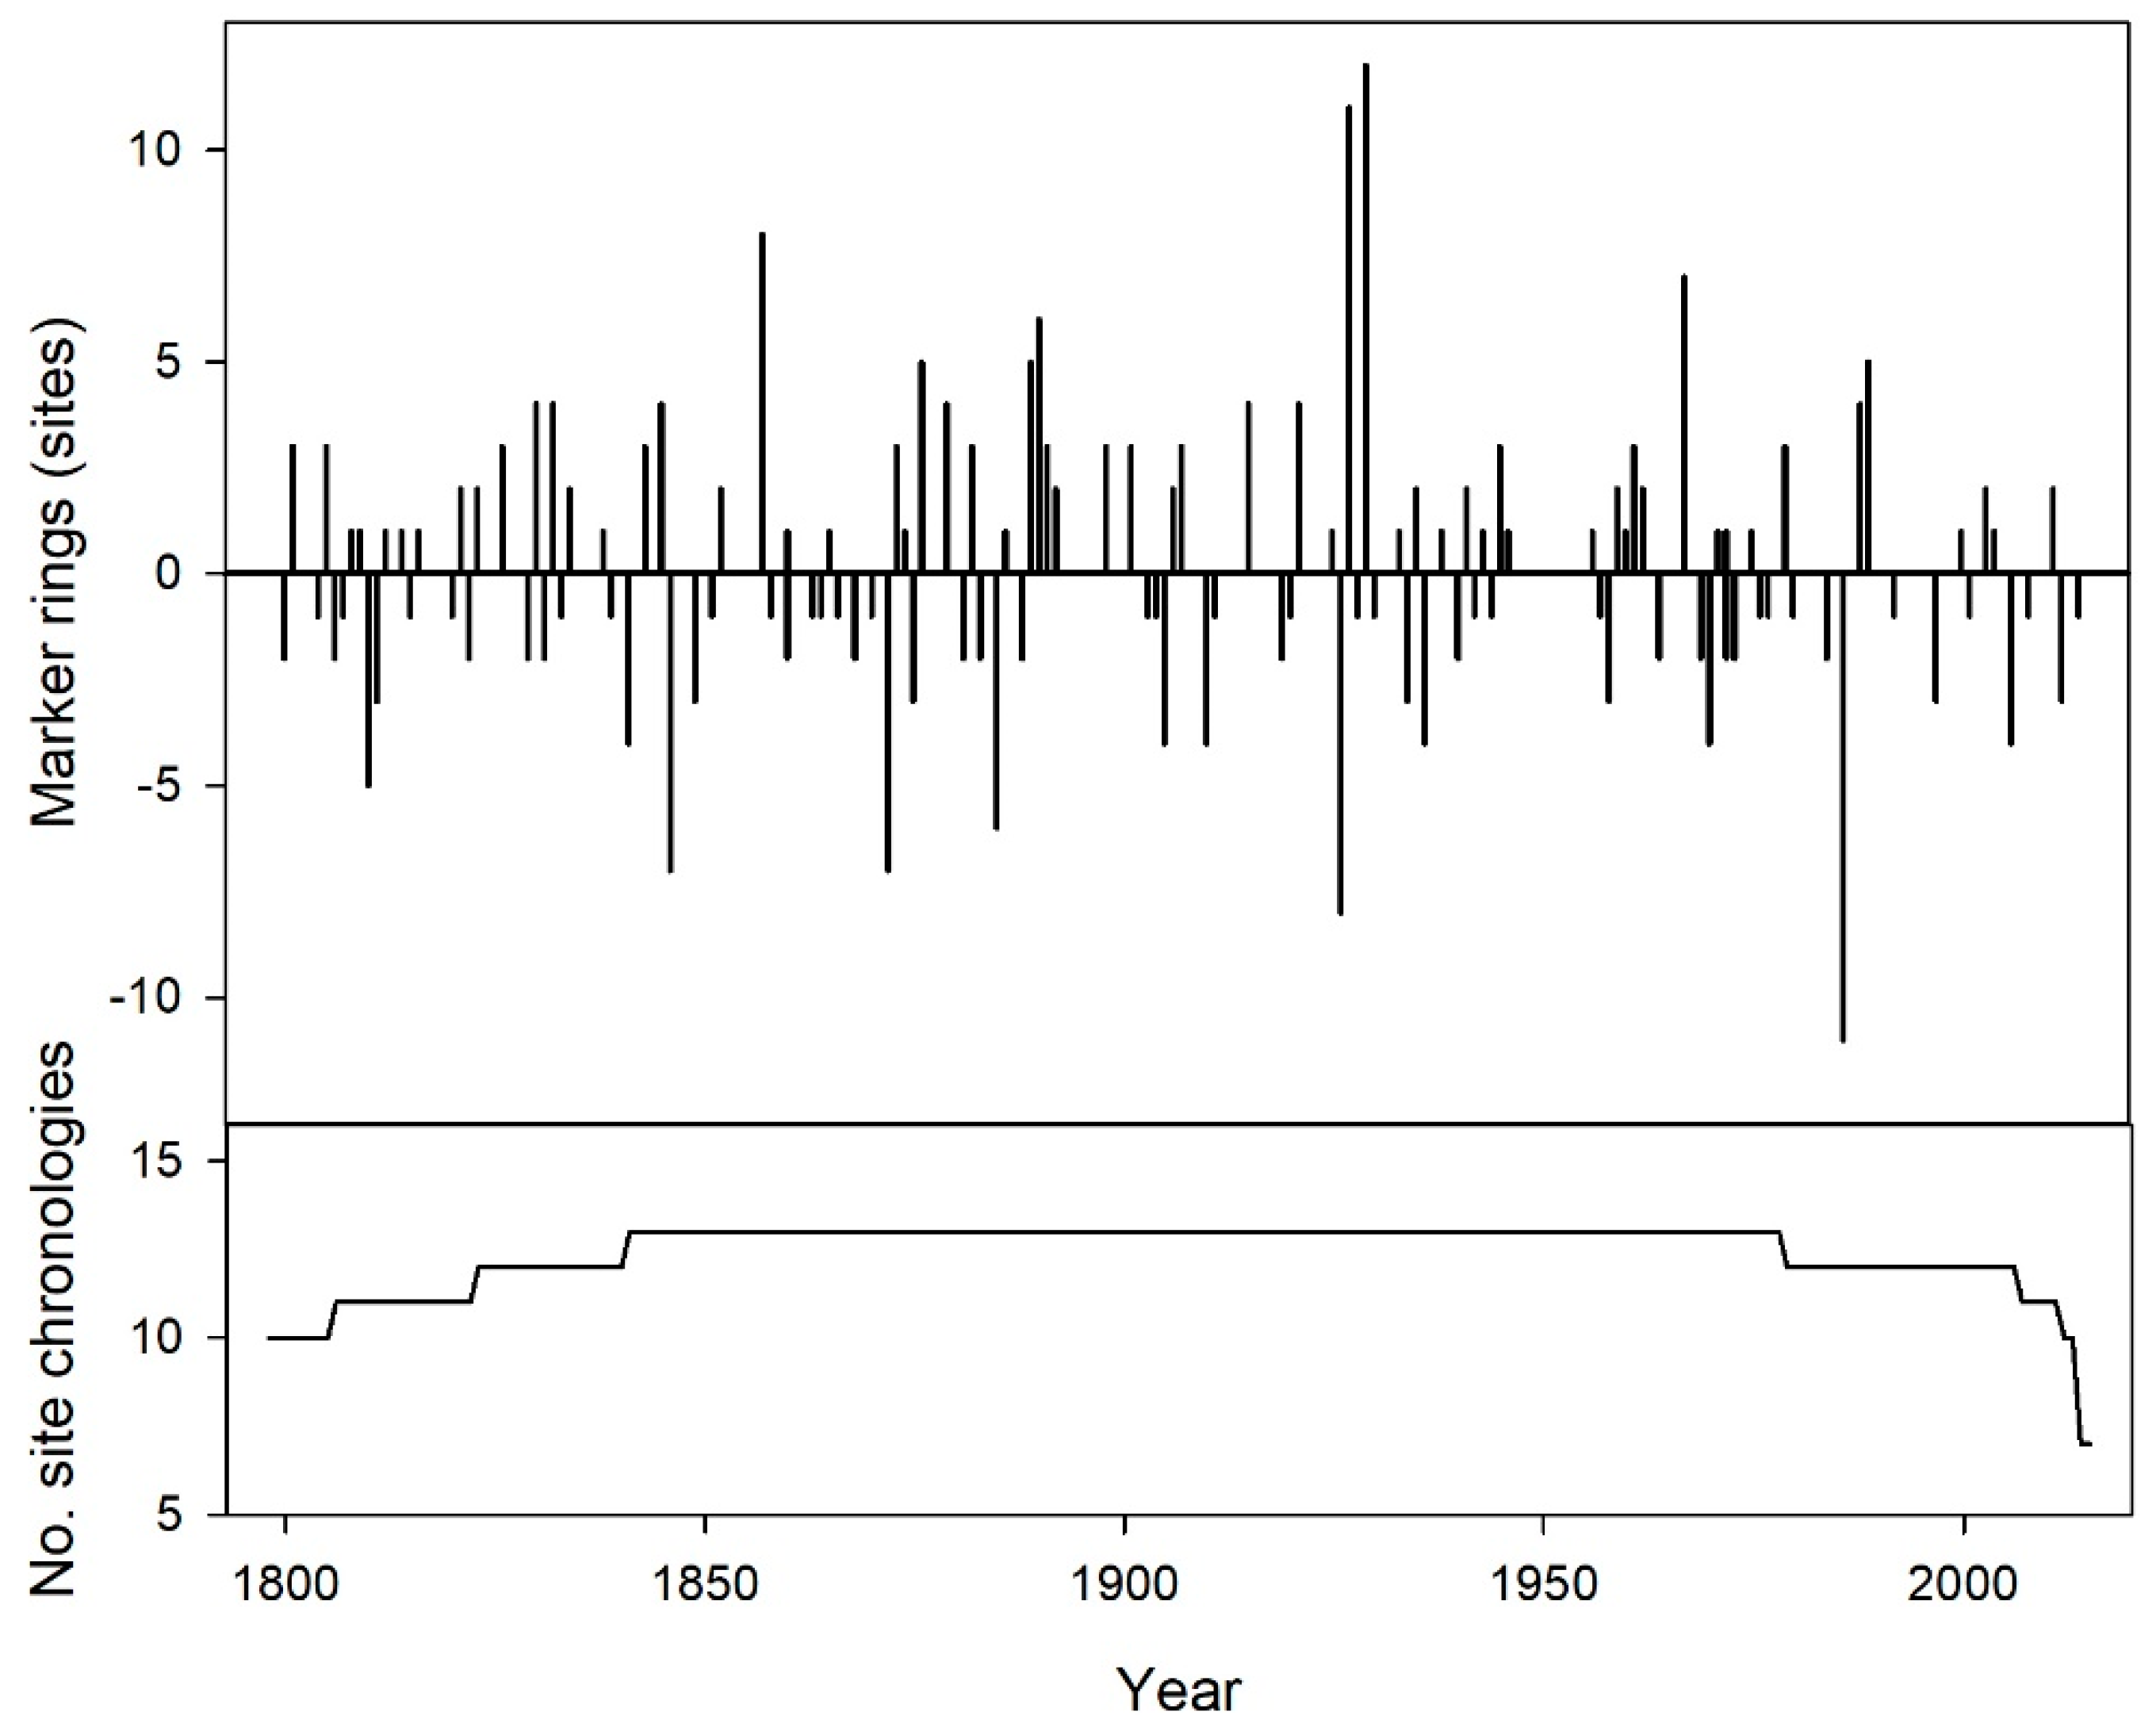
Figure 3.
Ring-width standard (top) and residual (middle) chronologies from 1524 to 2015, beginning when all three chronologies had ≥10 samples, for trees stratified as healthy, declining, and dead based on crown attributes. The bottom panels depict sample depth or the number trees included in each chronology over time (maximum n = 99, 64, and 57 for the healthy, declining, and dead chronologies, respectively).
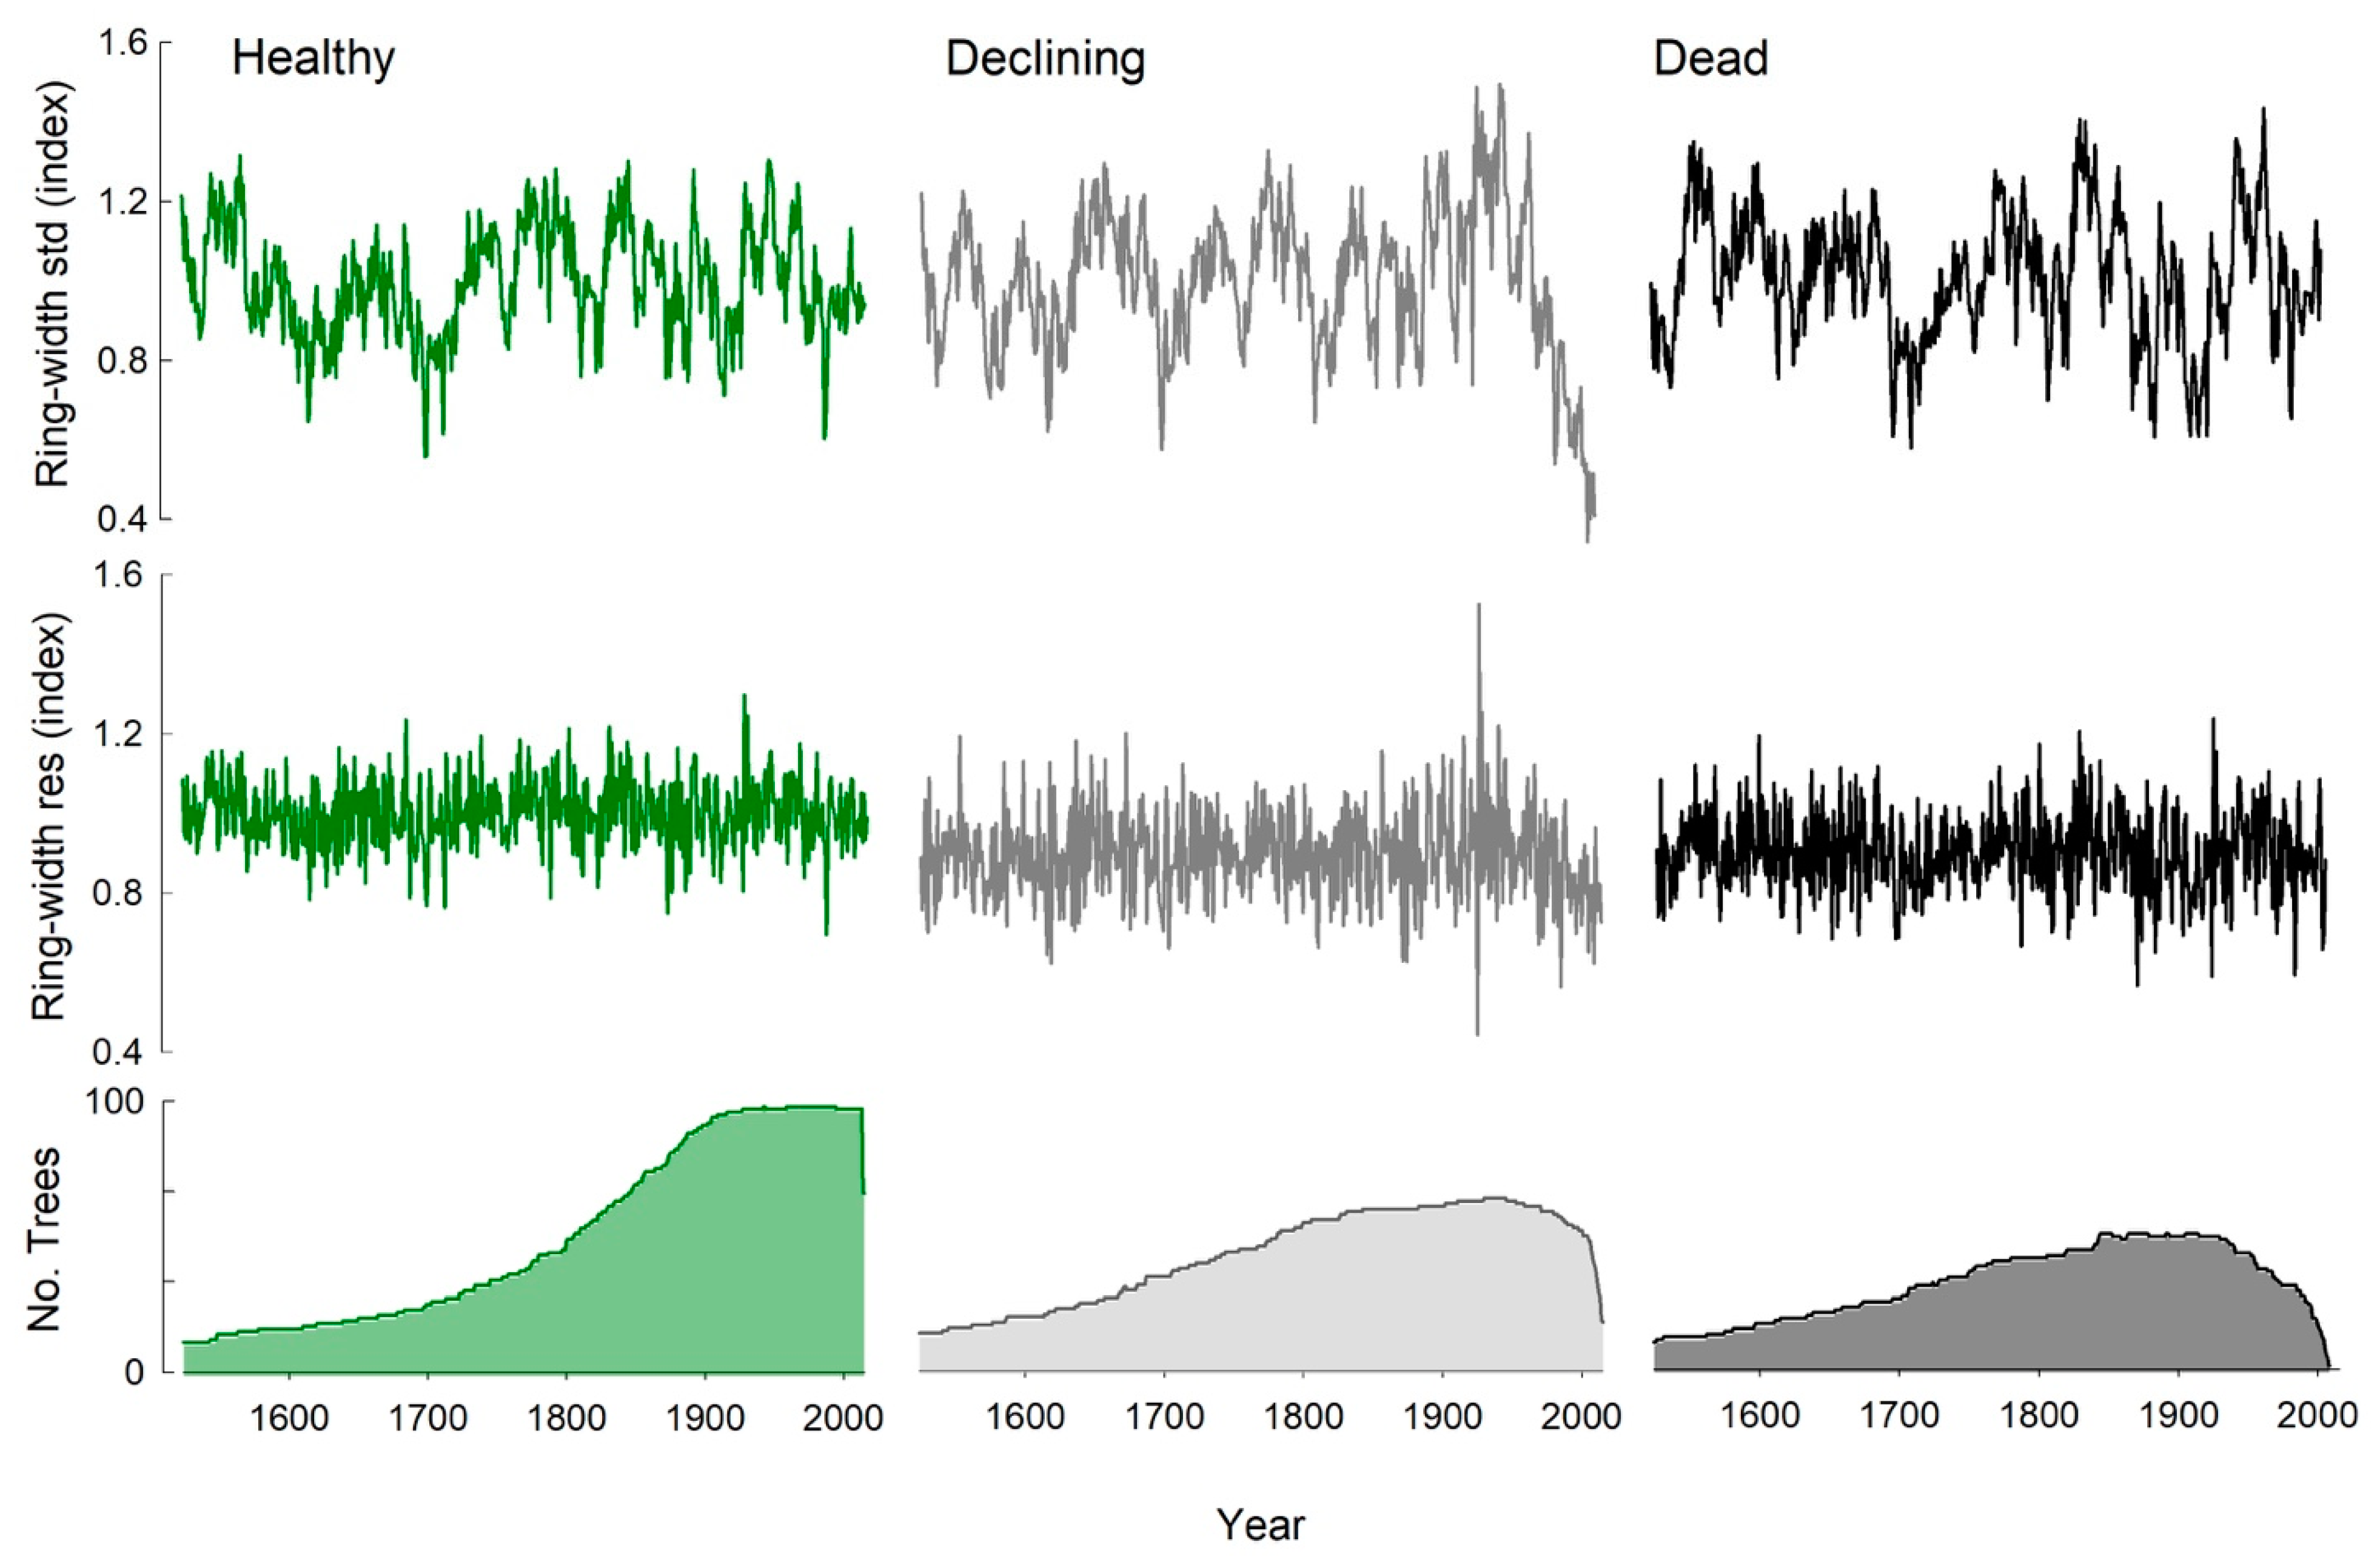
Figure 4.
Average climatic records from the 13 sites on the southern portion of Graham Island, including monthly total precipitation (top) and minimum temperature (bottom). Bars represent mean values for the three time periods of 1901 to 1945 (left), 1946 to 1976 (middle), and 1977 to 2015 (right). The split is based on the two major switches in the Pacific Decadal Oscillation (PDO). Whiskers are standard deviations. For each month, significant differences in ranked means among time periods are indicated by different letters (α = 0.05).
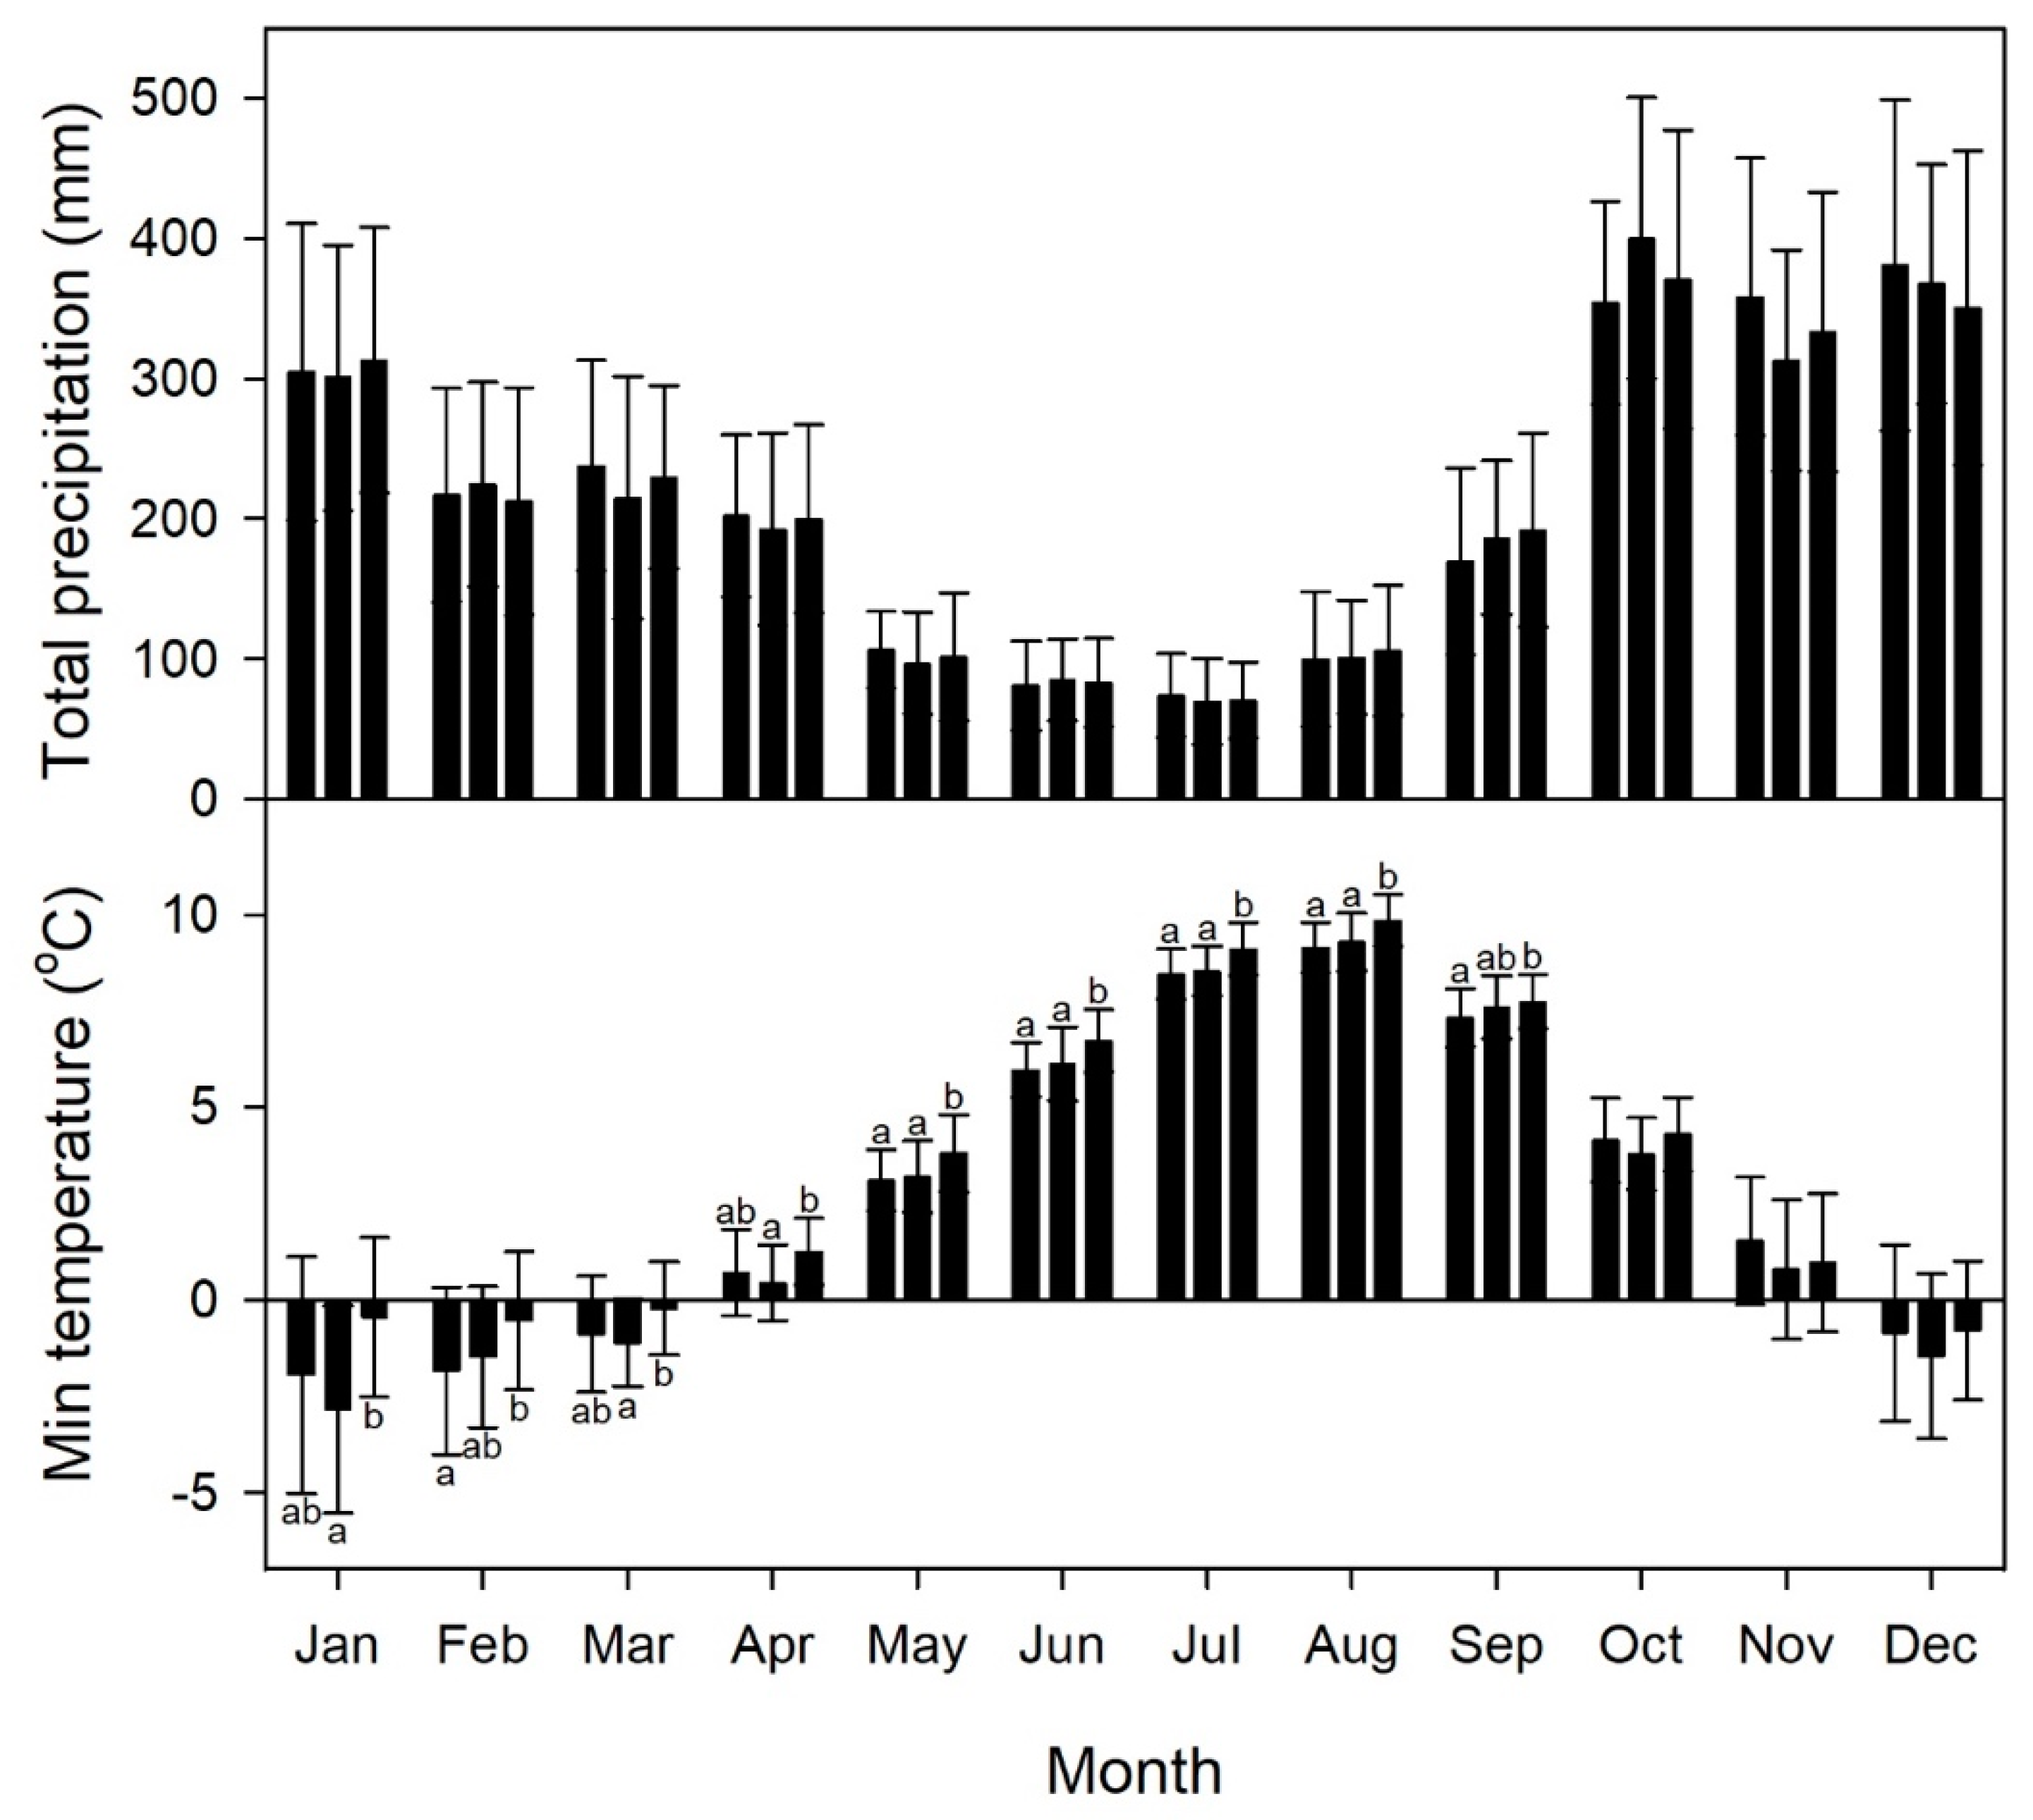
Figure 5.
Correlation between monthly precipitation and the residual chronologies for the healthy, declining, and dead trees over the time periods 1902–1945 (left), 1946–1976 (middle), and 1977–2015 (right). Bars are the correlation coefficients. A dot indicates significance (α = 0.05). The final period for the dead chronology is 1977–2008.
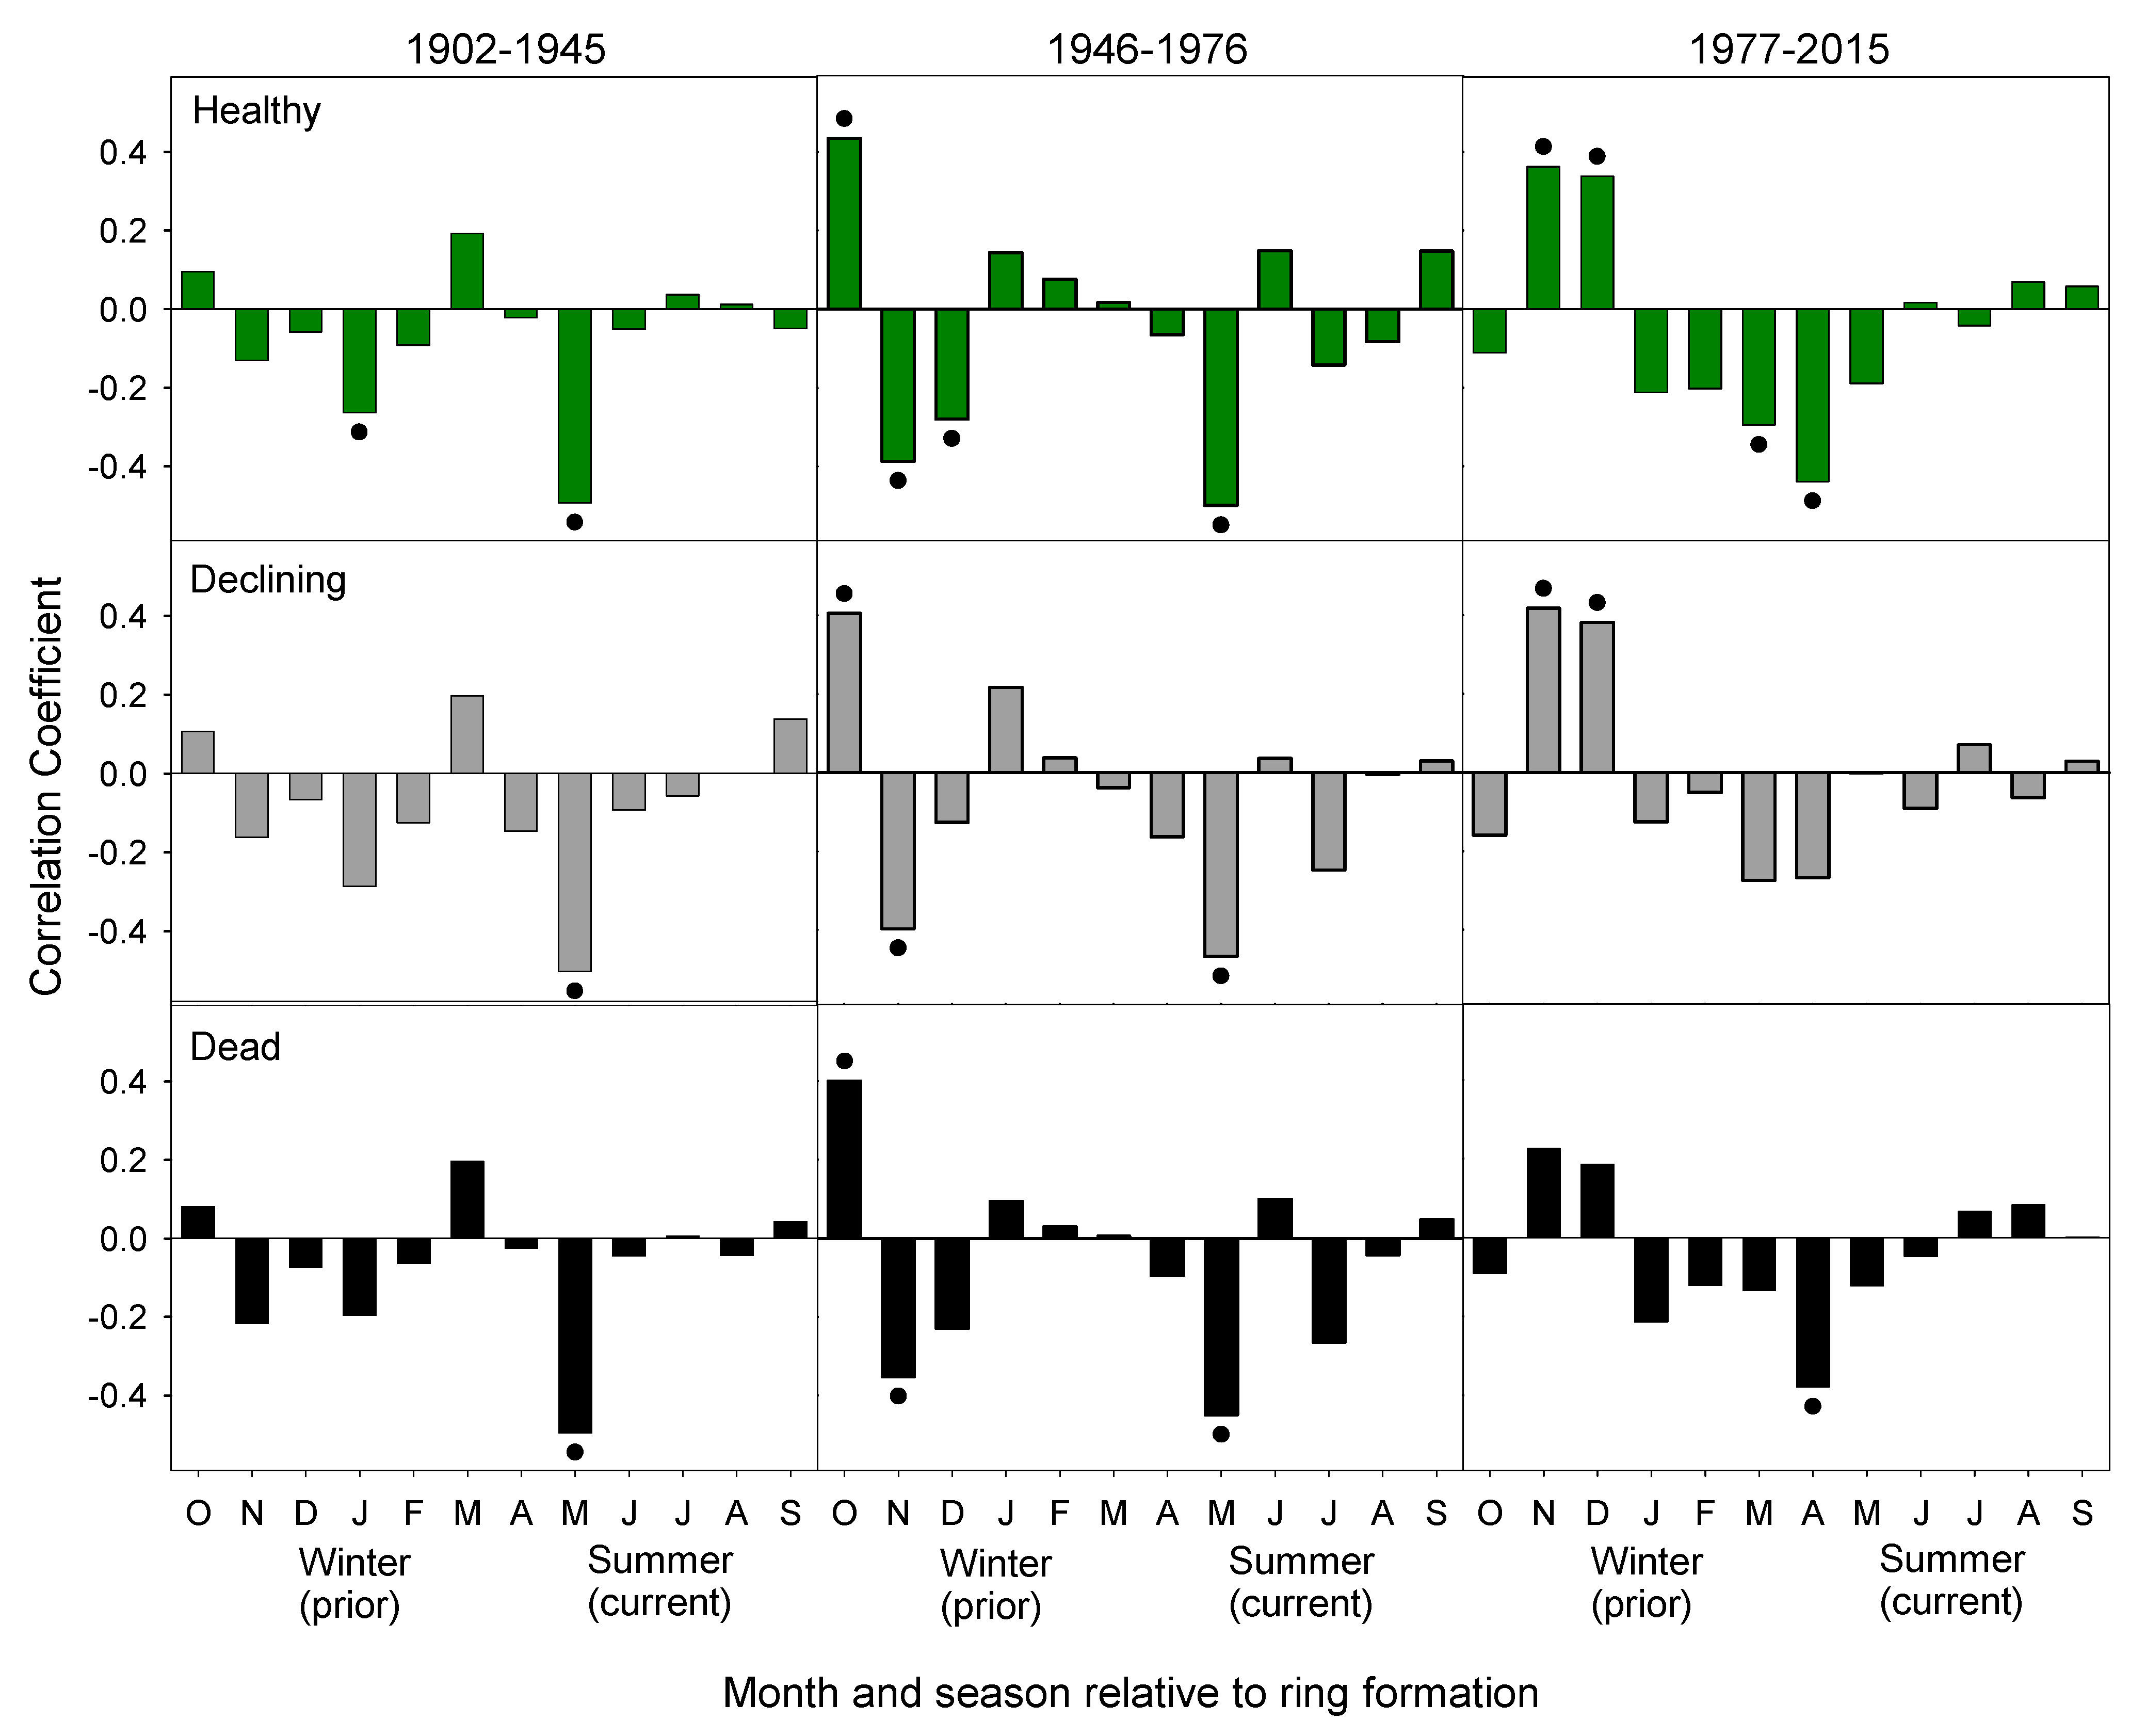
Figure 6.
Morlet cross-wavelet transform demonstrating the dominant frequency modes of variability for the chronologies comprised of yellow-cedar trees that were healthy, declining, and dead when sampled and their coherency with the annual Pacific Decadal Oscillation (PDO) index for the common time-period (1855–2015). The black contour line encloses regions of greater than 95% confidence. Faded regions indicate the “cone of influence” where edge effects become important [38].

Figure 7.
Correlation between monthly minimum temperature and the residual chronology for healthy, declining, and dead groups over the time periods of 1902–1945 (left), 1946–1976 (middle), and 1977–2015 (right). Bars are the correlation coefficients. A dot indicates significance (α = 0.05). The final period for the dead chronology is 1977–2008.

Table 1.
Correlations (r) among the 13 site-level chronologies organized from the north to the south. Darker shades represent higher positive correlations. All are significant except the one correlation between sites 1 and 4, in brackets.
Table 1.
Correlations (r) among the 13 site-level chronologies organized from the north to the south. Darker shades represent higher positive correlations. All are significant except the one correlation between sites 1 and 4, in brackets.
| 1 | 2 | 3 | 4 | 5 | 6 | 7 | 8 | 9 | 10 | 11 | 12 | |
| 2 | 0.28 | |||||||||||
| 3 | 0.14 | 0.48 | ||||||||||
| 4 | (0.08) | 0.68 | 0.56 | |||||||||
| 5 | 0.11 | 0.31 | 0.24 | 0.48 | ||||||||
| 6 | 0.24 | 0.43 | 0.51 | 0.43 | 0.42 | |||||||
| 7 | 0.17 | 0.53 | 0.45 | 0.71 | 0.38 | 0.35 | ||||||
| 8 | 0.23 | 0.48 | 0.36 | 0.53 | 0.23 | 0.23 | 0.60 | |||||
| 9 | 0.28 | 0.78 | 0.44 | 0.82 | 0.53 | 0.51 | 0.73 | 0.65 | ||||
| 10 | 0.26 | 0.69 | 0.43 | 0.79 | 0.46 | 0.43 | 0.64 | 0.53 | 0.86 | |||
| 11 | 0.28 | 0.44 | 0.08 | 0.47 | 0.41 | 0.27 | 0.50 | 0.66 | 0.73 | 0.51 | ||
| 12 | 0.33 | 0.63 | 0.38 | 0.58 | 0.36 | 0.47 | 0.62 | 0.56 | 0.76 | 0.69 | 0.56 | |
| 13 | 0.31 | 0.30 | 0.37 | 0.18 | 0.50 | 0.60 | 0.30 | 0.35 | 0.32 | 0.21 | 0.46 | 0.28 |
Table 2.
Characteristics of the ring-width chronologies for the tree health status classes; healthy, declining, and dead. Mean series intercorrelation and sensitivity are for the full length of the chronologies.
Table 2.
Characteristics of the ring-width chronologies for the tree health status classes; healthy, declining, and dead. Mean series intercorrelation and sensitivity are for the full length of the chronologies.
| Group | n | Full Length of | n ≥ 10 | Mean Series | Mean | EPS ≥ 0.85 |
|---|---|---|---|---|---|---|
| Chronology | (year) | Intercorrelation | Sensitivity | (year) | ||
| Healthy | 99 | 1324−2015 | 1521 | 0.381 | 0.260 | 1759 |
| Declining | 64 | 1282−2015 | 1500 | 0.377 | 0.273 | 1741 |
| Dead | 57 | 1297−2008 | 1524 | 0.377 | 0.260 | 1759 |
© 2019 by the authors. Licensee MDPI, Basel, Switzerland. This article is an open access article distributed under the terms and conditions of the Creative Commons Attribution (CC BY) license (http://creativecommons.org/licenses/by/4.0/).
Share and Cite
MDPI and ACS Style
Comeau, V.M.; Daniels, L.D.; Knochenmus, G.; Chavardès, R.D.; Zeglen, S. Tree-Rings Reveal Accelerated Yellow-Cedar Decline with Changes to Winter Climate after 1980. Forests 2019, 10, 1085. https://doi.org/10.3390/f10121085
AMA Style
Comeau VM, Daniels LD, Knochenmus G, Chavardès RD, Zeglen S. Tree-Rings Reveal Accelerated Yellow-Cedar Decline with Changes to Winter Climate after 1980. Forests. 2019; 10(12):1085. https://doi.org/10.3390/f10121085
Chicago/Turabian StyleComeau, Vanessa M., Lori D. Daniels, Garrett Knochenmus, Raphaël D. Chavardès, and Stefan Zeglen. 2019. "Tree-Rings Reveal Accelerated Yellow-Cedar Decline with Changes to Winter Climate after 1980" Forests 10, no. 12: 1085. https://doi.org/10.3390/f10121085
Note that from the first issue of 2016, this journal uses article numbers instead of page numbers. See further details here.