Succession and the Relationship between Vegetation and Soil in the Marl Quarries of the Yucatan Peninsula, Mexico

 ,
,  , and
, and
Abstract
:1. Introduction
2. Materials and Methods
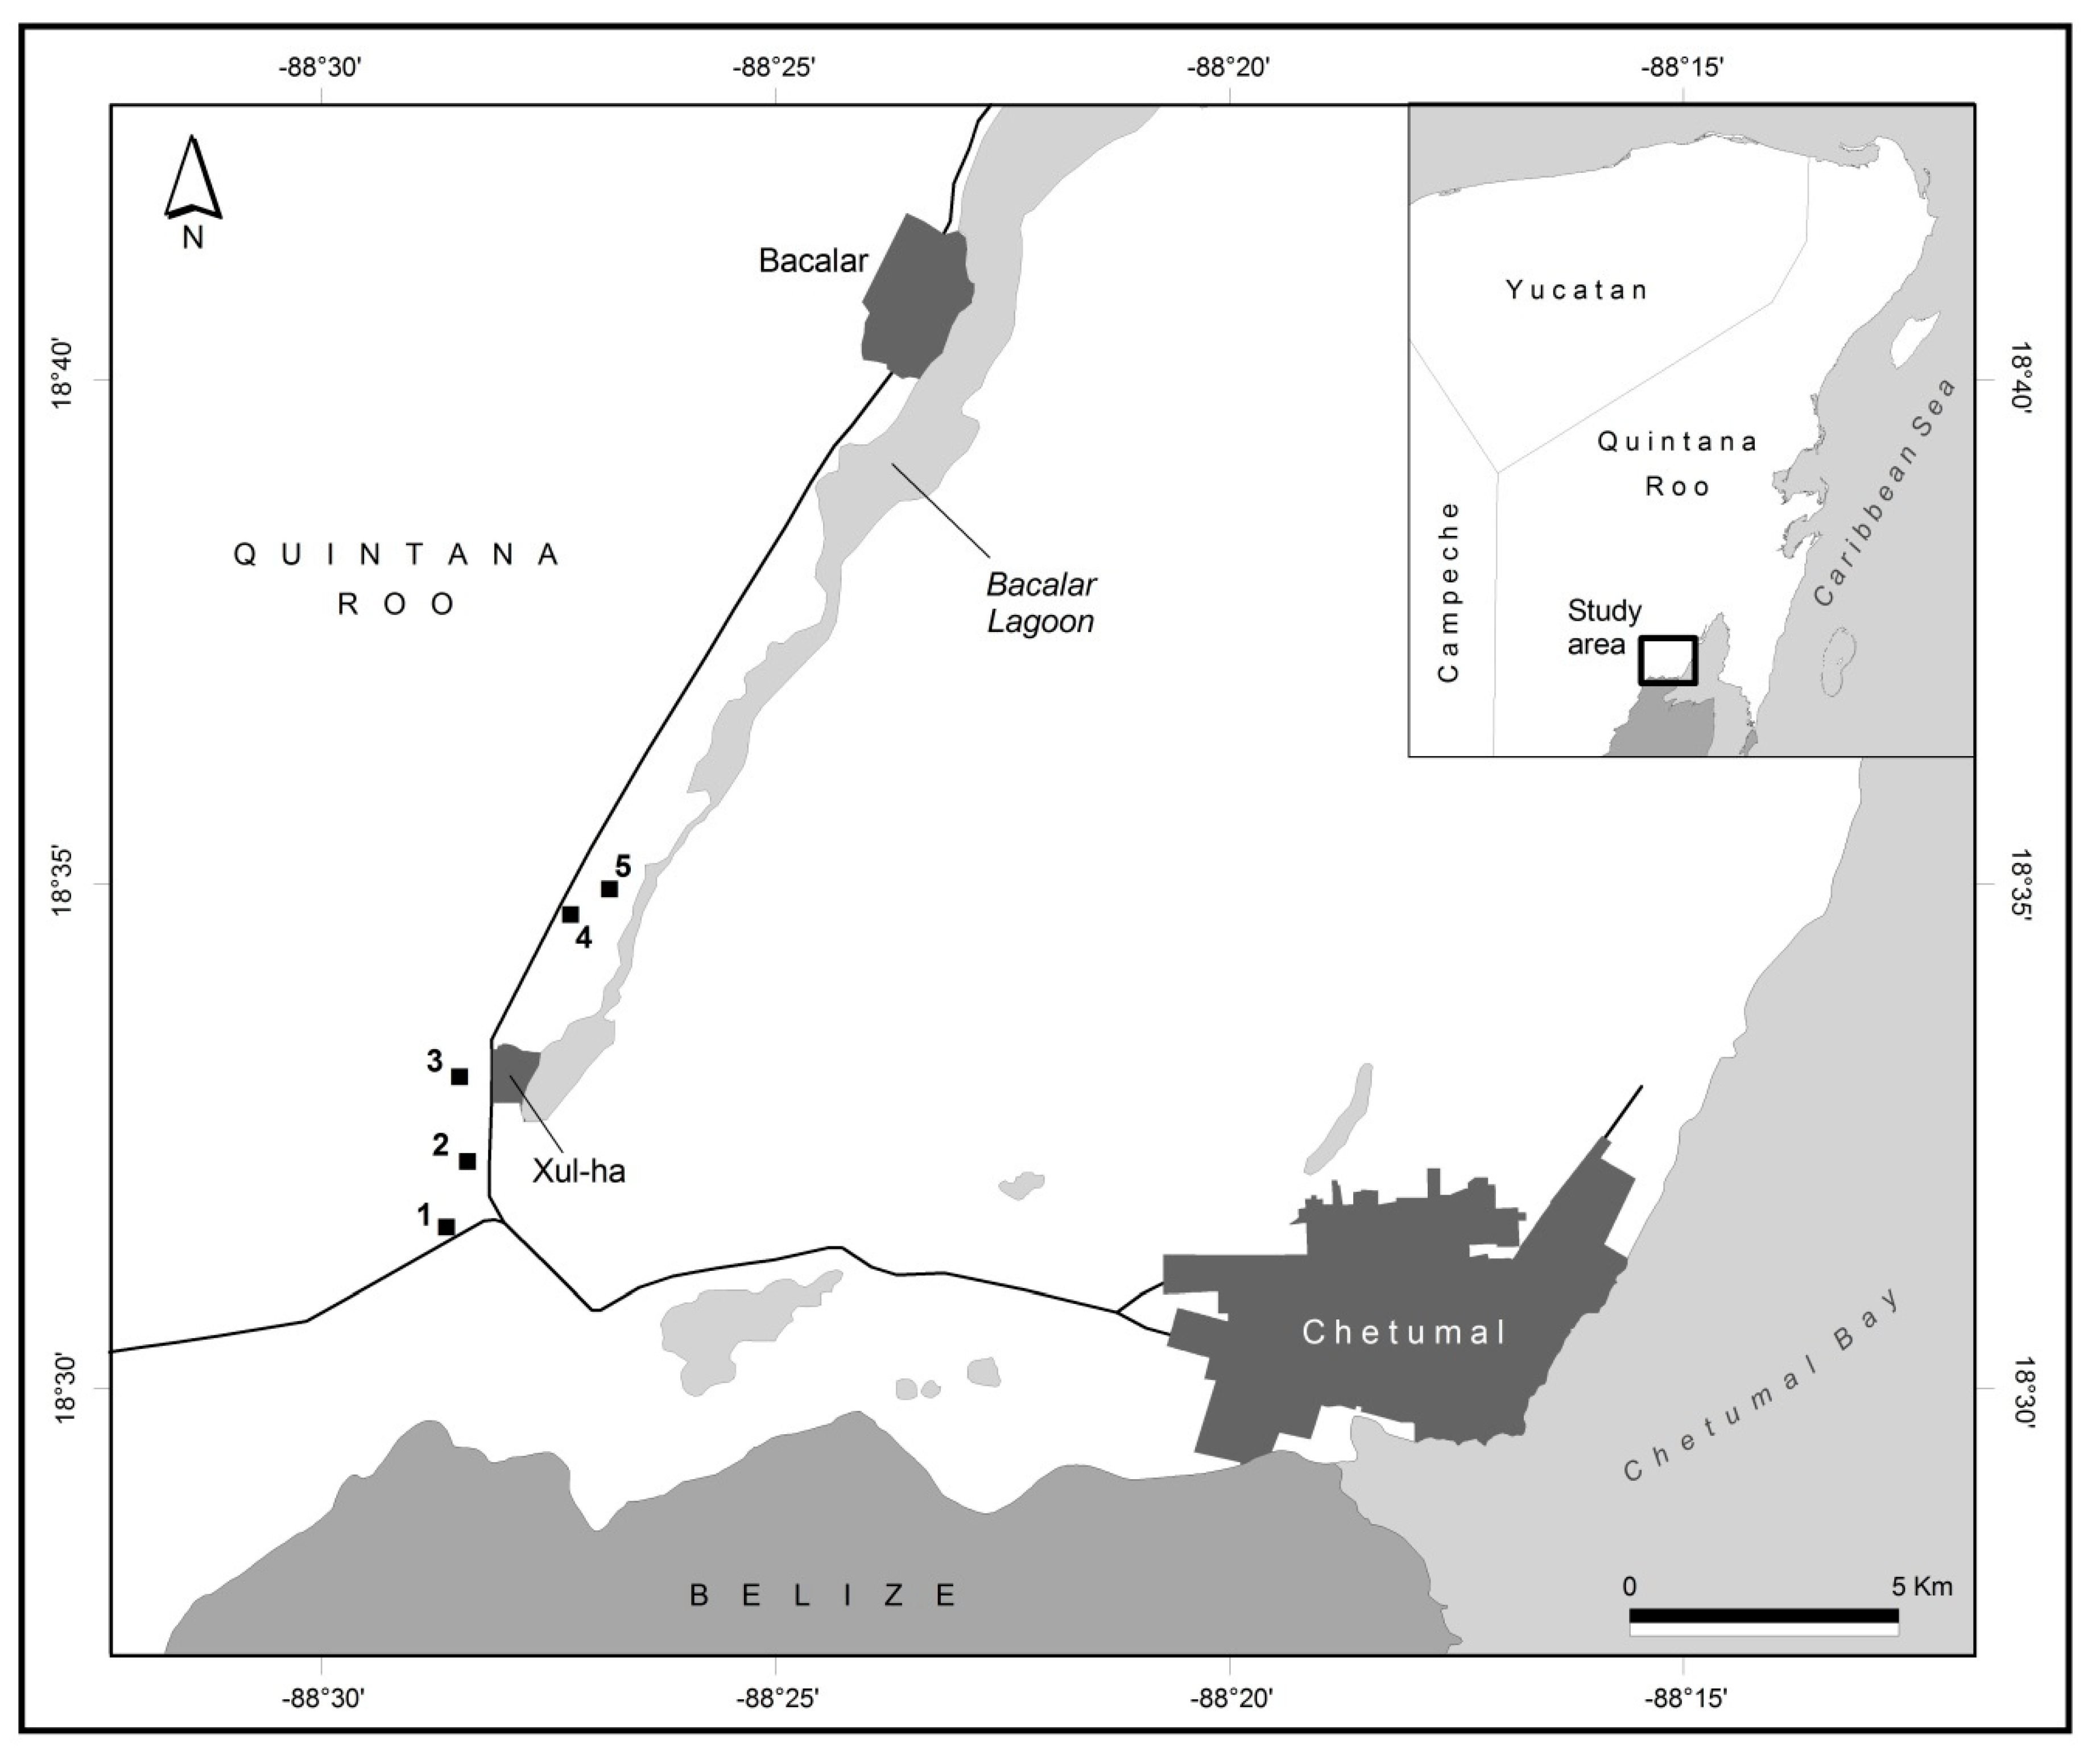
2.1. Study Area
2.2. Sampling Design
2.3. Vegetation Sampling
2.4. Soil Sampling
2.5. Data Analysis
3. Results
3.1. Floristic Composition
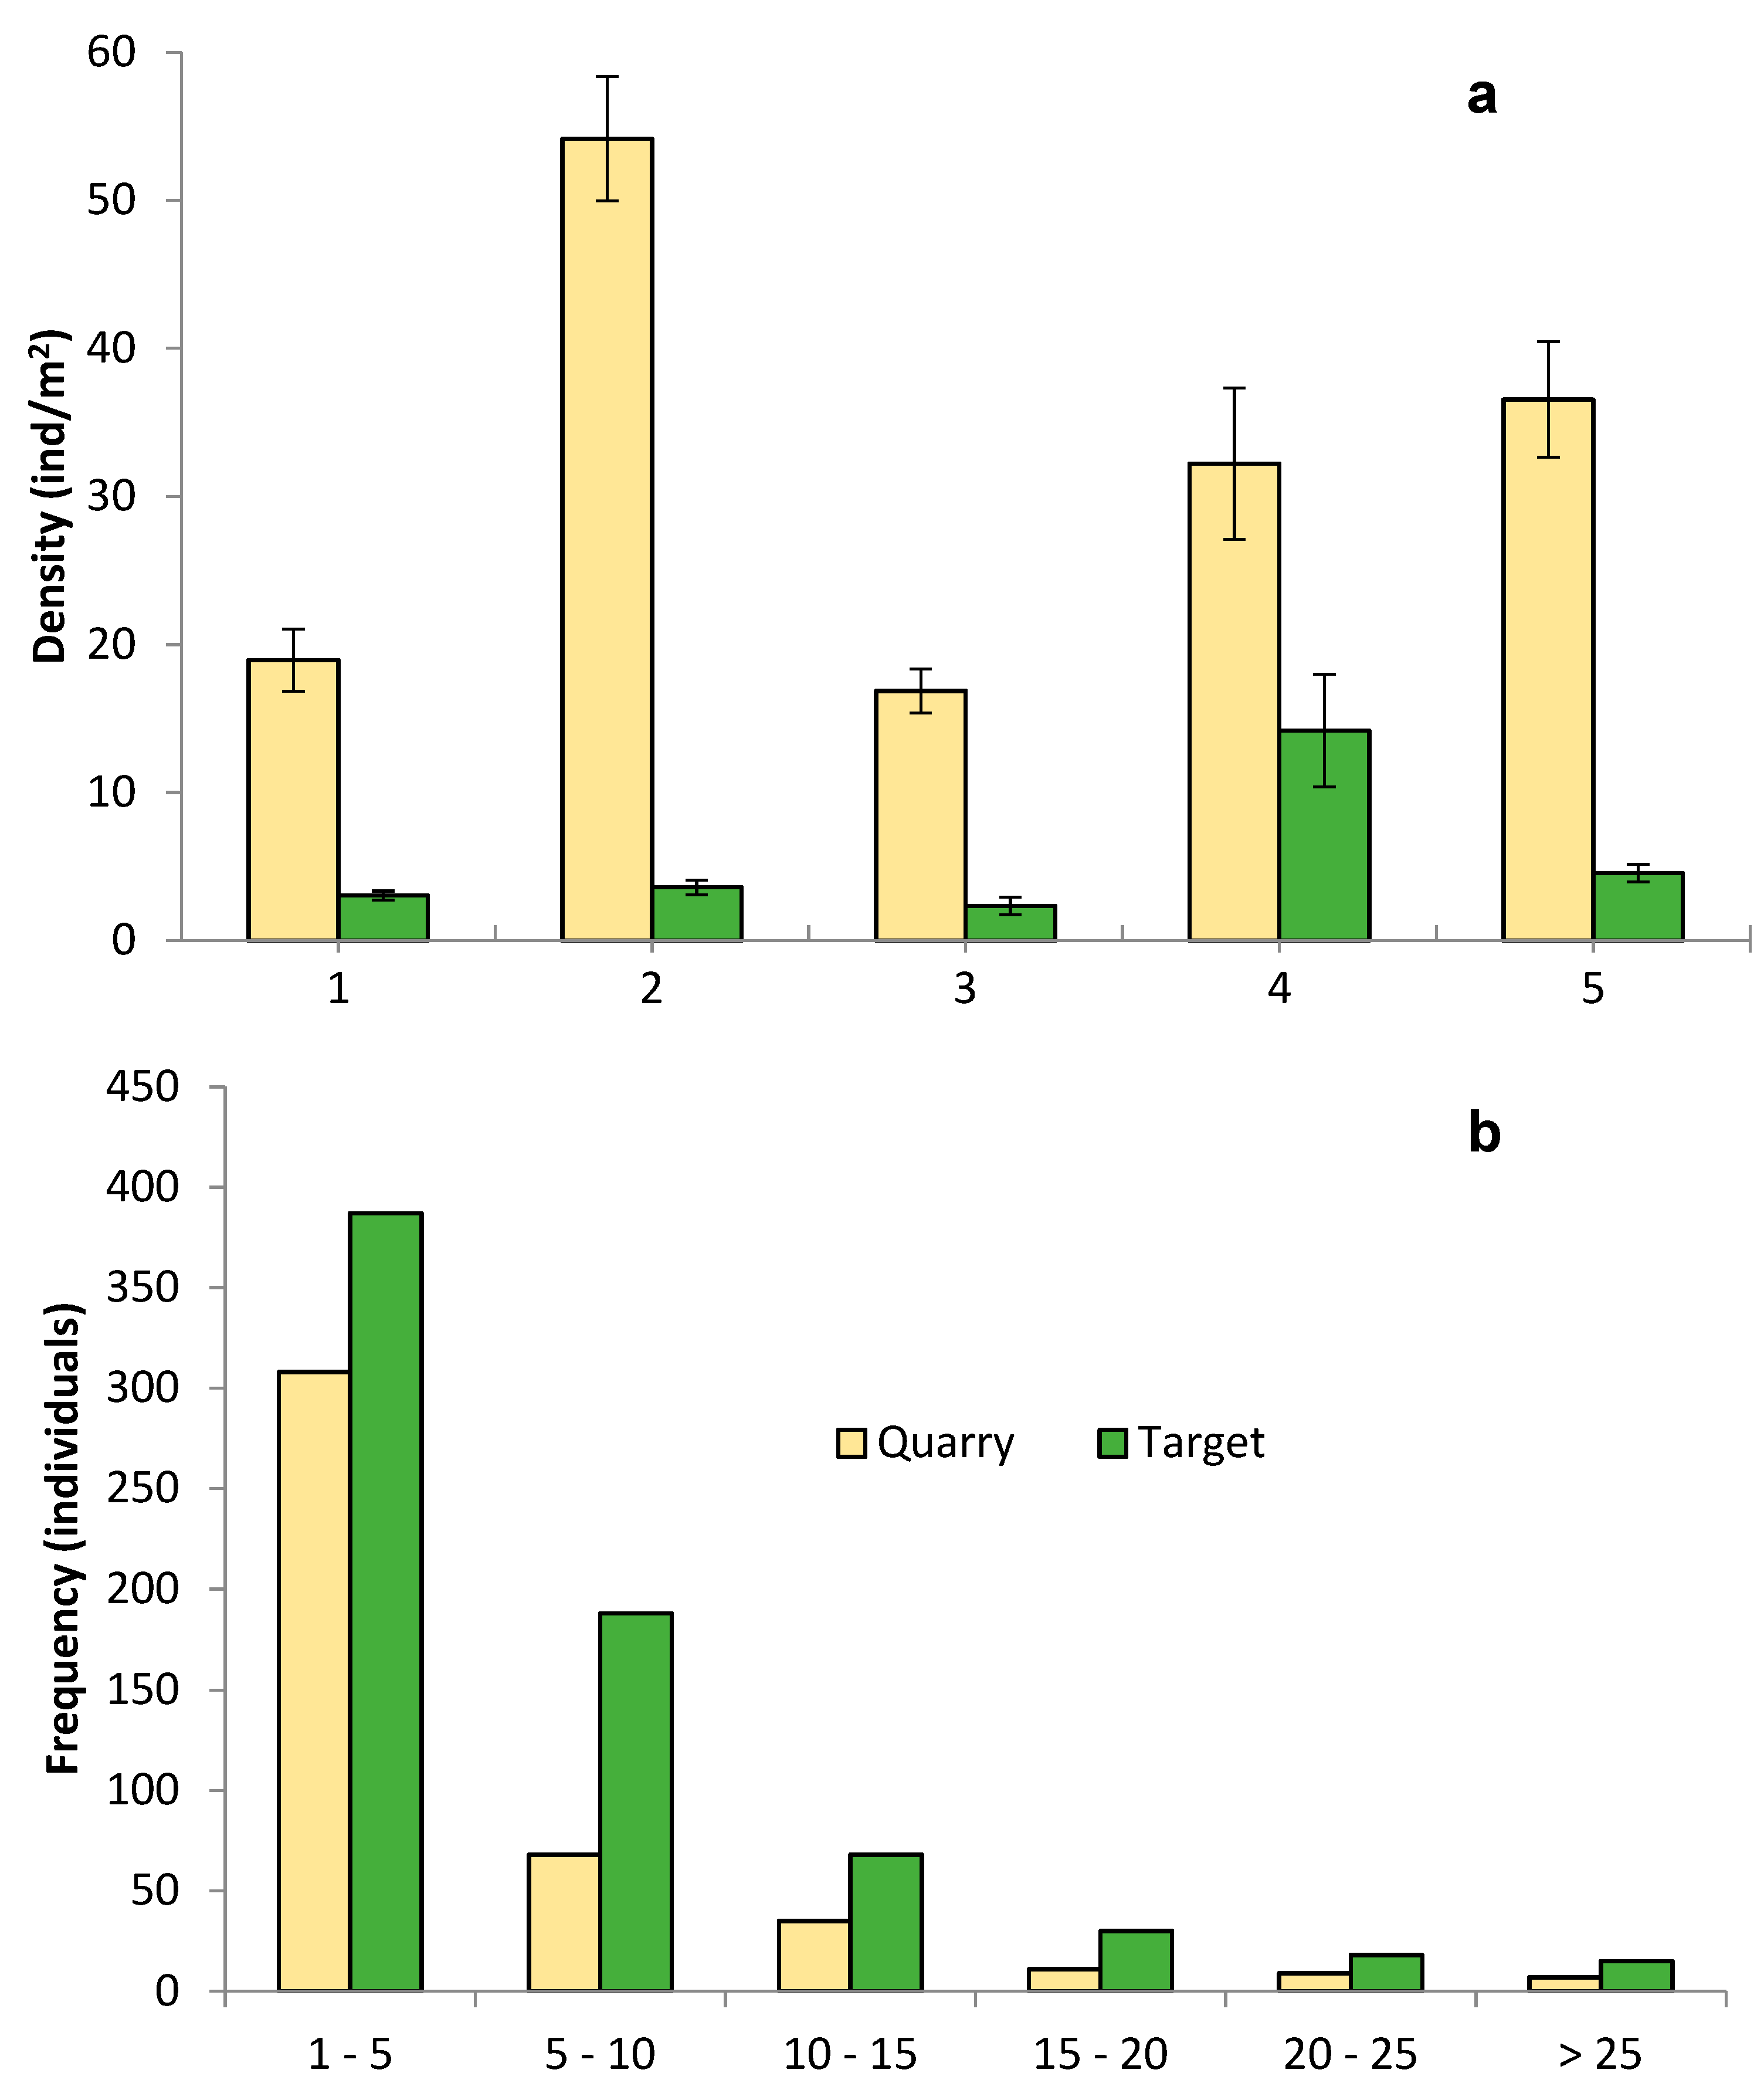
3.2. Vegetation Structure
4. Discussion
5. Conclusions
Author Contributions
Funding
Acknowledgments
Conflicts of Interest
References
- Baasch, A.; Kirmer, A.; Tischew, S. Nine years of vegetation development in a postmining site: Effects of spontaneous and assisted site recovery. J. Appl. Ecol. 2011, 49, 251–260. [Google Scholar] [CrossRef]
- Kirmer, A.; Tischew, S.; Ozinga, W.A.; von Lampe, M.; Baasch, A.; van Groenendael, J.M. Importance of regional species pools and functional traits in colonization processes: Predicting re-colonization after large-scale destruction of ecosystems. J. Appl. Ecol. 2008, 45, 1523–1530. [Google Scholar] [CrossRef]
- Boscutti, F.; Vianello, A.; Bozzato, F.; Casolo, V. Vegetation structure, species life span, and exotic status elucidate plant succession in a limestone quarry reclamation. Restor. Ecol. 2017, 25, 595–604. [Google Scholar] [CrossRef]
- Prach, K.; Hobbs, R.J. Spontaneous Succession versus Technical Reclamation in the Restoration of Disturbed Sites. Restor. Ecol. 2008, 16, 363–366. [Google Scholar] [CrossRef]
- Prach, K.; Řehounková, K.; Lencová, K.; Jírová, A.; Konvalinková, P.; Mudrák, O.; Študent, V.; Vaněček, Z.; Tichý, L.; Petřík, P.; et al. Vegetation succession in restoration of disturbed sites in Central Europe: The direction of succession and species richness across 19 seres. Appl. Veg. Sci. 2014, 17, 193–200. [Google Scholar] [CrossRef]
- Sanchez, O.; Islebe, G. Hurricane Gilbert and structure changes in a tropical forest in south-eastern Mexico. Glob. Ecol. Biogeogr. 1999, 8, 29–38. [Google Scholar] [CrossRef]
- Whigham, D.F.; Olmsted, I.; Cano, E.C.; Harmon, M.E. The Impact of Hurricane Gilbert on Trees, Litterfall, and Woody Debris in a Dry Tropical Forest in the Northeastern Yucatan Peninsula. Biotropica 1991, 23, 434–441. [Google Scholar] [CrossRef]
- Islebe, G.A.; Sánchez-Sánchez, O.; Valdéz-Hernández, M.; Weissenberger, H. Distribution of Vegetation Types. In Biodiversity and Conservation of the Yucatán Peninsula; Islebe, G.A., Calmé, S., León-Cortés, J.L., Schmook, B., Eds.; Springer International Publishing: Cham, Switzerland, 2015; pp. 39–53. ISBN 9783319065298. [Google Scholar]
- Miranda, F.; Hernández-X, E. Los tipos de vegetación de México y su clasificación. Sociedad Botánica Méx 1963, 28, 29–179. [Google Scholar] [CrossRef]
- Sánchez-Sánchez, O.; Islebe, G.A. Tropical forest communities in southeastern Mexico. Plant Ecol. 2002, 158, 183–200. [Google Scholar] [CrossRef]
- García, E. Modificaciones al Sistema de Clasificación Climática de Köppen; Serie Libros; Instituto de Geografía, Universidad Nacional Autónoma de México: Mexico City, Mexico, 2004; Volume 6, ISBN 9789703210107. [Google Scholar]
- Instituto Nacional de Estadística y Geografía (INEGI). Mapa digital de México V6.3.0. Available online: http://www.beta.inegi.org.mx (accessed on 5 December 2018).
- Espinoza-Ávalos, J.; Islebe, G.A.; Hernández-Arana, H.A. El sistema ecológico de la Bahía de Chetumal/Corozal: Costa occidental del Mar Caribe; El Colegio de la Frontera Sur: Chetumal, Mexico, 2009; ISBN 9786077637134. [Google Scholar]
- Torrescano-Valle, N.; Folan, W.J. Physical Settings, Environmental History with an Outlook on Global Change. In Biodiversity and Conservation of the Yucatán Peninsula; Islebe, G.A., Calmé, S., León-Cortés, J.L., Schmook, B., Eds.; Springer International Publishing: Cham, Switzerland, 2015; pp. 9–37. ISBN 9783319065298. [Google Scholar]
- Society for Ecological Restoration International Science & Policy Working Group the SER International Primer on Ecological Restoration; Society for Ecological Restoration International: Tucson, AZ, USA, 2004.
- Hsieh, T.C.; Ma, K.H.; Chao, A. iNEXT: An R package for rarefaction and extrapolation of species diversity (Hill numbers). Methods Ecol. Evol. 2016, 7, 1451–1456. [Google Scholar] [CrossRef]
- Müller-Dombois, D.; Ellenberg, H. Aims and Methods of Vegetation Science; Wiley: New York, NY, USA, 1974. [Google Scholar]
- ter Braak, C.J.F.; Smilauer, P. CANOCO Reference Manual and CanoDraw for Windows User’s Guide: Software for Canonical Community Ordination (Version 4.5); Microcomputer Power: Ithaca, NY, USA, 2002. [Google Scholar]
- Lepš, J.; Šmilauer, P. Using the CANOCO for Windows 4.5 package. In Multivariate Analysis of Ecological Data Using CANOCO; Cambridge University Press: Cambridge, UK, 2003; pp. 43–59. [Google Scholar]
- Pinheiro, J.; Bates, D.; DebRoy, S.; Sarkar, D.; R Core Team. nlme: Linear and Nonlinear Mixed Effects. Available online: https://cran.r-project.org/web/packages/nlme/citation.html (accessed on 5 December 2018).
- Alday, J.G.; Pallavicini, Y.; Marrs, R.H.; Martínez-Ruiz, C. Functional groups and dispersal strategies as guides for predicting vegetation dynamics on reclaimed mines. Plant Ecol. 2011, 212, 1759–1775. [Google Scholar] [CrossRef]
- Valdez-Hernández, M.; Sánchez, O.; Islebe, G.A.; Snook, L.K.; Negreros-Castillo, P. Recovery and early succession after experimental disturbance in a seasonally dry tropical forest in Mexico. For. Ecol. Manag. 2014, 334, 331–343. [Google Scholar] [CrossRef]
- Pennington, T.D.; Sarukhán, J. Árboles Tropicales de México. Manual Para la Identificación de las Principales Especies; Universidad Nacional Autónoma de México: Mexico City, Mexico, 2005; ISBN 9789681678555. [Google Scholar]
- White, D.A.; Hood, C.S. Vegetation patterns and environmental gradients in tropical dry forests of the northern Yucatan Peninsula. J. Veg. Sci. 2004, 15, 151–160. [Google Scholar] [CrossRef]
- Williams-Linera, G.; Alvarez-Aquino, C.; Hernández-Ascención, E.; Toledo, M. Early successional sites and the recovery of vegetation structure and tree species of the tropical dry forest in Veracruz, Mexico. New For. 2011, 42, 131–148. [Google Scholar] [CrossRef]
- López-Martínez, J.O.; Sanaphre-Villanueva, L.; Dupuy, J.M.; Hernández-Stefanoni, J.L.; Meave, J.A.; Gallardo-Cruz, J.A. β-Diversity of Functional Groups of Woody Plants in a Tropical Dry Forest in Yucatan. PLoS ONE 2013, 8, e73660. [Google Scholar] [CrossRef] [PubMed]
- Guariguata, M.R.; Ostertag, R. Neotropical secondary forest succession: Changes in structural and functional characteristics. For. Ecol. Manag. 2001, 148, 185–206. [Google Scholar] [CrossRef]
- Chazdon, R.L. Tropical forest recovery: Legacies of human impact and natural disturbances. Perspect. Plant Ecol. Evol. Syst. 2003, 6, 51–71. [Google Scholar] [CrossRef]
- Madeira, B.; Espírito-Santo, M.; Neto, S.; Nunes, Y.; Arturo Sánchez Azofeifa, G.; Wilson Fernandes, G.; Quesada, M. Changes in tree and liana communities along a successional gradient in a tropical dry forest in south-eastern Brazil. Plant Ecol. 2009, 201, 291–304. [Google Scholar] [CrossRef]
- Cortés-Castelán, J.C.; Islebe, G.A. Influencia de factores ambientales en la distribución de especies arbóreas en las selvas del sureste de México. Rev. Biol. Trop. 2005, 53, 115–133. [Google Scholar]
- Uhl, C. Factors Controlling Succession Following Slash-and-Burn Agriculture in Amazonia. J. Ecol. 1987, 75, 377–407. [Google Scholar] [CrossRef]
- Organization for Economic Cooperation and Development; Food and Agriculture Organization of the United Nations. OECD-FAO Agricultural Outlook 2007; Food & Agriculture Organization: Rome, Italy, 2007; ISBN 9789264025097. [Google Scholar]
- Gisbert, J.; Ibáñez, S.; Moreno, H. La textura de un suelo. Available online: http://hdl.handle.net/10251/7775 (accessed on 5 December 2018).
- Ceccon, E.; Huante, P.; Campo, J. Effects of nitrogen and phosphorus fertilization on the survival and recruitment of seedlings of dominant tree species in two abandoned tropical dry forests in Yucatán, Mexico. For. Ecol. Manag. 2003, 182, 387–402. [Google Scholar] [CrossRef]
- Eaton, J.M.; Lawrence, D. Woody debris stocks and fluxes during succession in a dry tropical forest. For. Ecol. Manag. 2006, 232, 46–55. [Google Scholar] [CrossRef]


| Quarry | Age (Years) | Coordinates | Soil | Soil Depth | Quarry Depth |
|---|---|---|---|---|---|
| 1 | 10 | 18° 31’ 30.5” N –88° 28’ 29.5” W | L, R | 7 cm | 3–6 m |
| 2 | 10 | 18° 32’ 10.1” N –88° 28’ 16.3” W | L, R | 5 cm | 3–6 m |
| 3 | 10 | 18° 33’ 01.1” N –88° 28’ 21.9” W | L, R | 8 cm | 6 m |
| 4 | 10 | 18° 34’ 39.6” N –88° 27’ 12.8” W | L, R | 11 cm | 1–3 m |
| 5 | 10 | 18° 34’ 55.0” N –88° 26’ 48.1” W | L, R | 10 cm | 1–3 m |
| Family | Species | GF | 1 | 2 | 3 | 4 | 5 | T |
|---|---|---|---|---|---|---|---|---|
| Anacardiaceae | Astronium graveolens Jacq. | T | * | * | ||||
| Metopium brownei (Jacq.) Urb. | T | * | * | * | * | * | * | |
| Spondias mombin L. | T | * | * | |||||
| Anemiaceae | Anemia adiantifolia (L.) Sw. | F | * | * | * | |||
| Annonaceae | Malmea depressa (Baill.) R.E. Fr. | T | * | * | * | |||
| Apocynaceae | Echites tuxtlensis Standl. | L | * | * | ||||
| Echites yucatanensis Millsp. ex. Standl. | L | * | * | |||||
| Thevetia peruviana (Pers.) K. Schum. | T | * | * | * | * | * | * | |
| Araliaceae | Dendropanax arboreus (L.) Decne. and Planch. | S | * | * | ||||
| Arecaceae | Acoelorraphe wrightii (Griseb. and H. Wendl.) H. Wendl. ex Becc. | P | * | * | ||||
| Sabal mexicana Mart. | P | * | * | * | ||||
| Asteraceae | Calea jamaicensis (L.) L. | S | * | * | * | |||
| Melanthera sp. Rohr | H | * | ||||||
| Viguiera dentata (Cav.). Spreng. | H | * | * | * | * | * | * | |
| Bignoniaceae | Arrabidaea sp.DC. | L | * | * | ||||
| Cydista potosina (K. Schum. and Loes.) Loes. | H | * | * | * | * | * | ||
| Bromeliaceae | Bromelia sp. L. | E | * | |||||
| Burseraceae | Bursera simaruba (L.) Sarg. | T | * | * | ||||
| Cannabaceae | Trema micrantha (L.) Blume | S | * | |||||
| Celastraceae | Hippocratea volubilis L. | T | * | |||||
| Convolvulaceae | Ipomoea batatas (Choisy) Griseb. | H | * | |||||
| Ipomoea sp. L. | H | * | * | |||||
| Cyperaceae | Fimbristylis sp. Vahl | H | * | |||||
| Scleria sp. P.J. Bergius | H | * | ||||||
| Ebenaceae | Diospyros salicifolia Humb. and Bonpl. ex. Willd. | T | * | * | * | * | * | |
| Euphorbiaceae | Cnidoscolus multilobus (Pax) I.M. Johnst. | T | * | * | * | |||
| Croton sp. L. | T | * | * | * | * | |||
| Euphorbia dioica Kunth | H | * | * | |||||
| Euphorbia sp. L. | H | * | ||||||
| Jatropha gaumeri Greenm. | T | * | * | * | * | |||
| Fabaceae | Acacia collinsi Saff. | T | * | * | * | * | ||
| Bauhinia divaricata Lam. | T | * | * | * | * | * | ||
| Caesalpinia gaumeri Greenm. | T | * | * | * | ||||
| Lonchocarpus xuul Lundell | T | * | * | * | * | |||
| Lysiloma latisiliquum (L.) Benth. | T | * | * | * | * | * | ||
| Mimosa bahamensis Benth. | T | * | * | |||||
| Piscidia piscipula (L.) Sarg. | T | * | * | * | * | |||
| Senna sp. Mill. | T | * | * | * | * | |||
| Lamiaceae | Ocimum micranthum Willd. | H | * | |||||
| Vitex gaumeri Greenm. | T | * | * | * | * | * | * | |
| Lygodiaceae | Lygodium venustum Sw. | F | * | * | ||||
| Malpighiaceae | Byrsonima crassifolia (L.) Kunth | T | * | * | * | * | * | * |
| Malvaceae | Waltheria indica L. | H | * | * | * | * | ||
| Moraceae | Brosimum alicastum Sw. | T | * | * | ||||
| Ficus pertusa L. f. | T | * | ||||||
| Muntingiaceae | Muntingia calabura L. | T | * | |||||
| Myrtaceae | Eugenia capuli (Schltdl. and Cham.) Hook. and Arn. | S | * | * | ||||
| Orchidiaceae | Bletia purpurea (Lam.) DC. | H | * | |||||
| Passifloraceae | Passiflora sp. L. | L | * | * | * | * | ||
| Piperaceae | Piper auritum Kunth | T | * | * | ||||
| Piper neesianum C. DC. | T | * | * | |||||
| Poaceae | Bothriochloa pertusa (L.) A. Camus | H | * | |||||
| Chloris inflata Link | H | * | * | * | * | * | ||
| Cynodon dactylon (L.) Pers | H | * | ||||||
| Dichanthium aristatum (Pior.) C.E. Hubb. | H | * | * | |||||
| Digitaria ciliaris (Retz.) Koeler | H | * | * | |||||
| Eragrostis ciliaris (L.) R. Br. | H | * | ||||||
| Eragrostis secundiflora J. Presl | H | * | ||||||
| Ichnanthus lanceolatus Scribn. and J.G. Sm. | H | * | * | * | * | * | * | |
| Paspalum blodgettii Champ. | H | * | * | * | * | * | ||
| Paspalum sp. L. | H | * | * | * | * | |||
| Polygonaceae | Coccoloba cozumelensis Hemsl. | T, S | * | * | * | * | * | * |
| Gymnopodium floribundum Rolfe | T | * | * | * | * | |||
| Rubiaceae | Alseis yucatanensis Standl. | T | * | * | ||||
| Borreria verticillata (L.) G. Mey. | H | * | * | * | * | * | ||
| Bouvardia ternifolia (Cav.) Schltdlt. | H | * | * | * | ||||
| Morinda yucatanensis Greenm. | H | * | * | * | * | |||
| Sapindaceae | Cupania dentata DC. | T | * | * | * | * | ||
| Talisia floresii Standl. | T | * | * | |||||
| Sapotaceae | Chrysophyllum mexicanum Brandegee ex Standl. | T | * | * | * | * | * | |
| Manilkara zapota (L.) P. Royen | T | * | * | |||||
| Pouteria campechiana (Kunth) Baehni | T | * | * | * | * | * | * | |
| Pouteria reticulata (Engl.) Eyma | T | * | * | * | * | * | ||
| Simaroubaceae | Simarouba glauca DC. | T | * | * | * | * | * | |
| Urticaceae | Cecropia peltata L. | T | * | * | * | |||
| Verbenaceae | Stachytarpheta frantzii Pol. | H | * | |||||
| Zamiaceae | Zamia prasina W. Bull | H | * | * | * |
| Growth form | n | S. obs | m | qD | qD.LCL | qD.UCL | SC | SC.LCL | SC.UCL | |
|---|---|---|---|---|---|---|---|---|---|---|
| Quarry | 7349 | 50 | 1023 | 39.34 | 37.43 | 41.24 | 0.99 | 0.99 | 1 | |
| Target forest | 1023 | 47 | 1023 | 47 | 44.1 | 49.9 | 1 | 0.99 | 1 | |
| Quarry | Trees | 437 | 19 | 68 | 12.69 | 11.8 | 13.58 | 0.94 | 0.92 | 0.95 |
| Herbs | 6842 | 27 | 68 | 11.64 | 11.35 | 11.92 | 0.93 | 0.93 | 0.94 | |
| Lianas | 70 | 5 | 68 | 5 | 3.57 | 6.43 | 0.99 | 0.96 | 1 | |
| Target forest | Trees | 719 | 34 | 80 | 21.82 | 20.7 | 22.93 | 0.91 | 0.9 | 0.92 |
| Herbs | 203 | 9 | 80 | 7.65 | 6.57 | 8.73 | 0.98 | 0.97 | 0.99 | |
| Lianas | 101 | 4 | 80 | 3.99 | 3.69 | 4.28 | 1 | 0.99 | 1 |
| Quarry | Target Vegetation | |||||||||
|---|---|---|---|---|---|---|---|---|---|---|
| Herb layer | 1 | 2 | 3 | 4 | 5 | T1 | T2 | T3 | T4 | T5 |
| Cydista potosina | - | - | - | - | - | 146 | 180 | 216 | - | 110 |
| Borreria verticillata | 108 | 118 | 117 | 41 | 143 | - | - | - | - | - |
| Ichnanthus lanceolatus | - | - | - | - | - | 58 | 75 | 45 | 75 | 79 |
| Eragrostis secundiflora | - | 47 | 42 | 109 | - | - | - | - | - | - |
| Paspalum blodgettii | 35 | 39 | - | 44 | 47 | - | - | - | - | - |
| Paspalum sp. | 47 | 17 | 72 | - | - | - | - | - | - | - |
| Arrabidaea sp. | - | - | - | - | - | 62 | - | - | - | 42 |
| Viguiera dentata | - | - | - | - | - | - | - | - | 79 | - |
| Morinda yucatanensis | - | - | 22 | - | 13 | - | - | - | - | 43 |
| Bouvardia ternifolia | - | - | - | - | - | - | - | - | 76 | - |
| Chloris inflata | - | - | - | 24 | 50 | - | - | - | - | - |
| Digitaria ciliaris | 49 | - | - | - | - | - | - | - | - | - |
| Passiflora sp. | - | - | - | - | - | - | 22 | - | 22 | - |
| Cnidoscolus multilobus | - | - | - | - | - | - | - | 39 | - | - |
| Dendropanax arboreus | - | - | - | - | - | - | 22 | - | - | - |
| Zamia prasina | - | - | - | - | - | 21 | - | - | - | - |
| Tree layer | 1 | 2 | 3 | 4 | 5 | T1 | T2 | T3 | T4 | T5 |
| Lysiloma latisiliquum | - | - | - | 143 | 122 | 61 | 101 | - | 83 | - |
| Metopium brownei | 193 | - | 64 | 64 | 23 | - | - | - | 38 | - |
| Acacia collinsi | - | 300 | - | - | - | - | - | - | - | - |
| Caesalpinia gaumeri | - | - | 189 | - | - | - | - | - | - | - |
| Vitex gaumeri | - | - | - | 25 | - | - | 44 | 52 | - | 58 |
| Coccoloba cozumelensis | - | - | 23 | - | 59 | - | - | - | - | 47 |
| Bursera simaruba | 34 | - | - | - | - | 40 | 17 | - | 23 | - |
| Byrsonima crassifolia | 39 | - | 24 | 18 | - | - | - | - | - | - |
| Pouteria reticulata | - | - | - | - | - | 34 | - | - | 24 | - |
| Alseis yucatanensis | - | - | - | - | - | - | - | 48 | - | - |
| Croton reflexifoluis | - | - | - | - | - | - | 19 | - | - | 28 |
| Mimosa bahamensis | 34 | - | - | - | 11 | - | - | - | - | - |
| Pouteria campechiana | - | - | - | - | - | - | - | 45 | - | - |
| Diospyros salicifolia | - | - | - | - | - | 41 | - | - | - | - |
| Jatropha gaumeri | - | - | - | - | - | - | - | - | - | 25 |
| Piper neesiariuum | - | - | - | - | - | - | - | 21 | - | - |
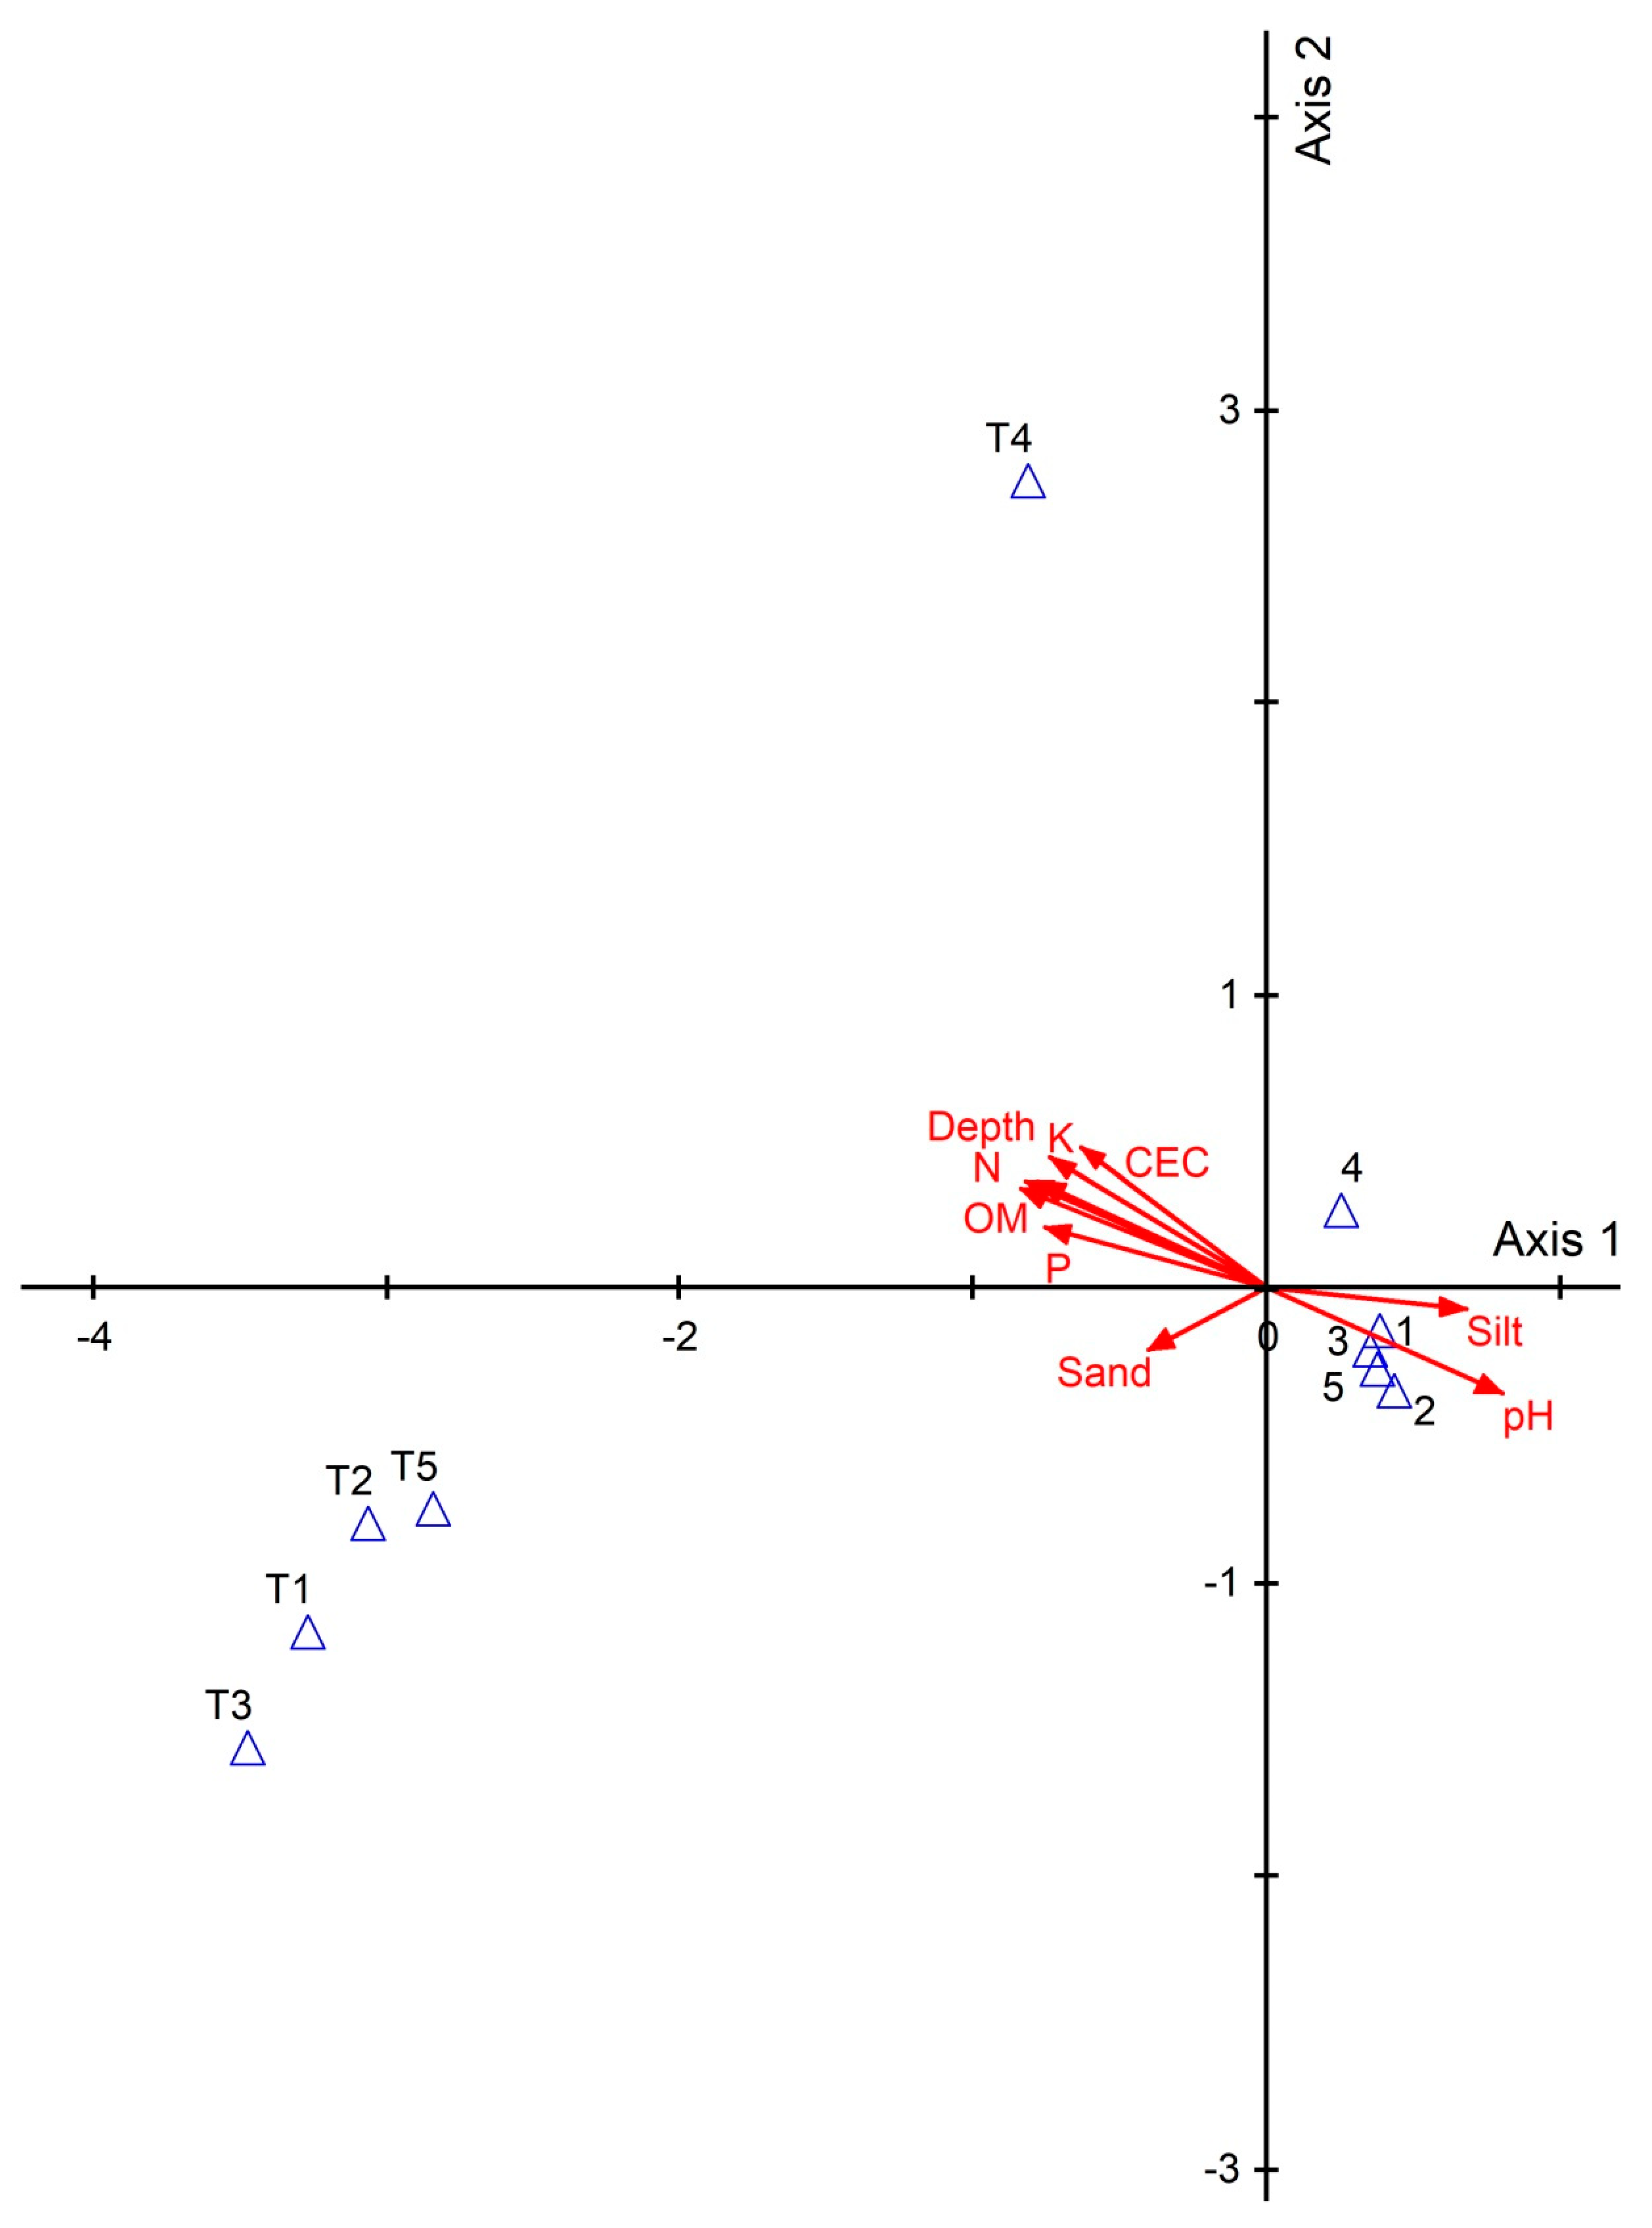
| Soil Variables | Value | Std.Error | DF | t-value | p-value | |
|---|---|---|---|---|---|---|
| Richness | P | 2.16146 | 0.59018 | 12 | 3.662346 | 0.0033 * |
| MO | −1.07686 | 3.89338 | 12 | −0.276587 | 0.7868 | |
| N | −2.75591 | 79.88714 | 12 | −0.034498 | 0.973 | |
| K | −0.00476 | 0.00889 | 12 | −0.535487 | 0.6021 | |
| CEC | 0.53992 | 0.14274 | 12 | 3.782563 | 0.0026 * | |
| pH | 3.64087 | 3.36148 | 12 | 1.083114 | 0.3 | |
| Abundance | P | 18.326 | 6.2714 | 12 | 2.9221351 | 0.0128 * |
| MO | 16.6783 | 41.4912 | 12 | 0.4019714 | 0.6948 | |
| N | −378.4637 | 851.7639 | 12 | −0.4443294 | 0.6647 | |
| K | −0.0465 | 0.0945 | 12 | −0.4923956 | 0.6313 | |
| CEC | 2.5481 | 1.5194 | 12 | 1.6770404 | 0.1194 | |
| pH | 59.8267 | 35.8774 | 12 | 1.6675331 | 0.1213 |
© 2019 by the authors. Licensee MDPI, Basel, Switzerland. This article is an open access article distributed under the terms and conditions of the Creative Commons Attribution (CC BY) license (http://creativecommons.org/licenses/by/4.0/).
Share and Cite
Valdez-Hernández, M.; Gil-Medina, R.; López-Martínez, J.O.; Torrescano-Valle, N.; Cabanillas-Terán, N.; Islebe, G.A. Succession and the Relationship between Vegetation and Soil in the Marl Quarries of the Yucatan Peninsula, Mexico. Forests 2019, 10, 116. https://doi.org/10.3390/f10020116
Valdez-Hernández M, Gil-Medina R, López-Martínez JO, Torrescano-Valle N, Cabanillas-Terán N, Islebe GA. Succession and the Relationship between Vegetation and Soil in the Marl Quarries of the Yucatan Peninsula, Mexico. Forests. 2019; 10(2):116. https://doi.org/10.3390/f10020116
Chicago/Turabian StyleValdez-Hernández, Mirna, Rossana Gil-Medina, Jorge O. López-Martínez, Nuria Torrescano-Valle, Nancy Cabanillas-Terán, and Gerald A. Islebe. 2019. "Succession and the Relationship between Vegetation and Soil in the Marl Quarries of the Yucatan Peninsula, Mexico" Forests 10, no. 2: 116. https://doi.org/10.3390/f10020116
APA StyleValdez-Hernández, M., Gil-Medina, R., López-Martínez, J. O., Torrescano-Valle, N., Cabanillas-Terán, N., & Islebe, G. A. (2019). Succession and the Relationship between Vegetation and Soil in the Marl Quarries of the Yucatan Peninsula, Mexico. Forests, 10(2), 116. https://doi.org/10.3390/f10020116