Article

Assessment of Genetic Diversity and Population Genetic Structure of Norway Spruce (Picea abies (L.) Karsten) at Its Southern Lineage in Europe. Implications for Conservation of Forest Genetic Resources

by
Srđan Stojnić
1,*,
Evangelia V. Avramidou
2,
Barbara Fussi
3,
Marjana Westergren
4,
Saša Orlović
1,
Bratislav Matović
1,
Branislav Trudić
1,
Hojka Kraigher
4,
Filippos A. Aravanopoulos
5 and
Monika Konnert
3
1
Institute of Lowland Forestry and Environment, University of Novi Sad, 21000 Novi Sad, Serbia
2
Laboratory of Forest Genetics and Biotechnology, Institute of Mediterranean Forest Ecosystems, HAO “DEMETER”, 11528 Athens, Greece
3
Bavarian Office for Forest Seeding and Planting, 83317 Teisendorf, Germany
4
Slovenian Forestry Institute, 1000 Ljubljana, Slovenia
5
Laboratory of Forest Genetics and Tree Breeding, Department of Forestry and Natural Environment, Aristotle University of Thessaloniki, 54124 Thessaloniki, Greece
*
Author to whom correspondence should be addressed.
Forests 2019, 10(3), 258; https://doi.org/10.3390/f10030258
Submission received: 5 February 2019 / Revised: 4 March 2019 / Accepted: 11 March 2019 / Published: 14 March 2019

Abstract

:
In the present paper we studied the genetic diversity and genetic structure of five Norway spruce (Picea abies (L.) Karsten) natural populations situated in Serbia, belonging to the southern lineage of the species at the southern margin of the species distribution range. Four populations occur as disjunct populations on the outskirts of the Dinaric Alps mountain chain, whereas one is located at the edge of Balkan Mountain range and, therefore, can be considered as ecologically marginal due to drier climatic conditions occurring in this region. Due to the negative effect of biotic and abiotic stress factors, the sustainability of these populations is endangered, making conservation of their genetic resources one of the key measures of Norway spruce persistence in Serbia under climatic changes. The insight on genetic diversity and genetic structure of the studied spruce populations can provide the information required for the initiation of programs aimed at the conservation and utilization of spruce genetic resources at the rear edge of species environmental limits. Norway spruce genetic variation and population genetic structure were estimated using eight EST-SSR markers. The results showed that mean expected heterozygosity was 0.616 and allelic richness 10.22. Genetic differentiation among populations was low (Fst = 0.007). No recent bottleneck effect or isolation by distance were detected. Bayesian clustering, obtained with STRUCTURE, grouped the populations into two genetic clusters, whereas UPGMA analysis distinguished three main groups approximately in line with the geographic area of occurrence. Based on the study results and the EUFORGEN Pan-European strategy for genetic conservation of forest trees, the establishment of additional dynamic gene conservation units must be considered in Serbia in order to protect the adaptive and neutral genetic diversity of the species.

1. Introduction

Norway spruce has a widespread natural distribution in Europe, spanning from the Balkan Peninsula and Italian Alps to Fennoscandia and European Russia [1,2]. In Southern Europe, Norway spruce survived the last glacial maximum in several distinct refugia from which the colonization process took place through different independent postglacial colonization routes, leading to the notable structuring of genetic variation in this region [1,3]. According to Ravazzi [4], Norway spruce populations in the Balkan Peninsula are divided into several fragmented distribution areas, while Serbian populations belong to the Western Balkan Mountains group. This is only partially true, since the majority of spruce forests in Serbia occur as disjunct populations within the Dinaric Alps mountain chain, with only discrete populations located in the south-eastern part of Serbia (i.e., at the outskirts of the Balkan Mountain Range). Indeed, Tollefsrud et al. [1] revealed that spruce populations in Serbia are closely related to those from the Western and Eastern Alps, as well as northern Carpathians, implying a common origin. On the other hand, the same study revealed the West Carpathians and southwest Bulgarian mountains as additional refugia, which according to Latałowa and van der Knaap [5] might be the source of Norway spruce populations situated in south-eastern Serbia, some of the southernmost Norway spruce natural stands in Europe.
Norway spruce forests in Southern Europe are negatively affected by various stress factors (e.g., drought stress, forest fires, pest and diseases, etc.), which spruce usually encounter simultaneously or sequentially [6,7]. Climatic change is projected to bring new challenges to spruce populations in this region due to predicted increase of air temperatures and altered precipitation patterns [8,9]. For example, Keren et al. [9] noticed that warm and dry summers are frequently followed by bark beetle outbreaks, which in turn cause a notable spruce decline. Indeed, studying the parallel genetic diversity of Norway spruce and Pityogenes chalcographus at the southernmost borderline of their distribution range, Avtzis and Aravanopoulos [10] found a significantly higher genetic diversity for the same gene in spruce bark beetle compared to the host, which might, in turn, provide a better evolutionary potential for adaptation of the insect to altered environmental conditions. Furthermore, Stojanović et al. [11] reported that significant change of Norway spruce bioclimatic niche in Serbia might be expected by the end of 21st century.
The characterization of genetic diversity pattern at intra- and inter-population levels is a fundamental requirement for the establishment of programs aimed at conservation of forest genetic resources [12]. Population genetic diversity has a substantial effect on both individual fitness and population adaptive capacity [13], thereby playing a vital role in ensuring species capability to withstand various biotic and abiotic stressors and evolve under altered environmental conditions [14]. Populations grown close to the southern edge of a species environmental limits may contain additional diversity due to adaptation to conditions that differ from those prevailing in the core of its distribution range. Therefore, genetic conservation of Norway spruce populations at the southern limit of the species distribution range is important at the European level as such populations can be used for securing stability and resilience of more northerly populations, through assisted gene flow [15].
In order to characterize genetic diversity of Norway spruce populations in Serbia, we used expressed sequence tags microsatellite markers (EST-SSR). Although showing a lower polymorphism in spruce than genomic microsatellites (SSRs) [16,17,18], the advantage of EST-SSR markers is that their polymorphism is associated with transcribed sequences, thus reflecting the variation in the expressed part of a genome [17,18]. Likewise, linkage of EST-SSRs with coding sequences may be useful in identification of genes controlling certain phenotypic traits, as well as the study of stress related functional variation [19,20]. For example, Fluch et al. [20] detected certain EST-SSR loci (e.g., locus Pa_51) in expressed genes which are considered to be extremely important in many physiological processes related to the response of plants to biotic and abiotic stress. Therefore, genetic diversity and population genetic structure of Norway spruce in Serbia have been estimated using eight EST-SSRs markers. The study included five populations covering the species natural distribution range, enabling the assessment of the overall genetic diversity of spruce in Serbia.

2. Materials and Methods

2.1. Plant Material and DNA Isolation

The study included five natural Norway spruce populations from Serbia (Table 1; Figure 1). In total 150 adult trees were analyzed (30 per population). Needles were collected from trees located at 30–50 m from each other. Total DNA extraction was carried out according to the ATMAB method [21].

2.2. EST-SSR Data Analysis

We used eight fluorescent EST-SSR primer pairs from the spruce Genome British Columbia expressed sequence tag-simple sequence repeats (EST-SSRs) according to Rungis et al. [16] and Fluch et al. [20] (Table 2). All primers were combined into three multiplex sets: set 1 consisted of WS00716.F13, WS0092.M15, and WS0022.B15; set 2 comprised WS0073.H08 and WS00111.K13; and set 3 contained WS0023.B03, Pa44, and Pa51. Reverse primers were labelled for use in CEQ 8000 sequencer (BECKMAN COULTER CO., Pasadena, CA, USA). For EST-SSR analysis, amplification was performed in a total volume of 25 μL including 30 ng of total genomic DNA, according to the Qiagen Multiplex PCR Master Mix instructions, which were used in the preparation of the multiplexes for all samples, RNase free water and Primer Mixes.
PCR amplifications were performed in a Biometra Professional Termocycler (Analytik Jena, Jena, Germany) as follows: an initial step of 15 min at 95 °C, followed by 30 cycles, each one including 30 s at 94 °C for denaturation, 90 s at 53/55/62 °C (depending on the multiplex set used) for annealing, and 30 s at 72 °C for elongation. A 30-min step at 72 °C was programmed as a final extension. PCR reactions were prepared according to manufacturer’s instructions for CEQ 8000 sequencer and results were analyzed using the accompanying software.

2.3. Data Analysis

2.3.1. EST-SSR Variation and Genetic Diversity within Populations

Effective numbers of alleles (Ne), observed heterozygosity (Ho), expected heterozygosity (He), and Shannon’s Information Index (I) were calculated using PopGene32 [23]. Allelic richness (AR) and private allelic richness (pAR; alleles which are unique to a particular population), were calculated using the hierarchical rarefaction method available in HP-RARE [24]. The inbreeding coefficient (Fis) was calculated for each locus with FSTAT [25]. Allele frequency estimation and comparison between observed and Hardy–Weinberg expected heterozygote frequencies were computed using the maximum likelihood method described in Kalinowski and Taper [26] with ML-Null software for all loci. Presence of null alleles, long allele dropout, and scoring errors were tested with Micro-Checker [27]. Following null allele detection, Fis, Ho, and He were also estimated after removing three loci (WS022.B15, WS0023.B03, and Pa51), where null allele frequency exceeded 8% [28,29].
In addition, conformance to the Hardy–Weinberg equilibrium was determined by assessing the significance of the Fis values by means of Fisher’s exact tests implemented in GENEPOP [30] with specified Markov chain parameters of 5000 dememorization steps, followed by 1000 batches of 5000 iterations per batch. The sequential Bonferroni correction was applied to obtain critical confidence limits for all multiple comparisons, with an initial probability p = 0.05.
Furthermore, we used the program Bottleneck v.1.2.02 [31] to test for recent population bottlenecks using the five loci. A Wilcoxon’s sign rank test was used to compare expected heterozygosity from the Hardy–Weinberg equilibrium with predicted heterozygosity at mutation-drift equilibrium, on the basis of the observed allele number [31]. The program was run under a two-phase model of mutation (TPM) and stepwise mutation model (STM). We tested the significance levels using 10,000 simulation iterations.

2.3.2. Genetic Divergence between Populations

Fst [32] was calculated in order to estimate what proportion of the total genetic variation was the result of differentiation between populations using SpaGeDi v.1.4 [33]. A total of 10,000 randomizations were used to determine the statistical significance of the estimates; means and significant values over loci, populations, and subdivisions were obtained by bootstrapping, and Bonferroni’s corrections were applied to adjust critical values in case of multiple comparisons.
Genotypic disequilibrium between all pairs of loci was tested with GENEPOP, and Bonferroni correction was applied. Analysis of molecular variance (AMOVA [34,35]), which is the hierarchical distribution of genetic variation among and within populations for the five markers, was assessed with GenAlEx 6 software [36]. The tests were implemented using estimates of ΦST based on distances calculated from allelic data. Tests of significance were performed using 9999 permutations within the total dataset. Estimation of number of migrants (Nm) based on the private allele method was also implemented in GENEPOP [30].
Unbiased genetic distances and their significance among populations were estimated according to Nei [37] by using SpaGeDi [33]. The relationships among populations were investigated using an unweighted pair group method using arithmetic means (UPGMA) dendrograms based on Nei’s [37] genetic distances using POPTREE2 [38], and bootstrapping (number of replicates: 1000) was also implemented.
A model-based Bayesian clustering method was applied to the data to infer genetic structure and define the number of clusters (gene pools) in the dataset using the software STRUCTURE, version 2.3.2 [39]. Data was explored using the admixture model and sampling locations as priors, which are considered most appropriate for detecting structure among populations that are likely to be similar due to migration or shared ancestry [40]. Parameters were set as follows: 10 replicates of each simulation from K = 1 to K = 5 with a burn in of 100,000 steps followed by 10,000 Markov chain—Monte Carlo iterations. In order to estimate the best number of distinct clusters and to average the results of the replicated runs, CLUMPAK software [41] was used. A Mantel test based on 9999 permutations was performed for genetic (GD) and geographical distances (GGD) in GenAlEx, as it is the most commonly used method to evaluate the relationship between geographic distance and genetic divergence [42].

3. Results

3.1. EST-SSR Variation and Genetic Diversity within Populations

A total of 113 alleles were observed across the eight loci studied in the 150 individuals (Table 3). The number of alleles per locus (Na) ranged from 2 (Pa51) to 29 (WS00111.K13), with an average value of 14.12 per locus.
Effective number of alleles (Ne) varied between 1.034 (Pa51) and 22.114 (WS00111.K13), with an average of 9.152 per locus. Average genetic diversity (He) within populations for all EST-SSR loci studied was 0.629. Shannon Information Index (I) ranged from 0.085 for Pa51 to 3.191 for WS00111.K13, with a mean value of 1.764.
The mean frequency of null alleles (fn) was 0.154 and ranged from 0 for loci Ws0092.M15 and Pa44, to 0.782 for locus Pa51. Three loci (WS0022.B15, WS0023.B03, and Pa51) with null alleles frequency >8% were excluded from all subsequent analysis. Fis ranged from −0.050 (Pa51) to 0.365 (WS0023.B03), with an average value of 0.067 alleles per locus. Genetic differentiation (Fst) of individual loci varied in the range between 0.000 (WS0092.M15, WS0073.H08, Pa44, and Pa51) and 0.0016 (WS00716.F13), with an average value of 0.007 per single locus.
From Micro-checker ver.2.2.0.3 analysis, no evidence of large alleles dropout, scoring of stutter peaks, and not amplified values was found for any locus. According to Hardy–Weinberg equilibrium, homozygote excess was indicated for locus WS0023.B03 and significantly deviated from zero after Bonferroni correction for all populations.
Genotypic disequilibrium was analyzed for all pairs of EST-SSR markers for each population and across all populations. No significant departure from equilibrium at 5% was found.

3.2. Genetic Variation within and between Populations

The number of effective alleles (Ne) varied between 6.46 in the population Kopaonik and 7.98 in population Golija, with an average of 6.97 effective alleles per individual population. The expected heterozygosity (He) was similar across the populations and ranged from 0.606 (Tara) to 0.635 (Golija), respectively. Allelic richness (AR) ranged from 9.70 (Stara Planina) to 11.04 (Golija). Private allelic richness (pAR) ranged from 0.13 (Kopaonik) to 0.72 (Zlatar) (Table 4).
The genetic divergence between studied populations was examined by computing pairwise Nei’s genetic distances and Fst (Table 5). Nei’s [37] unbiased genetic distances values ranged from 0.000 (Golija vs. Kopaonik) to 0.032 (Stara Planina vs. Zlatar).
The overall level of genetic differentiation detected by FSTAT between the studied populations was low (Fst = 0.007, p > 0.05). This is also confirmed by the results of the AMOVA, which showed that the majority of the variation was found within populations (99%), rather than among populations (1%) (Table 6). The results of the Mantel test showed a lack of correlation between genetic divergence and geographic distances (R2 = 0.0041; p = 0.059) among the studied populations, indicating no isolation by distance. The number of detected migrants between all populations after correction for size was five (Nm = 4.957).
The results of Bayesian clustering revealed two Norway spruce gene pools in Serbia (Figure 2). Group I included populations from Kopaonik, Zlatar, and Golija, whereas Group II included populations Stara Planina and Tara.
The UPGMA dendrogram with bootstrap values was created to depict the genetic relationships among the studied populations (Figure 3). The populations were clustered into three groups. Group I consisted of three populations—Zlatar and Golija, which are the most similar ones, and Kopaonik, which is very close both geographically and genetically to the previously mentioned populations. The westernmost population, Tara, belonged to Group II, whereas Group III included the population Stara Planina, located on the south-east of Serbia. This last group is the most differentiated from the group Zlatar–Golija–Kopaonik.
The two-phase mutation and stepwise mutation models under Wilcoxon sign-rank test and shift mode test were performed to identify recent bottleneck in the studied Norway spruce populations. The heterozygosity excess values were not significant (p < 0.05) under all the models in all the populations (Table 7).

4. Discussion

Nuclear microsatellites have been extensively employed in studying genetic variation of coniferous tree species [12,43,44,45,46]. In the present study, genetic variation within and between populations and their genetic structure were analyzed in five natural populations of Norway spruce from Serbia, using eight EST-SSR markers. The study aimed at making recommendations concerning the future conservation strategies of the species genetic resources at the Southern European distribution margin. We found that the number of alleles ranged between 2 (locus Pa51) and 29 (locus WS00111.K13). Interestingly, the number of alleles for the latter EST-SSR locus was high, but similar results have been reported by other authors for the same locus; e.g., Máchová et al. [47] found 34 alleles per population on the same locus, whereas Unger et al. [48] and Cvjetković et al. [49] reported 28 and 20 alleles per population on this locus, respectively.
Norway spruce is known as a species characterized by high level of heterozygosity, as well as low level of populations’ genetic differentiation even at a large scale [50]. We observed higher expected heterozygosity across Serbian Norway spruce populations than previously reported using the same EST-SSR markers. Indeed, a slightly higher mean He per population, but not with a statistically significant difference, was detected by our study in comparison to populations from Bosnia and Herzegovina, considering seven mutual loci (WS00716.F13, WS0092.M15, WS0022.B15, WS0073.H08, WS00111.K13, WS0023.B03, Pa44) (0.71 vs. 0.68) [49]. Furthermore, mean He across five common loci (WS00716.F13, WS0022.B15, WS0073.H08, WS00111.K13, WS0023.B03) was slightly higher (0.89) in Serbian populations in comparison to those observed in Tyrol (0.87) and the Czech republic (0.86) [47,48]. Numerous studies using SSRs evidenced that geographically widespread tree species showed significantly higher intra-population genetic diversity than variation among populations (e.g., [51,52]). Also here, the major proportion of gene diversity was harbored within populations, with only minor share partitioning among them. Likewise, a very low overall genetic differentiation among studied Norway spruce populations in Serbia was detected (0.007). The observed value of Fst was lower than it was previously reported for this species using genomic SSR (Fst = 0.050, [44]; Fst = 0.088, [53]; Fst = 0.029, [43]), EST-SSRs (Fst = 0.026, [49]), and a combination of genomic and EST-SSR markers (Fst = 0.011, [47]). On the other hand, genetic differentiation among Serbian populations was higher than Unger et al. [48] reported for three Tyrol populations (Fst = 0.002) using EST-SSR markers and Westergren et al. [46] for Slovenian core and marginal populations (Fst = 0.002), using genomic SSRs. Furthermore, the results of the Mantel test showed that genetic divergence was not correlated to geographic distances among the populations indicating that isolation by distance did not shape present genetic variability of Norway spruce in Serbia. Generally, marginal populations tend to show higher genetic differentiation than populations from the center of the distribution range for the same species as reported by Petit et al. [54]. Indeed, Pandey and Rajora [55] found that peripheral populations of Thuja occidentalis were more genetically differentiated than the central populations. Likewise, Ganopoulos et al. [56] found higher differentiation of Greek wild cherry rear-edge populations compared to central populations from Western Europe. However, results also depend on the type of genetic markers used and the number of loci.
The STRUCTURE analysis revealed that, despite the large geographic distance, the population Tara (Dinaric Alps) showed higher similarity with the population Stara Planina, which is situated in eastern Serbia (Balkan Mountain Range), rather than with the geographically closer populations Golija, Zlatar, and Kopaonik (Dinaric Alps). The same pattern was observed for K = 3, 4, and 5, while a slight variation in membership proportions of individual clusters between Tara and Stara Planina was seen. However, their similarity was higher compared to other populations (results not shown). According to Fst, the population Stara Planina significantly differentiates from populations Golija, Zlatar, and Kopaonik, while it was only marginally differentiated from population Tara (p = 0.053), in accordance with the STRUCTURE results. In the UPGMA dendrogram, the four populations belonging to the Dinaric Alps mountain chain, displayed a tendency to cluster together; populations Golija and Zlatar, which are geographically the closest ones and belong to the same range continuum (with the absence of a physical barrier between them), formed a genetic cluster together with the population Kopaonik, which grows on the outskirts of the Dinarides, thus representing a transition between the Dinaric Alps mountain chain and the Rhodope Mountains. Populations Tara (which is located westernmost) and Stara Planina (which belongs to the mesic phytogeographic region, whereas the remaining four populations belong to the Illyrian-mesic phytogeographic region) were clearly separated in the dendrogram from the other populations. Differentiation of population Tara may be the consequence of a climatic historical event that has occurred in this area. Tara Mountain is the natural habitat of the Tertiary relic species, the Serbian spruce (Picea omorica (Pančić) Purk.), which spanned across a wide area in the past but survived the last glacial maximum in the refugia located at Tara. Moreover, EST-SSRs are potentially subjected to the effects of natural selection constrains, therefore being directly associated with coding genes [16,47]. For example, EST-SSR loci WS0073.H08 and WS00716.F13, which were used in this study, were described to match remorin 1 protein and β-glucosidase protein, respectively [16]. According to Checker and Khurana [57], remorin 1 is involved in hormone-mediated responses and signal transduction pathways in response to various abiotic stresses and plant development. Similarly, the β-glucosidase protein has a wide range of functions, including roles in defense, recycling of cell-wall oligosaccharides, phytohormone signaling, secondary metabolism, and scent release, among others [58]. Therefore, populations Stara Planina and Tara may have been separated due to different selection pressures influenced by specific climatic conditions that induced biotic and abiotic stressors in comparison to the remaining three populations; i.e., the drier continental climate at the Balkan Mountain Range and the oceanic mesoclimate, with cold winter temperatures and heavy snow followed by hot dry summers, at Tara Mountain.
A low level of overall genetic differentiation found between three out of the five of the studied populations (supported by Fst, UPGMA, and Structure analysis) may result from combined effect of different factors, such as outcrossing rate, reproductive system, and high rate of pollen-mediated gene flow in this species [45]. Namely, due to low average pollen grain weight and low sedimentation velocity [48], pollen from coniferous tree species can travel tens or hundreds of kilometers, providing gene flow across a wide distribution area [50]. For example, studying the recent Norway spruce colonization process of the treeline area in the Eastern Alps, Piotti et al. [59] revealed that due to intensive gene flow from outside, only 11.1% of the juveniles originated exclusively from local parents. The high rate of gene flow among the studied populations was also confirmed by the high number of migrants (Nm = 4.96), which reduces genetic differentiation among populations [60,61].
The investigated populations were characterized by low genetic differentiation; no evidence of recent bottlenecks was found. This implies the absence of earlier drift and is therefore likely in agreement with the low differentiation observed. A low level of genetic differentiation among populations of Norway spruce is common even across an extended geographical range. Indeed, Tollefsrud et al. [62] reported a low genetic differentiation (Fst = 0.029) among 37 populations (1715 trees) covering a large continuum over Northern Europe, Baltic countries and Russia.

Conservation of Norway Spruce Forest Genetic Resources in Serbia

The information on genetic variation and genetic structure of Norway spruce populations in Serbia can provide a basis for the implementation of programs for conservation and utilization of spruce genetic resources in the future. Our research revealed that Norway spruce populations in Serbia are characterized by high genetic diversity (i.e., expected heterozygosity). Reed and Frankham [63] documented a strong positive correlation between heterozygosity and population fitness, which is important for the long-term adaptation of populations to novel environmental conditions.
Besides heterozygosity, certain authors identified allelic richness as a more suitable parameter for conservation purposes [52,64,65]. Discussing selection of candidate populations for conservation based on molecular marker studies, Petit et al. [54] stated that allelic richness should get priority over heterozygosity because it is highly dependent on effective population size and provides better information concerning past evolutionary history. Likewise, allelic resources are crucial for population persistence and adaptation to altered selection pressures [13]. Our results showed that AR was similar across studied populations and ranged between 9.70 (Stara Planina) and 11.04 (Golija). The higher AR observed in population Golija compared to population Stara Planina might be due to larger population sizes. To our best knowledge, no previous study examined allelic richness (AR) or private allelic richness (pAR) in Norway spruce using EST-SSRs, thus we are unable to compare our results with any previously reported. Nevertheless, numerous studies documented a high correlation between population size and allelic richness in certain woody and herbaceous species [66,67,68].
Concerning the in situ conservation of Norway spruce in Serbia, a number of primarily protected areas have been established so far, as large parts of spruce forests in Serbia are situated within the territories of the Tara and Kopaonik National Parks. However, at the European level, only one population from Serbia (Zlatar) is included into the European conservation network of gene conservation units (GCUs) within the EUFORGEN program. Taking into account the results from our analysis, at least one more GCU should be established, covering the population Stara Planina and, if possible, also Tara Mountain. Likewise, taking into account EUFORGEN’s recommendation that at least one conservation unit per country for each environmental zone should be identified [69], the establishing of aforementioned GCUs would perfectly fit this objective (i.e., one GCU would exist across all environmental zones occurring in Serbia).
While some authors believe that in situ conservation can be efficiently done in protected areas [22], previous experience from Serbia showed that this approach should be taken with caution. Studying Norway spruce dieback across several sites located at the Kopaonik National Park, Matović et al. [70] reported highest mortality in the dimensional and age homogenous even-aged spruce stands among which the nature reserve stands predominated. Likewise, Griess et al. [71] reported that spruce monocultures show lower resistance to different ecological disturbances such as drought, wind throws, insect calamities, etc. For that reason, Matović et al. [70] recommended avoiding the creation of nature reserves in pure stands of ecologically unstable Norway spruce, especially when the age and dimensional structural diversity are poorly expressed. On the other hand, active management, including establishment of seed stands, as well as promotion of natural regeneration, may prevent a decrease of population sizes and loss of genetic variability, thereby ensuring long-term conservation of forest genetic resources [72]. Nevertheless, because of the disjunct natural range of Norway spruce in Serbia, the establishment of small gene reserve forests is justified in parts where the species occurs on small areas and these stands could potentially add value to the network, i.e., in the form of new allelic variants. In other parts of the distribution range, larger units should be founded in order to cover spatial genetic variation of the species [73].

5. Conclusions

In the present study, eight EST-SSR markers were employed to estimate genetic diversity within and among five natural populations of Norway spruce in Serbia (i.e., populations situated at the southern edge of the species distribution range). The results showed slightly higher gene diversity across common loci than was previously reported in the available literature. Neither recent bottleneck effect nor correlation between genetic divergence and geographic distances (isolation by distance) were evident in the studied populations.
Considering the results, we suggest a conservation strategy based on the establishment of additional in situ GCUs across the distribution range in Serbia to cover the spatial genetic variability of the species. As the differentiation between populations is low, the results of this study should be interpreted with caution. Still, we suggest designating two additional GCUs as a precaution. In particular, we suggest establishing one more covering the genetic variability of population Stara Planina, in addition to the already established GCU, Zlatar. We also suggest establishing a second GCU in location Tara, as it presents a unique combination of genepool and ecological conditions compared to Zlatar and Stara Planina.

Author Contributions

S.O., M.K., H.K., and F.A.A. conceived the ideas, designed the study, and coordinated research activities. B.M., S.S., and B.T. collected the needle samples on the field. B.T. and B.F. performed laboratory analyses. E.V.A. and M.W. conducted the statistical analysis. S.S., E.V.A., and M.W. wrote the first version of the manuscript, and all the authors contributed critically to the drafts and gave final approval for publication.

Funding

This research received no external funding.

Acknowledgments

This study was conducted under the project “Spruce and Oak Genetic Structure” (SOGeneS) supported by FP7 project Trees 4 Future—Transnational Access.

Conflicts of Interest

The authors declare no conflicts of interest.

References

  1. Tollefsrud, M.M.; Kissling, R.; Gugerli, F.; Johnsen, Ø.; Skrøppa, T.; Cheddadi, R.; van der Knaap, W.O.; Latałowa, M.; TerHürne-Berson, R.; Litt, T. Genetic consequences of glacial survival and postglacial colonization in norway spruce: Combined analysis of mitochondrial DNA and fossil pollen. Mol. Ecol. 2008, 17, 4134–4150. [Google Scholar] [CrossRef]
  2. Tsuda, Y.; Chen, J.; Stocks, M.; Källman, T.; Sønstebø, J.H.; Parducci, L.; Semerikov, V.; Sperisen, C.; Politov, D.; Ronkainen, T. The extent and meaning of hybridization and introgression between siberian spruce (Picea obovata) and norway spruce (Picea abies): Cryptic refugia as stepping stones to the west? Mol. Ecol. 2016, 25, 2773–2789. [Google Scholar] [CrossRef] [PubMed]
  3. Sperisen, C.; Büchler, U.; Mátyás, G. Genetic variation of mitochondrial DNA reveals subdivision of norway spruce (Picea abies (L.) Karst.). In Molecular Tools for Screening Biodiversity; Springer: Berlin, Germany, 1998; pp. 413–417. [Google Scholar]
  4. Ravazzi, C. Late quaternary history of spruce in Southern Europe. Rev. Palaeobot. Palynol. 2002, 120, 131–177. [Google Scholar] [CrossRef]
  5. Latałowa, M.; van der Knaap, W.O. Late quaternary expansion of norway spruce Picea abies (L.) Karst. in Europe according to pollen data. Quat. Sci. Rev. 2006, 25, 2780–2805. [Google Scholar] [CrossRef]
  6. Kesić, L.; Matović, B.; Stojnić, S.; Stjepanović, S.; Stojanović, D. Climate change as a factor reducing the growth of trees in the pure norway spruce stand (Picea abies (L.) H. Karst.) in the National park “Kopaonik”. Topola/Poplar 2016, 197–198, 25–34. [Google Scholar]
  7. Marković, Č.; Stojanović, A. Differences in bark beetle (Ips typographus and Pityogenes chalcographus) abundance in a strict spruce reserve and the surrounding spruce forests of Serbia. Phytoparasitica 2010, 38, 31–37. [Google Scholar] [CrossRef]
  8. Lindner, M.; Maroschek, M.; Netherer, S.; Kremer, A.; Barbati, A.; Garcia-Gonzalo, J.; Seidl, R.; Delzon, S.; Corona, P.; Kolström, M. Climate change impacts, adaptive capacity, and vulnerability of European forest ecosystems. For. Ecol. Manag. 2010, 259, 698–709. [Google Scholar] [CrossRef]
  9. Keren, S.; Motta, R.; Govedar, Z.; Lucic, R.; Medarevic, M.; Diaci, J. Comparative structural dynamics of the janj mixed old-growth mountain forest in Bosnia and Herzegovina: Are conifers in a long-term decline? Forests 2014, 5, 1243–1266. [Google Scholar] [CrossRef]
  10. Avtzis, D.; Aravanopoulos, F. Host tree and insect genetic diversity on the borderline of natural distribution: A case study of Picea abies and Pityogenes chalcographus (Coleoptera, Scolytinae) in Greece. Silva Fenn. 2011, 45, 157–164. [Google Scholar] [CrossRef]
  11. Stojanović, D.B.; Matović, B.; Orlović, S.; Kržič, A.; Trudić, B.; Galić, Z.; Stojnić, S.; Pekeč, S. Future of the main important forest tree species in Serbia from the climate change perspective. SEEFOR 2014, 5, 117–124. [Google Scholar] [CrossRef]
  12. Belletti, P.; Ferrazzini, D.; Ducci, F.; De Rogatis, A.; Mucciarelli, M. Genetic diversity of Italian populations of Abies alba. Dendrobiology 2017, 77, 147–159. [Google Scholar] [CrossRef]
  13. Markert, J.A.; Champlin, D.M.; Gutjahr-Gobell, R.; Grear, J.S.; Kuhn, A.; McGreevy, T.J.; Roth, A.; Bagley, M.J.; Nacci, D.E. Population genetic diversity and fitness in multiple environments. BMC Evol. Biol. 2010, 10, 205. [Google Scholar] [CrossRef]
  14. Koskela, E.; Ollikainen, M.; Pukkala, T. Biodiversity conservation in commercial boreal forestry: The optimal rotation age and retention tree volume. For. Sci. 2007, 53, 443–452. [Google Scholar]
  15. Fady, B.; Aravanopoulos, F.A.; Alizoti, P.; Mátyás, C.; von Wühlisch, G.; Westergren, M.; Belletti, P.; Cvjetkovic, B.; Ducci, F.; Huber, G.; et al. Evolution-based approach needed for the conservation and silviculture of peripheral forest tree populations. For. Ecol. Manag. 2016, 375, 66–75. [Google Scholar] [CrossRef]
  16. Rungis, D.; Bérubé, Y.; Zhang, J.; Ralph, S.; Ritland, C.E.; Ellis, B.E.; Douglas, C.; Bohlmann, J.; Ritland, K. Robust simple sequence repeat markers for spruce (Picea spp.) from expressed sequence tags. Theor. Appl. Genet. 2004, 109, 1283–1294. [Google Scholar] [CrossRef]
  17. Gupta, P.; Rustgi, S.; Sharma, S.; Singh, R.; Kumar, N.; Balyan, H. Transferable EST-SSR markers for the study of polymorphism and genetic diversity in bread wheat. Mol. Genet. Genomics 2003, 270, 315–323. [Google Scholar] [CrossRef]
  18. Hu, J.; Wang, L.; Li, J. Comparison of genomic SSR and EST-SSR markers for estimating genetic diversity in cucumber. Biol. Plant. 2011, 55, 577–580. [Google Scholar] [CrossRef]
  19. Feng, S.; Li, W.; Huang, H.; Wang, J.; Wu, Y. Development, characterization and cross-species/genera transferability of EST-SSR markers for rubber tree (Hevea brasiliensis). Mol. Breed. 2009, 23, 85–97. [Google Scholar] [CrossRef]
  20. Fluch, S.; Burg, A.; Kopecky, D.; Homolka, A.; Spiess, N.; Vendramin, G.G. Characterization of variable EST SSR markers for norway spruce (Picea abies L.). BMC Res. Notes 2011, 4, 401. [Google Scholar] [CrossRef]
  21. Dumolin, S.; Demesure, B.; Petit, R. Inheritance of chloroplast and mitochondrial genomes in pedunculate oak investigated with an efficient pcr method. Theor. Appl. Genet. 1995, 91, 1253–1256. [Google Scholar] [CrossRef]
  22. Skrøppa, T. EUFORGEN Technical Guidelines for Genetic Conservation and Use for Norway Spruce (Picea abies); Bioversity International: Rome, Italy, 2003. [Google Scholar]
  23. Yeh Francis, C.; Yang, R.; Boyle Timothy, B.; Ye, Z.; Mao Judy, X. POPGENE Version 1.32, the User-Friendly Shareware for Population Genetic Analysis; Molecular Biology and Biotechnology Centre, University of Alberta: Alberta, AB, Canada, 1999; Available online: http://www.ualbertaca/~fyeh/ (accessed on 6 December 2018).
  24. Kalinowski, S.T. HP-RARE 1.0: A computer program for performing rarefaction on measures of allelic richness. Mol. Ecol. Resour. 2005, 5, 187–189. [Google Scholar] [CrossRef]
  25. Goudet, J. FSTAT (version 1.2): A computer program to calculate F-statistics. J. Hered. 1995, 86, 485–486. [Google Scholar] [CrossRef]
  26. Kalinowski, S.T.; Taper, M.L. Maximum likelihood estimation of the frequency of null alleles at microsatellite loci. Conserv. Genet. 2006, 7, 991–995. [Google Scholar] [CrossRef]
  27. Van Oosterhout, C.; Hutchinson, W.F.; Wills, D.P.; Shipley, P. MICRO-CHECKER: Software for identifying and correcting genotyping errors in microsatellite data. Mol. Ecol. Notes 2004, 4, 535–538. [Google Scholar] [CrossRef]
  28. Dakin, E.; Avise, J. Microsatellite null alleles in parentage analysis. Heredity 2004, 93, 504. [Google Scholar] [CrossRef]
  29. Chapuis, M.-P.; Estoup, A. Microsatellite null alleles and estimation of population differentiation. Mol. Biol. Evol. 2006, 24, 621–631. [Google Scholar] [CrossRef]
  30. Raymond, M. GENEPOP (version 1.2): Population genetics software for exact tests and ecumenicism. J. Hered. 1995, 86, 248–249. [Google Scholar] [CrossRef]
  31. Piry, S.; Luikart, G.; Cornuet, J. BOTTLENECK: A computer program for detecting recent reductions in the effective population size using allele frequency data. J. Hered. 1999, 90, 502–503. [Google Scholar] [CrossRef]
  32. Weir, B.S.; Cockerham, C.C. Estimating F-statistics for the analysis of population structure. Evolution 1984, 38, 1358–1370. [Google Scholar]
  33. Hardy, O.J.; Vekemans, X. SPAGeDi: A versatile computer program to analyse spatial genetic structure at the individual or population levels. Mol. Ecol. Notes 2002, 2, 618–620. [Google Scholar] [CrossRef]
  34. Excoffier, L.; Smouse, P.E.; Quattro, J.M. Analysis of molecular variance inferred from metric distances among DNA haplotypes: Application to human mitochondrial DNA restriction data. Genetics 1992, 131, 479–491. [Google Scholar]
  35. Michalakis, Y.; Excoffier, L. A generic estimation of population subdivision using distances between alleles with special reference for microsatellite loci. Genetics 1996, 142, 1061–1064. [Google Scholar]
  36. Peakall, R.; Smouse, P.E. GENALEX 6: Genetic analysis in Excel. Population genetic software for teaching and research. Mol. Ecol. Resour. 2006, 6, 288–295. [Google Scholar] [CrossRef]
  37. Nei, M. Estimation of average heterozygosity and genetic distance from a small number of individuals. Genetics 1978, 89, 583–590. [Google Scholar]
  38. Takezaki, N.; Nei, M.; Tamura, K. POPTREE2: Software for constructing population trees from allele frequency data and computing other population statistics with Windows interface. Mol. Biol. Evol. 2009, 27, 747–752. [Google Scholar] [CrossRef]
  39. Pritchard, J.K.; Stephens, M.; Donnelly, P. Inference of population structure using multilocus genotype data. Genetics 2000, 155, 945–959. [Google Scholar]
  40. Falush, D.; Stephens, M.; Pritchard, J.K. Inference of population structure using multilocus genotype data: Linked loci and correlated allele frequencies. Genetics 2003, 164, 1567–1587. [Google Scholar]
  41. Kopelman, N.M.; Mayzel, J.; Jakobsson, M.; Rosenberg, N.A.; Mayrose, I. CLUMPAK: A program for identifying clustering modes and packaging population structure inferences across K. Mol. Ecol. Resour. 2015, 15, 1179–1191. [Google Scholar] [CrossRef]
  42. Mantel, N. The detection of disease clustering and a generalized regression approach. Cancer Res. 1967, 27, 209–220. [Google Scholar]
  43. Gutkowska, J.; Borys, M.; Tereba, A.; Tkaczyk, M.; Oszako, T.; Nowakowska, J.A. Genetic variability and health of norway spruce stands in the Regional Directorate of the State Forests in Krosno. For. Res. Pap. 2017, 78, 56–66. [Google Scholar] [CrossRef]
  44. Meloni, M.; Perini, D.; Binelli, G. The distribution of genetic variation in norway spruce (Picea abies Karst.) populations in the Western Alps. J. Biogeogr. 2007, 34, 929–938. [Google Scholar] [CrossRef]
  45. Radu, R.G.; Curtu, L.A.; Spârchez, G. Genetic diversity of norway spruce [Picea abies (L.) Karst.] in romanian carpathians. Ann. For. Res. 2014, 57, 19. [Google Scholar] [CrossRef]
  46. Westergren, M.; Bozic, G.; Kraigher, H. Genetic diversity of core vs. peripheral norway spruce native populations at a local scale in Slovenia. iForest 2018, 11, 104. [Google Scholar] [CrossRef]
  47. Máchová, P.; Trčková, O.; Cvrčková, H. Use of nuclear microsatellite loci for evaluating genetic diversity of selected populations of Picea abies (L.) Karsten in the Czech Republic. Forests 2018, 9, 92. [Google Scholar] [CrossRef]
  48. Unger, G.; Konrad, H.; Geburek, T. Does spatial genetic structure increase with altitude? An answer from Picea abies in Tyrol, Austria. Plant Syst. Evol. 2011, 292, 133–141. [Google Scholar] [CrossRef]
  49. Cvjetković, B.; Konnert, M.; Fussi, B.; Mataruga, M.; Šijačić-Nikolić, M.; Daničić, V.; Lučić, A. Norway spruce (Picea abies Karst.) variability in progeny tests in Bosnia and Herzegovina. Genetika 2017, 49, 259–272. [Google Scholar] [CrossRef]
  50. Scotti, I.; Paglia, G.; Magni, F.; Morgante, M. Population genetics of norway spruce (Picea abies Karst.) at regional scale: Sensitivity of different microsatellite motif classes in detecting differentiation. Ann. For. Sci. 2006, 63, 485–491. [Google Scholar] [CrossRef]
  51. Hamrick, J.L.; Godt, M.J.W.; Sherman-Broyles, S.L. Factors influencing levels of genetic diversity in woody plant species. In Population Genetics of Forest Trees; Springer: Berlin, Germany, 1992; pp. 95–124. [Google Scholar]
  52. Porth, I.; El-Kassaby, Y.A. Assessment of the genetic diversity in forest tree populations using molecular markers. Diversity 2014, 6, 283–295. [Google Scholar] [CrossRef]
  53. Nowakowska, J.A.; Zachara, T.; Konecka, A. Genetic variability of scots pine (Pinus sylvestris L.) and norway spruce (Picea abies L. Karst.) natural regeneration compared with their maternal stands. For. Res. Pap. 2014, 75, 47–54. [Google Scholar] [CrossRef]
  54. Petit, R.J.; El Mousadik, A.; Pons, O. Identifying populations for conservation on the basis of genetic markers. Conserv. Biol. 1998, 12, 844–855. [Google Scholar] [CrossRef]
  55. Pandey, M.; Rajora, O.P. Higher fine-scale genetic structure in peripheral than in core populations of a long-lived and mixed-mating conifer-eastern white cedar (Thuja occidentalis L.). BMC Evol. Biol. 2012, 12, 48. [Google Scholar] [CrossRef]
  56. Ganopoulos, I.; Aravanopoulos, F.A.; Argiriou, A.; Kalivas, A.; Tsaftaris, A. Is the genetic diversity of small scattered forest tree populations at the southern limits of their range more prone to stochastic events? A wild cherry case study by microsatellite-based markers. Tree Genet. Genomes 2011, 7, 1299–1313. [Google Scholar] [CrossRef]
  57. Checker, V.G.; Khurana, P. Molecular and functional characterization of mulberry EST encoding remorin (MiREM) involved in abiotic stress. Plant Cell Rep. 2013, 32, 1729–1741. [Google Scholar] [CrossRef]
  58. La Camera, S.; L’Haridon, F.; Astier, J.; Zander, M.; Abou-Mansour, E.; Page, G.; Thurow, C.; Wendehenne, D.; Gatz, C.; Métraux, J.P. The glutaredoxin ATGRXS13 is required to facilitate Botrytis cinerea infection of Arabidopsis thaliana plants. Plant J. 2011, 68, 507–519. [Google Scholar] [CrossRef]
  59. Piotti, A.; Leonardi, S.; Piovani, P.; Scalfi, M.; Menozzi, P. Spruce colonization at treeline: Where do those seeds come from? Heredity 2009, 103, 136. [Google Scholar] [CrossRef]
  60. Slatkin, M. A measure of population subdivision based on microsatellite allele frequencies. Genetics 1995, 139, 457–462. [Google Scholar]
  61. Shi, X.; Wen, Q.; Cao, M.; Guo, X.; Xu, L.-A. Genetic diversity and structure of natural quercus variabilis population in china as revealed by microsatellites markers. Forests 2017, 8, 495. [Google Scholar] [CrossRef]
  62. Tollefsrud, M.M.; Sønstebø, J.H.; Brochmann, C.; Johnsen, Ø.; Skrøppa, T.; Vendramin, G.G. Combined analysis of nuclear and mitochondrial markers provide new insight into the genetic structure of North European Picea abies. Heredity 2009, 102, 549. [Google Scholar] [CrossRef]
  63. Reed, D.H.; Frankham, R. Correlation between fitness and genetic diversity. Conserv. Biol. 2003, 17, 230–237. [Google Scholar] [CrossRef]
  64. Aravanopoulos, F. Genetic monitoring in natural perennial plant populations. Botany 2011, 89, 75–81. [Google Scholar] [CrossRef]
  65. Bashalkhanov, S.; Pandey, M.; Rajora, O.P. A simple method for estimating genetic diversity in large populations from finite sample sizes. BMC Genet. 2009, 10, 84. [Google Scholar] [CrossRef]
  66. Jacquemyn, H.; Roldán-Ruiz, I.; Honnay, O. Evidence for demographic bottlenecks and limited gene flow leading to low genetic diversity in a rare thistle. Conserv. Genet. 2010, 11, 1979–1987. [Google Scholar] [CrossRef]
  67. Murray, B.; Young, A. Widespread chromosome variation in the endangered grassland forb Rutidosis leptorrhynchoides F. Muell. (Asteraceae: Gnaphalieae). Ann. Bot.-Lond. 2001, 87, 83–90. [Google Scholar] [CrossRef]
  68. Tomimatsu, H.; Ohara, M. Genetic diversity and local population structure of fragmented populations of Trillium camschatcense (Trilliaceae). Biol. Conserv. 2003, 109, 249–258. [Google Scholar] [CrossRef]
  69. De Vries, S.; Alan, M.; Bozzano, M.; Burianek, V.; Collin, E.; Cottrell, J.; Ivankovic, M.; Kelleher, C.; Koskela, J.; Rotach, P. Pan-European strategy for genetic conservation of forest trees and establishment of a core network of dynamic conservation units. In European Forest Genetic Resources Programme (EUFORGEN); Bioversity International: Rome, Italy, 2015. [Google Scholar]
  70. Matović, B.S.D.; Kesić, L.; Stjepanović, S. Uticaj klime na prirast i vitalnost smrče na Kopaoniku. Topola/Poplar 2018, 201/202, 99–116. [Google Scholar]
  71. Griess, V.C.; Acevedo, R.; Härtl, F.; Staupendahl, K.; Knoke, T. Does mixing tree species enhance stand resistance against natural hazards? A case study for spruce. For. Ecol. Manag. 2012, 267, 284–296. [Google Scholar] [CrossRef]
  72. Zong, J.-W.; Zhao, T.-T.; Ma, Q.-H.; Liang, L.-S.; Wang, G.-X. Assessment of genetic diversity and population genetic structure of Corylus mandshurica in China using SSR markers. PLoS ONE 2015, 10, e0137528. [Google Scholar] [CrossRef]
  73. Koski, V.; Skrøppa, T.; Paule, L.; Wolf, H.; Turok, J. Technical Guidelines for Genetic Conservation of Norway Spruce Picea abies (L.) Karst.); Bioversity International: Rome, Italy, 1997. [Google Scholar]
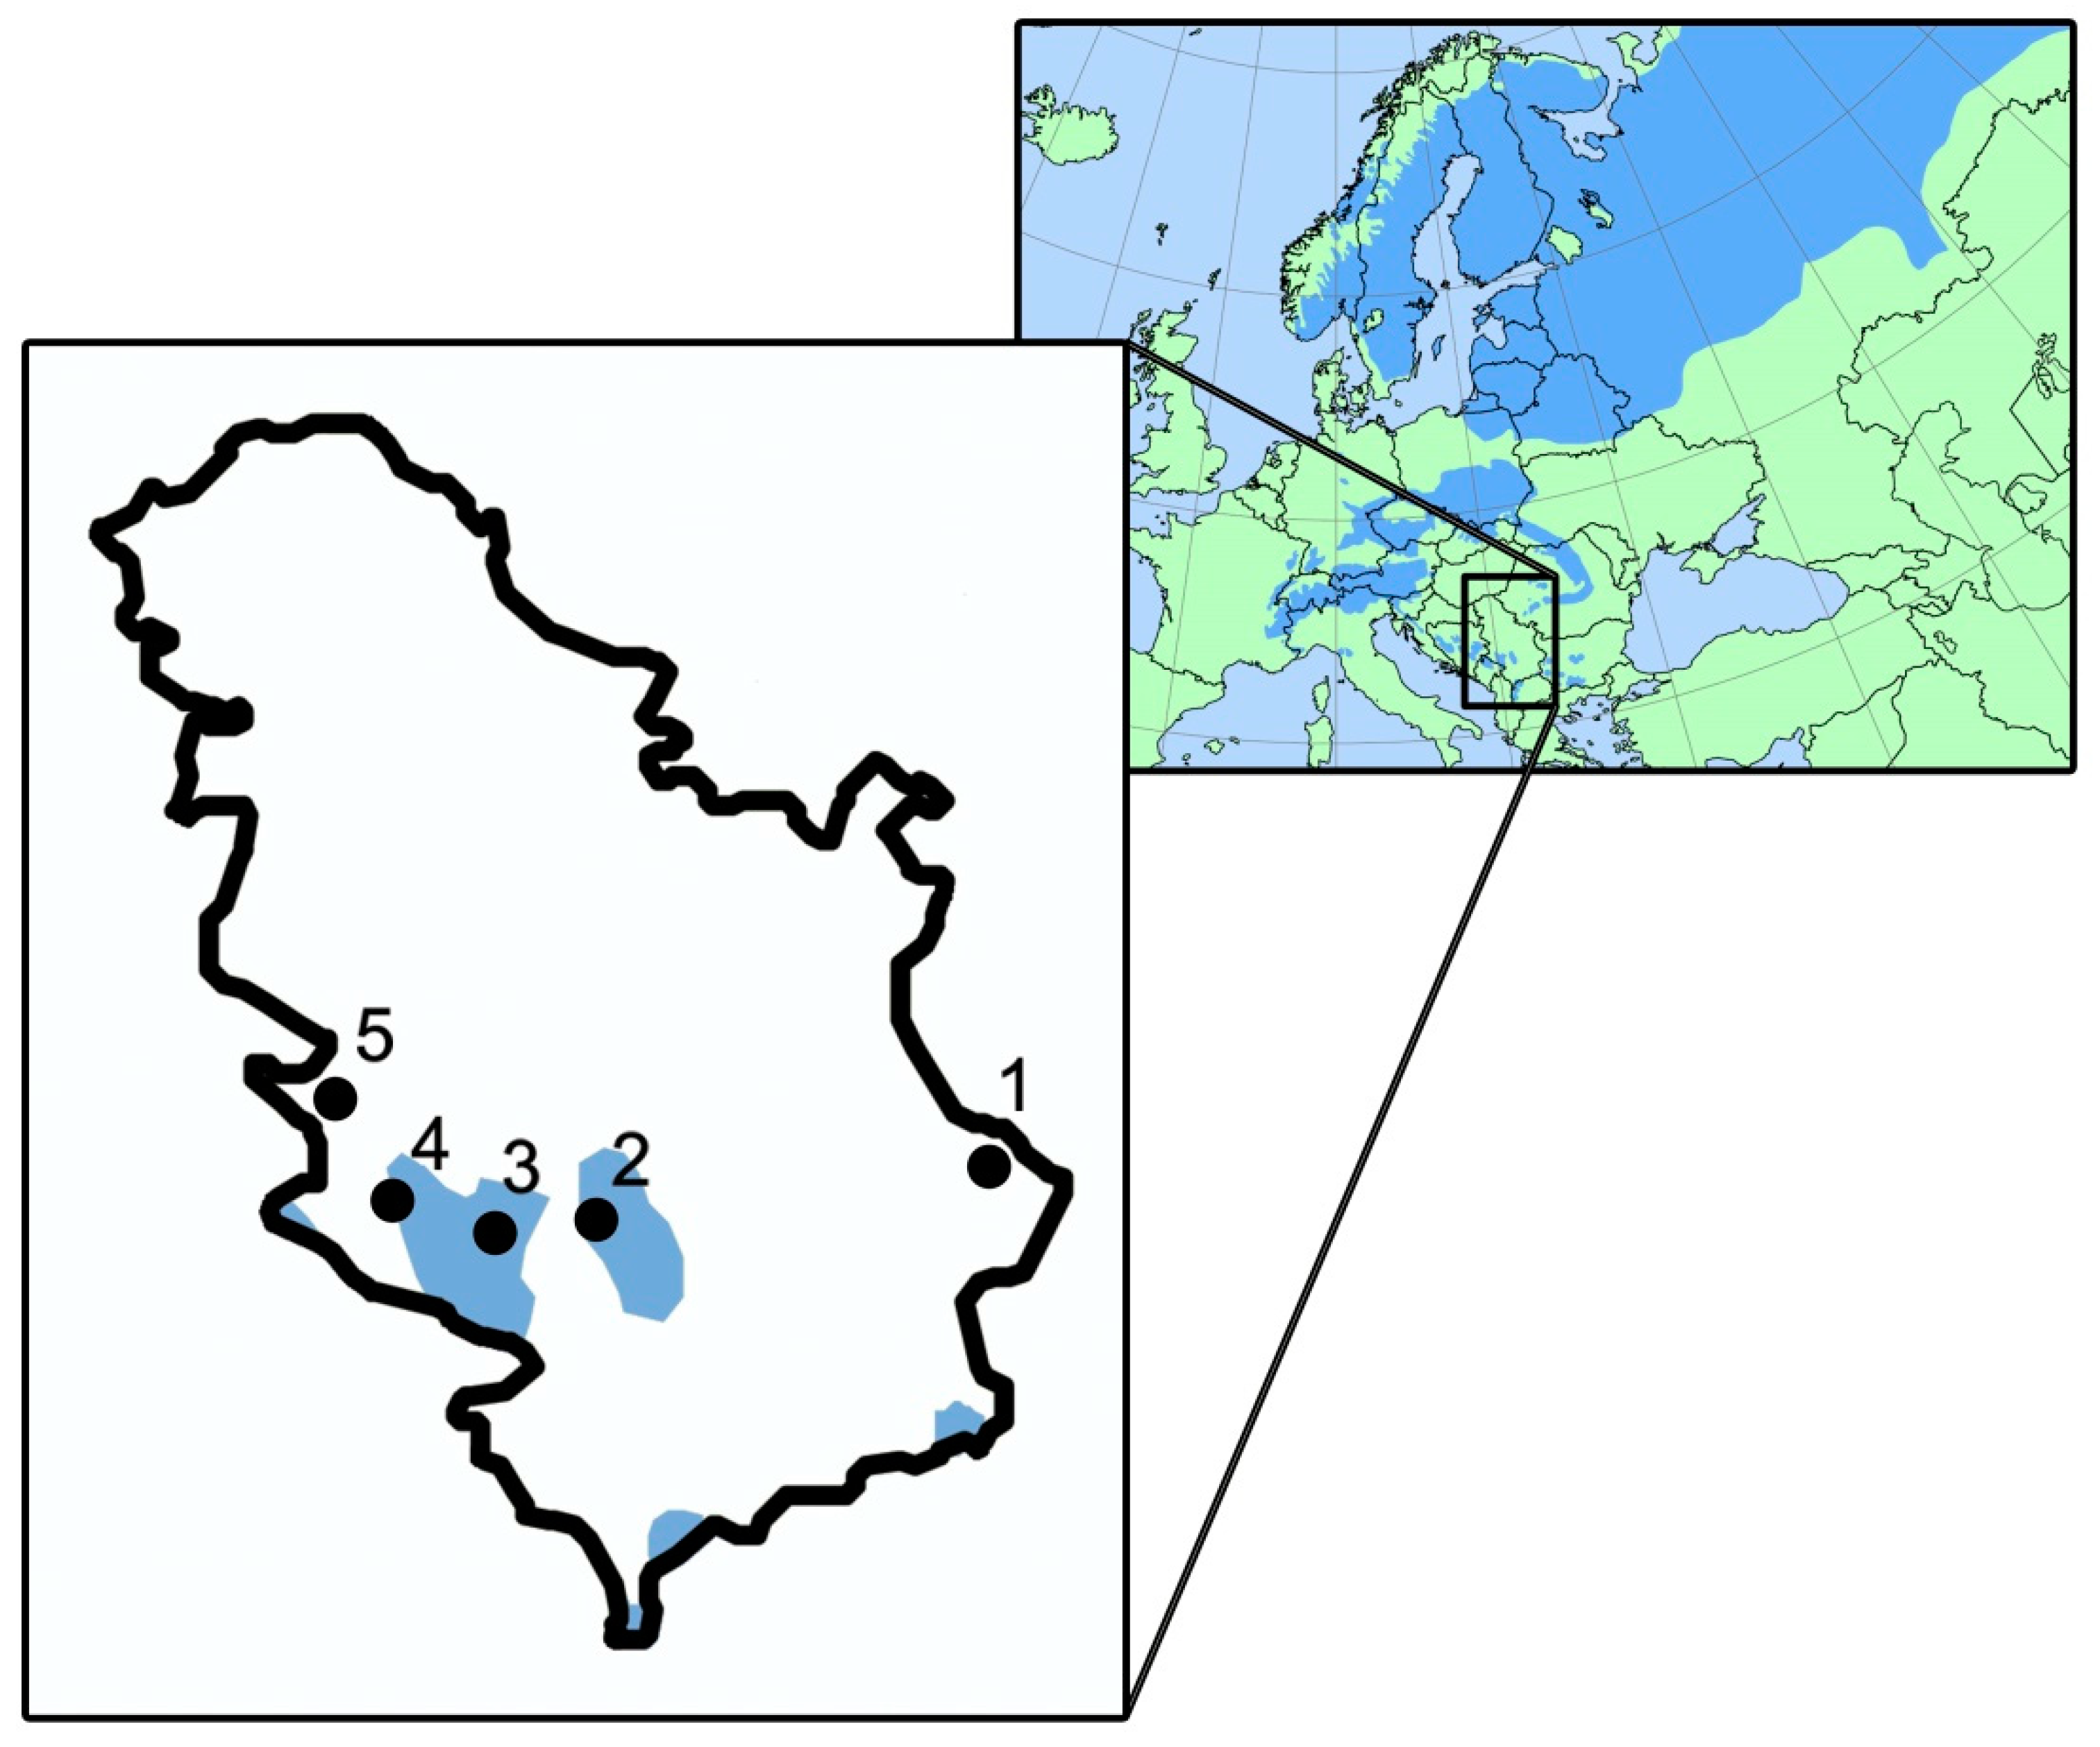
Figure 1. Geographical locations of Norway spruce populations in the study. The numbers indicate populations as presented in Table 1. The blue area represents the natural distribution range of Norway spruce (after: Skrøppa [22]).
Forests 10 00258 g001
Figure 2. Results from structure analysis of Norway spruce populations when K = 2.
Forests 10 00258 g002
Figure 3. UPGMA tree using Nei’s [37] genetic distance. Population number is given inside brackets. Bootstrap values are presented at the branch intersections.
Forests 10 00258 g003
Table 1. Population names, geographic coordinates, altitude, mean air temperature, and annual sum of precipitations.
NoPopulationMountain RangeLatitude (dd.mm)Longitude (dd.mm)Altitude
(m a.s.l.)
Mean Air Temperature (°C )Annual Sum of Precipitation (mm)
1Stara PlaninaBalkan Mt43°18′22°47′13007.5634
2KopaonikDinaric Alps43°18′20°46′15306.5753
3GolijaDinaric Alps43°18′20°17′16506.0757
4ZlatarDinaric Alps43°26′19°49′12006.4739
5TaraDinaric Alps43°53′19°31′10008.6823
Table 2. Analyzed loci of Norway spruce populations, sequences of microsatellite primers, repeat motifs, fragment length (bp), and specific primer annealing temperatures (Ta).
LocusPrimer Sequences (5′-3′)Repeat MotifFragment Length (bp)Ta (°C)
WS00716.F13 1TCAAGTAATGGACAAACGATACA
TTTCCAATAGAATGGTGGATTT
(GA)10214–32053
WS0092.M15 1GATGTTGCAGGCATTCAGAG
GCACCAGCTCGATTGACTA
(TCC)6204–21653
WS0022.B15 1 TTTGTAGGTGCTGCAGAGAT
TGGCTTTTATTCCAGCAAGA
(AG)12160–22053
WS0073.H08 1TGCTCTCTTATTCGGGCTTC
AAGAACAAGGTTCCCAATG
(AT)14209–26555
WS00111.K13 1GACTGAAGATGCCGATATGC
GGCCATATCTCAAAATAAAGAA
(AT)9181–23755
WS0023.B03 1AGCAFGTGGGGTCAAAGTT
AAAGAAAGCATGCATATGACTCAG
(AT)10170–22462
Pa44 2AAGGCAGCAAAGTGAGAA
CTTGGCATTCCCTAGTGAGC
(GGA)n271–30562
Pa51 2CAGATGTGGGCACTTGTTTG
TGGTCATGGTGGTGTTCAT
(CCA)n124–14562
1 Rungis et al. [16]. 2 Fluch et al. [20].
Table 3. Characteristics of EST-SSR loci across five investigated Norway spruce populations.
LocusNaNeIHoHeFstFisfn
WS00716.F132215.2802.8360.0600.9340.016−0.0150.003
WS0092.M1531.6770.6660.4730.4030.000−0.3010.000
WS0022.B15 179.1792.4310.1940.8910.0110.0900.218
WS0073.H0863.4421.4090.3170.7090.0000.0450.003
WS00111.K132922.1143.1910.0810.9540.0120.0310.021
WS0023.B032619.2993.0740.3970.9480.0020.365 *0.177
Pa4481.1940.4170.8270.1620.000−0.0070.000
Pa5121.0340.0850.9660.0330.000−0.0500.782
Mean14.129.1521.7640.4140.6290.0070.0670.154
St. Dev. 8.671.2710.3320.377
Legend: * statistically significant, Na (number of alleles), Ne (number of effective alleles), I (Shannon’s information index), observed heterozygosity (Ho), He (Nei’s 1973; expected heterozygosity), Fst (fixation index), Fis (inbreeding coefficient), fn (null allele frequency).
Table 4. Genetic diversity parameters at the population level based on five loci: Ne (number of effective alleles), He (expected heterozygosity), I (Shannon’s information index), AR (allelic richness), Fis (inbreeding coefficient), pAR (private allelic richness), Fst (gene differentiation coefficient).
PopulationNeHeIARpARFisFis after Null Allele CorrectionFst
Stara Planina6.6210.6121.5749.860.520.091−0.441
Kopaonik6.4620.6171.5879.700.130.0740.002
Golija7.9840.6351.70611.040.400.084−0.353
Zlatar7.1450.6111.61910.460.720.083−0.017
Tara6.6250.6061.57610.060.230.012−0.037
Mean6.9670.6161.61210.220.400.069−0.1690.007 *
Legend: * statistically significant.
Table 5. Nei’s [37] unbiased genetic distance (below diagonal) and pairwise Fst (above diagonal) among five Norway spruce populations in Serbia, calculated at five loci. Statistically significant departures from zero (Fst) at α = 0.05 are marked with an asterisk (*).
PopulationStara PlaninaKopaonikGolijaZlatarTara
Stara Planina-0.009 *0.012 *0.019 *0.008
Kopaonik0.016 *-0.0000.0000.010 *
Golija0.020 *0.000-0.0000.003
Zlatar0.032 *0.0000.000-0.008 *
Tara0.0120.016 *0.0020.012 *-
Table 6. Analysis of molecular variance (AMOVA) for 150 individuals in five populations of Norway spruce.
Source of VariationdfSSVariance ComponentTotal VarianceF-Statisticp Value
Among populations418.5930.04710.0140.005
Within populations145470.1673.24399
Total149488.7603.290100
Legend: df—degrees of freedom; SS—sum of squares.
Table 7. Wilcoxon signed-rank tests for heterozygosity excess and mode shift under two-phase mutation model (TPM) and stepwise mutation model (SMM). Statistically significant deviation from equilibrium is present if the value is less than 0.05.
PopulationPop IDTPM ModelSMM ModelMode Shift
Stara Planina10.6250.062Normal
Kopaonik20.6250.625Normal
Golija30.6250.812Normal
Zlatar40.8130.812Normal
Tara50.6250.812Normal

