Differentiation and Non-Linear Responses in Temporal Phenotypic Plasticity of Seasonal Phenophases in a Common Garden of Crataegus monogyna Jacq.


1
Department of Forest Ecology and Management, Research Institute for Nature and Forest, Gaverstraat 4, B-9500 Geraardsbergen, Belgium
2
Department of Bioengineering Technology TC, University of Leuven, Kleinhoefstraat 4, B-2440 Geel, Belgium
*
Author to whom correspondence should be addressed.
Forests 2019, 10(4), 293; https://doi.org/10.3390/f10040293
Submission received: 16 February 2019
/
Revised: 16 March 2019
/
Accepted: 19 March 2019
/
Published: 27 March 2019
(This article belongs to the Special Issue Genetic and Morphological Variation in Tropical and Temperate Plant Species)
Abstract
:Phenology in perennial plants implies the temporal occurrence of biological events throughout the year. Heritable phenotypic plasticity in the timing of the phenophases can be of importance in the adaptation of woody species to a quickly changing environment. We observed the timing of bud burst, flower opening, leaf senescence and leaf fall in two successive years in a common garden of Crataegus monogyna Jacq. in Belgium, consisting of six local and five non-local provenances. Data were processed with cumulative logistic mixed models. Strong auto-correlation was present among the spring phenophases as well as among the autumnal phenophases, with spring phenophases being negatively correlated with fall phenophases. The strongest between-provenance differentiation was found for the timing of bud burst in spring, followed by flower opening and finally by leaf senescence and leaf fall. Warmer spring temperatures in March 2017 advanced the timing of bud burst, and to a lesser extent of flower opening, in all provenances compared to 2016. However, the advancement was non-linear among the provenances, with the lower latitude provenances being relatively less early and the higher elevation provenances being more late than the local provenances in this year. It can be hypothesized that non-local provenances display larger temporal phenotypic plastic responses in the timing of their spring phenophases compared to local provenances when temperatures in the common garden deviate more from their home-sites.
1. Introduction
Woody plants are sessile and perennial organisms that are characterized by long generation times and slow migration rates [1]. Therefore, it is expected that woody species can adapt relatively quickly to changing local environmental conditions [2]. The capacity for evolutionary change depends on the standing genetic variation in tree populations [3] and climate is a major driver of evolutionary change over longer time scales [4]. Understanding the genetic basis of complex polygenic traits in woody plants that are clearly influenced by climate is therefore a current challenge in forest genetic research. Because all individuals in a common garden share the same environment, any average difference in a trait between provenances of the same species has a genetic origin. The genetic variation in fitness-related traits is typically estimated in open pollinated progeny tests in common garden experiments, including the estimation of differentiation between provenances [5,6], and the study of this variation has its place in the field of quantitative genetics [7].
The seasonal cycle in deciduous woody plant species of temperate regions is characterized by the timing of bud burst and flowering in spring and by the timing of bud formation, leaf senescence and leaf shedding in autumn. These phenophases can deviate between genetically differentiated populations and are believed to be adaptive, responding to selection induced by environmental change [5,8,9]. The timing of the phenophases marking the beginning and the end of the yearly growing season maximizes the annual growth while minimizing the risk of frost damage in spring and autumn. Frost can damage woody plants at high fitness costs [10]. Late frosts in spring can damage the soft tissues of young leaves, whereas early frosts in autumn may cause early leaf abscission, hindering the resorption of nutrients. In addition, early frosts are also known to damage the cambial zone in trees [11].
The timing of bud burst and leaf unfolding vary considerably among tree species, responding to divergent climatic conditions [3,5]. Bud burst can be the main trait that is affected by climate mediated selection [3]. Selection on timing of bud burst can be sufficiently strong to counteract the homogenizing effect of gene flow [12,13]. Rising spring temperatures advance the onset of the growing season in many woody species of the temperate zone, prolonging the growing season and thus affecting plant productivity and the global carbon balance [14,15,16]. On the other hand, late frosts in spring may hamper early flushing species in a global warming scenario [17]. Because of its adaptive nature and the easy assessment from an early age onward, spring flushing is frequently evaluated in common gardens [5,18]. Within the same woody species, population differentiation for bud burst, as observed in common garden experiments, typically follows clines along gradients of elevation and/or latitude of the home-sites of the populations [5,19,20] possibly due to different temperature requirements that are genetically determined [21]. The genetic variation in timing of bud burst, together with divergent selection, is believed to have allowed tree species in temperate regions to occupy large distribution ranges [22]. Within populations, individual trees display variable timing of bud burst, which is suggested to have a genetic cause [23]. Individual trees in a population can therefore be categorized as early, intermediate and late phenological forms [24]. Neutral genetic marker analysis showed that late bud burst forms of Fagus sylvatica L. in natural populations in Poland displayed higher within-population genetic variation in comparison to the early forms, suggesting that late spring frosts shape the neutral genetic structure of the populations [24]. Finally, no relationship was found between the timing of cambial activity and the timing of bud burst in Quercus robur L. [23].
Flowering and the subsequent fruit formation are part of the sexual reproductive cycle in plants. Reproductive phenology is sensitive to environmental cues such as temperature, moisture and herbivory [25]. Divergent timing of flowering can stimulate assortative mating in populations of woody plants, reducing gene flow and promoting population differentiation [25]. The timing of flowering varies strongly among woody angiosperm species and can occur before, during or after bud burst. For instance, pollen emission concurs with leaf unfolding in oaks. Assortative mating through long-distance pollen flow is therefore suggested to interact with local adaptation of bud burst [3,26]. In general, timing of bud burst and flowering are most likely auto-correlated in temperate tree species [26,27].
The emergence and growth of new spring foliage in temperate deciduous trees relies strongly on the nutrients that were resorbed during the preceding leaf senescence [28]. The timing of leaf senescence is affected by both photoperiod and temperature [29,30,31,32] while the timing of bud burst is primarily influenced by temperature [33,34]. It shows less year-to-year variability in comparison with timing of bud burst and is concomitant with less favorable conditions for photosynthesis [29]. In 59 tree species, the timing of autumnal leaf senescence displayed a pattern according to the climatic clines of the home-sites of the studied populations, which was clearer than the pattern observed in bud burst timing [5]. But, in a common garden experiment of Quercus petraea (Matt.) Liebl. composed of populations derived from the same geographic region but from deviating elevations, the population differentiation for autumnal leaf senescence did not correlate with the elevation of the origin [3]. There is no consensus concerning the factors controlling the leaf senescence process [29,35]. Leaves that emerged after a late spring frost in beech and oak displayed higher photosynthesis rates and a delayed leaf senescence in autumn, compensating for spring frost damage and demonstrating that long-lived trees can adapt their autumnal phenology depending on preceding productivity [36]. The spring phenophases of bud burst and flowering, and the timing of leaf senescence and leaf abscission are most probably strongly auto-correlated. Therefore, it is suggested that leaf fall can be used as a proxy for leaf senescence, assuming a certain time delay [30].
The range of phenotypes that a plant can express as a function of the environment is called phenotypic plasticity. Genetically controlled, heritable phenotypic plasticity has the potential to influence plant evolution [37]. Species that are able to adjust their phenological responses to warming spring temperatures by earlier bud burst or earlier flowering show better performance when compared with less responsive species [38]. Because of their longevity, phenotypic plasticity may play an important role in the adaptation of woody perennials to the predicted climate change [39]. Studying responses of provenances of woody species in a common garden not only allows assessment of the differentiation among the provenances that is shaped by divergent selection, e.g. [40]. Also, repeated observations in successive years allow the estimation of phenotypic plastic reactions to variable meteorological conditions in the garden over time. We planted a common garden in Belgium consisting of Crataegus monogyna Jacq., a common shrub species in western Europe, including local and non-local provenances, and studied the seasonal phenophases that mark the growth cycle of woody plants. Using neutral (non-adaptive) molecular markers, high levels of genetic diversity within populations, but low levels of population differentiation, were found in this species [41]. We hypothesized that: (i) the timing of bud burst, flower opening, leaf senescence and leaf fall differ between local and non-local provenances; (ii) the timing of the four phenophases display varying degrees of within-provenance and between-provenance variation; (iii) spring phenophases are strongly auto-correlated, as well as autumnal phenophases; and (iv) the non-local provenances respond in a non-linear way, in comparison with the local provenances, to the variable meteorological conditions in the common garden environment in two successive years (variable temporal phenotypic plasticity among the provenances) which can be related to the home-site conditions of the non-local provenances.
2. Materials and Methods
2.1. Common Garden
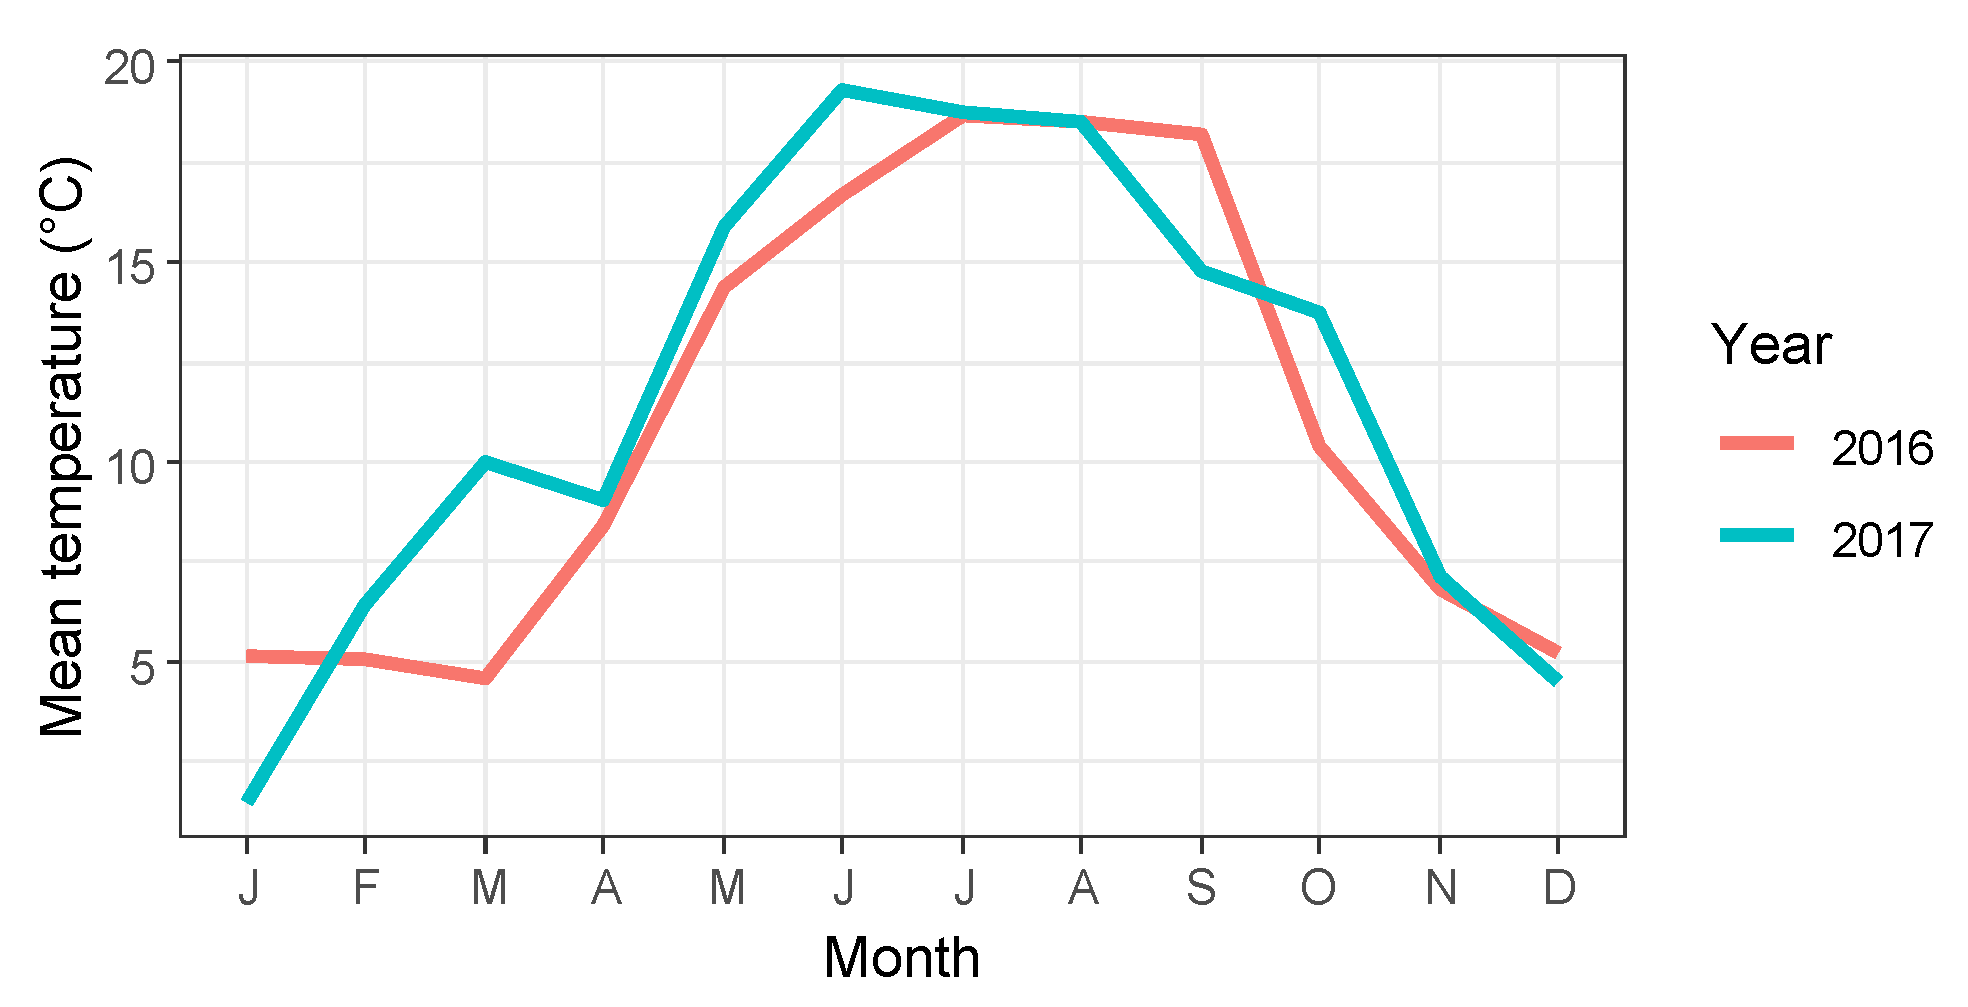
A description of the provenances, the seed collection, the growth of the plants and the planting of the common garden have already been reported in [42]. In short, the common garden consisted of six local Flemish provenances (northern part of Belgium), two Walloon provenances (southern part of Belgium), one provenance from the UK, one from Italy and one from Hungary (Table 1). The Belgian (Flemish and Walloon) provenances were collected by the authors and grown in the nursery of the research institute in Geraardsbergen, Belgium, whereas the UK, Italian and Hungarian provenances were grown in adjacent nursery beds in a Flemish forest nursery, under a sales contract. For the collection of the seeds in the Belgian populations, care was taken to collect from C. monogyna, excluding Crataegus laevigata (Poir.) DC. individuals and individuals with a putative hybridogenic background, by visually assessing the morphology of the leaves and the berries. Seeds were collected from at least 30 individuals from each population. Information on the seed collection in the commercial provenances was not available as it concerned commercial plant material without a certificate of provenance. Certificates of provenance are not compulsory for C. monogyna according to the Council Directive 1999/105/EC [43]. Therefore, the exact location of these commercial seed sources was also not available. In the beginning of 2008, planting stock of the 11 provenances were planted in a common garden in Londerzeel, Flanders, Belgium. The provenances were randomly mixed in a single tree plot design and planted with a spacing of 1.5 × 1.5 m. Mean monthly temperatures for 2016 and 2017 were acquired from the weather station in Groenendaal which is located at a distance of 30 km from the common garden site (Figure 1).
2.2. Scoring of the Four Phenophases
Observations of the phenophases were performed on the shrubs in the common garden in 2016 and 2017. Bud burst, flower opening, leaf senescence and leaf fall were scored following two 6-level and two 5-level protocols, respectively (Table 2). For all phenophases, the whole shrub was evaluated visually and a mean score level was given. Bud burst was scored in 2016 on 8, 23, 31 March and 16 April, and in 2017 on 12, 21, 26 March and 2 April. Flower opening was scored in 2016 on 28 April, 4 and 11 May, and in 2017 on 26 April, 1 and 11 May. Leaf senescence and leaf fall were scored in 2016 on 21 October and 4 November, and in 2017 on 8 and 29 October.
2.3. Statistical Analysis of Phenological Data
All statistical analyses were performed in the open source software R 3.5.1. [44]. Models were fitted to examine the timing of the four phenophases in the two successive years. Each phenological trait (Tph) was a response variable and was modeled using cumulative logistic regression in the “ordinal” package [45], as the recorded observations were in an ordinal scale. The command “clmm” in the “ordinal” package models the probability (p) of having reached maximally a given level of the ordinal response variable. The score levels for leaf senescence and fall were defined in increasing order, and the probability was modeled for having reached maximally a given score level; e.g., having reached maximally a leaf senescence score of 3 was to be interpreted as the probability of having reached scores of 1, 2 or 3. The score levels of bud burst and flower opening were defined in decreasing order, so that the probability of having reached maximally a bud burst score of 3, for example, included the probability of having reached scores of 6, 5, 4or 3. In this way, this could be interpreted as having reached a score of at least 3. Mixed models were fitted as the phenological data concerned repeated observations on the same plants. The year of observation (Y, categorical variable) and the provenance (P, categorical variable) were present in the fixed part of each model, including an interaction term between these two variables. In the four phenological models, the local Flemish provenance FL1 (Table 1) was taken as the standard provenance to which the timing of the other provenances in the common garden was compared. Day (D, numerical variable) was added in the fixed part to account for the different observation days. The random part (random intercept) consisted of a unique shrub identity code (ID). The latter accounted for the repeated observations on the same plants.
where αi was an intercept value indicating the passing from one level of the ordinal phenological response variable to the next. βY, βP and βD were the estimated coefficients for the fixed covariates Y, P and D, and rID was the random effect coefficient for all levels of the variable ID.
log (pTph/(1 − pTph)) = αi − βY.Y (fixed) − βP.P (fixed) − βYP.Y.P (fixed) − βD.D (fixed) − rID (random)
To be able to compare the timing of the four phenophases for all provenances, the days were calculated for which the different provenances in each phenophase had reached the same stage of phenological development. The DOY (day of the year) was calculated for which the probability for having reached a bud burst or flower opening score of at least 4 and having reached a maximal leaf senescence and leaf fall score of 3, attained 50% (D50%PY) in the observation years 2016 and 2017 and for every provenance. A D50%PY for a given provenance and a given year therefore indicated the day that half of the plants of this provenance had reached minimally (bud burst and flower opening) or maximally (leaf senescence and fall) a given score level of the respective phenophase in the respective year. This calculation was based on log(pTph/(1 − pTph)) being 0 for p = 50%. With 2016 as the standard level for the variable Y, to which 2017 is compared, the following formulas were used:
D50%P2016 = (αi − βP)/(βD)
D50%P2017 = (αi − β2017 − βP − β2017P)/(βD)
When the timing of a given phenophase for a given provenance differed significantly from the standard provenance FL1, the time lag was calculated between this provenance and the standard provenance. For 2016, this was inferred from the model with 2016 as the standard level of the categorical variable Y, whereas for 2017 this was inferred from the model with 2017 as the standard level for the variable Y. The time span between a provenance and the standard provenance from which it differed significantly, was calculated by subtracting the calculated D50%FL1Y from D50%PY. Pearson correlation coefficients were calculated between the timing of the phenophases in the two observation years using the D50%P2016 and D50%P2017 values.
A significant interaction term between provenance P and year Y in the model statistics indicated that the time span between the timing of a phenophase for a given provenance and the standard provenance in 2016 differed significantly from the respective time span between these two provenances in 2017. The significant interaction terms were visualized in reaction norm figures, in which the timing of a phenophase for a provenance was compared between 2016 and 2017. The slope of the line connecting the timing of a phenophase between 2016 and 2017 for a provenance with a significant interaction term in the model statistics, differed significantly from the slope connecting the timings for the standard provenance FL1.
To examine the relative variance in the timing of bud burst, flower opening, leaf senescence and leaf fall among the different provenances in the common garden, in comparison with the relative variance among the shrubs within a provenance, the four phenological models were adapted by moving the provenance variable (P) from the fixed to the random part.
log(pTph/(1 − pTph)) = αi − βY.Y − βD.D (fixed) − rP (random) − rID (random)
The relative variance between the provenances (σ2P) and the relative variance between the shrubs within a provenance (σ2ID) were obtained from these models.
3. Results
3.1. Timing of Bud Burst
All provenances in the common garden burst buds earlier in 2017 compared with 2016 (the covariate year was significant in the model statistics, Table 3, Figure S1). Significant differences in the timing of bud burst were observed between several provenances and the standard Flemish provenance FL1 in 2016 (Table 3) and in 2017 (Table S1). The time spans between the timing of these provenances and FL1 were calculated for both observation years (Table 4). The Italian and Hungarian provenances flushed earlier in comparison to the Flemish provenances, whereas the Walloon provenances with a higher elevation in the home-sites, flushed later (Figure 2a, Table 3).
A significant interaction term between provenance and year in the model indicated a significant relative change in time span (between the timing of bud burst for the respective provenance and the timing for the standard provenance FL1) between the two observation years (Table 3). A significant interaction term for a provenance was visualized as the slope of a line connecting the timings (expressed as D50%PY values) for this provenance in the two observation years differing from the slope of the standard provenance FL1 (Figure 2b). In 2016, the southern European provenances burst their buds about 10 days earlier than the Flemish provenance FL1, whereas this time lag between the southern European provenances and FL1 was reduced to about 6 days difference in 2017, resulting in less steep slopes for the provenances HO and IT compared to FL1 in Figure 2b (provenance abbreviations in Table 1). Whereas in 2017 the difference between the timing of bud burst in the southern European provenances and FL1 was reduced in comparison with 2016, the time lag between the Walloon provenance WA1 and FL1 increased in 2017 in comparison with 2016, resulting in a less steep slope for WA1 compared with FL1 in Figure 2b (provenance abbreviations in Table 1). The UK provenance and the Flemish provenance FL3 also displayed significant interaction terms (Table 1 and Table 3, Figure 2b).
3.2. Timing of Flower Opening
In general, all provenances in the common garden opened their flowers earlier in 2017 compared with 2016 (the covariate year was significant in the model statistics, Table 3, Figure S2). The southern European provenances and the Walloon provenances differed significantly in the timing of this phenophase when compared with the standard local provenance FL1 in 2016 and in 2017 (Table 3, Table S1 and Figure 3a). In addition, the Flemish FL4 and the UK provenance differed significantly from FL1 in 2017 (provenance abbreviations in Table 1). The time spans between these provenances and FL1 were calculated for both observation years (Table 4). Similar to bud burst, the Italian and Hungarian provenances opened their flowers earlier in comparison with the Flemish provenances, whereas the Walloon provenances tended to flower later (Figure 3a, Table 3). All time spans for flower opening between FL1 and the provenances that differed significantly from FL1, were smaller than for bud burst in both observation years.
Significant interaction terms between provenance and year in the model (Table 3) are visualized in Figure 3b. The pattern was comparable to bud burst. In 2016 the southern European provenances opened their flowers about 6 to 7 days earlier than the Flemish provenance FL1. In 2017, this time lag between the southern European provenances and FL1 was reduced to about 2 to 5 days, resulting in less steep slopes than FL1 in Figure 3b. Similar to bud burst, the time lag between the Walloon provenances and FL1 increased in 2017 compared with 2016 (from 2 to 3 days in 2016 to about 5 days in 2017), also resulting in less steep slopes than FL1 in Figure 3b. One extra local provenance, FL4, and the UK provenance differed significantly in timing of flower opening from FL1 in 2017 (Table S1). The UK provenance displayed a significant interaction term (Table 3, Figure 3b), whereas among the Flemish provenances only FL3 had a significant interaction term, visualized as a less steep slope than FL1 in Figure 3b.
3.3. Timing of Leaf Senescence and Leaf Fall
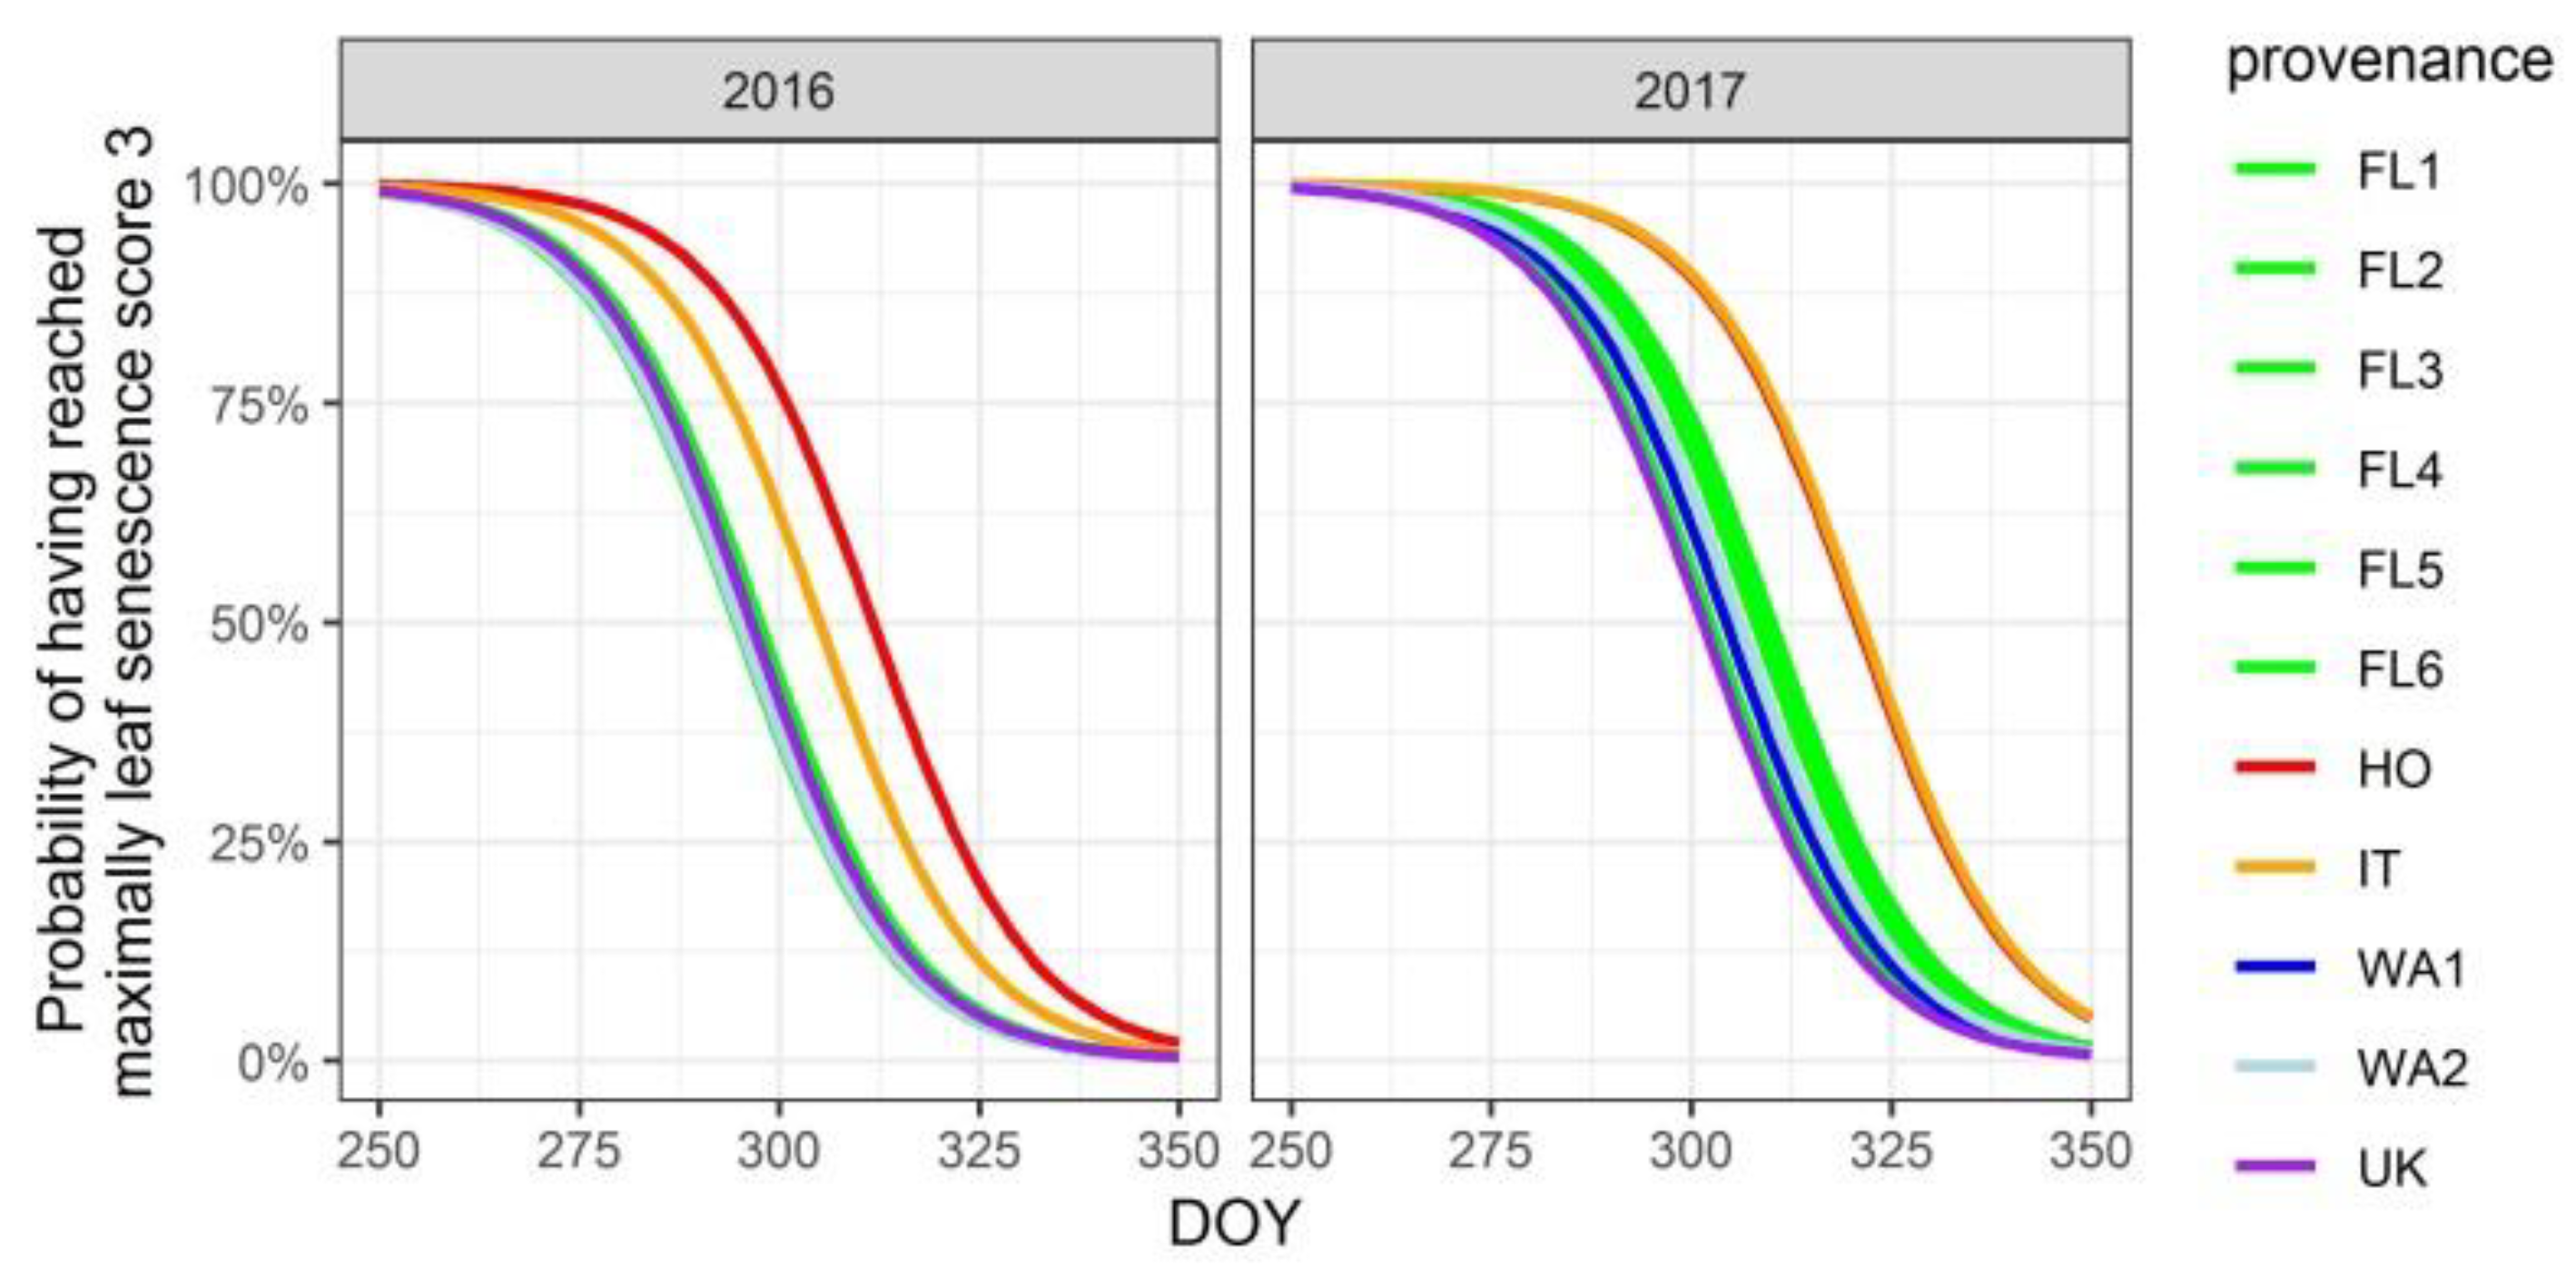
For the timing of leaf senescence and leaf fall, fewer provenances differed significantly from the standard provenance FL1 in comparison with the timing of bud burst and flower opening (Table 5, Table S2, Figure 4, Figure 5a, Figure S3 and Figure S4). For the southern European provenances, leaf senescence in 2016 occurred 9 to 16 days later than the local provenance FL1, and around 12 days later in 2017 (Table 4). Timing of leaf fall was modeled for these provenances 6 to 9 days later than the local provenance FL1 in both years (Table 4). In 2017, the timing of leaf senescence in the UK provenance was 7.5 days earlier than FL1, whereas in 2016, the timing of leaf fall in the Flemish provenance FL5 was 4 days later (Table 4).
3.4. Correlation and Variance Analysis
Pearson correlation coefficients between the timing of the different phenophases in the two observation years revealed, in general, high and significant correlations. The spring phenophases bud burst and flower opening displayed the highest correlation coefficients (0.98 *** and 0.97 *** in 2016 and 2017, respectively, Table 6). In comparison, the autumnal phenophases, leaf senescence and leaf fall, displayed lower correlation coefficients (0.79 ** in 2016 and 0.9 *** in 2017, Table 6). Both spring phenophases were correlated with leaf senescence (−0.87 *** and −0.86 *** for bud burst and flower opening in 2016, and −0.82 ** and −0.75 ** in 2017, respectively, Table 6), with later spring flushing and flowering occurring with earlier leaf senescence. In comparison, the spring phenophases were less correlated with leaf fall (−0.7 * and −0.65 * for bud burst and flower opening in 2016, and −0.78 ** and −0.65 * in 2017, respectively, Table 6). Intra-phenophase correlation coefficients, between 2016 and 2017, were obviously high, with bud burst displaying the highest correlation coefficient (0.97 ***), followed by flower opening (0.92 ***), leaf fall (0.89 ***) and finally leaf senescence (0.86 ***).
The relative variability in timing of the phenophases between the provenances was compared with the relative variability between the different shrubs within a provenance (Figure 6). In 2016, the between-provenance variance was relatively highest in the phenophase bud burst, and lower in decreasing order in flower opening, leaf senescence and leaf fall. The relative within-provenance variance increased accordingly. In 2017, the between-provenance variance for bud burst was lower compared with 2016 but was still higher than the relative within-provenance variance in this year. For flower opening, the between-provenance variance in 2017 was lower compared with 2016 and was as high as the relative within-provenance variance in this year. For leaf senescence and leaf fall in 2017, the relative variances attributable to the differentiation between the provenances were lower than in 2016, and thus displayed correspondingly higher relative within-provenance variances. In general, the spring phenophases displayed the largest relative between-provenance variances, in comparison with the autumnal phenophases.
4. Discussion
4.1. Timing of the Phenophases
Our results showed that differentiation between local and non-local provenances of C. monogyna is present in the phenological traits marking the seasonality in woody plants, as observed in a common garden. Differentiation in phenological traits in common gardens has been found in many tree species [46,47]. As shown before [42], the southern European provenances burst their buds earlier (lower latitude), the Walloon provenances are later (higher elevation), and the UK provenance is similar to the local Flemish provenances (lower longitude). We also detected, although in a lower order of magnitude, differentiation for bud burst between certain local provenances in both observation years. This finding may be related to results from Danish common gardens consisting of local populations of insect-pollinated shrub species (Cornus sanguinea L. Malus sylvestris (L.) Mill. and Rosa dumalis Bechst.), where differentiation in bud burst on a local scale, with very little spring temperature deviation between the home-sites of the populations, was suggested to be driven not only by natural selection but also by neutral processes [48]. Despite the fact that timing of bud burst and flower opening are strongly correlated, the time spans between the timing of bud burst from, on the one hand the standard local Flemish provenance and on the other hand the non-local provenances from the Walloon region (higher elevation), southern Europe (lower latitude) and the UK (lower longitude), were larger in comparison to the respective time spans between the timing of flower opening. This phenomenon has already been detected in the studied common garden [42] and proved to be consistent for two additional observation years. As hypothesized before [42], the timing of flower opening may be less sensitive to natural selection and local adaptation due to two reasons. Shrubs start flowering only after several crucial years of establishment and seedling development, and a year of reduced reproduction due to an improper timing of flowering may be less detrimental to a woody plant than reduced growth (accompanied by unfavorable competition with neighboring plants) because of an improper timing of bud burst. Therefore, the timing of flowering may be more responsive to the local micro-climate.
Leaf senescence and leaf fall in the southern European provenances were delayed compared with the local provenances. Together with an earlier bud burst, this implies a longer growing season for these provenances (spring phenophases were negatively correlated with autumnal phenophases). It is questionable whether the longer growing season is advantageous or disadvantageous. In a reciprocal common garden experiment of Populus fremontii S. Watson, southern populations planted in colder climates set buds relatively later in comparison with the same genotypes planted in a common garden at their home-site [39]. This later bud set is described as an inability to avoid early autumnal frosts and is interpreted as non-adaptive phenotypic plasticity, possibly caused by a lesser sensitivity to photoperiod as a cue to initiate bud set in more southern populations [39]. Bud flush in the southern population was found to be later in the colder common garden compared to the home-site common garden (but still earlier than the local populations from the cold environment) and was therefore interpreted as adaptive plasticity [39]. In our experiment, the higher elevation provenances of the Walloon region displayed a later bud burst in comparison to the local provenances, but no earlier nor later leaf senescence and leaf fall. This finding is likely in line with [34] who found no correlation between temperatures of the source sites along an altitudinal gradient and timing of leaf senescence in a common garden for Acer pseudoplatanus L. and Fraxinus excelsior L.. This may be due to a higher sensitivity of leaf senescence to photoperiod, compared to that of bud burst [29,30]. Higher elevations in the Walloon part of Belgium imply a generally colder climate compared to the local climate of the common garden site, but a negligible difference in photoperiod. When compared with the timing of bud burst and flower opening, a relatively smaller contribution of the between-provenance variation in the variance analysis indicates a weaker population differentiation for the autumnal phenophases. These results are in line with findings of [39] and [40] who both found a stronger influence of genotypic effects for bud set in poplar compared with bud burst, whereas bud burst showed stronger population-level effects relative to bud set. Although occurring in the same vegetative organ of the plant, the correlation between the timing of leaf senescence and leaf fall was smaller compared with the correlation between the timing of bud burst and flower opening, the latter implying a correlation between a vegetative (leaf bud) and a generative (flower) organ, which may suggest less tight genetic control for the autumnal phenophases.
4.2. Non-Linear Temporal Responses in Timing of the Phenophases
Inter-annual variation over long time periods in the timing of bud burst in temperate tree species has been widely modeled and discussed, e.g., [49]. Still, it remains difficult to accurately predict bud burst on smaller time scales. We studied the temporal phenotypic plasticity in the phenological responses on a small time scale, i.e., the responses to local meteorological conditions in the common garden, by observing the variability of the phenological responses on the same shrubs in two successive years. The non-linear inter-annual response of timing of bud burst was expressed in five significant interaction terms between the variables provenance and year in the modeling analysis, including four non-local provenances. For flower opening we found a comparable number of significant interaction terms (one extra Walloon provenance) with the same provenances involved as for bud burst, most probably giving expression to the auto-correlation of both phenophases. For leaf fall, only two provenances displayed significant interaction terms in the models, both being non-local, and for leaf senescence there were none. The lesser sensitivity of the autumnal phenophases to plasticity compared with the spring phenophases can be due to a higher sensitivity to photoperiod as a stable cue to initiate these processes [40]. The relatively high presence of non-local provenances among the significant interaction terms in the phenological models may be indicative of their non-local origin. The non-linear temporal responses in non-local provenances can be interpreted as a reaction to the prevailing growth conditions that deviate from the home-site conditions that they are adapted to. Considering the timing of bud burst, the time span between the southern European provenances and the local standard provenance in 2016 was larger than in 2017. For the Walloon provenances we observed an opposite response. As temperature is a well-known determinant for the timing of bud burst, the warmer temperatures in March 2017 have likely advanced the timing of bud burst in all provenances compared to 2016. It is by now well-known that woody plants shift to earlier bud burst dates upon increased warming [50]. However, the advancement that we observed in the non-local provenances was not linear in comparison with the local Flemish provenances, with the southern European provenances being relatively less early and the Walloon provenances being relatively later than the local provenances in 2017. In transplant experiments of Populus fremontii, the magnitude of phenotypic plasticity in bud flush and bud set was found to be correlated with the home-site climates [39]. Planting the southern European provenances of C. monogyna in the common garden in Belgium implied a transfer to a cooler environment, with the cooler spring of 2016 inducing a longer time span in the timing of bud burst with the local provenances than the warmer spring of 2017. The warmer spring in 2017 drove the higher elevation provenances to a longer time span in the timing of bud burst with the local provenances, compared with the cooler spring in 2016. Together, these results suggest a larger plastic reaction in the timing of bud burst in the common garden environment may imply that prevailing meteorological conditions deviate more from the home-site conditions.
5. Conclusions
In Europe, populations of woody species at the southern limits of their natural range have maintained relatively large levels of genetic diversity and are therefore considered as appropriate gene pools for assisted migration towards the north as a climate adaptation strategy [51]. On the other hand, results from Danish (high latitude in Europe) common garden trials with local populations for several shrub species indicate substantial genetic variation and evolutionary potential, questioning the need for assisted migration specifically for widespread and generally occurring woody species [48]. In addition, C. monogyna, as a key component of old hedgerows, displayed large levels of genetic diversity in nuclear and chloroplast markers in the UK (medium latitude in Europe) [41]. Although limited in time, our two-year study showed that all provenances of the common shrub species C. monogyna adjust their phenological responses to the prevailing temperatures and that non-local provenances tend to react non-linearly relative to the local provenances, with larger temporal spring plasticity coinciding with a larger difference in climatic conditions between home-sites and the common garden environment. Our results can be interpreted as an extra argument in the debate over assisted migration, suggesting that for widespread species planted stock of non-local origin may tend to “over-react” to variable environmental conditions at the site to which they are transplanted. This over-reaction in plastic response may be caused by the environmental conditions that deviate more from the optima these provenances are adapted to at their home sites. Our results therefore stress the importance of carefully reflecting on assisted migration projects, and considering at least the addition of local planting stock when deciding to transport populations of trees and shrubs over longer distances in anticipation of the predicted climate change.
Supplementary Materials
The following are available online at https://www.mdpi.com/1999-4907/10/4/293/s1, Figure S1: Scores of bud burst in the common garden on four observation days in the years 2016 (a) and 2017 (b). Provenance abbreviations are in Table 1. Descriptions of score levels are in Table 2; Figure S2: Scores of flower opening in the common garden on three observation days in the years 2016 (a) and 2017 (b). Provenance abbreviations are in Table 1. Descriptions of score levels are in Table 2; Figure S3: Scores of leaf senescence in the common garden on two observation days in the years 2016 (a) and 2017 (b). Provenance abbreviations are in Table 1. Descriptions of score levels are in Table 2; Figure S4: Scores of leaf fall in the common garden on two observation days in the years 2016 (a) and 2017 (b). Provenance abbreviations are in Table 1. Descriptions of score levels are in Table 2; Table S1: Model statistics for bud burst and flower opening. The provenance FL1 and the year 2017 are the standard levels for the categorical variables provenance and year, to which the other year, 2016, and the other provenances are compared. Provenance abbreviations are in Table 1; Table S2: Model statistics for leaf senescence and leaf fall. The provenance FL1 and the year 2017 are the standard levels for the categorical variables provenance and year, to which the other year, 2016, and the other provenances are compared. Provenance abbreviations are in Table 1.
Author Contributions
K.V.M. conceptualized the study; K.V.M. and A.J. performed the field work and the statistical analysis and wrote the manuscript.
Funding
This research received no external funding.
Acknowledgments
We specifically express our gratitude to Stefaan Moreels for general technical assistance throughout the whole project, Wim Stevens for maintenance of the common garden and Joris Vernaillen for help with the scoring.
Conflicts of Interest
The authors declare no conflict of interest.
References
- Aitken, S.N.; Yeaman, S.; Holliday, J.A.; Wang, T.L.; Curtis-McLane, S. Adaptation, migration or extirpation: Climate change outcomes for tree populations. Evol. Appl. 2008, 1, 95–111. [Google Scholar] [CrossRef]
- Kremer, A.; Potts, B.M.; Delzon, S. Genetic divergence in forest trees: Understanding the consequences of climate change. Funct. Ecol. 2014, 28, 22–36. [Google Scholar] [CrossRef]
- Firmat, C.; Delzon, S.; Louvet, J.M.; Parmentier, J.; Kremer, A. Evolutionary dynamics of the leaf phenological cycle in an oak metapopulation along an elevation gradient. J. Evol. Biol. 2017, 30, 2116–2131. [Google Scholar] [CrossRef]
- Erwin, D.H. Climate as a driver of evolutionary change. Curr. Biol. 2009, 19, R575–R583. [Google Scholar] [CrossRef]
- Alberto, F.J.; Aitken, S.N.; Alia, R.; Gonzalez-Martinez, S.C.; Hanninen, H.; Kremer, A.; Lefevre, F.; Lenormand, T.; Yeaman, S.; Whetten, R.; et al. Potential for evolutionary responses to climate change evidence from tree populations. Glob. Chang. Biol. 2013, 19, 1645–1661. [Google Scholar] [CrossRef]
- Klisz, M.; Ukalski, K.; Ukalska, J.; Jastrzebowski, S.; Puchalka, R.; Przybylski, P.; Mionskowski, M.; Matras, J. What can we learn from an early test on the adaptation of silver fir populations to marginal environments? Forests 2018, 9, 441. [Google Scholar] [CrossRef]
- De Villemereuil, P.; Gaggiotti, O.E.; Mouterde, M.; Till-Bottraud, I. Common garden experiments in the genomic era: New perspectives and opportunities. Heredity 2016, 116, 249–254. [Google Scholar] [CrossRef]
- Gienapp, P.; Reed, T.E.; Visser, M.E. Why climate change will invariably alter selection pressures on phenology. Proc. R. Soc. B-Biol. Sci. 2014, 281, 20141611. [Google Scholar] [CrossRef]
- De Kort, H.; Vandepitte, K.; Honnay, O. A meta-analysis of the effects of plant traits and geographical scale on the magnitude of adaptive differentiation as measured by the difference between Qst and Fst. Evol. Ecol. 2013, 27, 1081–1097. [Google Scholar] [CrossRef]
- Vitasse, Y.; Lenz, A.; Korner, C. The interaction between freezing tolerance and phenology in temperate deciduous trees. Front. Plant Sci. 2014, 5, 541. [Google Scholar] [CrossRef]
- Begum, S.; Nakaba, S.; Yamagishi, Y.; Oribe, Y.; Funada, R. Regulation of cambial activity in relation to environmental conditions: Understanding the role of temperature in wood formation of trees. Physiol. Plant. 2013, 147, 46–54. [Google Scholar] [CrossRef]
- Savolainen, O.; Pyhäjärvi, T.; Knürr, T. Gene flow and local adaptation in trees. Annu. Rev. Ecol. Evol. Syst. 2007, 38, 595–619. [Google Scholar] [CrossRef]
- Whittet, R.; Cavers, S.; Cottrell, J.; Rosique-Esplugas, C.; Ennos, R. Substantial variation in the timing of pollen production reduces reproductive synchrony between distant populations of Pinus sylvestris L. In scotland. Ecol. Evol. 2017, 7, 5754–5765. [Google Scholar] [CrossRef]
- Dragoni, D.; Schmid, H.P.; Wayson, C.A.; Potter, H.; Grimmond, C.S.B.; Randolph, J.C. Evidence of increased net ecosystem productivity associated with a longer vegetated season in a deciduous forest in south-central Indiana, USA. Glob. Chang. Biol. 2011, 17, 886–897. [Google Scholar] [CrossRef]
- Menzel, A.; Sparks, T.H.; Estrella, N.; Koch, E.; Aasa, A.; Ahas, R.; Alm-Kubler, K.; Bissolli, P.; Braslavska, O.; Briede, A.; et al. European phenological response to climate change matches the warming pattern. Glob. Chang. Biol. 2006, 12, 1969–1976. [Google Scholar] [CrossRef] [Green Version]
- Zohner, C.M.; Renner, S.S. Common garden comparison of the leaf-out phenology of woody species from different native climates, combined with herbarium records, forecasts long-term change. Ecol. Lett. 2014, 17, 1016–1025. [Google Scholar] [CrossRef] [PubMed]
- Duputie, A.; Rutschmann, A.; Ronce, O.; Chuine, I. Phenological plasticity will not help all species adapt to climate change. Glob. Chang. Biol. 2015, 21, 3062–3073. [Google Scholar] [CrossRef] [PubMed]
- Aitken, S.N.; Bemmels, J.B. Time to get moving: Assisted gene flow of forest trees. Evol. Appl. 2016, 9, 271–290. [Google Scholar] [CrossRef]
- Le Corre, V.; Kremer, A. The genetic differentiation at quantitative trait loci under local adaptation. Mol. Ecol. 2012, 21, 1548–1566. [Google Scholar] [CrossRef] [PubMed] [Green Version]
- Gomory, D.; Ditmarova, L.; Hrivnak, M.; Jamnicka, G.; Kmet’, J.; Krajmerova, D.; Kurjak, D. Differentiation in phenological and physiological traits in European beech (Fagus sylvatica L.). Eur. J. For. Res. 2015, 134, 1075–1085. [Google Scholar] [CrossRef]
- Vitasse, Y.; Bresson, C.C.; Kremer, A.; Michalet, R.; Delzon, S. Quantifying phenological plasticity to temperature in two temperate tree species. Funct. Ecol. 2010, 24, 1211–1218. [Google Scholar] [CrossRef] [Green Version]
- Pluess, A.R.; Frank, A.; Heiri, C.; Lalaguee, H.; Vendramin, G.G.; Oddou-Muratorio, S. Genome-environment association study suggests local adaptation to climate at the regional scale in Fagus sylvatica. New Phytol. 2016, 210, 589–601. [Google Scholar] [CrossRef]
- Puchalka, R.; Koprowski, M.; Gricar, J.; Przybylak, R. Does tree-ring formation follow leaf phenology in pedunculate oak (Quercus robur L.)? Eur. J. For. Res. 2017, 136, 259–268. [Google Scholar] [CrossRef]
- Kraj, W.; Sztorc, A. Genetic structure and variability of phenological forms in the european beech (Fagus sylvatica L.). Ann. For. Sci. 2009, 66, 1–7. [Google Scholar] [CrossRef]
- Jordan, C.Y.; Ally, D.; Hodgins, K.A. When can stress facilitate divergence by altering time to flowering? Ecol. Evol. 2015, 5, S962–S973. [Google Scholar] [CrossRef]
- Soularue, J.P.; Kremer, A. Assortative mating and gene flow generate clinal phenological variation in trees. BMC Evol. Biol. 2012, 12, 79. [Google Scholar] [CrossRef] [PubMed]
- Soularue, J.P.; Kremer, A. Evolutionary responses of tree phenology to the combined effects of assortative mating, gene flow and divergent selection. Heredity 2014, 113, 485–494. [Google Scholar] [CrossRef] [PubMed] [Green Version]
- Fu, Y.S.; Campioli, M.; Vitasse, Y.; De Boeck, H.J.; Van den Berge, J.; AbdElgawad, H.; Asard, H.; Piao, S.; Deckmyn, G.; Janssens, I.A. Variation in leaf flushing date influences autumnal senescence and next year’s flushing date in two temperate tree species. Proc. Natl. Acad. Sci. USA 2014, 111, 7355–7360. [Google Scholar] [CrossRef] [PubMed] [Green Version]
- Delpierre, N.; Dufrene, E.; Soudani, K.; Ulrich, E.; Cecchini, S.; Boe, J.; Francois, C. Modelling interannual and spatial variability of leaf senescence for three deciduous tree species in France. Agric. For. Meteorol. 2009, 149, 938–948. [Google Scholar] [CrossRef]
- Estiarte, M.; Penuelas, J. Alteration of the phenology of leaf senescence and fall in winter deciduous species by climate change: Effects on nutrient proficiency. Glob. Chang. Biol. 2015, 21, 1005–1017. [Google Scholar] [CrossRef]
- Rohde, A.; Bastien, C.; Boerjan, W. Temperature signals contribute to the timing of photoperiodic growth cessation and bud set in poplar. Tree Physiol. 2011, 31, 472–482. [Google Scholar] [CrossRef] [Green Version]
- Rohde, A.; Storme, V.; Jorge, V.; Gaudet, M.; Vitacolonna, N.; Fabbrini, F.; Ruttink, T.; Zaina, G.; Marron, N.; Dillen, S.; et al. Bud set in poplar—Genetic dissection of a complex trait in natural and hybrid populations. New Phytol. 2011, 189, 106–121. [Google Scholar] [CrossRef] [PubMed]
- Polgar, C.A.; Primack, R.B. Leaf-out phenology of temperate woody plants: From trees to ecosystems. New Phytol. 2011, 191, 926–941. [Google Scholar] [CrossRef] [PubMed]
- Vitasse, Y.; Delzon, S.; Bresson, C.C.; Michalet, R.; Kremer, A. Altitudinal differentiation in growth and phenology among populations of temperate-zone tree species growing in a common garden. Can. J. For. Res. 2009, 39, 1259–1269. [Google Scholar] [CrossRef]
- Panchen, Z.A.; Primack, R.B.; Gallinat, A.S.; Nordt, B.; Stevens, A.D.; Du, Y.J.; Fahey, R. Substantial variation in leaf senescence times among 1360 temperate woody plant species: Implications for phenology and ecosystem processes. Ann. Bot.-Lond. 2015, 116, 865–873. [Google Scholar] [CrossRef] [PubMed]
- Zohner, C.M.; Rockinger, A.; Renner, S.S. Increased autumn productivity permits temperate trees to compensate for spring frost damage. New Phytol. 2019, 221, 789–795. [Google Scholar] [CrossRef]
- Nicotra, a.B.; Atkin, O.K.; Bonser, S.P.; Davidson, A.M.; Finnegan, E.J.; Mathesius, U.; Poot, P.; Purugganan, M.D.; Richards, C.L.; Valladares, F.; et al. Plant phenotypic plasticity in a changing climate. Trends Plant Sci. 2010, 15, 684–692. [Google Scholar] [CrossRef] [PubMed] [Green Version]
- Cleland, E.E.; Allen, J.M.; Crimmins, T.M.; Dunne, J.A.; Pau, S.; Travers, S.E.; Zavaleta, E.S.; Wolkovich, E.M. Phenological tracking enables positive species responses to climate change. Ecology 2012, 93, 1765–1771. [Google Scholar] [CrossRef] [PubMed] [Green Version]
- Cooper, H.F.; Grady, K.C.; Cowan, J.A.; Best, R.J.; Allan, G.J.; Whitham, T.G. Genotypic variation in phenological plasticity: Reciprocal common gardens reveal adaptive responses to warmer springs but not to fall frost. Glob. Chang. Biol. 2019, 25, 187–200. [Google Scholar] [CrossRef] [PubMed]
- Evans, L.M.; Kaluthota, S.; Pearce, D.W.; Allan, G.J.; Floate, K.; Rood, S.B.; Whitham, T.G. Bud phenology and growth are subject to divergent selection across a latitudinal gradient in Populus angustifolia and impact adaptation across the distributional range and associated arthropods. Ecol. Evol. 2016, 6, 4565–4581. [Google Scholar] [CrossRef] [PubMed]
- Brown, J.A.; Beatty, G.E.; Finlay, C.M.V.; Montgomery, W.I.; Tosh, D.G.; Provan, J. Genetic analyses reveal high levels of seed and pollen flow in hawthorn (Crataegus monogyna Jacq.), a key component of hedgerows. Tree Genet. Genomes 2016, 12, 58. [Google Scholar] [CrossRef]
- Vander Mijnsbrugge, K.; Onkelinx, T.; De Cuyper, B. Variation in bud burst and flower opening responses of local versus non-local provenances of hawthorn (Crataegus monogyna Jacq.) in Belgium. Plant Syst. Evol. 2015, 301, 1171–1179. [Google Scholar] [CrossRef]
- Council of the European Union. Council directive 1999/105/ec of 22 december 1999 on the marketing of forest reproductive material. Off. J. Eur. Communion 2000, L11, 17–40. [Google Scholar]
- R Core Team. R: A Language and Environment for Statistical Computing; R Foundation for Statistical Computing: Vienna, Austria, 2018; Available online: http://www.R-project.org/ (accessed on 5 January 2018).
- Christensen, R.H.B. Ordinal: Regression Models for Ordinal Data. R Package Version 2015.6-28. 2015. Available online: http://www.Cran.R-project.Org/package=ordinal/ (accessed on 5 January 2015).
- Alberto, F.J.; Derory, J.; Boury, C.; Frigerio, J.M.; Zimmermann, N.E.; Kremer, A. Imprints of natural selection along environmental gradients in phenology-related genes of Quercus petraea. Genetics 2013, 195, 495–512. [Google Scholar] [CrossRef] [PubMed]
- Salmela, M.J.; Cavers, S.; Cottrell, J.E.; Iason, G.R.; Ennos, R.A. Spring phenology shows genetic variation among and within populations in seedlings of scots pine (Pinus sylvestris L.) in the Scottish highlands. Plant Ecol. Divers 2013, 6, 523–536. [Google Scholar] [CrossRef]
- Lobo, A.; Hansen, J.K.; Hansen, L.N.; Kjaer, E.D. Differences among six woody perennials native to northern Europe in their level of genetic differentiation and adaptive potential at fine local scale. Ecol. Evol. 2018, 8, 2231–2239. [Google Scholar] [CrossRef]
- Chmielewski, F.M.; Rotzer, T. Response of tree phenology to climate change across Europe. Agric. For. Meteorol. 2001, 108, 101–112. [Google Scholar] [CrossRef]
- Franks, S.J.; Weber, J.J.; Aitken, S.N. Evolutionary and plastic responses to climate change in terrestrial plant populations. Evol. Appl. 2014, 7, 123–139. [Google Scholar] [CrossRef] [PubMed]
- Hampe, A.; Petit, R.J. Conserving biodiversity under climate change: The rear edge matters. Ecol. Lett. 2005, 8, 461–467. [Google Scholar] [CrossRef] [PubMed]
Figure 1.
Mean monthly temperatures in 2016 and 2017 in Groenendaal, Belgium.
Figure 2.
Modeled timing of bud burst for the different provenances in 2016 and 2017: (a) Modeled probability of having reached at least bud burst score 4; (b) D50%PY values for the provenances (P) with a significant interaction term in the model statistics, for the years (Y) 2016 and 2017. D50%PY values indicate the modeled day of the year (DOY) when half of the plants of a provenance attain a bud burst score of at least four.

Figure 3.
Modeled timing of flower opening for the different provenances in 2016 and 2017: (a) Modeled probability of having reached at least a flower opening score of four; (b) D50%PY values for the provenances (P) with a significant interaction term in the model statistics, for the years (Y) 2016 and 2017. D50%PY values indicate the modeled DOY when half of the plants of a provenance attain a flower opening score of at least four.

Figure 4.
Modeled timing of leaf senescence for the different provenances in 2016 and 2017. Modeled probability of having reached a maximal leaf senescence score of three.
Figure 4.
Modeled timing of leaf senescence for the different provenances in 2016 and 2017. Modeled probability of having reached a maximal leaf senescence score of three.

Figure 5.
Modeled timing of leaf fall for the different provenances in 2016 and 2017: (a) Modeled probability of having reached a maximal leaf fall score of three; (b) D50%PY values for the provenances (P) with a significant interaction term in de model statistics, for the years (Y) 2016 and 2017. D50%PY values indicate the modelled DOY when half of the plants of a provenance attain a maximal leaf fall score of three.

Figure 6.
Relative between-provenance (between prov) and within-provenance (between geno) variance for the timing of bud burst, flower opening, leaf senescence and leaf fall in 2016 and 2017.
Figure 6.
Relative between-provenance (between prov) and within-provenance (between geno) variance for the timing of bud burst, flower opening, leaf senescence and leaf fall in 2016 and 2017.


Table 1.
Descriptive data of the provenances of C. monogyna in the common garden. No precise data on seed-stock populations were available for the commercial provenances. -: no data available.
Table 1.
Descriptive data of the provenances of C. monogyna in the common garden. No precise data on seed-stock populations were available for the commercial provenances. -: no data available.
| Region | Village | Provenance abb. | Latitude | Longitude | Altitude (m) | n |
|---|---|---|---|---|---|---|
| Flanders | Landegem | FL1 | 51.0546 | 3.5888 | 10 | 53 |
| Flanders | Riemst | FL2 | 50.8116 | 5.5978 | 112 | 52 |
| Flanders | Hansbeke | FL3 | 51.0747 | 3.5345 | 10 | 31 |
| Flanders | Zomergem | FL4 | 51.1195 | 3.5642 | 7.5 | 46 |
| Flanders | Melle | FL5 | 51.0030 | 3.7988 | 10 | 55 |
| Flanders | Muizen | FL6 | 51.0109 | 4.5143 | 12.5 | 52 |
| Wallonia | Smuid | WA1 | 50.0188 | 5.2662 | 370 | 53 |
| Wallonia | Viroin | WA2 | 50.0727 | 4.6072 | 305 | 49 |
| Hungary | - | HU | - | - | - | 46 |
| Italy | - | IT | - | - | - | 52 |
| United Kingdom | - | UK | - | - | - | 48 |
Table 2.
Description of the different score levels of the four observed phenophases.
| Phenophase | Score Level | Description |
|---|---|---|
| bud burst | 1 | winter buds |
| 2 | buds swelling | |
| 3 | buds opening and first green tips of the leaves visible | |
| 4 | leaves emerging from the bud but not yet unfolding | |
| 5 | leaves emerged and unfolding | |
| 6 | leaves fully unfolded and expanding | |
| flower opening | 1 | flower buds closed and green |
| 2 | flower buds closed and white | |
| 3 | less than half of the flowers in an inflorescence opened | |
| 4 | half to more than half of the flowers in an inflorescence opened | |
| 5 | most but not all flowers in an inflorescence opened | |
| 6 | all flowers opened | |
| leaf senescence | 1 | (mainly) green leaves |
| 2 | mainly light green to yellow leaves | |
| 3 | mainly yellow leaves | |
| 4 | yellow and brown leaves | |
| 5 | (mainly) brown leaves | |
| leaf fall | 1 | (nearly) no leaves fallen |
| 2 | About 1/4of the leaves are fallen | |
| 3 | About 1/2 of the leaves are fallen | |
| 4 | About 3/4 of the leaves are fallen | |
| 5 | (nearly) all leaves fallen |
Table 3.
Model statistics for the timing of bud burst and flower opening. The provenance FL1 and the year 2016 are the standard levels for the categorical variables provenance and year, to which the other year, 2017, and the other provenances are compared. DOY: day of the year. Provenance abbreviations are given in Table 1.
| Variable | Bud Burst | Flower Opening | ||||||
|---|---|---|---|---|---|---|---|---|
| Estimate | Std. Error | z-Value | p-Value | Estimate | Std. Error | z-Value | p-Value | |
| DOY | −0.64 | 0.01 | −44.79 | <0.001 *** | −0.46 | 0.01 | −38.90 | <0.001 *** |
| 2017 | −8.29 | 0.30 | −27.26 | <0.001 *** | −2.84 | 0.24 | −12.07 | <0.001 *** |
| FL2 | −0.28 | 0.48 | −0.59 | 0.558 | −0.28 | 0.31 | −0.90 | 0.367 |
| FL3 | −0.08 | 0.55 | −0.15 | 0.878 | −0.47 | 0.35 | −1.32 | 0.188 |
| FL4 | 1.30 | 0.49 | 2.63 | 0.009 ** | 0.42 | 0.32 | 1.32 | 0.188 |
| FL5 | 0.31 | 0.47 | 0.66 | 0.513 | −0.04 | 0.30 | −0.12 | 0.905 |
| FL6 | 0.50 | 0.48 | 1.06 | 0.290 | −0.10 | 0.31 | −0.31 | 0.753 |
| HO | −6.19 | 0.51 | −12.06 | <0.001 *** | −3.02 | 0.35 | −8.65 | <0.001 *** |
| IT | −7.14 | 0.51 | −14.14 | <0.001 *** | −3.19 | 0.32 | −10.04 | <0.001 *** |
| WA1 | 3.01 | 0.48 | 6.26 | <0.001 *** | 1.46 | 0.32 | 4.55 | <0.001 *** |
| WA2 | 3.62 | 0.49 | 7.33 | <0.001 *** | 0.69 | 0.34 | 2.04 | 0.041* |
| UK | 0.43 | 0.49 | 0.89 | 0.375 | −0.65 | 0.36 | −1.82 | 0.069 |
| 2017:FL2 | 0.56 | 0.34 | 1.64 | 0.101 | 0.39 | 0.33 | 1.19 | 0.233 |
| 2017:FL3 | 1.14 | 0.39 | 2.94 | 0.003 ** | 0.77 | 0.39 | 1.97 | 0.049 * |
| 2017:FL4 | −0.07 | 0.35 | −0.21 | 0.837 | 0.44 | 0.34 | 1.32 | 0.188 |
| 2017:FL5 | 0.10 | 0.34 | 0.31 | 0.760 | 0.50 | 0.32 | 1.56 | 0.119 |
| 2017:FL6 | 0.51 | 0.34 | 1.51 | 0.130 | 0.40 | 0.33 | 1.19 | 0.236 |
| 2017:HO | 2.44 | 0.37 | 6.54 | <0.001 *** | 1.91 | 0.36 | 5.30 | <0.001 *** |
| 2017:IT | 3.15 | 0.36 | 8.73 | <0.001 *** | 0.99 | 0.33 | 3.05 | 0.002 ** |
| 2017:WA1 | 1.01 | 0.35 | 2.91 | 0.004 ** | 0.90 | 0.38 | 2.40 | 0.016 * |
| 2017:WA2 | 0.62 | 0.36 | 1.75 | 0.080 | 1.59 | 0.39 | 4.04 | <0.001 *** |
| 2017:UK | 0.94 | 0.35 | 2.73 | 0.006 ** | 1.21 | 0.39 | 3.11 | 0.002 * |
Significant results: *** p < 0.001; ** p < 0.01; * p < 0.05.
Table 4.
Differences in timing between the standard local provenance FL1 and the other provenances in the common garden in 2016 and 2017 for the four phenophases. Time spans are shown only for the provenances that differed significantly from the standard provenance FL1 in the models (Table 3, Table S1). Negative values indicate earlier timing of the phenophase, positive values indicate later timing. Provenance abbreviations are given in Table 1.
| Phenophase | Provenance | Difference in Timing with FL1 (days) | |
|---|---|---|---|
| 2016 | 2017 | ||
| bud burst | FL3 | 1.7 | |
| FL4 | 2 | 1.9 | |
| FL6 | 1.6 | ||
| HO | −9.7 | −5.9 | |
| IT | −11.2 | −6.3 | |
| WA1 | 4.7 | 6.3 | |
| WA2 | 5.7 | 6.7 | |
| UK | 2.2 | ||
| flower opening | FL4 | 1.9 | |
| HO | −6.6 | −2.4 | |
| IT | −7 | −4.8 | |
| WA1 | 3.2 | 5.2 | |
| WA2 | 1.5 | 5 | |
| UK | 1.2 | ||
| leaf senescence | HO | 15.7 | 11.9 |
| IT | 9 | 12.3 | |
| UK | −7.5 | ||
| leaf fall | FL5 | 4.4 | |
| HO | 6.8 | 8 | |
| IT | 8.7 | 6.3 | |
Table 5.
Model statistics for the timing of leaf senescence and leaf fall. The provenance FL1 and the year 2016 are the standard levels for the categorical variables provenance and year, to which the other year, 2017, and the other provenances are compared. Provenance abbreviations are given in Table 1.
| Variable | Leaf Senescence | Leaf Fall | ||||||
|---|---|---|---|---|---|---|---|---|
| Estimate | Std. Error | z-Value | p-Value | Estimate | Std. Error | z-Value | p-Value | |
| DOY | 0.10 | 0.01 | 14.97 | <0.001 *** | 0.27 | 0.01 | 31.11 | <0.001 *** |
| 2017 | −1.32 | 0.33 | −4.06 | <0.001 *** | 1.89 | 0.29 | 6.45 | <0.001 *** |
| FL2 | −0.07 | 0.35 | −0.19 | 0.851 | −0.13 | 0.46 | −0.28 | 0.782 |
| FL3 | 0.13 | 0.41 | 0.32 | 0.747 | 0.49 | 0.54 | 0.91 | 0.366 |
| FL4 | −0.10 | 0.35 | −0.29 | 0.771 | −0.81 | 0.48 | −1.70 | 0.090 |
| FL5 | −0.16 | 0.34 | −0.48 | 0.635 | −1.17 | 0.46 | −2.56 | 0.010* |
| FL6 | −0.06 | 0.35 | −0.16 | 0.874 | 0.17 | 0.47 | 0.36 | 0.721 |
| HO | −1.60 | 0.35 | −4.61 | <0.001 *** | −1.82 | 0.47 | −3.83 | <0.001 *** |
| IT | −0.92 | 0.33 | −2.76 | 0.006 ** | −2.34 | 0.47 | −5.03 | <0.001 *** |
| WA1 | 0.00 | 0.34 | −0.01 | 0.996 | −0.84 | 0.46 | −1.83 | 0.068 |
| WA2 | 0.10 | 0.35 | 0.29 | 0.768 | −0.23 | 0.47 | −0.49 | 0.624 |
| UK | −0.05 | 0.35 | −0.15 | 0.884 | −0.47 | 0.47 | −1.00 | 0.317 |
| 2017:FL2 | 0.73 | 0.45 | 1.62 | 0.106 | 0.79 | 0.41 | 1.94 | 0.052 |
| 2017:FL3 | 0.16 | 0.53 | 0.31 | 0.757 | 0.01 | 0.47 | 0.02 | 0.984 |
| 2017:FL4 | 0.20 | 0.45 | 0.44 | 0.658 | 0.43 | 0.41 | 1.04 | 0.299 |
| 2017:FL5 | 0.09 | 0.44 | 0.21 | 0.834 | 0.40 | 0.39 | 1.02 | 0.308 |
| 2017:FL6 | −0.06 | 0.46 | −0.13 | 0.898 | 0.22 | 0.41 | 0.53 | 0.598 |
| 2017:HO | 0.39 | 0.46 | 0.86 | 0.391 | −0.34 | 0.41 | −0.84 | 0.402 |
| 2017:IT | −0.33 | 0.44 | −0.76 | 0.450 | 0.66 | 0.40 | 1.65 | 0.100 |
| 2017:WA1 | 0.47 | 0.45 | 1.05 | 0.294 | 0.72 | 0.40 | 1.80 | 0.072 |
| 2017:WA2 | 0.19 | 0.46 | 0.41 | 0.683 | 0.99 | 0.41 | 2.42 | 0.016 * |
| 2017:UK | 0.82 | 0.45 | 1.81 | 0.070 | 1.13 | 0.41 | 2.76 | 0.006 ** |
Significant results: *** p < 0.001; ** p < 0.01; * p < 0.05.
Table 6.
Correlations between the timing of the four phenophases bud burst (Bb), flower opening (Fo), leaf senescence (Se) and leaf fall (Fa) in 2016 and 2017. Pearson correlation coefficients and corresponding p-values are indicated above and below the diagonal respectively. A correlation coefficient with a corresponding p-value below 0.001 is indicated in bold and is underlined, between 0.001 and 0.01 is in bold and between 0.01 and 0.05 is underlined.
| Bb2016 | Fo2016 | Se2016 | Fa216 | Bb2017 | Fo2017 | Se2017 | Fa2017 | |
|---|---|---|---|---|---|---|---|---|
| Bb2016 | 0.98 | −0.87 | −0.7 | 0.97 | 0.95 | −0.85 | −0.8 | |
| Fo2016 | < 0.001 | −0.86 | −0.65 | 0.94 | 0.92 | −0.81 | −0.73 | |
| Se2016 | < 0.001 | < 0.001 | 0.79 | −0.83 | −0.7 | 0.86 | 0.9 | |
| Fa2016 | 0.017 | 0.030 | 0.003 | −0.64 | −0.53 | 0.75 | 0.89 | |
| Bb2017 | < 0.001 | < 0.001 | 0.002 | 0.036 | 0.97 | −0.82 | −0.78 | |
| Fo2017 | < 0.001 | < 0.001 | 0.019 | 0.097 | < 0.001 | −0.75 | −0.65 | |
| Se2017 | < 0.001 | 0.002 | < 0.001 | 0.008 | 0.002 | 0.008 | 0.9 | |
| Fa2017 | 0.003 | 0.010 | < 0.001 | < 0.001 | 0.004 | 0.030 | < 0.001 |
© 2019 by the authors. Licensee MDPI, Basel, Switzerland. This article is an open access article distributed under the terms and conditions of the Creative Commons Attribution (CC BY) license (http://creativecommons.org/licenses/by/4.0/).
Share and Cite
MDPI and ACS Style
Vander Mijnsbrugge, K.; Janssens, A. Differentiation and Non-Linear Responses in Temporal Phenotypic Plasticity of Seasonal Phenophases in a Common Garden of Crataegus monogyna Jacq. Forests 2019, 10, 293. https://doi.org/10.3390/f10040293
AMA Style
Vander Mijnsbrugge K, Janssens A. Differentiation and Non-Linear Responses in Temporal Phenotypic Plasticity of Seasonal Phenophases in a Common Garden of Crataegus monogyna Jacq. Forests. 2019; 10(4):293. https://doi.org/10.3390/f10040293
Chicago/Turabian StyleVander Mijnsbrugge, Kristine, and Astrid Janssens. 2019. "Differentiation and Non-Linear Responses in Temporal Phenotypic Plasticity of Seasonal Phenophases in a Common Garden of Crataegus monogyna Jacq." Forests 10, no. 4: 293. https://doi.org/10.3390/f10040293
Note that from the first issue of 2016, this journal uses article numbers instead of page numbers. See further details here.