Screening of Applicable SSR Molecular Markers Linked to Creeping Trait in Crape Myrtle
by
 ,
,
Tangchun Zheng
1,2,3,4,5 ,
,
Bo Qin
1,2,3,4,5,6,
Suzhen Li
1,2,3,4,5,6,
Ming Cai
1,2,3,4,5,
Huitang Pan
1,2,3,4,5,
Jia Wang
1,2,3,4,5,
Tangren Cheng
1,2,3,4,5 and
Qixiang Zhang
1,2,3,4,5,6,* 1
Beijing Key Laboratory of Ornamental Plants Germplasm Innovation & Molecular Breeding, Beijing Forestry University, Beijing 100083, China
2
National Engineering Research Center for Floriculture, Beijing Forestry University, Beijing 100083, China
3
Beijing Laboratory of Urban and Rural Ecological Environment, Beijing Forestry University, Beijing 100083, China
4
Engineering Research Center of Landscape Environment of Ministry of Education, Beijing Forestry University, Beijing 100083, China
5
Key Laboratory of Genetics and Breeding in Forest Trees and Ornamental Plants of Ministry of Education, Beijing Forestry University, Beijing 100083, China
6
Beijing Advanced Innovation Center for Tree Breeding by Molecular Design, Beijing Forestry University, Beijing 100083, China
*
Author to whom correspondence should be addressed.
Forests 2019, 10(5), 429; https://doi.org/10.3390/f10050429
Submission received: 26 April 2019
/
Revised: 11 May 2019
/
Accepted: 17 May 2019
/
Published: 18 May 2019
(This article belongs to the Special Issue Genetic and Morphological Variation in Tropical and Temperate Plant Species)
Abstract
:Creeping plants have unique ornamental value because they have more branches and flowers and the creeping trait is rare in crape myrtle (Lagerstroemia indica L.). In this study, the first filial generation (F1) population was derived from Lagerstroemia fauriei Koehne (standard) and L. indica “Creole” (creeping) and the backcross1 (BC1) population was derived from the backcross of F1 individual S82 (creeping) and L. fauriei. The segregation of the creeping trait was analyzed for 174 seedlings of the BC1 population to examine the linkage relationship between simple sequence repeat (SSR) molecular markers and the creeping trait. Creeping genes were screened using bulked segregant analysis combined with 322 SSR primers, which were detected with good polymorphism. The results show that two SSR markers (S364 and LYS12) were detected, with genetic distances of 23.49 centimorgan (cM) and 25.86 cM from the loci controlling the plant opening angle trait and the branching angle trait, respectively. The accuracy rate for phenotypic verification using S364 and LYS12 was 76.51% and 74.14%, respectively. Our results provide basic information for the molecular marker-assisted selective breeding and cloning of the creeping gene to improve architecture diversity in the breeding of crape myrtle.
1. Introduction
Plant architecture is the result of long-term evolution and natural selection, which involve complex regulatory processes based on genetic and environmental interactions [1]. According to the different growth angles and branching directions, plant architecture can be roughly classified as standard, weeping, pillar, upright, brachytic, and dwarf [2]. Plant architecture traits have important application value for the improvement of crop production; for example, the cultivation of dwarf or semi-dwarf horticultural or agronomic crops improves yield and production efficiency because mechanized management is more conducive. The discovery and utilization of dwarf genes in rice, which greatly promoted grain production, led to the first “green revolution” in agriculture, demonstrating the importance of genetic resources [3,4]. The genetic regulation of plant architecture traits in woody plants is more complex than in herbaceous plants and plant architecture traits are susceptible to external environmental conditions [5]. Many studies have been performed on plant architecture for extreme plant types of trees, including pillar and weeping peach [6], dwarf and compact peach (Prunus persica L.) [7], weeping Prunus mume [8], weeping Cercis chinensis [9], and columnar and weeping apple (Malus × domestica) [10,11].
Molecular marker technology can reflect the differences between DNA sequences for different species and is widely used in plant genetic diversity analysis, genetic map construction, map-based cloning, and marker-assisted selective breeding [12,13,14]. Individual hybrids with target traits can be selected at the seedling stage using molecular marker-assisted selection, which reduces resource waste and breeding cost and speeds up the breeding process [15]. Bulked segregant analysis (BSA) is derived from near-isogenic line analysis, which was reported for the first time in 1991 [16]. SSR markers are widely used in relationship analysis, genetic diversity analysis, mapping quantitative trait locus (QTL), and so on. Four expressed sequence tag (EST)-SSR marker loci closely linked to the dwarf trait in pear were found by BSA technology. In Actinidia chinensis Planch, an EST-SSR marker was screened and the genetic distance between the marker and dwarf gene was 8.8 cM [17]. Three selected EST-SSR markers were used to determine genetic structure in 29 cultivars and were used for fruit color selection in Prunus salicina breeding [18]. In addition, DNA markers associated with the dwarf trait from Brassica napus [19], Prunus persica [20], and Avena sativa [21] have been studied.
Lagerstroemia L. (crape myrtle) belongs to the Lythraceae family, which includes at least 50 species of deciduous or evergreen shrubs or trees native to Southeast Asia [22]. China is located in the center of the worldwide Lagerstroemia distribution and origin [23]. Crape myrtle was first cultivated as an ornamental species in China approximately 1800 years ago [24]. Species in this genus are highly valued in landscaping for their graceful plant architecture, long-lasting flowering period, and colorful flowers during the summer [25]. When exposed to natural conditions, crape myrtle is a diploid plant (2n = 2x = 48) [26]. Crape myrtle is susceptible to powdery mildew; therefore, the initial purpose for hybrid breeding by interspecific hybridization between L. indica and L. fauriei was for disease resistance and then a series of excellent varieties with various plant architecture types and colorful flowers was selected from the resistant hybrid offspring (‘Pocomoke”) [27,28,29]. Lagerstroemia species are self-compatible and easily produce interspecific hybrids with related species. To further improve the ornamental value of hybrids with a larger flower diameter, Lagerstroemia speciosa and L. indica were used for interspecific hybridization and hybrid seedlings with traits of the parents were obtained; however, only plant height and plant width had the characteristics of the hybrids and no variation in flower color or flower size was observed [30]. Recently, research in America, Japan, and China has focused on breeding new cultivars with unique plant architecture, especially dwarf or potted crape myrtle. A few dwarf crape myrtle cultivars with many branches and large flowers were bred through intraspecific hybridization (L. indica) with the aim of generating dwarf plant architecture [31,32,33,34,35].
The molecular study of Lagerstroemia species has led to the development of a series of genomic SSR markers [26,36,37,38,39,40]. Two single nucleotide polymorphism (SNP) markers (M16337 and M38412) that are highly correlated with internode length and one SNP marker (M25207) that is highly correlated with primary lateral branch height were validated in the F1 population of L. indica [41]. In addition, an SSR marker linked to the dwarf gene, with a genetic distance of 23.33 cM, was screened from the L. fauriei × L. indica “Pocomoke” F1 population [35]. Currently, less is known about the plant architecture of the crape myrtle, especially the creeping trait. To analyze the linkage relation between SSR molecular markers and creeping trait, the segregation of the creeping trait was analyzed by the BSA method using the BC1 population with 174 hybrids and 322 SSR primers. Our results provide an important technical and theoretical basis for plant architecture molecular marker-assisted selective breeding for the Lagerstroemia species.
2. Materials and Methods
2.1. Plant Materials
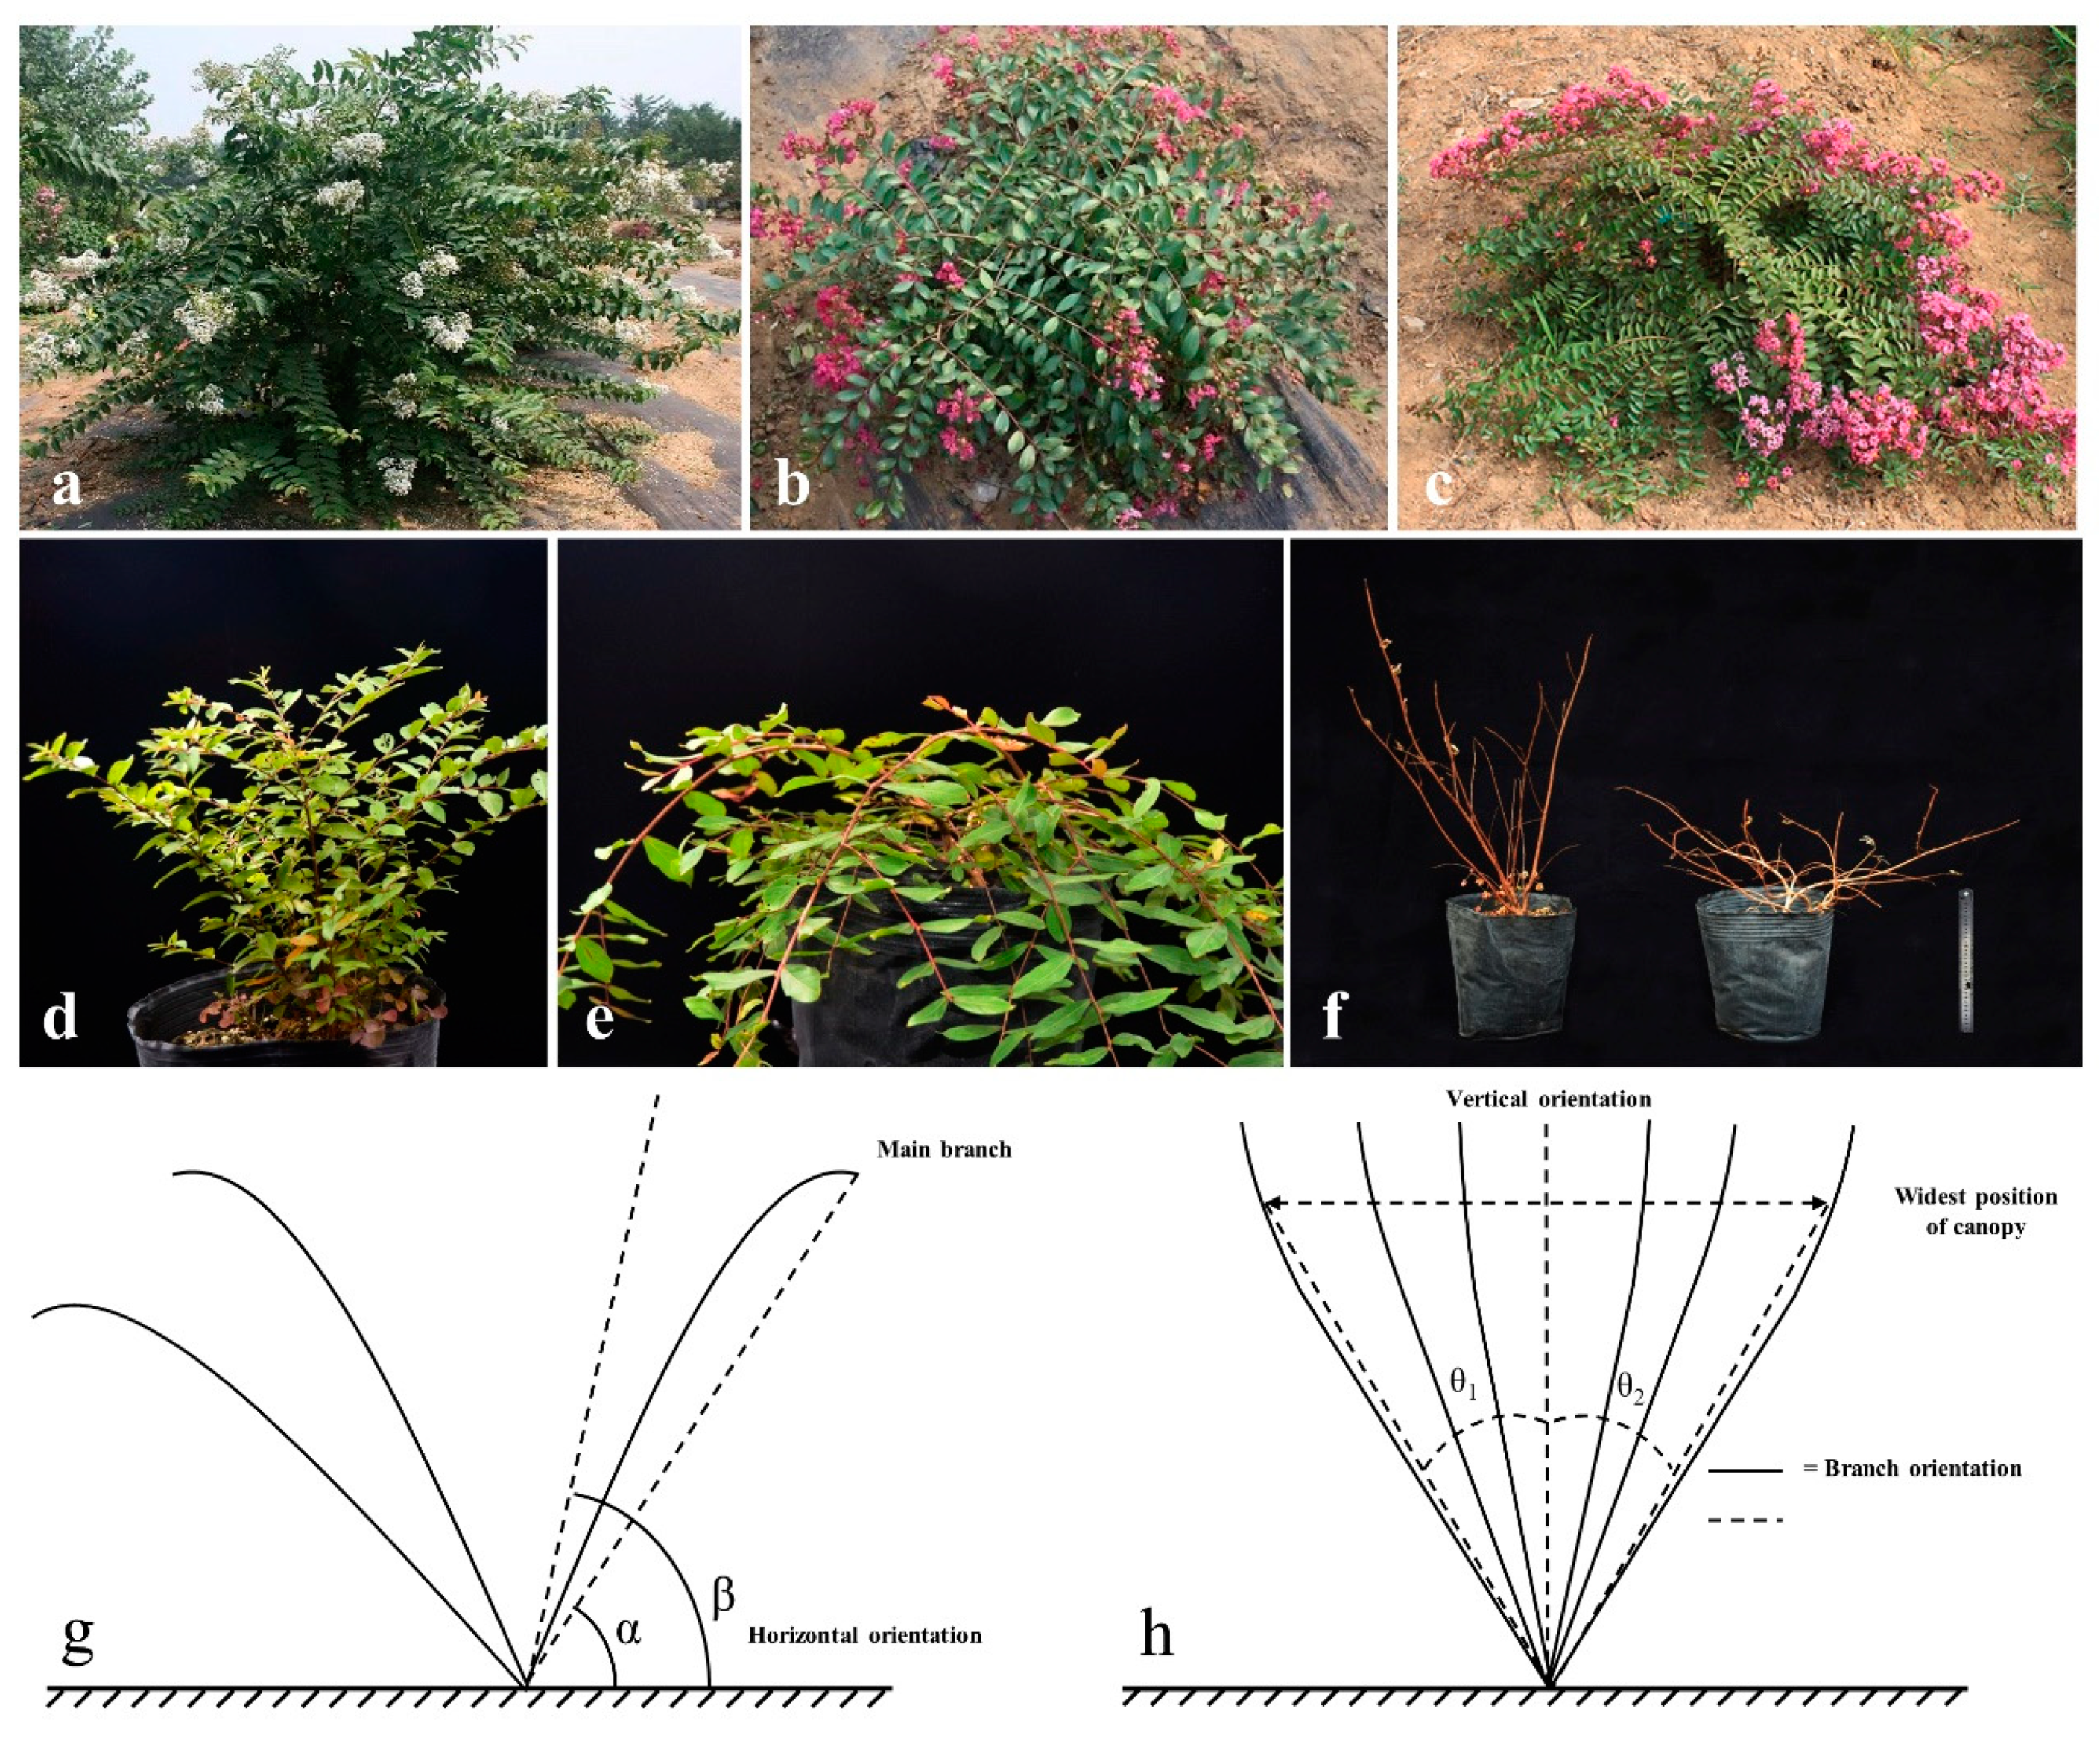
The F1 population was derived from L. fauriei (♀, standard) and L. indica “Creole” (♂, creeping). To analyze the linkage relation between SSR markers and creeping trait, the BC1 segregation population was derived from a backcross of the F1 creeping individual S82 (♀) × L. fauriei (♂). The F1 female parent was a tree (>3 m) with standard branching and the male parent was a dwarf plant (0.3–0.5 m) with creeping branching. The F1 individual S82 had the same phenotype as L. indica “Creole”. The linkage relationship between SSR markers was analyzed for 174 individuals of the BC1 population. All of the materials were planted in a breeding nursery at the National Engineering Research Center for Floriculture (Beijing) (40°02’ N, 115°50’ E) (Figure 1).
2.2. Phenotypic Measurement and Data Analysis
Phenotypic traits related to plant architecture, i.e., plant height (PH), plant width (PW), plant canopy angle (PCA), branching angle of the main branch (BA), the number of main branches (NMB), and branching height (BH), were measured for 174 individuals from the S82 (♀) × L. fauriei (♂) population at the end of the growing season. In addition, leaf length (LL) and leaf width (LW) were measured during the peak of the growing season. PH and BH were measured at the highest point, and PW was measured at horizontal direction by ruler. LL and LW were measured with an electronic vernier caliper. Each trait was measured more than three times. NMB was directly visualized. The measurements of the above phenotypic traits were described by Ye et al. [35,37].
The branching angle of the main branch corresponds to the angle between the main branch and the horizontal direction. In [42], it is reported that the angle between the horizontal direction and the line connecting the basal branch and apical branch (angle α in Figure 1g) is a more reliable parameter than branch growing angle (angle β in Figure 1g). Moreover, this more reliable angle is more closely related to plant architecture and measures the branching angle of the main branch by the measurement of angle α. PCA and BA were measured by a huge protractor suspended at the origin. The plant canopy angle (θ = θ1 + θ2, Figure 1h) was measured according to Thakur et al. [43].
Genetic variation analyses were performed on phenotype traits of BC1 population using SPSS 22.0 software (SPSS, Chicago, IL, USA). Statistical parameters included mean, maximum, minimum, variance, standard deviation, skewness, peakness, and coefficient of variation and plot the frequency distribution. The Pearson correlation coefficient between traits was calculated by the Correlations module in SPSS software and significant difference tests were performed at different levels.
2.3. DNA Extraction and Detection
Genomic DNA was extracted from fresh young leaves using the Fast DNA kit (Tiangen Biotech, Beijing, China) following the manufacturer’s protocol. DNA quality and concentration were measured by 1% agarose gel electrophoresis with Gel Red [44].
2.4. Construction of Near-Isogenic Pools
The construction of near-isogenic pools was based on the methods reported by Michelmore et al. [16]. Five extremely standard individuals and five extremely creeping individuals (as described in Figure 1f) were randomly selected from 174 individuals in BC1 population and their genomic DNA was mixed to construct standard and creeping gene pools, respectively. The standard gene pool was denoted BZ, whereas the creeping gene pool was denoted BP.
2.5. Screening SSR Markers Linked to Creeping Strains
DNA from eight BC1 individuals was selected randomly to detect the polymorphism of the new SSR primers. Based on all the highly polymorphic primers in crape myrtle, two near-isogenic pools (BZ, BP) and three standard and three creeping individuals were then randomly selected and screened by SSRs. The 322 pairs of primers used in the experiment were developed using the transcriptome data from a previous study [45] (Table S1).
PCR products were detected by non-denaturing polyacrylamide gel electrophoresis. If the product strips with polymorphisms in two pools were similar for six plants, it was initially concluded that it may relate to plant architecture of crape myrtle. These primers were detected in parents and segregating populations and were correlated with phenotypic data and genetic distance (cM) between the SSR markers. The genes related to plant architecture were identified by Kosambi’s method [46]. Furthermore, the validity of the screened polymorphic marker was verified by varieties in a germplasm resource nursery.
3. Results
3.1. Segregation Analysis of Phenotypic Variation in BC1 Populations
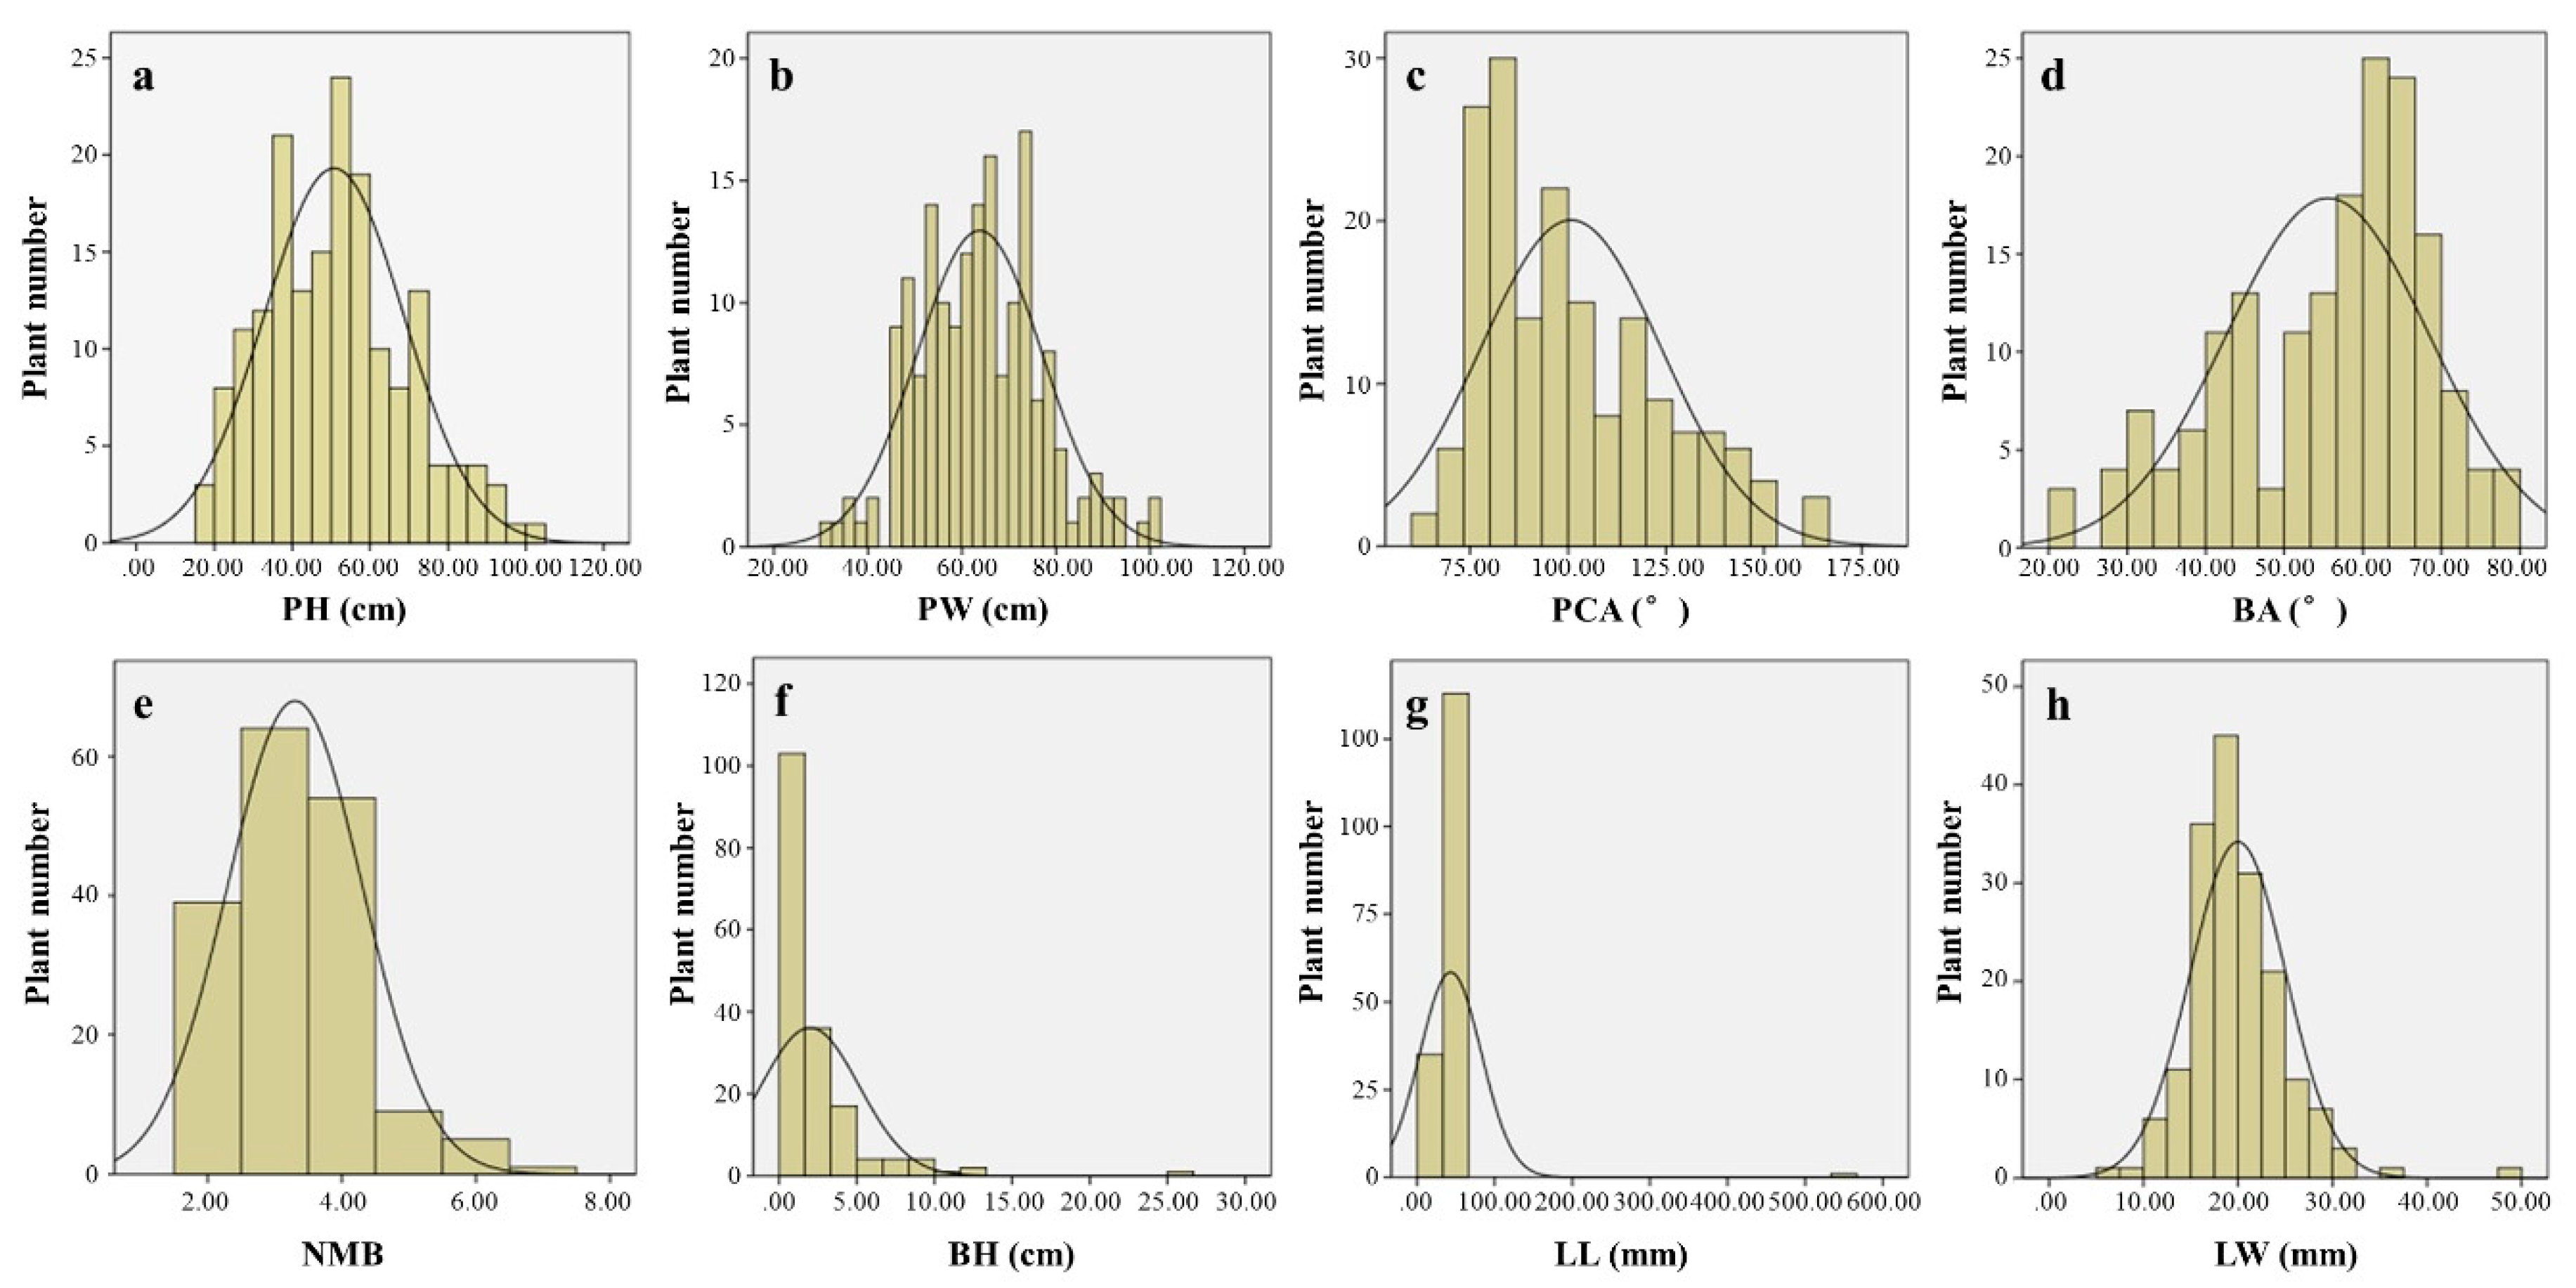
Eight statistical parameters were calculated from eight phenotypic characters (PH, PW, PCA, BA, NMB, BH, LL, and LW), and the frequency distribution histogram was constructed using SPSS 22.0 and Excel (Figure 2). In the S82 × L. fauriei population, the coefficients of genetic variation were between 20.09% and 35.49%, except for the BH genetic variation coefficient. The highest degree of variation was observed for PH followed by NMB, whereas the smallest variation was observed for PCA. The variability in the measured traits among individuals was greater than 10%, indicating significant genetic variation in these traits (Table 1).
3.2. Correlation Analysis of Population Phenotypic Traits
The correlation between the eight phenotypic characters was analyzed by SPSS (Table 2). PCA showed a significant positive correlation with NMB and a significant negative correlation with PH and BA. BA showed a significant positive correlation with PH and a significant negative correlation with PCA and NMB.
3.3. Detection of Near-Isogenic Pools, Parents, and BC1 Segregation Populations by SSR Markers
High polymorphism was detected for 322 pairs of SSR primers for eight BC1 individuals (selected randomly from BC1). The 322 pairs of primers with high polymorphism were screened using the standard gene pool BZ and creeping gene pool BP as templates. Finally, four pairs of SSR primers with polymorphic strips were screened in two gene pools (Figure 3).
Primers that are polymorphic in both gene pools were further amplified in the parents and other hybrids to determine strip type. Of the above four primers, only S364 and LYS12 were able to amplify strips based on the phenotype of the parents (Figure S1, Table 3) and 174 individuals of the segregating population (Figure S2 and Figure S3).
3.4. Linkage Analysis of Markers and Phenotypes
From the continuous observation of the BC1 population, we found that PH, PW, NMB, and BH changed over time, whereas the ratio between the plant width and plant height (PW/PH), PCA, and BA maintained a relatively stable state. The statistical results of the phenotypes of the BC1 population and parents were listed in Table S2. A histogram of the frequency distribution for three traits (PW/PH, PCA, and BA) of the parents for the BC1 population was drawn using Excel software (Figure S4). Based on the phenotypic data for parents and hybrids, the plant architecture of crape myrtle was classified into six classes using PW/PH, PCA, and BA. Artificially, PW/PH less than 1.5 were classified as G-type and all others were H-type. PCA was classified as J-type or K-type depending on whether values were less than 90°. Similarly, BA was classified as U-type or V-type depending on whether values were greater than 60° (Table 4). It can be seen that types G, J, and U correspond to plants with smaller PW/PH, smaller PCA, and larger BA, respectively; namely, plant architecture will be creeping and flat. Conversely, H-, K-, and V-types correspond to those with larger PW/PH, larger PCA, and smaller BA, which means that the plant architecture is more vertical. The segregation ratio of traits in the hybrids of the population implies that the upright type has a dominant effect on the creeping type. It is preliminarily considered that the upright/creeping type of Lagerstroemia species is controlled by both the major gene and the minor genes.
According to phenotypic grading standards, phenotypic statistics, and the strip type of the parents and two gene pools, the phenotypes and strips of 174 individuals were comparatively analyzed. The results showed that phenotypes G, J, and U correspond to the strip type “m” for primer S364 and strip type “b” for primer LYS12. Phenotypes H, K, and V correspond to strip type “a” for primer S364 and strip type “n” for primer LYS12 (Table S3). Statistical analysis showed that primer S364 correlated with PCA (J-type and K-type) and primer LYS12 correlated with BA (U-type and V-type).
Among the 174 tested individuals, eight individuals did not amplify the objective strips in primer S364, whereas all individuals amplified objective strips in primer LYS12. There are 127 and 129 strips that conformed to the phenotype in primers S364 and LYS12, respectively (Table 5). Based on statistical results, the genetic distance between the S364 molecular marker and the gene that controls PCA was approximately 23.49 cM. The genetic distance between the LYS12 molecular marker and the gene that controls BA was approximately 25.86 cM. Two SSR molecular markers were verified in the BC1 population and the accuracy rate of phenotypic verification using S364 and LYS12 was 76.51% and 74.14%, respectively (Table 6).
Two markers, S364 and LYS12, were further identified in 20 Lagerstroemia species or cultivars (16 were upright trees or shrubs and 4 were low shrubs with creeping or flat branches) and the strip types were recorded. As shown in Table 7, the comparison of plant architecture types and two marker strip types showed that 15 of 20 cultivars were identified by the S364 marker and the accuracy rate of phenotypic identification was 75%. Eighteen cultivars were identified with LYS12 marker bands and the accuracy rate of phenotypic identification was 90%. These results indicate that the two markers were able to accurately identify phenotypic traits in crape myrtle cultivars.
4. Discussion
Crape myrtle is popular and widely used in gardens because of its long flowering time and rich and colorful flowers. It can be planted alone or in clusters, used for garden flower belts, or cut flowers can be displayed in vases after pruning and pinning. The lack of varieties with diverse plant architecture types, flowers with a pleasant fragrance, and early-flowering features limits the further application of crape myrtle. Plant architecture traits (e.g., dwarf, weeping, creeping, columnar, and branching angle) have attracted much attention; these have potentially important application value for the plant architecture improvement of horticultural crops. Dwarf crape myrtles are becoming increasingly popular for use as potted plants and indoor flowers [47]. However, dwarfing and the arborization of trees are complex quantitative traits, which have greater non-additive effects on genetic performance and heritability. The columnar trait is controlled by a single gene (Co); however, other modification genes that may also play a role have been confirmed in apple [11]. Incomplete dominant columnar traits (pillar) also exist in peach, with a small branching angle and vertical growth of branches, but no obvious genetic segregation rule was observed for dwarf and compact traits [7].
In this study, the number of upright and creeping individuals for the F1 of L. fauriei and L. indica “Creole” was 140 and 52, respectively, and the ratio of the two plant types was 2.69/1. In the BC1 population of S82 × L. fauriei, the ratio of upright (138) to creeping (36) individuals was 3.83/1. However, in the BC1 population of S82 × L. indica “Creole”, the number of upright and creeping individuals was 42 and 150, respectively, with a ratio of 1/3.57 (Table S4). In the F1 and S82 × L. fauriei populations, the number of upright individuals was much larger than that of creeping individuals because all hybrids were derived from crosses between upright and creeping parents. Although both parents (S82 × L. indica “Creole”) were creeping types, upright individuals still appeared in their hybrids (Table S4). The comprehensive analysis of the segregation of two plant architecture types in three genetic populations cannot determine the number of genes controlling the creeping trait. However, the analysis shows that the upright type has a dominant effect on the creeping type. The upright/creeping plant type of crape myrtle is speculated to be controlled by a major gene and also regulated by minor genes. Our recent research results show that the dwarf trait of crape myrtle is also likely controlled by a major gene and modified by minor genes based on the phenotypic data in the F1 population of L. fauriei (♀) × L. indica “Pocomoke” (♂) [35]. Correlation analysis between phenotypic traits is helpful to advance the selection of plant architecture in crape myrtle seedlings, which can shorten the breeding time and enhance breeding efficiency. A significant positive correlation was observed between PH and PW. PCA is verified by individual traits in the BC1 population, which is similar to the correlation obtained for the F1 population generated from L. caudate (♀) and L. indica “Xiang Xueyun” (♂) [36]. Eleven quantitative characters for 192 individuals in the F1 population from a cross between L. fauriei (♀) and L. indica “Creole” (♂) were measured and analyzed; the results showed that the diversity index for plant architecture was 1.05 times greater than 1, which means that there is great potential for genetic improvement of the plant architecture [48]. In addition, most quantitative characters were significantly correlated with plant architecture and branching pattern. The results of heredity for some traits in the F1 population of L. speciosa and L. indica showed that the coefficient of variation in the F1 generation was 14.58–40.16%, which indicates significant variation [49].
Traditional breeding methods have the disadvantages of a long cycle, heavy workload, and low effectiveness for improving tree architecture. By using molecular marker-assisted selection, healthy individual plants with target traits can be selected at the seedling stage, which reduces the waste of resources, reduces the cost of breeding, and speeds up the breeding process [15]. BSA overcomes the constraints of near-isogenic lines and saves time and effort; it is widely used in marker development and gene mapping [16]. Because BSA does not require a large population, it is very popular in the study of the plant architecture traits of woody plants, such as apple (vertical traits) and peach (columnar and vertical traits) and in the development of genes and markers for peach weeping traits [2,10,50]. In ground-cover chrysanthemum, a random amplified polymorphic DNA (RAPD) marker A-10555 linked to the creeping trait was 7.96 cM from the loci controlling creeping/standard traits [51]. In crape myrtle, an SSR marker was identified and linked to the dwarf gene with a distance of 23.33 cM between the loci and dwarf gene [35]. In this study, two SSR markers (S364 and LYS12) closely linked to creeping traits in crape myrtle were obtained according to the principle of BSA. One marker was linked to PCA, with a genetic distance of 23.49 cM, and the other was linked to BA, with a genetic distance of 25.86 cM. The two markers were verified in the BC1 population, parents, species, and varieties with high accuracy, which suggests that it is feasible to use these two markers to perform molecular marker-assisted breeding of a creeping plant type for crape myrtle. Previous research indicates that the polymorphic loci assayed within 15 cm of the target locus can be identified; loci are detected with decreasing frequency as genetic distance increases [16]. Therefore, the difference between two near-isogenic pools cannot be determined with the genetic distance of 23.49 cM and 25.86 cM from creeping genes. In addition, BSA has limitations in locating quantitative traits, which can only detect large-effect QTLs and require samples with large phenotypic differences when near-isogenic pools are constructed. In the future, we can use multi-generational hybridization and backcrossing to obtain populations with more significant phenotypic segregation to construct pools and screen markers. Additionally, the number of species-specific molecular markers is a critical factor that influenced the results of this experiment. To achieve an ideal effect in the marker-assisted selection of the creeping trait, we will develop more species-specific molecular markers to enhance the coverage area of the crape myrtle genome.
5. Conclusions
Crape myrtle is a widely used horticultural plant with important ornamental value, but it lacks creeping varieties. This study is the first to map creeping genes in Lagerstroemia species. In a BC1 population derived from L. fauriei Koehne (standard) and L. indica “Creole” (creeping), 174 individuals were employed to screen molecular markers linked to the creeping trait of crape myrtle among 322 SSR primers with good polymorphism using BSA and SSR technologies. Two SSR markers (S364 and LYS12), which were 23.49 cM and 25.86 cM from the loci controlling plant opening angle trait and branching angle trait, were detected and further verified in the population, parents, species, and varieties with more than 74% accuracy, respectively. Our study will lay the foundation for the QTL mapping and marker-assisted selection breeding for creeping architecture of crape myrtle.
Supplementary Materials
The following are available online at https://www.mdpi.com/1999-4907/10/5/429/s1. Figure S1: Electrophoretic results of S364 primers in BC1 individuals; Figure S2: Electrophoretic results of LYS12 primers in BC1 individuals; Figure S3: Electrophoresis of S364 and LYS12 amplification products in parents. (a) Electrophoretic results of S364 primers; (b) Electrophoretic results of LYS12 primers; Figure S4: Distribution of three traits of BC1 population. P1: L. fauriei, P2: L. indica “Creole”, P3: S82 individual, Table S1: Sequence of 322 pairs of primers used in the study; Table S2: Phenotypic characters of parents and BC1 plants; Table S3: Phenotype and strip type of 174 individuals in BC1 population; Table S4: Classification of phenotype of 174 individuals in F1 population of L. fauriei and L. indica “Creole”.
Author Contributions
Conceptualization, T.Z.; data curation, T.Z., B.Q., and H.P.; formal analysis, T.Z., B.Q., and S.L.; funding acquisition, Q.Z.; investigation, B.Q., M.C., and T.C.; methodology, B.Q., S.L., and M.C.; project administration, T.Z. and Q.Z.; resources, M.C., H.P., J.W., and T.C.; software, B.Q., S.L., H.P., and J.W.; writing—original draft, T.Z. and B.Q.; writing—review and editing, T.Z. and Q.Z.
Funding
This work was supported by the program for Science and Technology of Beijing (No. Z181100002418006) and Special Fund for Beijing Common Construction Project.
Acknowledgments
We are thankful to American Journal Experts (AJE) for suggesting professional native English speaker for our manuscript.
Conflicts of Interest
The authors declare no conflict of interest and this research is carried on the absence of any financial or commercial relationships that could be interpreted to a potential conflict of interest.
Abbreviations
| BA | Branching angle of the main branch |
| BC1 | Backcross1 |
| BH | Branching height |
| BSA | Bulked segregant analysis |
| cM | Centimorgan |
| DNA | Deoxyribonucleic acid |
| EST-SSR | Expressed sequence tag |
| F1 | First filial generation |
| LL | Leaf length |
| LW | Leaf width |
| NMB | Number of main branches |
| PCA | Plant canopy angle |
| PCR | Polymerase chain reaction |
| PH | Plant height |
| PW | Plant width |
| QTL | Quantitative trait locus |
| RAPD | Random amplified polymorphic DNA |
| SNP | Single nucleotide polymorphism |
| SSR | Simple sequence repeat |
References
- McSteen, P.; Leyser, O. Shoot branching. Annu. Rev. Plant Biol. 2005, 56, 353–374. [Google Scholar] [CrossRef]
- Hollender, C.A.; Dardick, C. Molecular basis of angiosperm tree architecture. New Phytol. 2015, 206, 541–556. [Google Scholar] [CrossRef]
- Sasaki, A.; Ashikari, M.; Ueguchi-Tanaka, M.; Itoh, H.; Nishimura, A.; Swapan, D.; Ishiyama, K.; Saito, T.; Kobayashi, M.; Khush, G.S.; et al. Green revolution: A mutant gibberellin-synthesis gene in rice. Nature 2002, 416, 701–702. [Google Scholar] [CrossRef] [PubMed]
- Peng, J.; Richards, D.E.; Hartley, N.M.; Murphy, G.P.; Devos, K.M.; Flintham, J.E.; Beales, J.; Fish, L.J.; Worland, A.J.; Pelica, F.; et al. Green revolution’ genes encode mutant gibberellin response modulators. Nature 1999, 400, 256–261. [Google Scholar] [CrossRef] [PubMed]
- Costes, E.; Gion, J. Genetics and genomics of tree architecture. Adv. Bot. Res. 2015, 74, 157–200. [Google Scholar]
- Werner, D.J.; Chaparro, J.X. Genetic interactions of pillar and weeping peach genotypes. Hortscience 2005, 40, 18–20. [Google Scholar]
- Scorza, R.; Bassi, D.; Liverani, A. Genetic interactions of pillar (columnar), compact, and dwarf peach tree genotypes. J. Am. Soc. Hortic. Sci. 2002, 127, 254–261. [Google Scholar] [CrossRef]
- Zhang, J.; Zhang, Q.; Cheng, T.; Yang, W.; Pan, H.; Zhong, J.; Huang, L.; Liu, E. High-density genetic map construction and identification of a locus controlling weeping trait in an ornamental woody plant (Prunus mume Sieb. Et Zucc). Dna. Res. 2015, 22, 183–191. [Google Scholar] [CrossRef]
- Roberts, D.J.; Werner, D.J.; Wadl, P.A.; Trigiano, R.N. Inheritance and allelism of morphological traits in eastern redbud (Cercis canadensis L.). Hortic. Res. 2015, 2, 15049. [Google Scholar] [CrossRef]
- Dougherty, L.; Singh, R.; Brown, S.; Dardick, C.; Xu, K. Exploring DNA variant segregation types in pooled genome sequencing enables effective mapping of weeping trait in Malus. J. Exp. Bot. 2018, 69, 1499–1516. [Google Scholar] [CrossRef] [PubMed]
- Baldi, P.; Wolters, P.J.; Komjanc, M.; Viola, R.; Velasco, R.; Salvi, S. Genetic and physical characterisation of the locus controlling columnar habit in apple (Malus × domestica Borkh.). Mol. Breed. 2013, 31, 429–440. [Google Scholar] [CrossRef]
- Li, T.; Liu, J.; Xie, Y.; Wang, Q.; Meng, F. Analysis of genetic diversity in Prunus mira Koehne ex Sargent populations using AFLP markers. Plant Syst. Evol. 2014, 300, 475–482. [Google Scholar] [CrossRef]
- Salazar, J.A.; Ruiz, D.; Campoy, J.A.; Sánchez-Pérez, R.; Crisosto, C.H.; Martínez-García, P.J.; Blenda, A.; Jung, S.; Main, D.; Martínez-Gómez, P. Quantitative trait loci (QTL) and Mendelian trait loci (MTL) analysis in Prunus: A breeding perspective and beyond. Plant Mol. Biol. Rep. 2014, 32, 1–18. [Google Scholar] [CrossRef]
- Sun, L.; Yang, W.; Zhang, Q.; Cheng, T.; Pan, H.; Xu, Z.; Zhang, J.; Chen, C. Genome-wide characterization and linkage mapping of simple sequence repeats in mei (Prunus mume Sieb. Et Zucc.). PLoS ONE 2013, 8, e59562. [Google Scholar] [CrossRef]
- Scorza, R. Theory and practice of genetically manipulating peach tree architecture. NY Fruit Q. 2005, 13, 27–31. [Google Scholar]
- Michelmore, R.W.; Paran, I.; Kesseli, R.V. Identification of markers linked to disease-resistance genes by bulked segregant analysis: A rapid method to detect markers in specific genomic regions by using segregating populations. Proc. Natl. Acad. Sci. USA 1991, 88, 9828–9832. [Google Scholar] [CrossRef]
- Xu, X.; Jiang, C.; Liao, J.; Gu, Q.; Liu, S.; Chen, J. Screening of EST-SSR marker linked to dwarf character in Actinidia chinensis Planch. Acta Hortic. Sin. 2010, 37, 553–558. [Google Scholar]
- Gonzalez, M.; Salazar, E.; Castillo, J.; Morales, P.; Mura-Jornet, I.; Maldonado, J.; Silva, H.; Carrasco, B. Genetic structure based on EST-SSR: A putative tool for fruit color selection in Japanese plum (Prunus salicina L.) breeding programs. Mol. Breed. 2016, 36, 68. [Google Scholar] [CrossRef]
- Foisset, N.; Delourme, R.; Barret, P.; Renard, M. Molecular tagging of the dwarf BREIZH (Bzh) gene in Brassica napus. Theor. Appl. Genet. 1995, 91, 756–761. [Google Scholar] [CrossRef]
- Warburton, M.L.; Becerra-Velasquez, V.L.; Goffreda, J.C.; Bliss, F.A. Utility of RAPD markers in identifying genetic linkages to genes of economic interest in peach. Theor. Appl. Genet. 1996, 93, 920–925. [Google Scholar] [CrossRef]
- Milach, S.; Rines, H.W.; Phillips, R.L. Molecular genetic mapping of dwarfing genes in oat. Theor. Appl. Genet. 1997, 95, 783–790. [Google Scholar] [CrossRef]
- Byers, D. Crapemyrtle: A grower’s thoughts; Owl Bay Publishers: Auburn, AL, USA, 1997. [Google Scholar]
- Egulf, D.R.; Andrick, A. The Lagerstroemia Handbook/Checklist: A Guide to Crape Myrtle Cultivars; American Association of Botanical Gardens and Arboreta, Inc.: Las Cruces, NM, USA, 1978. [Google Scholar]
- Zhang, Q. Studies on Cultivars of Crape-myrtle (Lagerstroemia indica) and their uses in urban greening. J. Beijing For. Univ. 1991, 4, 57–66. [Google Scholar]
- Pooler, M.R. Molecular genetic diversity among 12 clones of Lagerstroemia fauriei revealed by AFLP and RAPD markers. Hortscience 2003, 38, 256–259. [Google Scholar] [CrossRef]
- Wang, X.; Wadl, P.A.; Pounders, C.; Trigiano, R.N.; Cabrera, R.I.; Scheffler, B.E.; Pooler, M.; Rinehart, T.A. Evaluation of genetic diversity and pedigree within crape myrtle cultivars using simple sequence repeat markers. J. Am. Soc. Hortic. Sci. 2011, 136, 116–128. [Google Scholar] [CrossRef]
- Egolf, D.R. ‘Biloxi’, ‘Miami’, and ‘Wichita’ Lagerstroemia. HortScience (USA) 1987, 22, 336–338. [Google Scholar]
- Pooler, M.R.; Dix, R.L. Chickasaw’, kiowa’, and Pocomoke’ Lagerstroemia. Hortscience 1999, 34, 361–363. [Google Scholar] [CrossRef]
- Hagan, A.K.; Keever, G.J.; Gilliam, C.H.; Williams, J.D.; Creech, G. Susceptibility of crapemyrtle cultivars to powdery mildew and Cercospora leaf spot in Alabama. J. Environ. Hortic. 1998, 16, 143–147. [Google Scholar]
- Pounders, C.; Rinehart, T.; Sakhanokho, H. Evaluation of interspecific hybrids between Lagerstroemia indica and L. speciosa. Hortscience 2007, 42, 1317–1322. [Google Scholar] [CrossRef]
- Katsuo, K. Crape-Myrtle Named Purple Queen. U.S. Patent US PP07: 957, 1992. [Google Scholar]
- Katsuo, K. Crape-Myrtle Named White Fairy. U.S. Patent US PP07: 968, 1992. [Google Scholar]
- Pooler, M.R. Arapaho’ and Cheyenne’ Lagerstroemia. Hortscience 2006, 41, 855–856. [Google Scholar] [CrossRef]
- Ye, Y.J.; Wu, J.; Feng, L.; Ju, Y.; Cai, M.; Cheng, T.; Pan, H.; Zhang, Q. Heritability and gene effects for plant architecture traits of crape myrtle using major gene plus polygene inheritance analysis. Sci. Hortic.-Amst. 2017, 225, 335–342. [Google Scholar] [CrossRef]
- Ye, Y.J.; Liu, Y.; Cai, M.; He, D.; Shen, J.S.; Ju, Y.Q.; Bian, X.M.; Pan, H.T.; Zhang, Q.X. Screening of molecular markers linked to dwarf trait in crape myrtle by bulked segregant analysis. Genet. Mol. Res. 2015, 14, 4369–4380. [Google Scholar] [CrossRef]
- He, D.; Liu, Y.; Cai, M.; Pan, H.T.; Zhang, Q.X.; Wang, X.Y.; Wang, X.J. Genetic diversity of Lagerstroemia (Lythraceae) species assessed by simple sequence repeat markers. Genet. Mol. Res. 2012, 11, 3522–3533. [Google Scholar] [CrossRef] [PubMed]
- Cai, M.; Pan, H.; Wang, X.; He, D.; Wang, X.; Wang, X.; Zhang, Q. Development of novel microsatellites in Lagerstroemia indica and DNA fingerprinting in Chinese Lagerstroemia cultivars. Sci. Hortic.-Amst. 2011, 131, 88–94. [Google Scholar] [CrossRef]
- Wang, J.; Dai, X.; Chen, Y.; Yang, Y.; Zhang, X.; Li, S.; Yin, T. Genomic sequencing using 454 pyrosequencing and development of an SSR primer database for ‘Lagerstroemia indica’ L. Plant Omics 2015, 8, 17. [Google Scholar]
- He, D.; Liu, Y.; Cai, M.; Pan, H.; Zhang, Q. The first genetic linkage map of crape myrtle (Lagerstroemia) based on amplification fragment length polymorphisms and simple sequence repeats markers. Plant Breed. 2014, 133, 138–144. [Google Scholar] [CrossRef]
- Liu, Y.; He, D.; Cai, M.; Tang, W.; Li, X.Y.; Pan, H.T.; Zhang, Q.X. Development of microsatellite markers for Lagerstroemia indica (Lythraceae) and related species. Appl. Plant Sci. 2013, 1, 1200203. [Google Scholar] [CrossRef]
- Ye, Y.; Cai, M.; Ju, Y.; Jiao, Y.; Feng, L.; Pan, H.; Cheng, T.; Zhang, Q. Identification and validation of SNP markers linked to dwarf traits using SLAF-Seq technology in Lagerstroemia. PLoS ONE 2016, 11, e158970. [Google Scholar] [CrossRef]
- Bassi, D.; Rizzo, M. Peach breeding for growth habit. Acta Hortic. 2000, 1, 411–414. [Google Scholar] [CrossRef]
- Thakur, A.K.; Uphoff, N.; Antony, E. An assessment of physiological effects of system of rice intensification (SRI) practices compared with recommended rice cultivation practices in India. Exp. Agr. 2010, 46, 77–98. [Google Scholar] [CrossRef]
- Zhu, R.R.; Gao, Y.K.; Xu, L.J.; Zhang, Q.X. Genetic diversity of Aquilegia (Ranunculaceae) species and cultivars assessed by AFLPs. Genet. Mol. Res. 2011, 10, 817–827. [Google Scholar] [CrossRef]
- Ju, Y.; Feng, L.; Wu, J.; Ye, Y.; Zheng, T.; Cai, M.; Cheng, T.; Wang, J.; Zhang, Q.; Pan, H. Transcriptome analysis of the genes regulating phytohormone and cellular patterning in Lagerstroemia plant architecture. Sci. Rep. 2018, 8, 15162. [Google Scholar] [CrossRef]
- Kosambi, D.D. The estimation of map distances from recombination values. Ann. Hum. Genet. 2016, 12, 125–130. [Google Scholar]
- Guidry, R.K.; Einert, A.E. Potted dwarf crape myrtles: A promising new floriculture crop. Flor. Rev. 1975, 157, 30. [Google Scholar]
- Shi, J.; Chen, Z.; Qin, B.; Cai, M.; Pan, H.; Zhang, Q. Phenotypic and genetic analysis of reptant plant type, applanate branch and other related characters in Lagerstroemia indica. Adv. Ornam. Hortic. China 2016, 1, 100–109. [Google Scholar]
- Jiao, Y.; Feng, L.; Ye, Y.; Ju, Y.; Pan, H.; Zhang, Q.; Wang, G.; Pan, L.; Zhu, Y. Phenotypic and genetic analysis of several traits in F1 Hybrids of Lagerstroemia speciosa and L. India. Adv. Ornam. Hortic. China 2017, 1, 292–297. [Google Scholar]
- Hollender, C.A.; Pascal, T.; Tabb, A.; Hadiarto, T.; Srinivasan, C.; Wang, W.; Liu, Z.; Scorza, R.; Dardick, C. Loss of a highly conserved sterile alpha motif domain gene (WEEP) results in pendulous branch growth in peach trees. Proc. Natl. Acad. Sci. USA 2018, 115, E4690–E4699. [Google Scholar] [CrossRef]
- Zhao, J.; Chen, F.; Teng, N.; Chen, S. Genetic analysis and RAPD marker of creeping habits in ground-cover Chrysanthemum. Sci. Agric. Sin. 2009, 42, 734–741. [Google Scholar]
Figure 1.
Plant materials and method of measurement used in this study. (a) L. fauriei; (b) L. indica “Creole”; (c) S82 the creeping individual of F1; (d,e) creeping and standard offsprings in BC1 population (in summer); (f) creeping and standard offsprings in BC1 population (in autumn); (g,h) methods of measuring branch angle and plant canopy angle. θ1 and θ2 are the angles of inclination of the widest position of the canopy from vertical orientation on both sides. Plant canopy angle is the sum of θ1 and θ2.

Figure 2.
Distribution of eight phenotypic traits of 174 individuals in S82 × L. fauriei population. (a) Plant height (PH); (b) plant width (PW); (c) plant canopy angle (PCA); (d) branching angle of the main branch (BA); (e) the number of main branches (NMB); (f) branching height (BH); (g) leaf length (LL); (h) leaf width (LW).

Figure 3.
Electrophoresis of four primers’ amplification products in parents and gene pools. (a) Electrophoretic results of Q111 primers; (b) electrophoretic results of S364 primers; (c) electrophoretic results of LYS12 primers; (d) electrophoretic results of LYS13 primers. BZ: Standard creeping gene pool; BP: Creeping gene pool; Z1, Z2, and Z3: Three standard individuals; P1, P2, and P3: Three creeping individuals; M: DNA marker.


Table 1.
Descriptive statistics of phenotypic characters in S82 × L. fauriei population.
| Traits | Mean | Minimum | Maximum | Standard Deviation | Variance | Skewness | Peakness | Coefficient of Variation |
|---|---|---|---|---|---|---|---|---|
| PH (cm) | 50.70 | 19.00 | 101.00 | 17.99 | 322.83 | 0.44 | −0.25 | 35.49% |
| PW (cm) | 63.74 | 31.00 | 101.50 | 13.40 | 179.57 | 0.26 | 0.10 | 21.02% |
| PCA (°) | 105.64 | 60.70 | 163.45 | 21.23 | 533.00 | 0.48 | −0.18 | 20.09% |
| BA (°) | 55.19 | 21.27 | 78.90 | 12.84 | 167.95 | −0.56 | −0.35 | 23.27% |
| NMB | 3.30 | 2.00 | 7.00 | 1.01 | 1.01 | 0.71 | 0.75 | 30.57% |
| BH (cm) | 1.98 | 0.00 | 26.00 | 3.17 | 9.92 | 3.56 | 20.05 | 159.69% |
| LL (mm) | 40.29 | 19.66 | 64.19 | 8.32 | 69.30 | 0.36 | 0.32 | 20.66% |
| LW (mm) | 20.00 | 6.98 | 49.32 | 5.07 | 25.75 | 1.37 | 6.08 | 25.37% |
Note: PH: plant height; PW: plant width; PCA: plant canopy angle; BA: branching angle of the main branch; NMB: the number of main branches; BH: branching height; LL: leaf length; LW: leaf width. The phenotype units are only used for the mean, standard deviation, maximum, and minimum.
Table 2.
Correlation analysis of phenotypic characters in S82 × L. fauriei population.
| Traits | PH | PW | PCA | BA | NMB | BH | LL | LW |
|---|---|---|---|---|---|---|---|---|
| PH | 1 | |||||||
| PW | 0.282** | 1 | ||||||
| PCA | −0.538** | 0.126 | 1 | |||||
| BA | 0.545** | 0.009 | −0.703** | 1 | ||||
| NMB | −0.143 | 0.052 | 0.214* | −0.319** | 1 | |||
| BH | 0.073 | −0.005 | −0.091 | −0.075 | −0.241** | 1 | ||
| LL | 0.383** | 0.259** | −0.12 | 0.095 | −0.008 | 0.013 | 1 | |
| LW | 0.354** | 0.210* | −0.074 | 0.058 | 0.06 | −0.042 | 0.681** | 1 |
Note: PH: plant height; PW: plant width; PCA: plant canopy angle; BA: branching angle of the main branch; NMB: the number of main branches; BH: branching height; LL: leaf length; LW: leaf width. ** means highly significant at the 0.01 level; * means significant at the 0.05 level.
Table 3.
Phenotypes and amplified strips of parents and near isogenic pools.
| Code | Phenotype | Strip Type | Strip Type |
|---|---|---|---|
| L. f aurei | Z | b | m |
| S82 | P | a | n |
| L. indica ‘Creole’ | P | a | n |
Note: Z: Standard individual; P: creeping individual; a: Single strip in primer S364; b: Double strip in primer S364; m: Single strip in primer LYS12; n: Double strip in primer LYS12.
Table 4.
Classification of the phenotype of 174 individuals in S82 × L. fauriei population.
| Traits | Grade | Type | No. of BC1 |
|---|---|---|---|
| PW/PH | <1.5 | G | 122 |
| ≥1.5 | H | 52 | |
| PCA (°) | <90 | J | 98 |
| ≥90 | K | 76 | |
| BA (°) | >60 | U | 81 |
| ≤60 | V | 93 | |
| Plant architecture | Not satisfied H-, K-, V | Upright | 138 |
| Satisfied H-, K-, V | Creeping | 36 |
Note: PH, plant height; PW, plant width; PCA, plant canopy angle; BA, branching angle of the main branch.
Table 5.
Statistics of two primer strip types in BC1 plants.
| Marker | Strip Type | Number |
|---|---|---|
| S364 | a | 95 |
| b | 71 | |
| – | 8 | |
| LYS12 | m | 91 |
| n | 83 | |
| – | 0 |
Note: “a” and “b” mean single strip and double strip in primer S364, respectively; “m” and “n” mean single strip and double strip in primer LYS12, respectively; “–” means no strip.
Table 6.
Number of phenotypes and strip type of BC1 plants.
| Marker | Coincidence | Inconformity | Total |
|---|---|---|---|
| S364 | 127 | 39 | 166 |
| LYS12 | 129 | 45 | 174 |
Table 7.
Identification of two markers in 20 Lagerstroemia stocks with diverse plant architectures.
| Species and Cultivars | Description of Plant Type | Strip | Strip |
|---|---|---|---|
| L. fauriei | Upright, tree | b | m |
| L. limii | Upright, tree | b | m |
| L. excelsa | Upright, tree | b | m |
| L. subcostata | Upright, tree | b | m |
| L. indica “Osage” | Upright, large shrub or small tree | a | m |
| L. indica “Queens Lace” | Upright, large shrub or small tree | a | m |
| L. indica “Muskogee” | Upright, large shrub or small tree | b | m |
| L. indica “Comanche” | Upright, large shrub or small tree | b | m |
| L. indica “William Toovey” | Upright, large shrub or small tree | b | m |
| L. indica “Yuma” | Upright, large shrub or small tree | b | m |
| L. indica “Ebony Flame” | Upright, shrub | a | m |
| L. indica “Ebony Fire” | Upright, shrub | a | m |
| L. indica “Ebony Embers” | Upright, shrub | b | m |
| L. indica “Chisam Fire” | Upright, shrub | b | m |
| L. indica “Victor” | Upright, spherical | a | m |
| L. indica “Tonto” | Upright, semi-dwarf shrub | b | m |
| L. indica “Houston” | Dwarf shrubs, weeping branches | a | m |
| L. indica “Sacramento” | Dwarf shrubs, weeping branches | a | m |
| L. indica “New Orleans” | Dwarf shrubs, creeping branches | a | n |
| L. indica “Creole” | Dwarf shrubs, creeping branches | a | n |
© 2019 by the authors. Licensee MDPI, Basel, Switzerland. This article is an open access article distributed under the terms and conditions of the Creative Commons Attribution (CC BY) license (http://creativecommons.org/licenses/by/4.0/).
Share and Cite
MDPI and ACS Style
Zheng, T.; Qin, B.; Li, S.; Cai, M.; Pan, H.; Wang, J.; Cheng, T.; Zhang, Q. Screening of Applicable SSR Molecular Markers Linked to Creeping Trait in Crape Myrtle. Forests 2019, 10, 429. https://doi.org/10.3390/f10050429
AMA Style
Zheng T, Qin B, Li S, Cai M, Pan H, Wang J, Cheng T, Zhang Q. Screening of Applicable SSR Molecular Markers Linked to Creeping Trait in Crape Myrtle. Forests. 2019; 10(5):429. https://doi.org/10.3390/f10050429
Chicago/Turabian StyleZheng, Tangchun, Bo Qin, Suzhen Li, Ming Cai, Huitang Pan, Jia Wang, Tangren Cheng, and Qixiang Zhang. 2019. "Screening of Applicable SSR Molecular Markers Linked to Creeping Trait in Crape Myrtle" Forests 10, no. 5: 429. https://doi.org/10.3390/f10050429
Note that from the first issue of 2016, this journal uses article numbers instead of page numbers. See further details here.