Application of an Adaptive Forest Management Simulation Model Based on Zoning in a Man-Made Forest


College of Bioresource Sciences, Nihon University, Fujisawa 252-0880, Japan
*
Author to whom correspondence should be addressed.
Forests 2019, 10(6), 482; https://doi.org/10.3390/f10060482
Submission received: 7 May 2019
/
Revised: 29 May 2019
/
Accepted: 31 May 2019
/
Published: 3 June 2019
(This article belongs to the Special Issue Forest Management Strategies for an Ecologically, Economically and Socially Sustainable Future)
Abstract
:In this study, shifts from the current forest physiognomy to a target forest physiognomy were modeled by applying the concept of zoning simulation. The objective was to present the process of generating management options for man-made forests in Kanagawa Prefecture, Japan. The assessment method was a wide-ranging and long-term simple simulation based on several indicators, such as geographical distribution and tree species, and adapted the concept of changes in forest physiognomy. A headwater forest in Kanagawa Prefecture, which covers an area of about 3784 ha and consists of 4445 forest stands, was investigated. Four plans were established based on the present state of the forest stands. The results indicated that factors for expressing forest physiognomy and their expression methods should be determined, and physiognomy models should be constructed to establish the actual state of the forests in each region. With this simulation, it is possible to forecast long-term changes at forest stand and basin levels for each scenario. However, only data from forestry register were used in this study, and it is expected that different results would be obtained by conducting a determination of stand position in the forest physiognomy together with a field survey.
1. Introduction
A universally-accepted scheme for sustainable forest management is forest certification, which has the potential to address certain environmental issues by establishing rules for sustainable management of forests, thus reducing the risks arising from environmental problems [1]. Previous studies on forest certification in Japan and Asia have indicated that the most common corrective action requests in terms of Forest Stewardship Council (FSC) principles or Sustainable Green Ecosystem Council (SGEC) standards are the following: management planning, environmental impact assessments, and monitoring [2,3,4,5,6,7,8,9,10]. Thus, mid- and long-term forest management planning is important for sustainable forest management.
Forest planning is composed of short-term and long-term plans, and long-term plans concern permanent timber production [11]. According to another definition, forest planning is to clarify what society demands for forests and comprehensively show established methods [12]. Forest planning is addressed with regard to land use, management plans, financial analysis, environmental evaluation, monitoring, etc. [11]. Among them, many studies have reported on the growth of forest stands concerned with permanent timber production using several methods, including system yield tables [13,14,15,16,17,18,19,20,21]. System yield tables show the various growth processes of multiple forest stands in a multi-dimensional space and consist of variables such as forest age, number of trees, volume, tree height, and diameter [15]. Typical examples of the system yield table are the Local Yield Table Construction System developed by Shiraishi [22] and the Silvo Forest developed by Tanaka [23]. Additionally, a forecast map that combines the prediction of growth by the system yield table with spatial information from a geographic information system (GIS) is needed [24]. Other studies have focused on the growth of stands, ecosystem-based forest management, and simulation using various indicators [25,26,27,28,29].
An example of forest planning in Vosges and other regions of Lorraine, France, is based on the movement of spatial forest physiognomy [30]. Under this system, forest owners create a vision for managing their forests and identify long-term management goals by studying systematic diagrams showing the shifts from one forest physiognomy to another, as well as the final forest physiognomies. Additionally, illustrations of tree age compositions and spatial constitution are also presented. Such a system has not been previously implemented in Japan. The visual simulation and the representation of future forest physiognomy are likely to aid sustainable forest management and clarify target forest physiognomies. This study applies zoning to forest management decisions based on the concept of the above case study and includes simulations.
Forests constitute nearly 70% of the area in Japan. About 60% of the forests are secondary forests, and nearly 40% are man-made forests of sugi (Cryptomeria japonica (Thunb. ex L. f.) D. Don), hinoki (Chamaecyparis obtuse (Siebold et Zucc.) Endl.), and Japanese larch (Larix kaempferii (Lam.) Carri ère). Most of the forest owners in Japan are small scale, and the price of wood traded in Japan has been at a low level in recent years [31]. As a result, the profits returned to the owners are decreasing, and the motivation of forestry management is diminishing [31]. Because Japan depends on imported timber, there has been a decline in forestry production activities, which has given rise to insufficient management of many forests in Japan [31]. Kanagawa Prefecture is located near Tokyo, Japan and has a population of 9.2 million (April 2019) [32]. Nearly 40% of Kanagawa Prefecture is covered with forests [31]. The Tanzawa mountains are located in the north-western part of the prefecture, and the headwaters of Tanzawa have several man-made forests that serve to conserve water. However, water conservation by the watershed forests of Kanagawa Prefecture has deteriorated due to insufficient management, particularly in the man-made forest areas [33]. To restore water conservation, necessary measures should be formulated and systematically executed.
Therefore, the objective of this research is to present the process of management of forest stands in Kanagawa Prefecture through a method based on wide-ranging and long-term simple simulations, such as geographical distribution, tree species, and forest age distribution, adapted to the concept of zoning. The target area of the simulation was the watershed forests in the Kanagawa Prefecture. The concept of zoning is described, and networks through which forest stands undergo changes from the current situation to target forest physiognomies are presented. The situation of the forest is different in each country, and although this study is a simulation model case in Japan, this concept can be applied to any forest in the world.
2. Materials and Methods
2.1. Study Area
The government of Kanagawa Prefecture established the headwater forest system in 1997 to secure the water supply for its population of 9 million [34]. The forest covers an area of 61,550 ha, of which 20,950 ha is owned by the national, the prefectural, and the municipal governments, and 40,600 ha is private forest [35]. Most of the private forest has been poorly managed, and trees are densely grown [36]. The understory has been lost to feeding by deer, resulting in soil runoff and lower watershed protection performance [36]. Therefore, management of the private forests by the prefectural government is being promoted either by acquiring the right of ownership or through supervision [36].
The rights of ownership or supervision are acquired by signing contracts on profit sharing, signing agreements on headwater forest improvement, transferring the right of ownership of trees and/or land, and cooperating in forest management [35]. The prefectural government is improving the acquired forest stands and its watershed protection performance by implementing thinning and other management activities [35]. This system is called the “Kanagawa suigen-no shinnrin dukuri” (i.e., improving forests in the headwater of Kanagawa) and is partly covered by taxes for the Headwater and Environment of Kanagawa Prefecture, which are levied as an extra tax burden for prefectural residents.
In this study, the Nakatsugawa watershed forest was selected for simulation. This forest covers approximately 3784 ha and consists of 4445 forest stands (Figure 1). The present physiognomies of the forest stands were surveyed, and suitable target physiognomies for improving the watershed protection performance and the network selection indicators were investigated using the concept of a headwater forest management system based on a spatial forest physiognomy. Data from the forest register were used as the basic data, and Esri’s ArcGIS (version 10.4.1) was used to acquire GIS data.
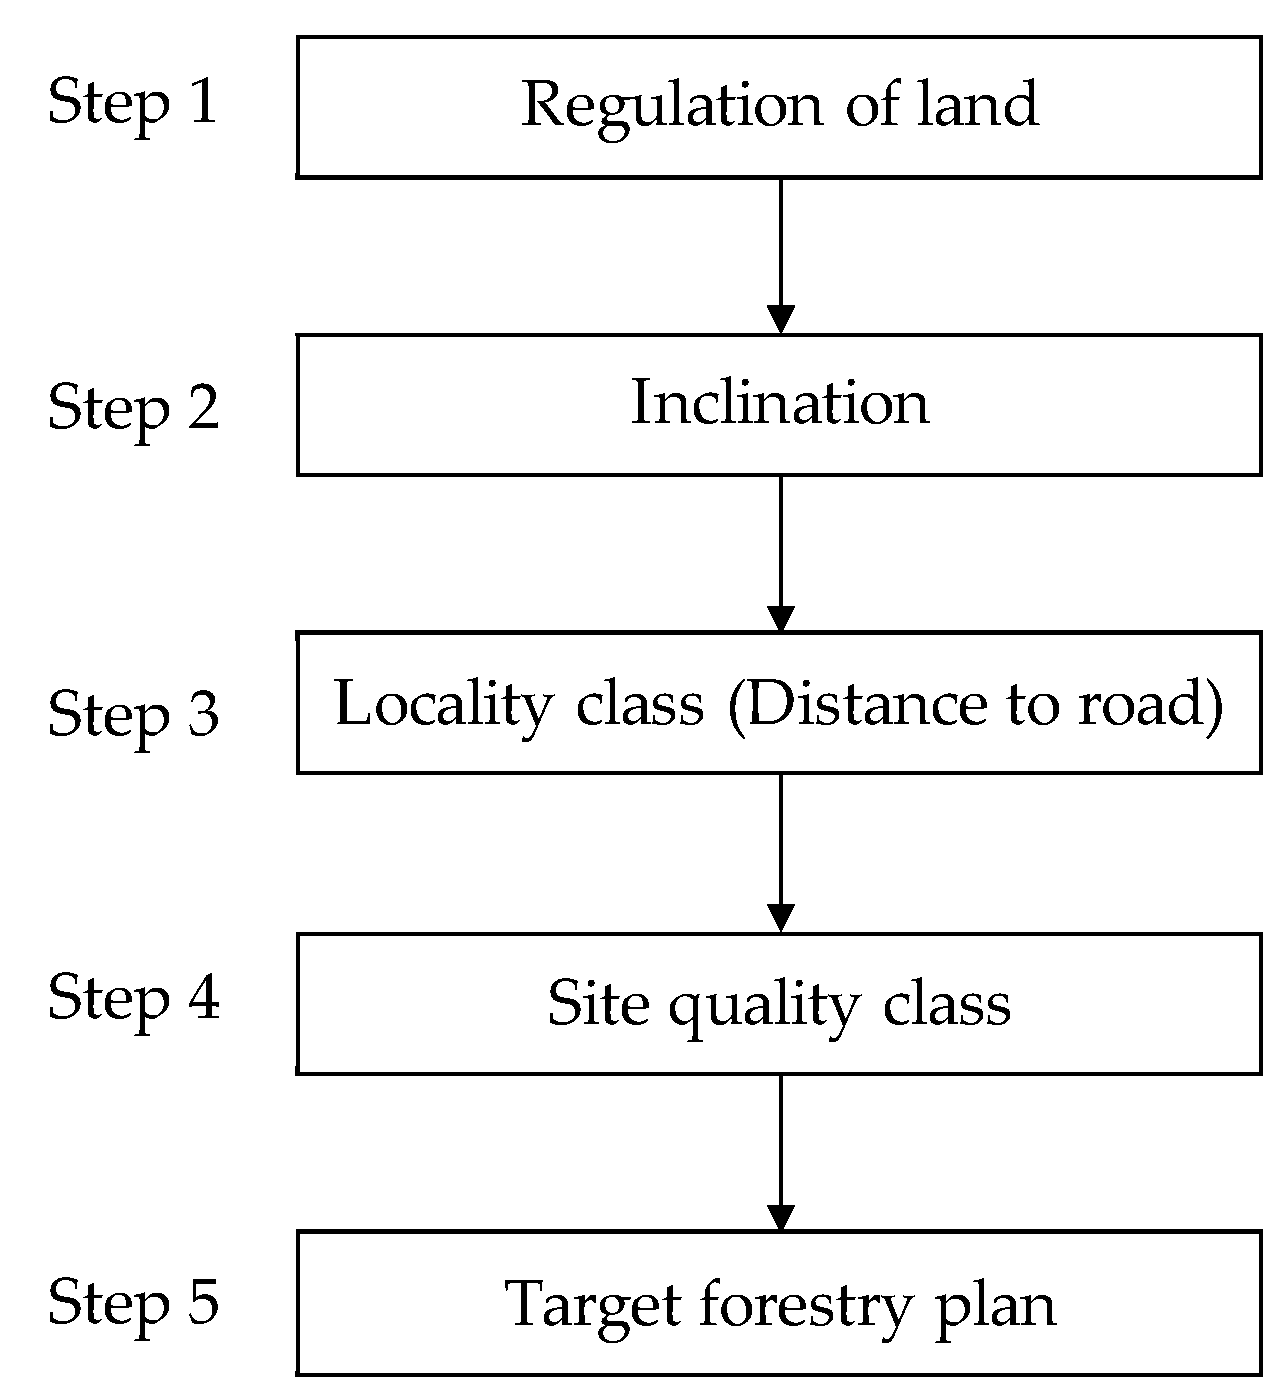
2.2. A Simulation Model Based on Zoning in a Man-Made Forest
Zoning should initially consider land regulation, especially in man-made forests. In the second stage, the slope is considered to determine whether the topography is conducive to conducting research. According to Ota [37,38], planning of forest zoning should be based on the soil conservation function, and erosion control should be prioritized if there is a steep slope. In the third step, the distance from the permanent forest road for heavy trucks (locality class) is considered; the distance from forest roads is an important factor when considering wood productivity. In the fourth step, land productivity (site quality class) is assessed. Following the above steps, we considered the future target forestry plan (Figure 2). The simulation period for the future forest physiognomies is assumed to be approximately 30 to 50 years. Based on the above indicators, a simulation was performed using the Kanagawa Forest Plan GIS data (Approver: Yuji Kuroiwa, approval year: 2016, authorization number: Mori No. 155). The GIS data include the attribute data from forestry register as basic information (tree species, owner, area, etc.) of the forest organized by Kanagawa Prefecture.
In this research, inclination, locality class (distance to road), and site quality classes were used as indicators to determine the target forest physiognomy of each forest stand in the target area. The inclination condition was set to 40 degrees in accordance with the 10th prefectural forest management plan [39]. According to Masutani [40], locality class (distance to road) I is indicated when the horizontal distance between the target stand and the forest road is less than 200 m, locality class II is when the distance is 200 m–500 m, while a distance of over 500 m is set as locality class III.
There are several possibilities in regard to the physiognomic progression of the present sugi and hinoki man-made forests. In this study, the target forest physiognomy was set to three types, i.e., monolayer forests, elderly forests, and secondary forests. The selection indicators of the target forest physiognomy were single-forestry management, long rotation management, and secondary forest induction type management. Four scenarios were considered in accordance with Masutani [40] and Kuroiwa [41]. This study simulated based on the four scenarios (or Plans) [40,41]. The target physiognomy could be achieved via several methods.
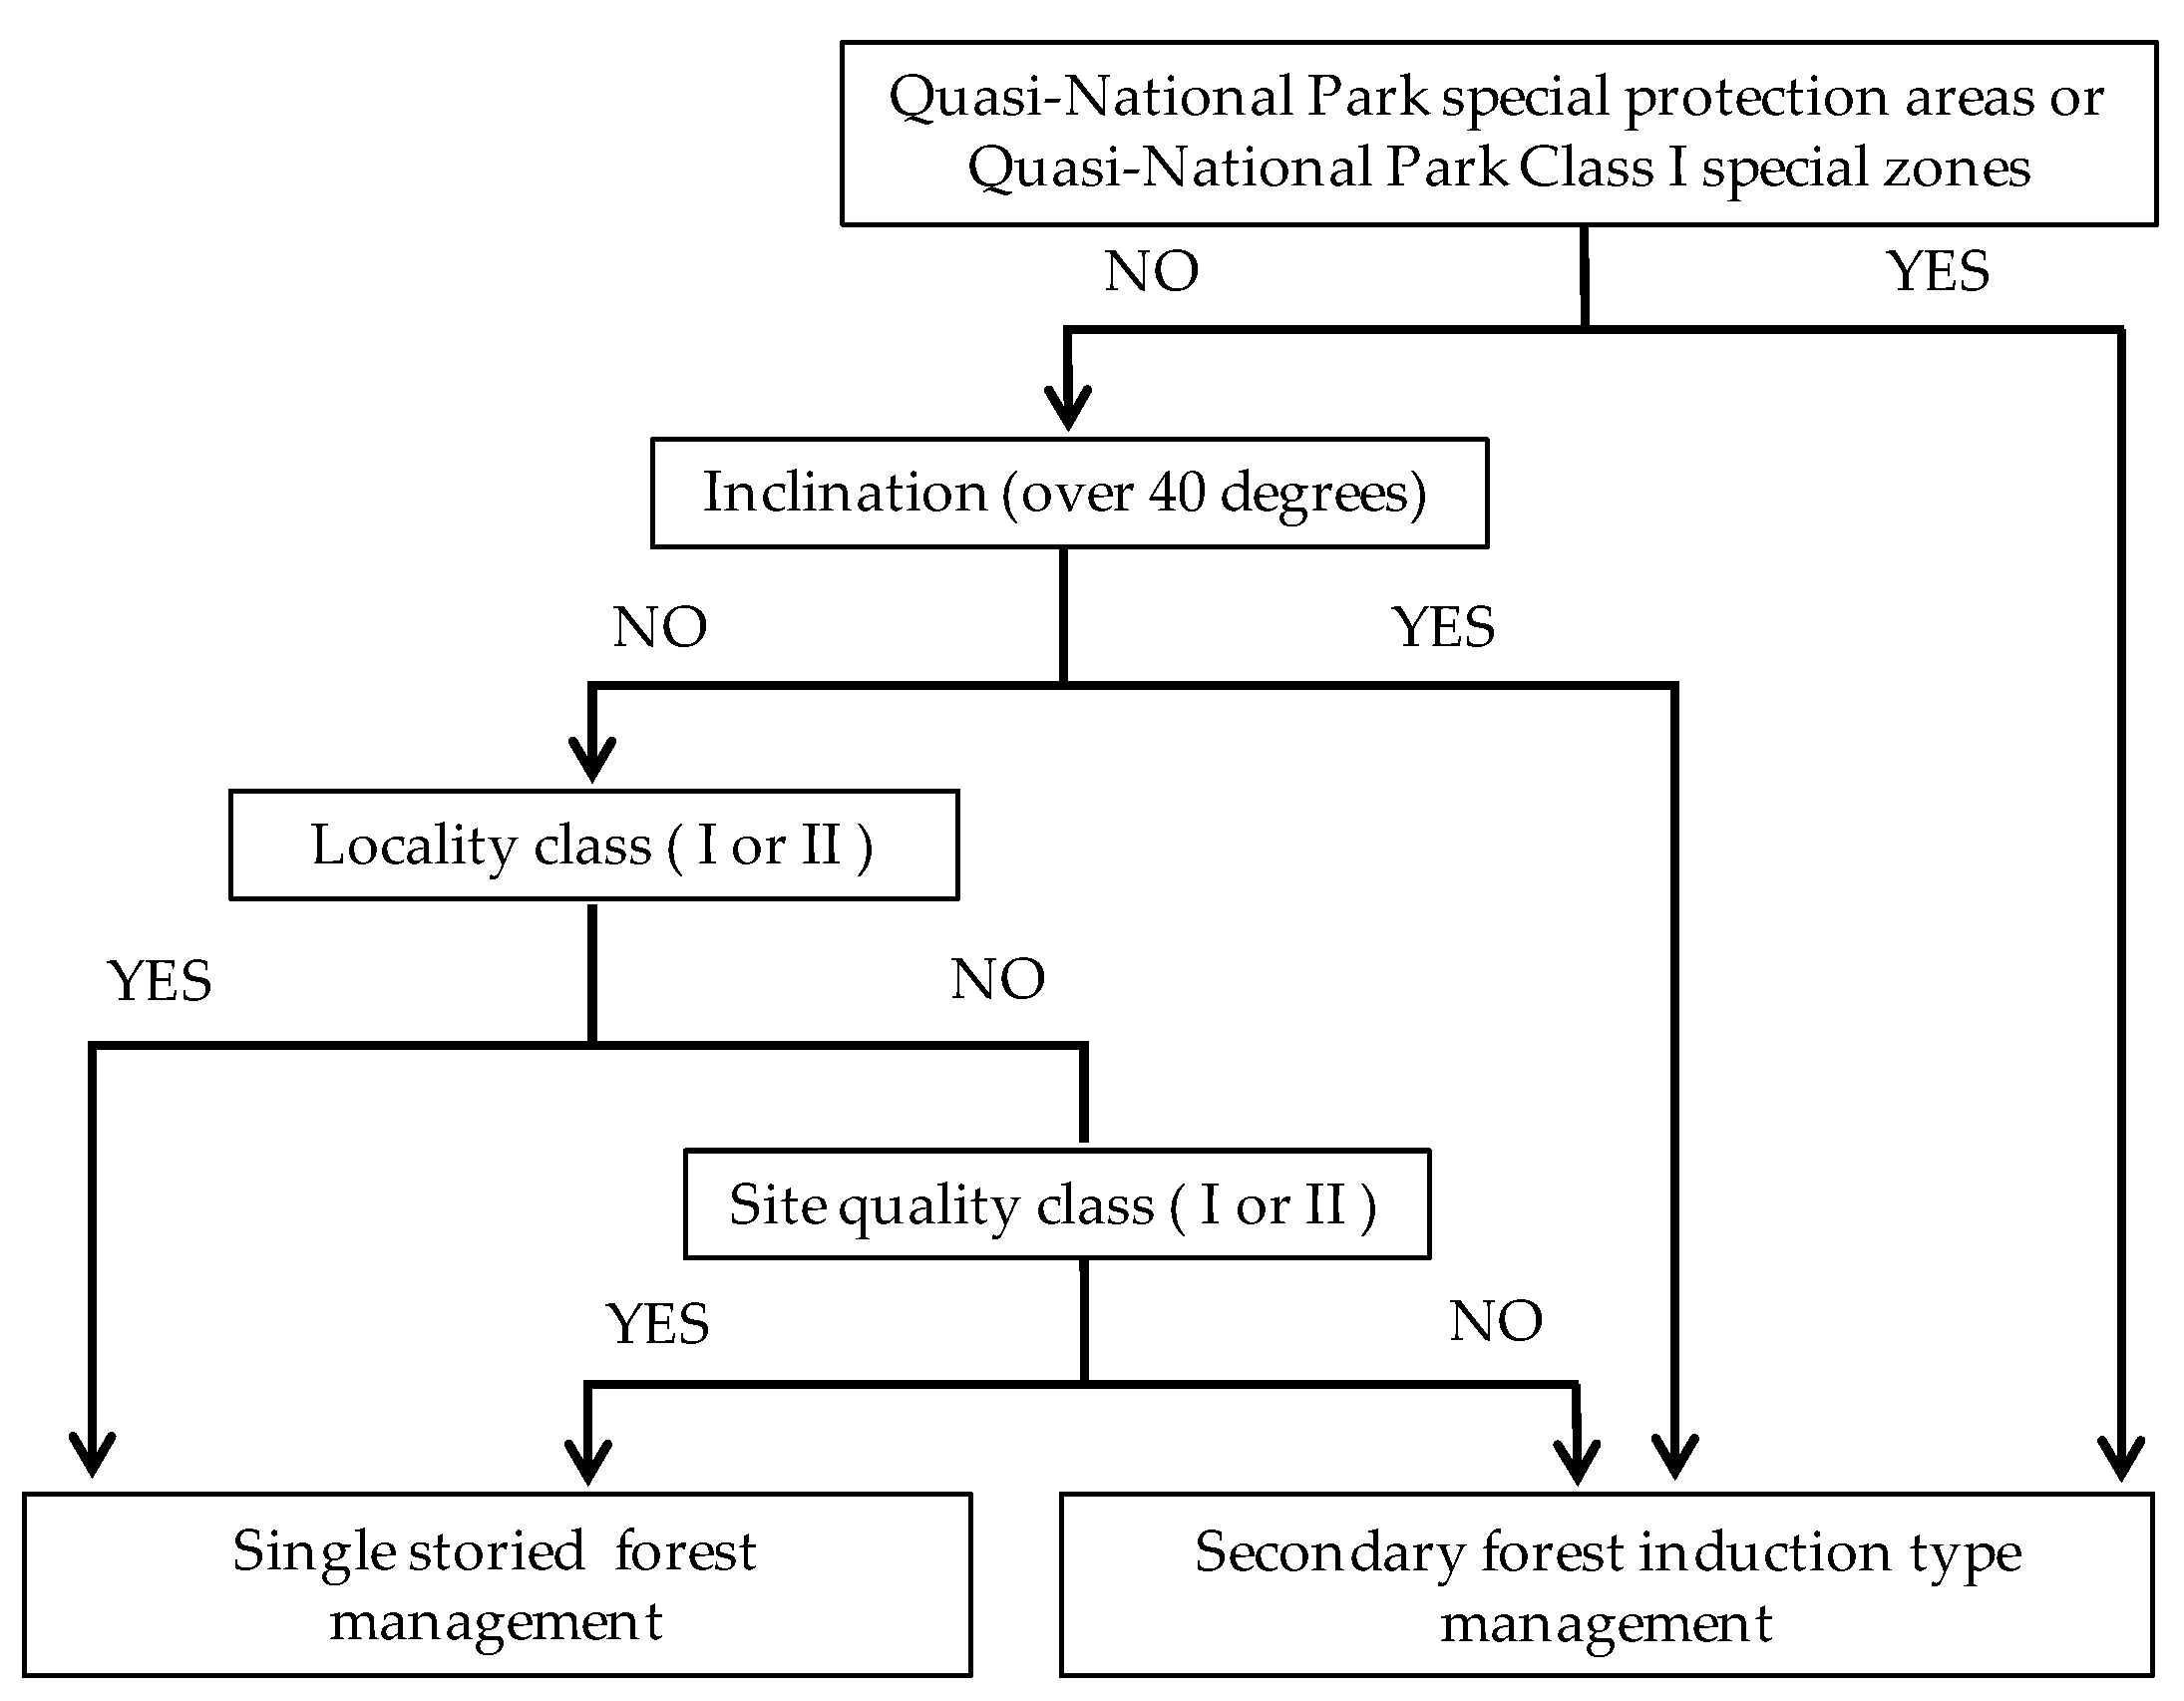
Kanagawa Prefecture needs to enhance the function of its forests as water source forests and respond to expectations of the owners of timber production forests. Therefore, it is necessary to operate as a monolayer forest where locality or site quality classes are high. In the case where the locality class (distance to road) is low but the site quality is high, the forest stand could be operated as a monolayer forest with long-term forestry targets. Areas with slopes above 40 degrees or with low locality and low site quality classes were assigned to secondary forests. Therefore, two target forest physiognomies and five routes were indicated, as shown in Figure 3. However, in the case of Quasi-National Park special protected areas and Quasi-National Park type I special zones, it is not possible to change the status quo as a rule; therefore, the forest leads to secondary forests. These constraints apply to all plans.
Locality is an important factor with regard to profitability, and it is necessary to consider the management plans of the locality class (distance to road). In the case of locality class (distance to road) I, a monolayer forest was set, whereas for locality classes II or III with high site quality, a monolayer forest operation was set. Areas where the inclination exceeded 40 degrees and the locality class (distance to road) II or III and site quality classes were low were assigned to secondary forests. Therefore, two target forest physiognomies and five routes were indicated for Plan 2, as shown in Figure 4.
Although it is necessary to respond to the expectations of the owners as a timber production forest, environmental conservation must also be considered. Therefore, it is necessary to operate as a monolayer forest where locality and site quality classes are high. On the other hand, long rotation forest was set as the long-term future target in the case where the locality was high but the site quality class was low (or vice versa). The elderly forest consists of sparse elderly tall tree forests where the forest floor vegetation develops, the soils are rich, and the water source rehabilitation function can be enhanced while producing timber. Other forest stands where the inclination exceeded 40 degrees and areas where the locality class (distance to road) and the site quality class were low were assigned to secondary forests. Therefore, three main target forest physiognomies and six routes were indicated for Plan 3, as shown in Figure 5.
Additionally, forest stands with lower locality class (distance to road) were set to change to secondary forests. Forest stands with lower locality and site quality classes could be selected for timber production forest operations, etc. On the other hand, if the locality class (distance to road) was high but the site quality class was low (or vice versa), secondary forests were set as the long-term target forest. Therefore, two main target forest physiognomies and five routes were indicated for Plan 4, as shown in Figure 6.
3. Results
3.1. Current Status of the Study Area
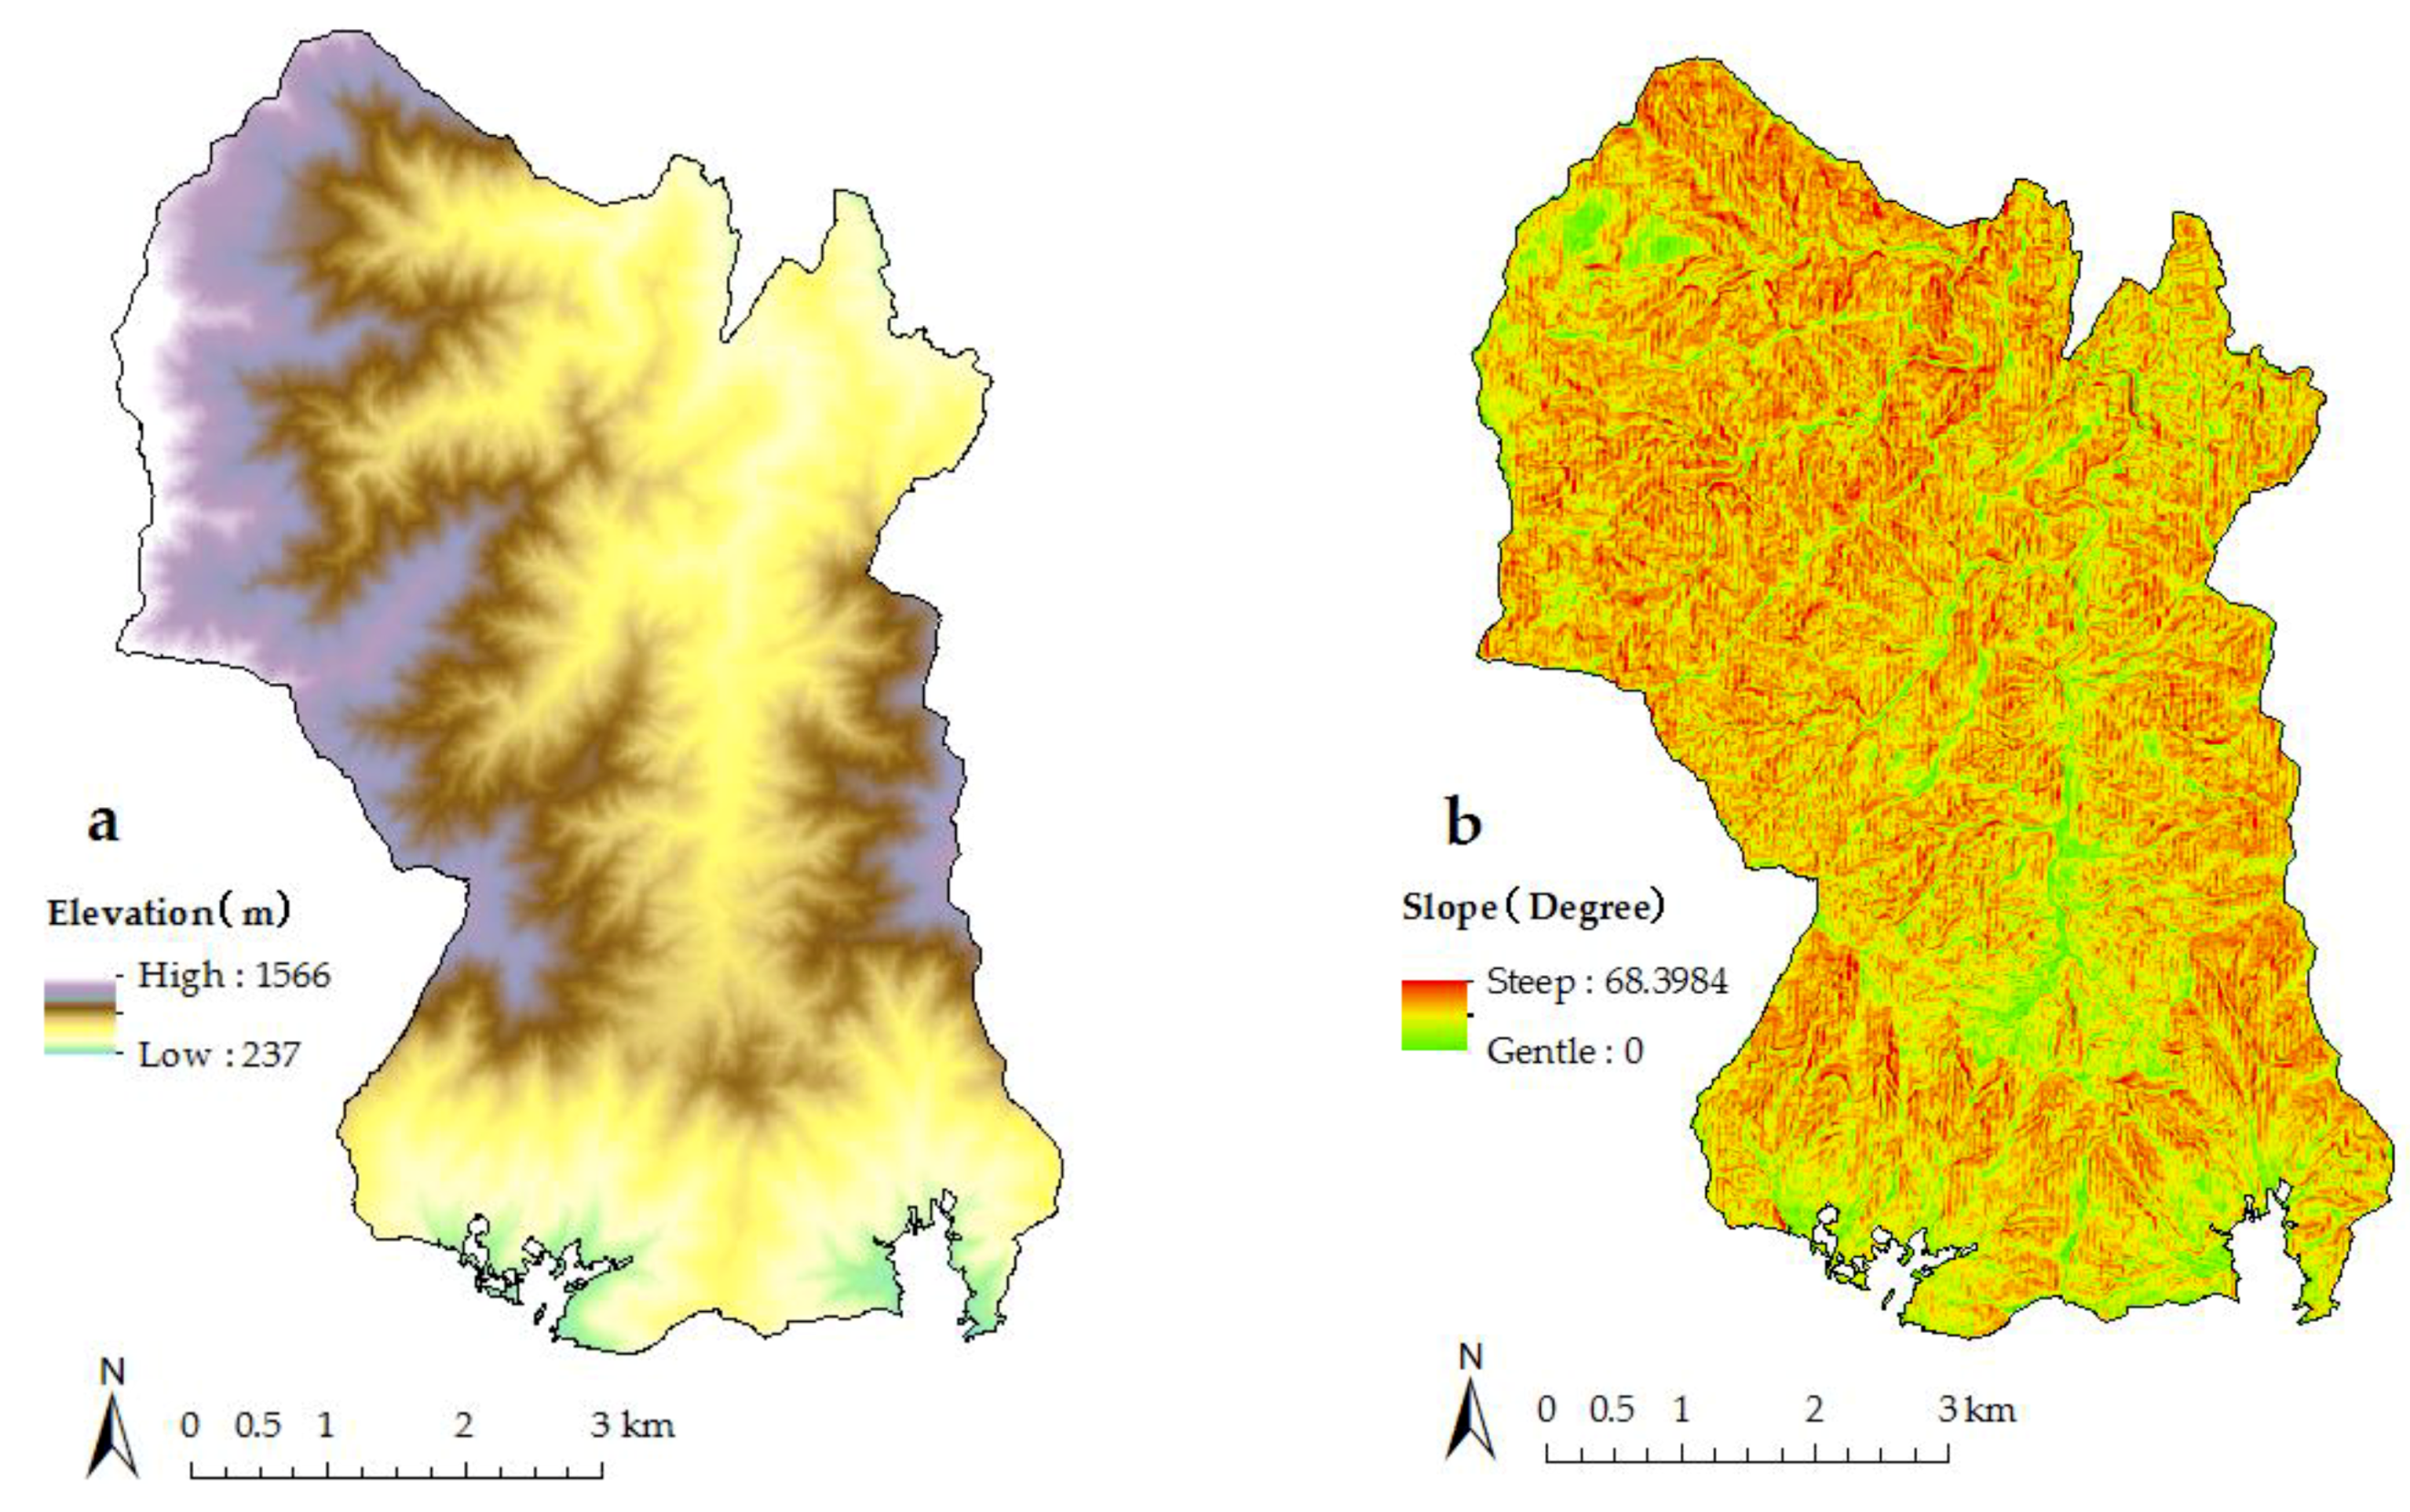
As shown in Figure 7, the elevation of the terrain is high on the west side and lower towards the east and the south sides. The slopes range from 30 to 40 degrees spread across the basin (Figure 7). Of the total 4445 forest stands, 992 were found to have slopes of 40 degrees or more, while 3453 stands had inclinations of less than 40 degrees.
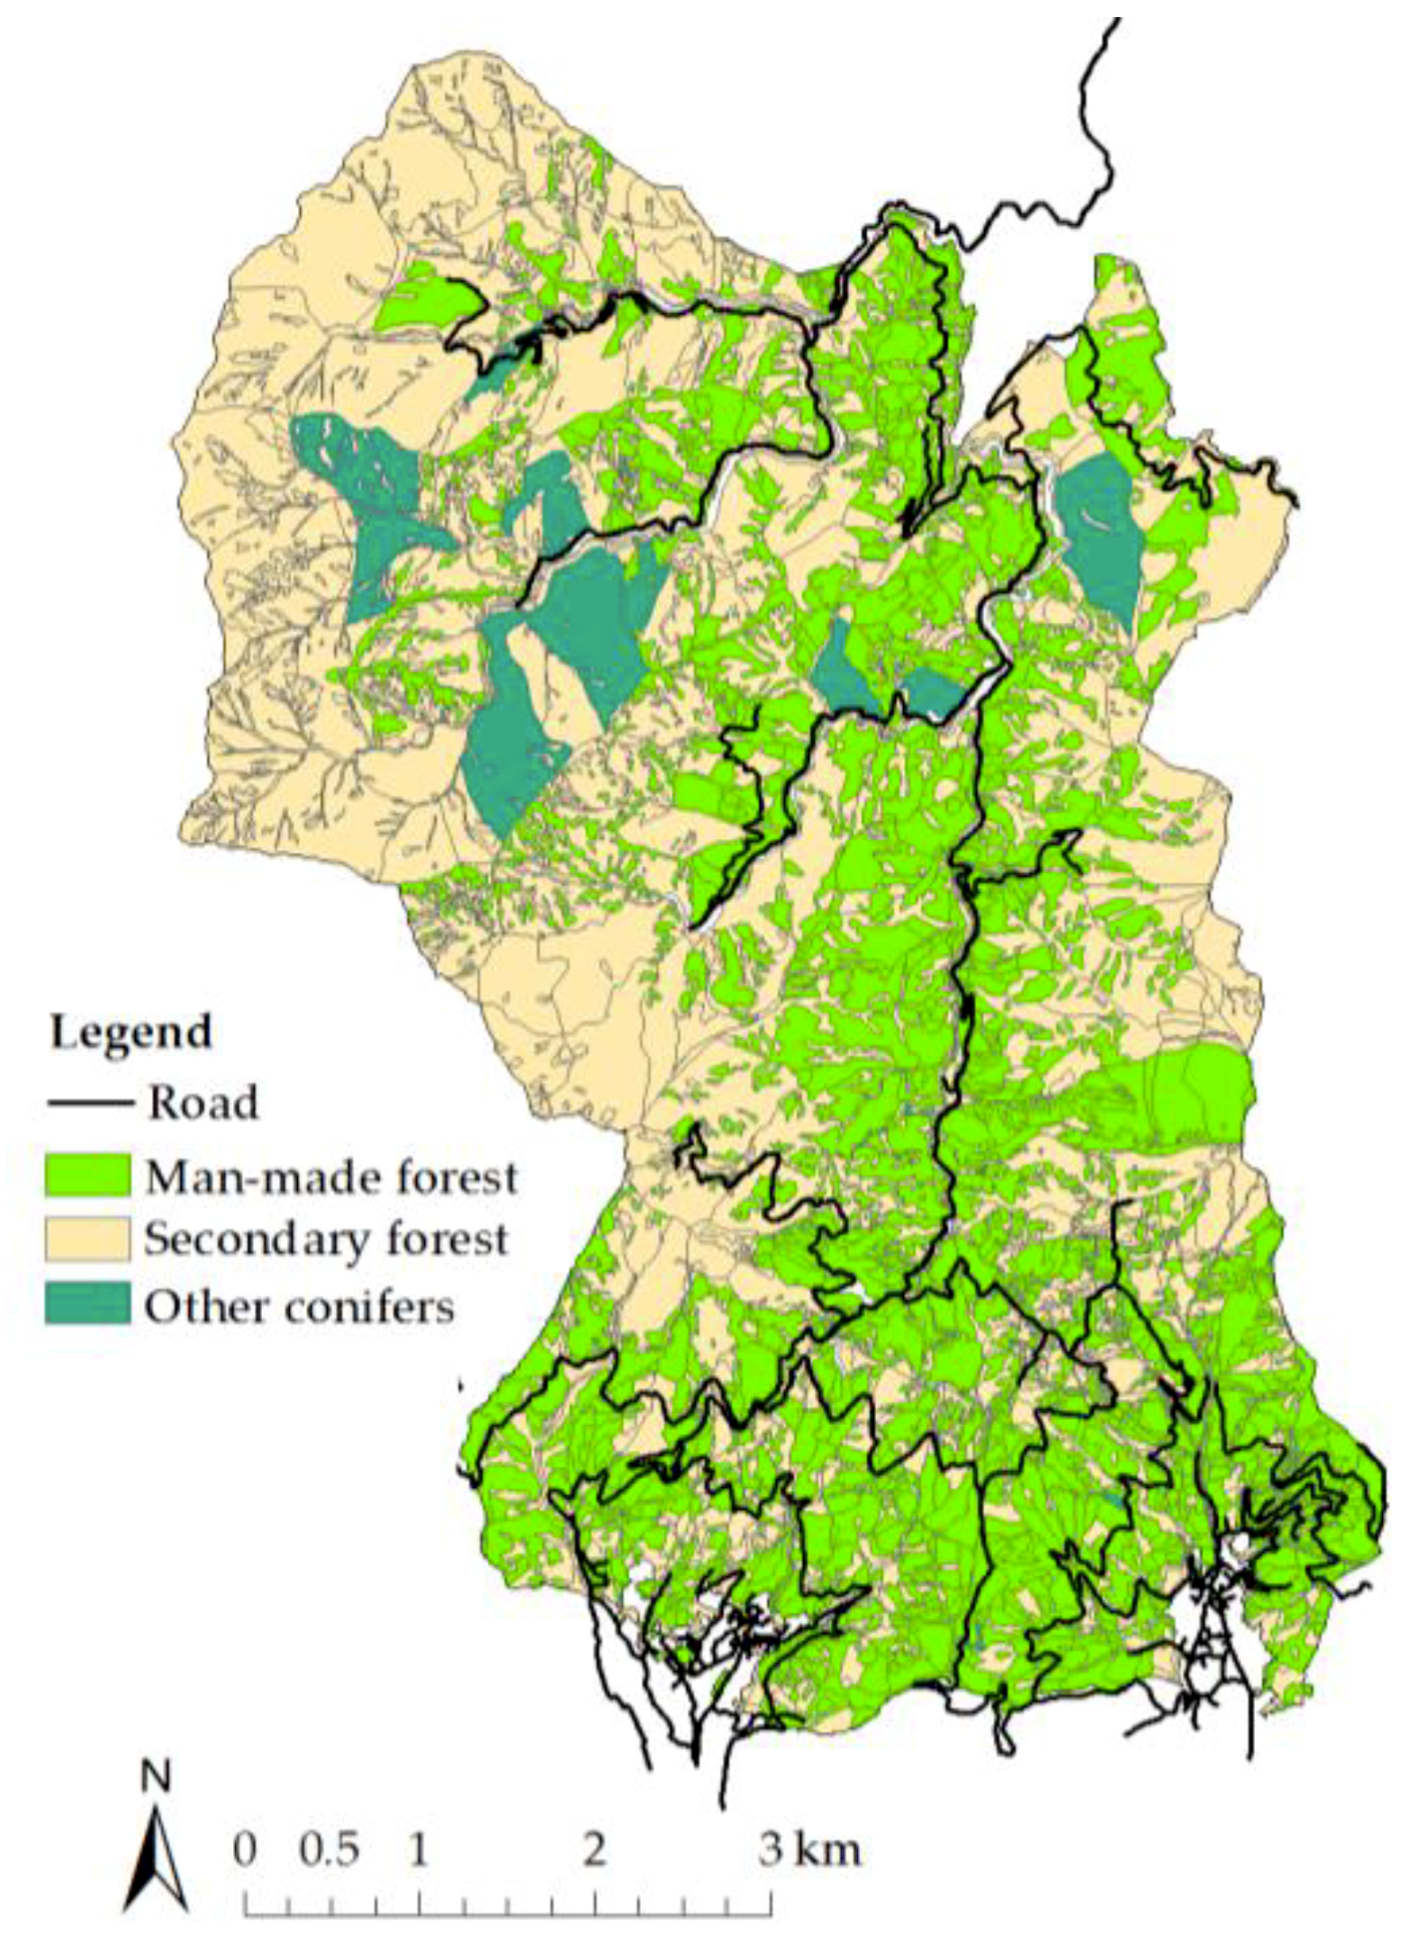
Prefecture-owned forests account for most of the northwest area, and company-owned forests occupy most of the central area. Many forests that are managed by Kanagawa Prefecture under the water source agreement with forest owners are on the eastern and the western sides of the basin. On the south side are prefectural row forests and individual forests. The current forest physiognomy indicates sugi and hinoki man-made forests along the forest road from north to south (Figure 8). In particular, high elevation areas are dominated by broadleaf forest (Figure 8). Sugi comprises 1141 stands, and hinoki comprises 1181 stands. Presently, half of the basin area is covered by sugi and hinoki man-made forest.
The majority of the target basin is designated as the Tanzawa-Oyama Quasi-National Park, which comprises Quasi-National Park special protection areas, Quasi-National Park Type I special protection zones, and Quasi-National Park II special protection zones. Most of these areas are distributed in prefecture-owned forests. Additionally, the watersheds are designated as health protection forests, water source recharge protection forests, and sediment leakage protection forests. The majority of the target area is designated as a water source recharge protection forest, and the outer circumference of the watershed area has a duplicate designation as health protection forests distributed with water source recharge protection forests. On the other hand, the south side of the basin is a sediment leakage protection safety forest. A few places in the prefectural forest are also designated as wildlife sanctuaries, places of scenic beauty, and natural monuments.
Buffer zones of 200 m and 500 m from the forest road (Figure 9) have been demarcated to estimate the locality class (distance to road). The forest road is a permanent road where heavy trucks can pass, which is different from the temporary yarding spur road. Therefore, the locality class (distance to road) is an important indicator of timber production. Since there are forests of different shapes and sizes, the locality classes were demarcated by prioritizing the minimum distance from the forest road to the forest stand. The target watershed includes forest roads from north to south with 1824 stands of locality class (distance to road) I (upper), 325 stands of locality class II (middle), and 173 stands of locality class III (lower) (Figure 9). Therefore, many of the forest stands of sugi and hinoki were assigned to locality class I.
The site quality was calculated by the Mitscherlich equation using parameters provided by the Kanagawa Prefectural Conservation Center. In this study, the average tree height of each forest stand was used, since the data were obtained from the forest registers maintained by Kanagawa Prefecture. However, usually, the average heights of upper tree layers are used. The site quality was classified into I (upper), II (middle), and III (lower).
As indicated in Figure 9, the site quality classes were estimated based on the average tree heights obtained from the forest register data for Kanagawa Prefecture. Site quality class I (upper) was represented by 24 stands and site quality class II (middle) by 19 forests. On the other hand, with 2279 stands, site quality class III (lower) accounted for the majority. This could be attributed to not using the average heights of upper tree layers. A field survey is necessary for accurate status determination. However, only secondary forest register data were used in this study. There were not many polygons, excluding sugi, hinoki, secondary forest, and other conifers (Figure 10). Therefore, these polygons were treated as secondary forests.
3.2. Simulation Results
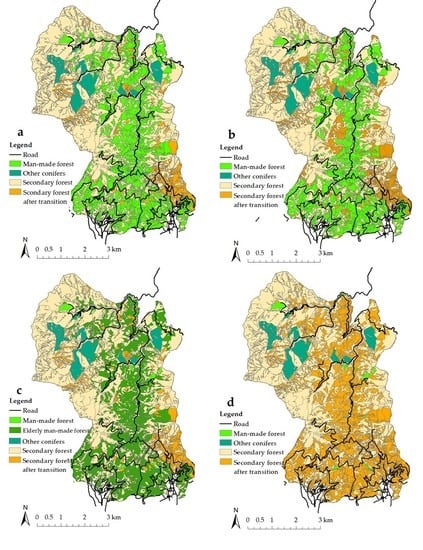
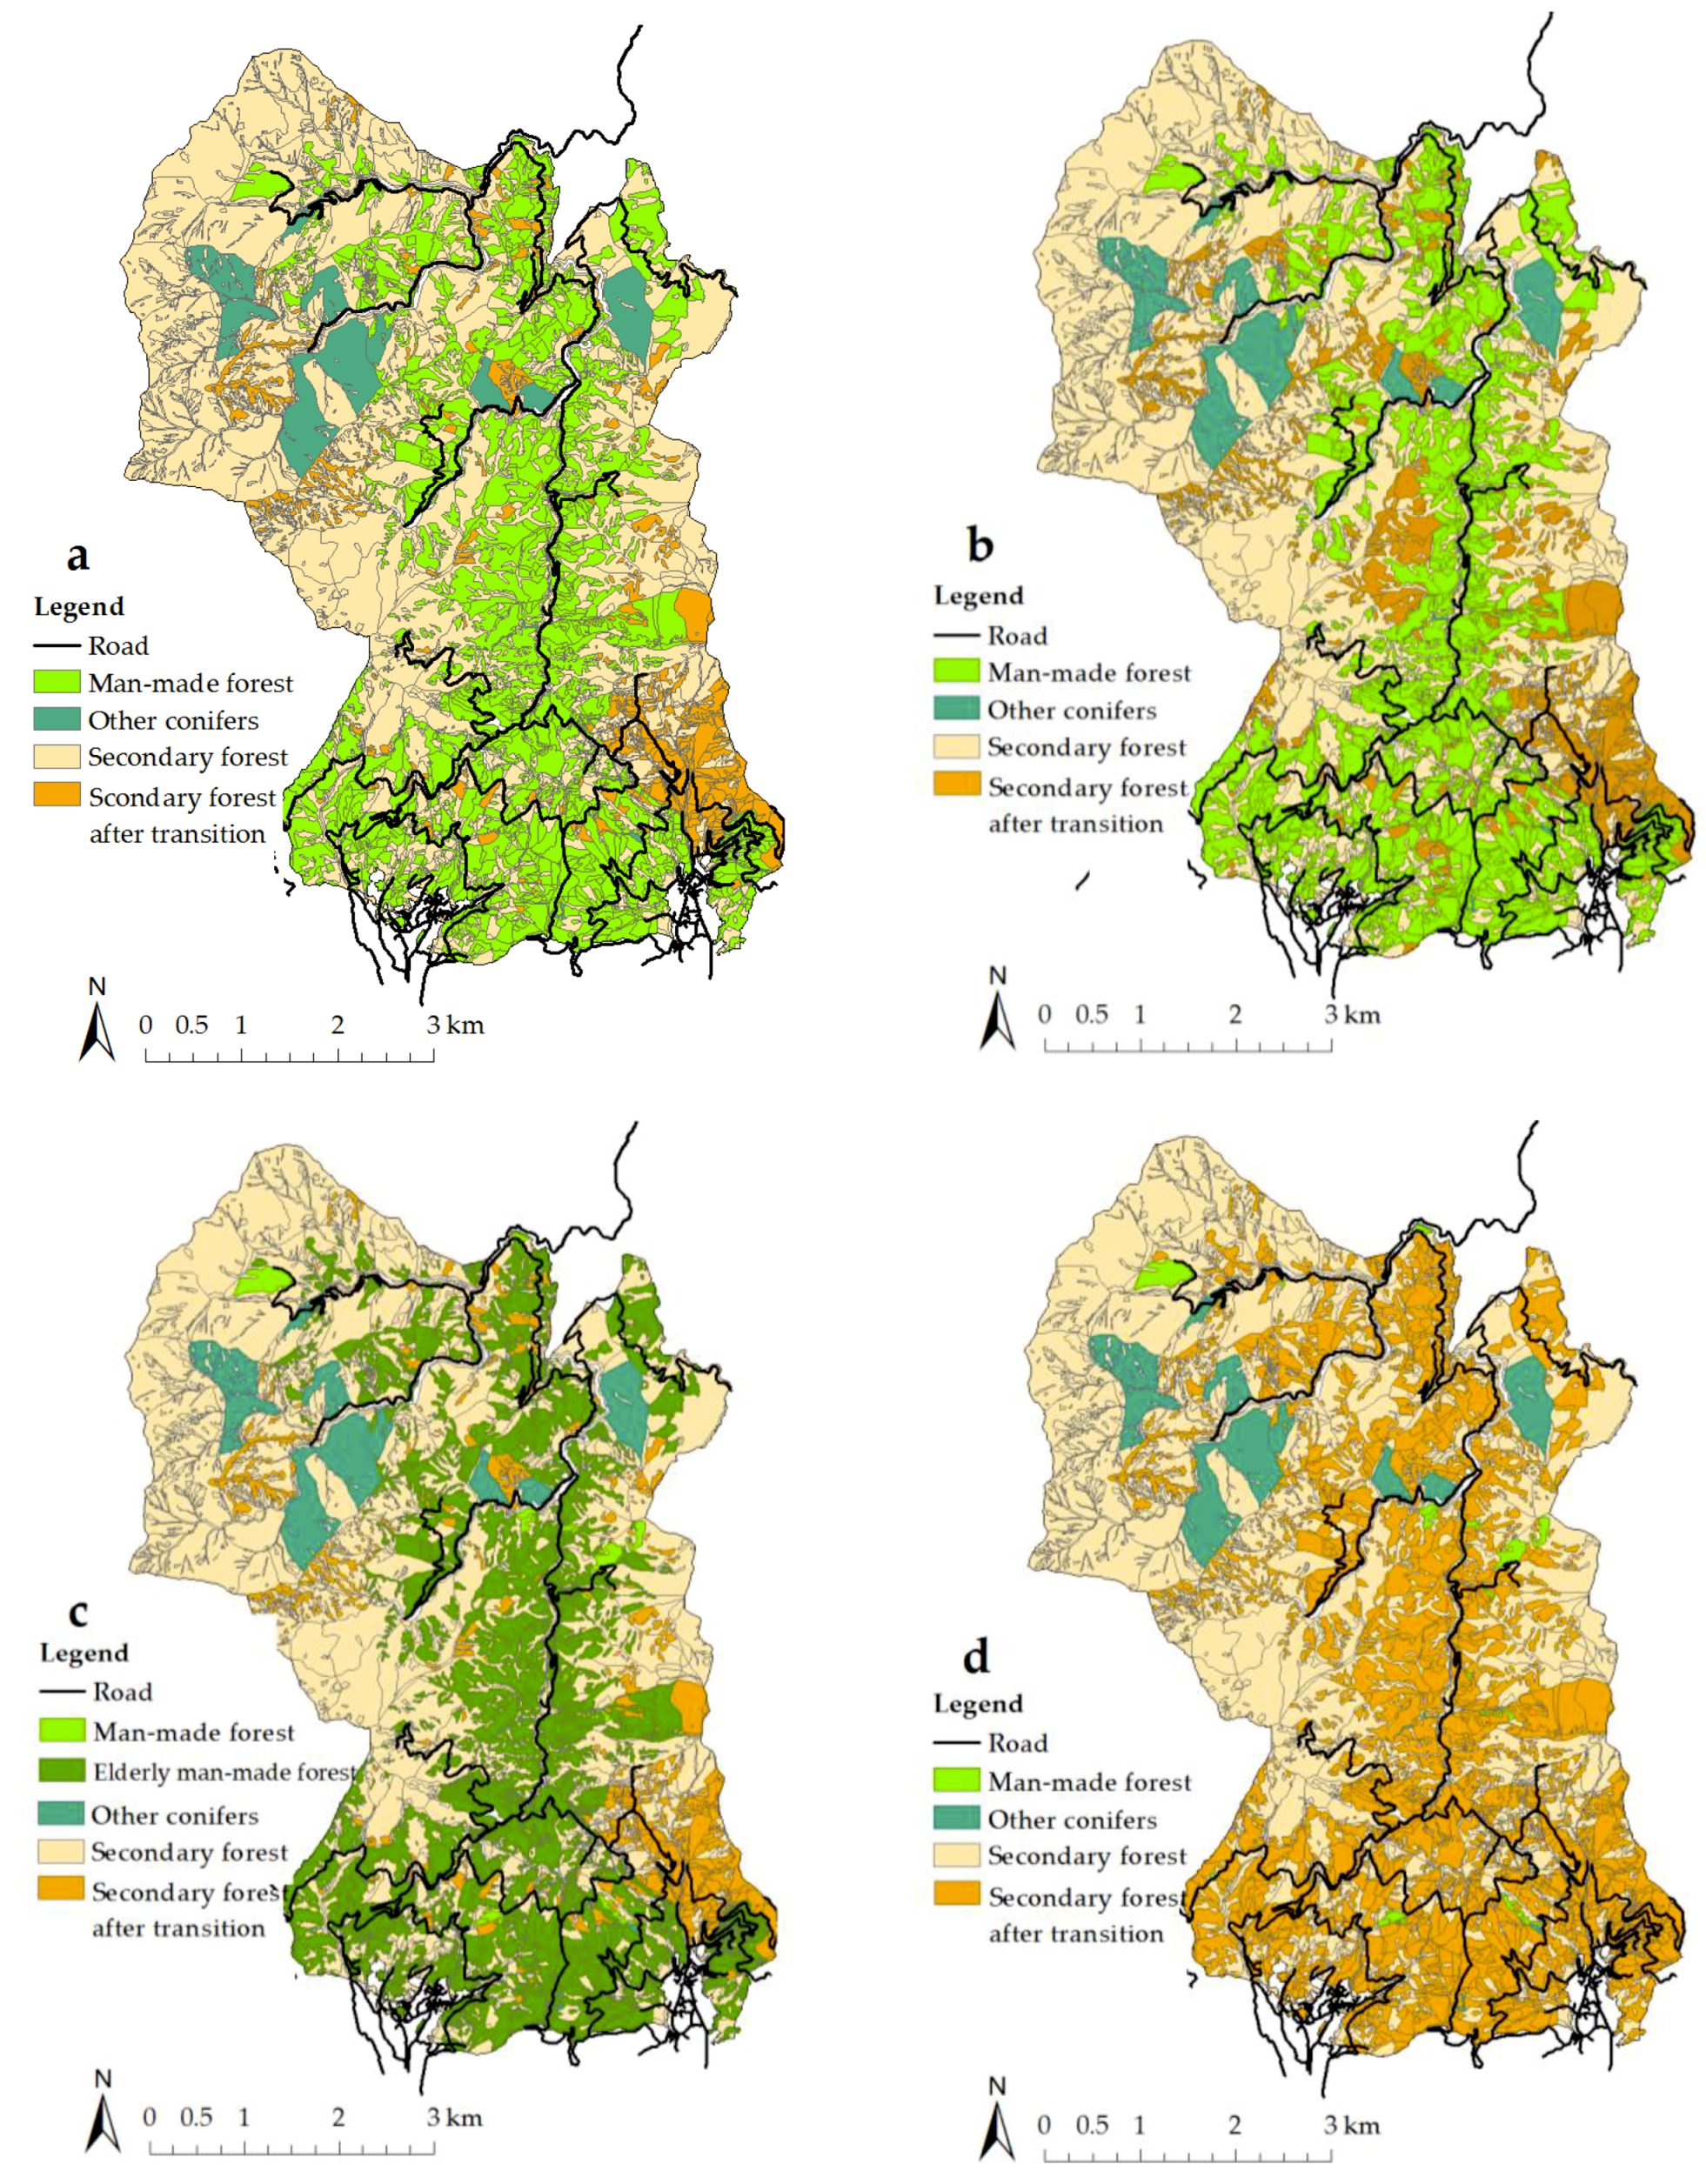
The results of these simulations are expected to be at least 30 years and up to 50 years later. First, although it is common to all scenarios, the National Park special protection areas and Type I special zones were established to conduct secondary forest induction type operations according to the land regulation. There were 372 forest stands included under the regulation, while an additional 207 forest stands had slopes of 40 degrees or more. These 579 forest stands would be managed towards secondary forests. Based on the current forest physiognomy (Figure 10) and the high impact forestry plan physiognomy (Plan 1; Figure 11a), a monolayer is planned if the forest stands belong to locality class III and their site quality is class III. As many as 1663 forest stands out of 1743 forest stands would be managed as monolayer forest operations, and only 80 forest stands would be engaged in secondary forest operations. In other words, sugi and hinoki man-made forests constitute 1663 forest stands throughout the basin, while the other 2159 stands consist of the 659 stands leading to secondary forests and another 1500 stands that are secondary forests, etc. (Table 1).
With regard to the high impact forestry plan focusing on locality class (distance to road) (Plan 2; Figure 11b), since monolayer forest operations are carried out only when the locality class (distance to road) is I, the shift of forest stands to secondary forests increased in comparison to the high impact forestry plan (Plan 1; Figure 11a). Out of the 1743 forest stands, as many as 1431 forest stands would be managed as monolayer forest operations, and 312 forest stands would be engaged in secondary forest operations. In other words, sugi and hinoki man-made forests constitute 1431 forest stands throughout the basin, while the other 3013 forest stands consist of the 891 stands leading to secondary forests and another 2012 stands that are secondary forests, etc. (Table 1).
The future forest physiognomy of the environmental conservation plan (Plan 3) would become elderly man-made forest (Figure 11c) compared to the current forest physiognomy (Figure 10). This plan is similar to the high impact forestry plan (Plan 1) when using the locality class (distance to road) as an indicator, but the site quality class assessment is added to the next step. Many forest stands were assigned under long rotation management for site quality class III. The forest stands of locality classes I or II comprised 1662 forest stands, while class III comprised 81 forest stands. Thirty-two forest stands out of 1662 forest stands were managed as monolayer forest operations, because the site quality was class I. Additionally, 1630 out of 1662 forest stands would be engaged in long rotation management. One forest stand with site quality class I or II out of 81 forest stands with locality class I or II would also be engaged in long rotation management. Eighty forest stands under site quality class III would progress to secondary forest operations. In other words, sugi and hinoki man-made forest constitute 32 forest stands throughout the basin, while the other 1631 forest stands would be converted to old-age man-made forests, and another 2782 forest stands, including 659 forest stands leading to secondary forests, would shift to secondary forests and others (Table 1).
The future forest physiognomy with greater emphasis on environmental conservation (Plan 4) would be mostly secondary forest (Figure 11d). As a feature of this plan, only forest stands with good conditions in locality classes I or II and site quality I or II would be set for timber production. However, most forest stands were judged as class III in terms of site quality and therefore would lead to secondary forest. As with Plan 3, the monolayer forest operation amounted to 32 stands, and the remaining 2290 forest stands were assigned to secondary forest operations. Sugi and hinoki man-made forests constituted only 32 forest stands throughout the basin, and 4413 forest stands, including 2290 forest stands leading to secondary forests, were assigned to secondary forests and others (Table 1).
4. Discussion
Typically, Kanagawa Prefecture manages the water source forests and plans the target forest physiognomy as well as necessary management strategies. However, in this study, different target physiognomies were simulated. Although the relationship between the composition of the stands and the functions of the entire watershed is unclear, changes in the forestry across the entire basin are presented as a map of the current disposition (Figure 10) along with future scenarios (Figure 11). The results are based on the four scenarios (or Plans) [40,41] applied in this study.
As a result of these simulations, the environmental conservation plan with greater emphasis on site quality class (Plan 4) is deemed unrealistic with regard to the current disposition of the study area. The environmental conservation plan (Plan 3) is realistic, since the Japanese forestry industry is an ongoing depressed market. If there is a movement to promote forestry, then the realistically feasible plan would be the high impact forestry plan focusing on locality class (distance to road) (Plan 2) followed by the high impact forestry plan (Plan 1). The simulation results helped establish whether future forest management can be realized. This idea is indispensable for sustainable forest management. This simulation is useful because it can be utilized by forestry workers engaged with GIS. However, the best simulation implementation will require trial and error by rearranging various conditions.
The system yield table is very important for forestry, as in previous studies [13,14,15,16,17,18,19,20,21,22,23,24]. However, forest stands will not grow as expected. In the current sustainable forest management, not only timber production but also sustainable multi-faceted forest functions are required. The forest stand prediction simulation in past research is difficult to execute because the simulation parameters are complex [25,26]. Simulation of forest cutting patterns is insufficient to achieve sustainable forest management [27]. Zoning is a planning method based on the multi-functionality of the forest, and this study presented a simulation method based on zoning theory. This study provides several visual results for future stands in an easy-to-understand manner. While the simulation of this study predicts future forestry from present forestry, future timber production cannot be shown. Therefore, a hybrid simulation of stand prediction with multiple parameters is required [28,29]. In addition to the simulation based on zoning, a forest plan that includes the growth forecast of the stand is required. As mentioned above, since the simulation of this research can be grasped more simply and visually in consideration of sustainable forest management than the simulation of the previous research, similar simulations could be implemented for forestry practitioners.
5. Conclusions
This study explains changes in the physiognomy of forest stands to a target forest physiognomy by alternative growth models using several scenarios. Implementation of these changes requires consideration of factors that express forest physiognomy and how to express changes in spatial forest physiognomy. In addition, it is necessary to make a spatial forest physiognomy model diagram showing the current disposition of each area. If GIS data of forest stands are prepared, future predictions can be made according to the conditions presented in these simulations. Since it is difficult to predict forest growths, simulating a target forest physiognomy with geographical and economic conditions is effective as a simple method. In conclusion, the following are the advantages of the simulation:
- Easy simulation possible;
- Prediction of wide-area and medium-to-long term changes in each scenario;
- Geo-visualization of spatial distribution by GIS;
- Effective dissemination of results to local residents.
However, the simulation has certain drawbacks: (1) simulation accuracy must be improved by site quality class determination combined with field surveys; (2) simulations should be conducted with management plans for each period; (3) feasibility of forest management should be assessed within a certain period; and (4) scientific knowledge of the forest should be generated with regard to ecological and hydrological functions.
Author Contributions
Conceptualization and design, K.S.; Conducting experiments, K.S. and W.S.; Data simulation, K.S. and W.S.; Writing, K.S.
Funding
This research was funded by FY2016 Tanzawa Oyama Nature Regeneration Committee Survey and Research Grant Project under grant Tan-Shi-Sai # 2016001, and their support is gratefully acknowledged.
Acknowledgments
We particularly acknowledge the help of Kanagawa Prefectural staff who provided the forestry data used in this study.
Conflicts of Interest
The authors declare no conflict of interest.
References
- Cerutti, P.O.; Tacconi, L.; Nasi, R.; Lescuyer, G. Legal vs. certified timber: Preliminary impacts of forest certification in Cameroon. For. Policy Econ. 2011, 13, 184–190. [Google Scholar] [CrossRef]
- Hayami, T. Why and how I challenged the first FSC certification in Japan. Jpn. J. For. Plan. 2000, 34, 127–130. (In Japanese) [Google Scholar] [CrossRef]
- Iwamoto, Y.; Shiga, K. Development of SGEC forest certification and response of forestry enterprises. In Framework Formation and Forestry Labor Issues of Regional Forest Management; Shiga, K., Fujikake, I., Koroki, K., Eds.; Japan Forestry Investigation Committee: Tokyo, Japan, 2011; pp. 161–194. ISBN 978-4-88965-205-5. (In Japanese) [Google Scholar]
- Sakamoto, T.; Shiba, M. The effects of forest certification scheme on forest management practice: Case study in the result of SGEC and FSC forest certification assessment in Japan. Appl. For. Sci. 2009, 18, 9–14, (In Japanese with English Abstract). [Google Scholar] [CrossRef]
- Sugiura, K.; Konohira, Y. Features of evaluations of FSC certification bodies: Analysis of certification results of 17 Japanese forests. J. Jpn. For. Soc. 2005, 87, 241–246, (In Japanese with English Summary). [Google Scholar] [CrossRef]
- Sugiura, K.; Yoshioka, T.; Inoue, K. Effects of acquiring FSC forest management certification for Japanese enterprises using SmartWood audits. J. For. Res. 2012, 23, 165–172. [Google Scholar] [CrossRef]
- Sugiura, K.; Sonohara, W. Trends in evaluations of Sustainable Green Ecosystem Council (SGEC) certified forests in Japan. Small-Scale For. 2017, 16, 37–51. [Google Scholar] [CrossRef]
- Sugiura, K.; Yoshioka, T.; Inoue, K. Improvement of forest management in Asia, through assessment of Forest Stewardship Council certification. For. Sci. Technol. 2013, 9, 164–170. [Google Scholar] [CrossRef]
- Sugiura, K.; Oki, Y. Reasons for choosing Forest Stewardship Council (FSC) and Sustainable Green Ecosystem Council (SGEC) schemes and the effects of certification acquisition by forestry enterprises in Japan. Forests 2018, 9, 173. [Google Scholar] [CrossRef]
- Tomimura, S. The Japanese forest and forestry course: Findings from the FSC forest certification. Mizu-Joho 2003, 23, 13–17. (In Japanese) [Google Scholar]
- Nishikawa, K. Introduction to Modern Forest Planning: Forest Management for the 21st Century; Japanese Society of Forest Planning Publishing: Tokyo, Japan, 2004; p. 274. ISBN 4-915870-29-4. (In Japanese)
- Kakizawa, H. Forest planning and society. In Forest Planning; Konohira, K., Ed.; Asakura Publishing Co. Ltd.: Tokyo, Japan, 2003; pp. 40–63, (In Japanese). ISBN 4-254-47034-7. [Google Scholar]
- Konohira, Y. Study on the System Yield Table: Report No.: MEXT KAKENHI Grant Number JP02304022; Ministry of Education of Japan: Tokyo, Japan, 1992; p. 138. (In Japanese)
- Konohira, Y. Study on the Practical Software Development of System, Yield Table: Report No.: MEXT KAKENHI Grant Number JP04556019; Ministry of Education of Japan: Tokyo, Japan, 1995; p. 198. (In Japanese)
- Konohira, Y. Definition of the system yield table. J. For. Plan. 1995, 1, 63–67. [Google Scholar] [CrossRef]
- Matsumoto, M. Construction of yield tables for sugi (Cryptomeria japonica) in Kumamoto district using LYCS. J. For. Plan. 1997, 3, 55–62. [Google Scholar] [CrossRef]
- Matsumoto, M.; Nakajima, T.; Hosoda, K. Improvement of LYCS, a software for construction of local yield tables. J. Jpn. For. Soc. 2011, 93, 187–195, (In Japanese with English Summary). [Google Scholar] [CrossRef]
- Nagahama, T.; Kondoh, H. A formulation of SILKS, a system yield table for sugi (Cryptomeria japonica I D. Don) plantations in Kagoshima Prefecture. Jpn. J. For. Plan. 2006, 40, 221–230, (In Japanese with English Summary). [Google Scholar] [CrossRef]
- Nakajima, T.; Shiraishi, N. Application of the local yield table construction system to a timber self-supply production strategy in Ise Shrine Forest with special focus on the Shikinen Sengu Ceremony. J. Jpn. For. Soc. 2007, 89, 21–25, (In Japanese with English Summary). [Google Scholar] [CrossRef]
- Tatsuhara, S. Predicting growth of coniferous plantations using a stand table data base. Jpn. J. For. Plan. 1995, 24, 25–32, (In Japanese with English Summary). [Google Scholar] [CrossRef]
- Zheng, X.-X. Method of constructing a system yield table. J. Jpn. For. Soc. 1994, 76, 132–137, (In Japanese with English Summary). [Google Scholar] [CrossRef]
- Shiraishi, N. Study on the growth prediction of even-aged stands. Bull. Univ. Tokyo For. 1986, 75, 199–256. Available online: https://repository.dl.itc.u-tokyo.ac.jp/?action=pages_view_main&active_action=repository_view_main_item_detail&item_id=25593&item_no=1&page_id=28&block_id=31 (accessed on 18 May 2018). (In Japanese with English Summary).
- Kato, A.; Tanaka, K.; The growth parameters of the system yield table “Silv-no-mori” in Tateyama-sugi (Cryptomeria japonica D.Don) stands. Bull. Toyama For. Res. Inst. 2009, 44–51. Available online: http://taffrc.pref.toyama.jp/nsgc/shinrin/webfile/t1_31bdc5e3312230446dd394d6f3049bbc.pdf (accessed on 28 May 2018). (In Japanese with English Summary).
- Zhou, X. The forest forecast map based on system yield table: Spatial retrieval and forecast. Jpn. J. For. Plan. 1995, 25, 27–31, (In Japanese with English Summary). [Google Scholar] [CrossRef]
- Nothdurft, A.; Saborowski, J.; Breidenbach, J. Spatial prediction of forest stand variables. Eur. J. For. Res. 2009, 128, 241–251. [Google Scholar] [CrossRef] [Green Version]
- Druckenbrod, D.L.; Shugart, H.H.; Davies, I. Spatial pattern and process in forest stands within the Virginia piedmont. J. Veg. Sci. 2005, 16, 37–48. [Google Scholar] [CrossRef]
- Li, H.; Franklin, J.F.; Swanson, F.J.; Spies, T.A. Developing alternative forest cutting patterns: A simulation approach. Landsc. Ecol. 1993, 8, 63–75. [Google Scholar] [CrossRef]
- Monserud, R.A. Evaluating forest models in a sustainable forest management context. FBMIS 2003, 1, 35–47. Available online: http://citeseerx.ist.psu.edu/viewdoc/download?doi=10.1.1.458.4718&rep=rep1&type=pdf (accessed on 18 May 2018).
- Kimmins, J.P. Modelling the sustainability of forest production and yield for a changing and uncertain future. For. Chron. 1990, 66, 271–280. [Google Scholar] [CrossRef]
- Peuplements forestiers du massif Vosgien. Le Ban Saint-Martin: Centre Régional de la Propriété Forestiére de Lorraine-Alsace (France). Available online: http://www.crpf.fr/new/telechargement%20dossiers/guide_massifvosgien.pdf (accessed on 16 December 2008). (In French)
- Forestry Agency of Japan. Annual Report on Trends in Forest and Forestry in Japan: Fiscal Year 2016; National Forest Development and Extension Association: Tokyo, Japan, 2017; p. 236. ISBN 978-4-88138-349-0. (In Japanese)
- Population and Household of Kanagawa Prefecture. Available online: http://www.pref.kanagawa.jp/docs/x6z/tc30/jinko/jimkotosetai.html (accessed on 27 April 2019).
- Konohira, Y. The working of headwater forest. In Natural Regeneration of Tanzawa; Konohira, Y., Katsuyama, T., Tamura, A., Yamane, M., Hayama, S., Itonaga, K., Hara, K., Tanigawa, K., Eds.; Japan Forestry Investigation Committee: Tokyo, Japan, 2012; pp. 21–26. ISBN 978-4-88965-225-3. (In Japanese) [Google Scholar]
- Inamoto, K. Kanagawa suigen-no shinnrin zukuri (improving forests in the headwater of Kanagawa). In Natural Regeneration of Tanzawa; Konohira, Y., Katsuyama, T., Tamura, A., Yamane, M., Hayama, S., Itonaga, K., Hara, K., Tanigawa, K., Eds.; Japan Forestry Investigation Committee: Tokyo, Japan, 2012; pp. 91–96. ISBN 978-4-88965-225-3. (In Japanese) [Google Scholar]
- Konohira, Y. Preface. In Natural Regeneration of Tanzawa; Konohira, Y., Katsuyama, T., Tamura, A., Yamane, M., Hayama, S., Itonaga, K., Hara, K., Tanigawa, K., Eds.; Japan Forestry Investigation Committee: Tokyo, Japan, 2012; pp. 19–20. ISBN 978-4-88965-225-3. (In Japanese) [Google Scholar]
- Konohira, Y. History of plantation forest and future management. In Natural Regeneration of Tanzawa; Konohira, Y., Katsuyama, T., Tamura, A., Yamane, M., Hayama, S., Itonaga, K., Hara, K., Tanigawa, K., Eds.; Japan Forestry Investigation Committee: Tokyo, Japan, 2012; pp. 73–83. ISBN 978-4-88965-225-3. (In Japanese) [Google Scholar]
- Ota, T. Mountainous areas as a water source area. In Mountainous Area and Multifaceted Function; Tabuchi, T., Shiomi, M., Eds.; Association of Agriculture & Forestry Statistics: Tokyo, Japan, 2002; pp. 6–29. ISBN 4-541-02883-2 C 3061. (In Japanese) [Google Scholar]
- Ota, T. Multiple functions of Forest and Zoning. Shinrin Kagaku 2005, 43, 11–17. (In Japanese) [Google Scholar] [CrossRef]
- Kanagawa Prefecture. Promotion of Forestry Project for Water Source; Kanagawa Prefecture: Yokohama, Japan, 2017; Available online: http://www.pref.kanagawa.jp/uploaded/attachment/707824.pdf (accessed on 1 March 2017). (In Japanese)
- Masutani, T. On the interest of forestry by site quality and location class. In Results of the Scientific Research on the Tanzawa Mountains; Research Group of the Tanzawa Mountains, Hiraoka Environmental Science Laboratory: Kanagawa, Japan, 2007; pp. 537–540. ISBN 978-4-9903753-0-0. (In Japanese) [Google Scholar]
- Kuroiwa, Y. Prediction of Thinning Volume and Manpower Requirement Based on Forest Management Plan of Environmental Conservation Type. Master’s Thesis, Graduate School of Bioresource Sciences, Nihon University, Kanagawa, Japan, 25 March 2005. (In Japanese). [Google Scholar]
Figure 1.
The study area in Kanagawa Prefecture.

Figure 2.
Zoning plan focused on wood production function.

Figure 3.
High impact forestry plan (Plan 1).

Figure 4.
High impact forestry plan focusing on locality (Plan 2).

Figure 5.
Environmental conservation plan (Plan 3).

Figure 6.
Environmental plan with greater emphasis on site quality class (Plan 4).

Figure 7.
Elevation (a) and inclination (b) in the study area.

Figure 8.
Tree species and forest roads in the study area.

Figure 9.
Locality (distance to road) (a) and site classes (b) in the study area.
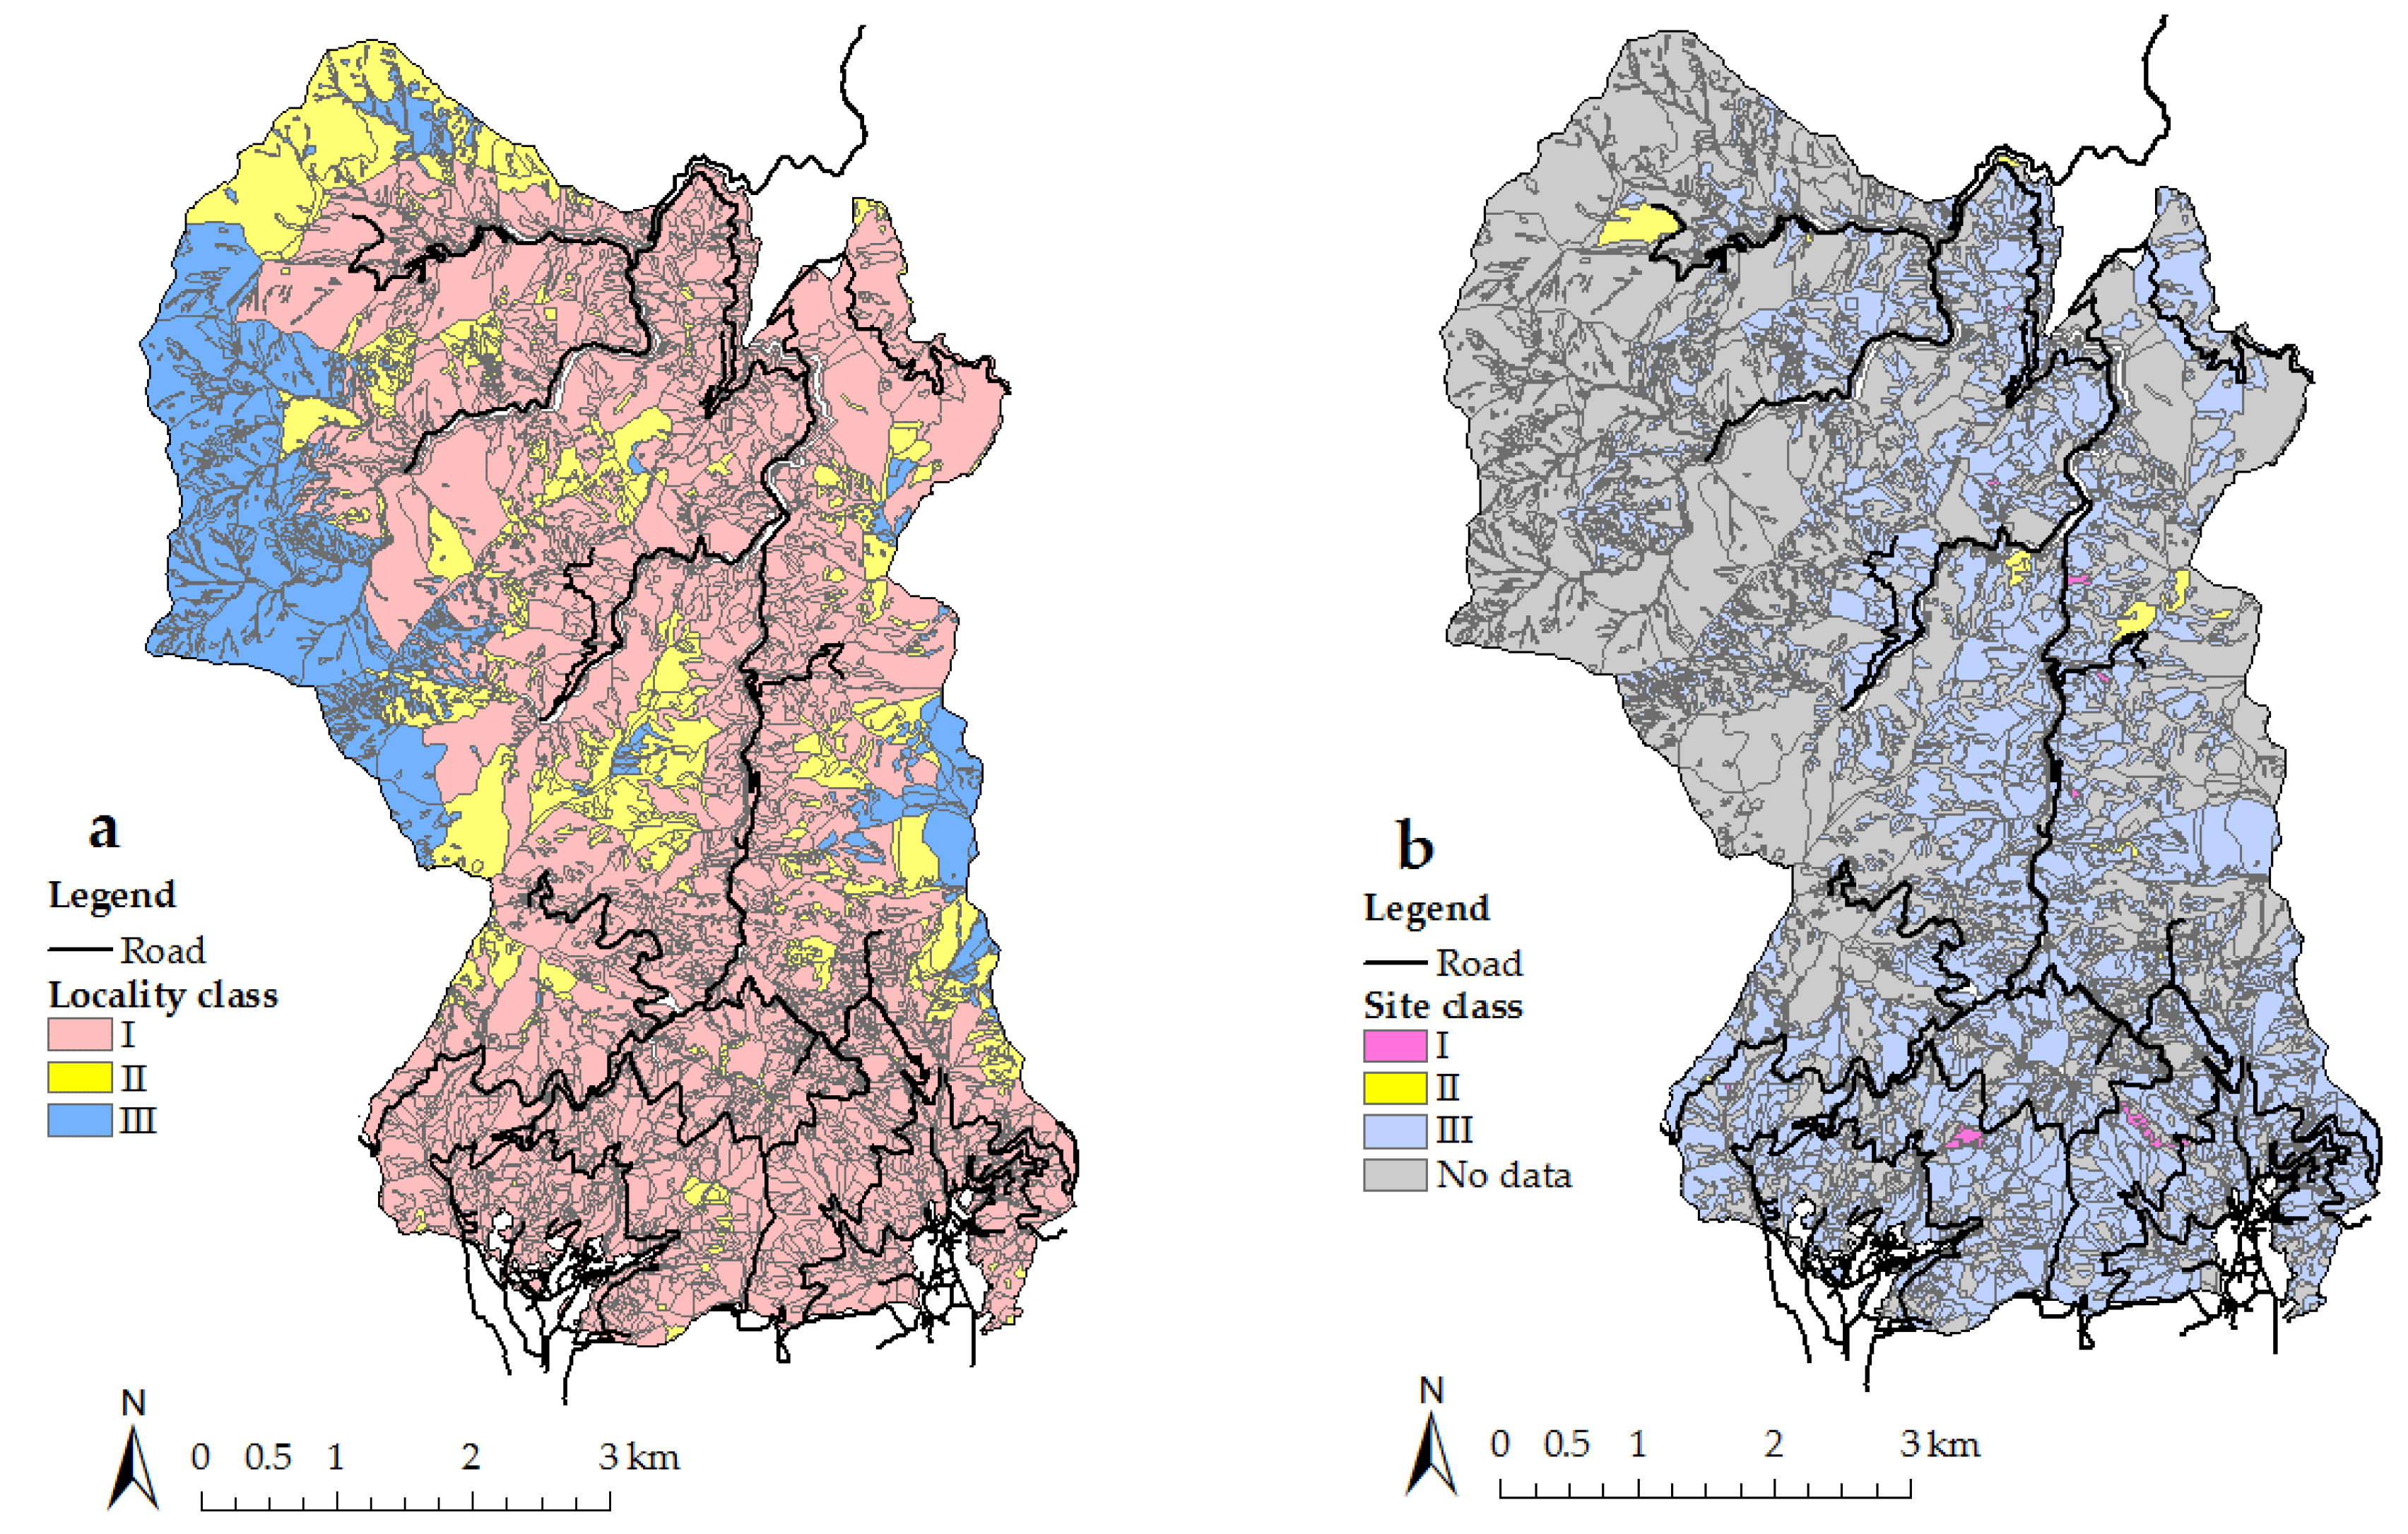
Figure 10.
Current man-made forest stands and secondary forest stands.

Figure 11.
Future forest physiognomies based on each plan; (a) forestry high impact plan (Plan 1), (b) forestry high impact plan focusing on locality class (distance to road) (Plan 2), (c) environmental conservation plan (Plan 3), and (d) environmental plan with greater emphasis on site quality class (Plan 4).


Table 1.
Changes in the number of forest stands and forest areas in the four plan simulations.
| Plan | Man-Made Forest (Sugi and Hinoki) | Elderly Man-Made Forest | Secondary Forest |
|---|---|---|---|
| Current forest stands | 2322 (1625 ha) | 0 | 2123 (2159 ha) |
| Plan 1 | 1663 (1336 ha) | 0 | 2782 (2448 ha) |
| Plan 2 | 1432 (1152 ha) | 0 | 3013 (2632 ha) |
| Plan 3 | 32 (35 ha) | 1631 (1301 ha) | 2782 (2448 ha) |
| Plan 4 | 32 (35 ha) | 0 | 4413 (3749 ha) |
| Values are the number of forest stands, and bracketed values show the forest areas. | |||
© 2019 by the authors. Licensee MDPI, Basel, Switzerland. This article is an open access article distributed under the terms and conditions of the Creative Commons Attribution (CC BY) license (http://creativecommons.org/licenses/by/4.0/).
Share and Cite
MDPI and ACS Style
Sugiura, K.; Sonohara, W. Application of an Adaptive Forest Management Simulation Model Based on Zoning in a Man-Made Forest. Forests 2019, 10, 482. https://doi.org/10.3390/f10060482
AMA Style
Sugiura K, Sonohara W. Application of an Adaptive Forest Management Simulation Model Based on Zoning in a Man-Made Forest. Forests. 2019; 10(6):482. https://doi.org/10.3390/f10060482
Chicago/Turabian StyleSugiura, Katsuaki, and Waka Sonohara. 2019. "Application of an Adaptive Forest Management Simulation Model Based on Zoning in a Man-Made Forest" Forests 10, no. 6: 482. https://doi.org/10.3390/f10060482
Note that from the first issue of 2016, this journal uses article numbers instead of page numbers. See further details here.