Article

Juniper Tree-Ring Data from the Kuramin Range (Northern Tajikistan) Reveals Changing Summer Drought Signals in Western Central Asia

1
Yunnan Key Laboratory of International Rivers and Transboundary Eco-Security, Institute of International Rivers and Eco-Security, Yunnan University, Kunming 650500, China
2
Key Laboratory of Tree-ring Physical and Chemical Research of China Meteorological Administration/Xinjiang Laboratory of Tree-Ring Ecology, Institute of Desert Meteorology, China Meteorological Administration, Urumqi 830002, China
3
Institute of Forest Sciences, University of Freiburg, 79106 Freiburg, Germany
4
Regional Climate Group, Department of Earth Science, University of Gothenburg, 40530 Gothenburg, Sweden
5
Institute of Water Problems, Hydroenergy and Ecology, Academy of Science of the Republic of Tajikistan, Dushanbe 734063, Tajikistan
*
Author to whom correspondence should be addressed.
Forests 2019, 10(6), 505; https://doi.org/10.3390/f10060505
Submission received: 19 May 2019 / Revised: 5 June 2019 / Accepted: 6 June 2019 / Published: 14 June 2019
(This article belongs to the Section Forest Ecophysiology and Biology)

Abstract

:
Coniferous forests cover the mountains in many parts of Central Asia and provide large potentials for dendroclimatic studies of past climate variability. However, to date, only a few tree-ring based climate reconstructions exist from this region. Here, we present a regional tree-ring chronology from the moisture-sensitive Zeravshan juniper (Juniperus seravschanica Kom.) from the Kuramin Range (Tajikistan) in western Central Asia, which is used to reveal past summer drought variability from 1650 to 2015 Common Era (CE). The chronology accounts for 40.5% of the variance of the June–July self-calibrating Palmer Drought Severity Index (scPDSI) during the instrumental period (1901 to 2012). Seven dry periods, including 1659–1696, 1705–1722, 1731–1741, 1758–1790, 1800–1842, 1860–1875, and 1931–1987, and five wet periods, including 1742–1752, 1843–1859, 1876–1913, 1921–1930, and 1988–2015, were identified. Good agreements between drought records from western and eastern Central Asia suggest that the PDSI records retain common drought signals and capture the regional dry/wet periods of Central Asia. Moreover, the spectral analysis indicates the existence of centennial (128 years), decadal (24.3 and 11.4 years), and interannual (8.0, 3.6, 2.9, and 2.0 years) cycles, which may be linked with climate forces, such as solar activity and El Niño-Southern Oscillation (ENSO). The analysis between the scPDSI reconstruction and large-scale atmospheric circulations during the reconstructed extreme dry and wet years can provide information about the linkages of extremes in our scPDSI record with the large-scale ocean–atmosphere–land circulation systems.

1. Introduction

As a result of climate warming during recent decades, the intensity and frequency of drought events have been increasing [1,2,3]. Climate models predict a significant increase in the extent of dry areas across the globe, mainly in the Northern Hemisphere, with a potential expansion of arid lands by up to 80% in developing countries [4,5]. Climate change and related drought events have significant influences on the socioeconomic and human well-being in arid Central Asia, particularly in densely populated dry lands, such as the Fergana Basin [6,7,8]. Lake shrinkage, oasis salinization, and water resource deterioration, mainly due to excess water use for irrigation, have been linked to climate change, especially in the Aral Sea Basin [9,10,11]. Meteorological stations were installed in some big cities of Central Asia, such as Samarkand, in the late 19th century, but most of the observational records from the mountains areas of Central Asia started in the 1950s and 1960s. Due to poor spatiotemporal coverage of meteorological records in the mountains areas, there are uncertainties in the estimation of Central Asian climate change. Therefore, to achieve more accurate assessments of climate change in a long-term perspective in this region, high-resolution climate proxy data is needed.
Due to their exact dating and annual resolution, climate-sensitive trees play an important role in providing information about past climate variability and change in many regions of the world [12]. Indeed, many of the existing long-term climate records from Central Asia have been based on tree-ring data [13,14,15,16,17,18,19,20,21]. These dendroclimatic reconstructions allow us to better understand the spatiotemporal variations of the Central Asian climate. However, the impact of climate on tree growth can be complex, for example tree-ring formation can be influenced by both precipitation and temperature [22,23], making it difficult to separate the precipitation signals from the temperature. However, by considering monthly climate factors and the soil moisture supply, different comprehensive drought indices, such as the standardized precipitation evapotranspiration index [24] and the Palmer Drought Severity Index (PDSI) [25], have been developed. Such indices can thus be used as targets for drought reconstructions from trees with mixed temperature and precipitation sensitivity. Based on large tree-ring networks, spatial drought reconstructions have been developed for many regions, including Europe, North America, northwestern Africa, and Mongolia [26,27,28,29,30,31]. Although some dendroclimatic studies have investigated drought variability, as well as its effect on tree growth in Central Asia [13,16,21,32,33,34,35,36,37], the number of tree-ring data from western Central Asia is still not sufficient to provide a regionally comprehensive picture. Thus, moisture-sensitive tree-ring chronologies are needed to interpret the past drought variation.
The Kuramin Range offers good potentials for dendroclimatic study in Northern Tajikistan. This mountain range is a source of streamflow into the small mountainous rivers in the border areas between Tajikistan and Uzbekistan. The exploding population and scarce water resources have increasingly stressed water supplies in the Fergana basin and its surrounding areas. Dendroclimatic information from the Kuramin Range can be used to make water resource plans and help tackle regional climate change. This study presents a June–July PDSI reconstruction from tree-ring width data of the Zeravshan juniper, obtained from two sites in the Kuramin Range, northern Tajikistan. Wavelet analysis was applied to examine any cycles in the drought reconstruction. Furthermore, we investigated the relationships between this drought record and atmospheric circulation patterns over the Pacific and Indian Oceans.

2. Material and Methods

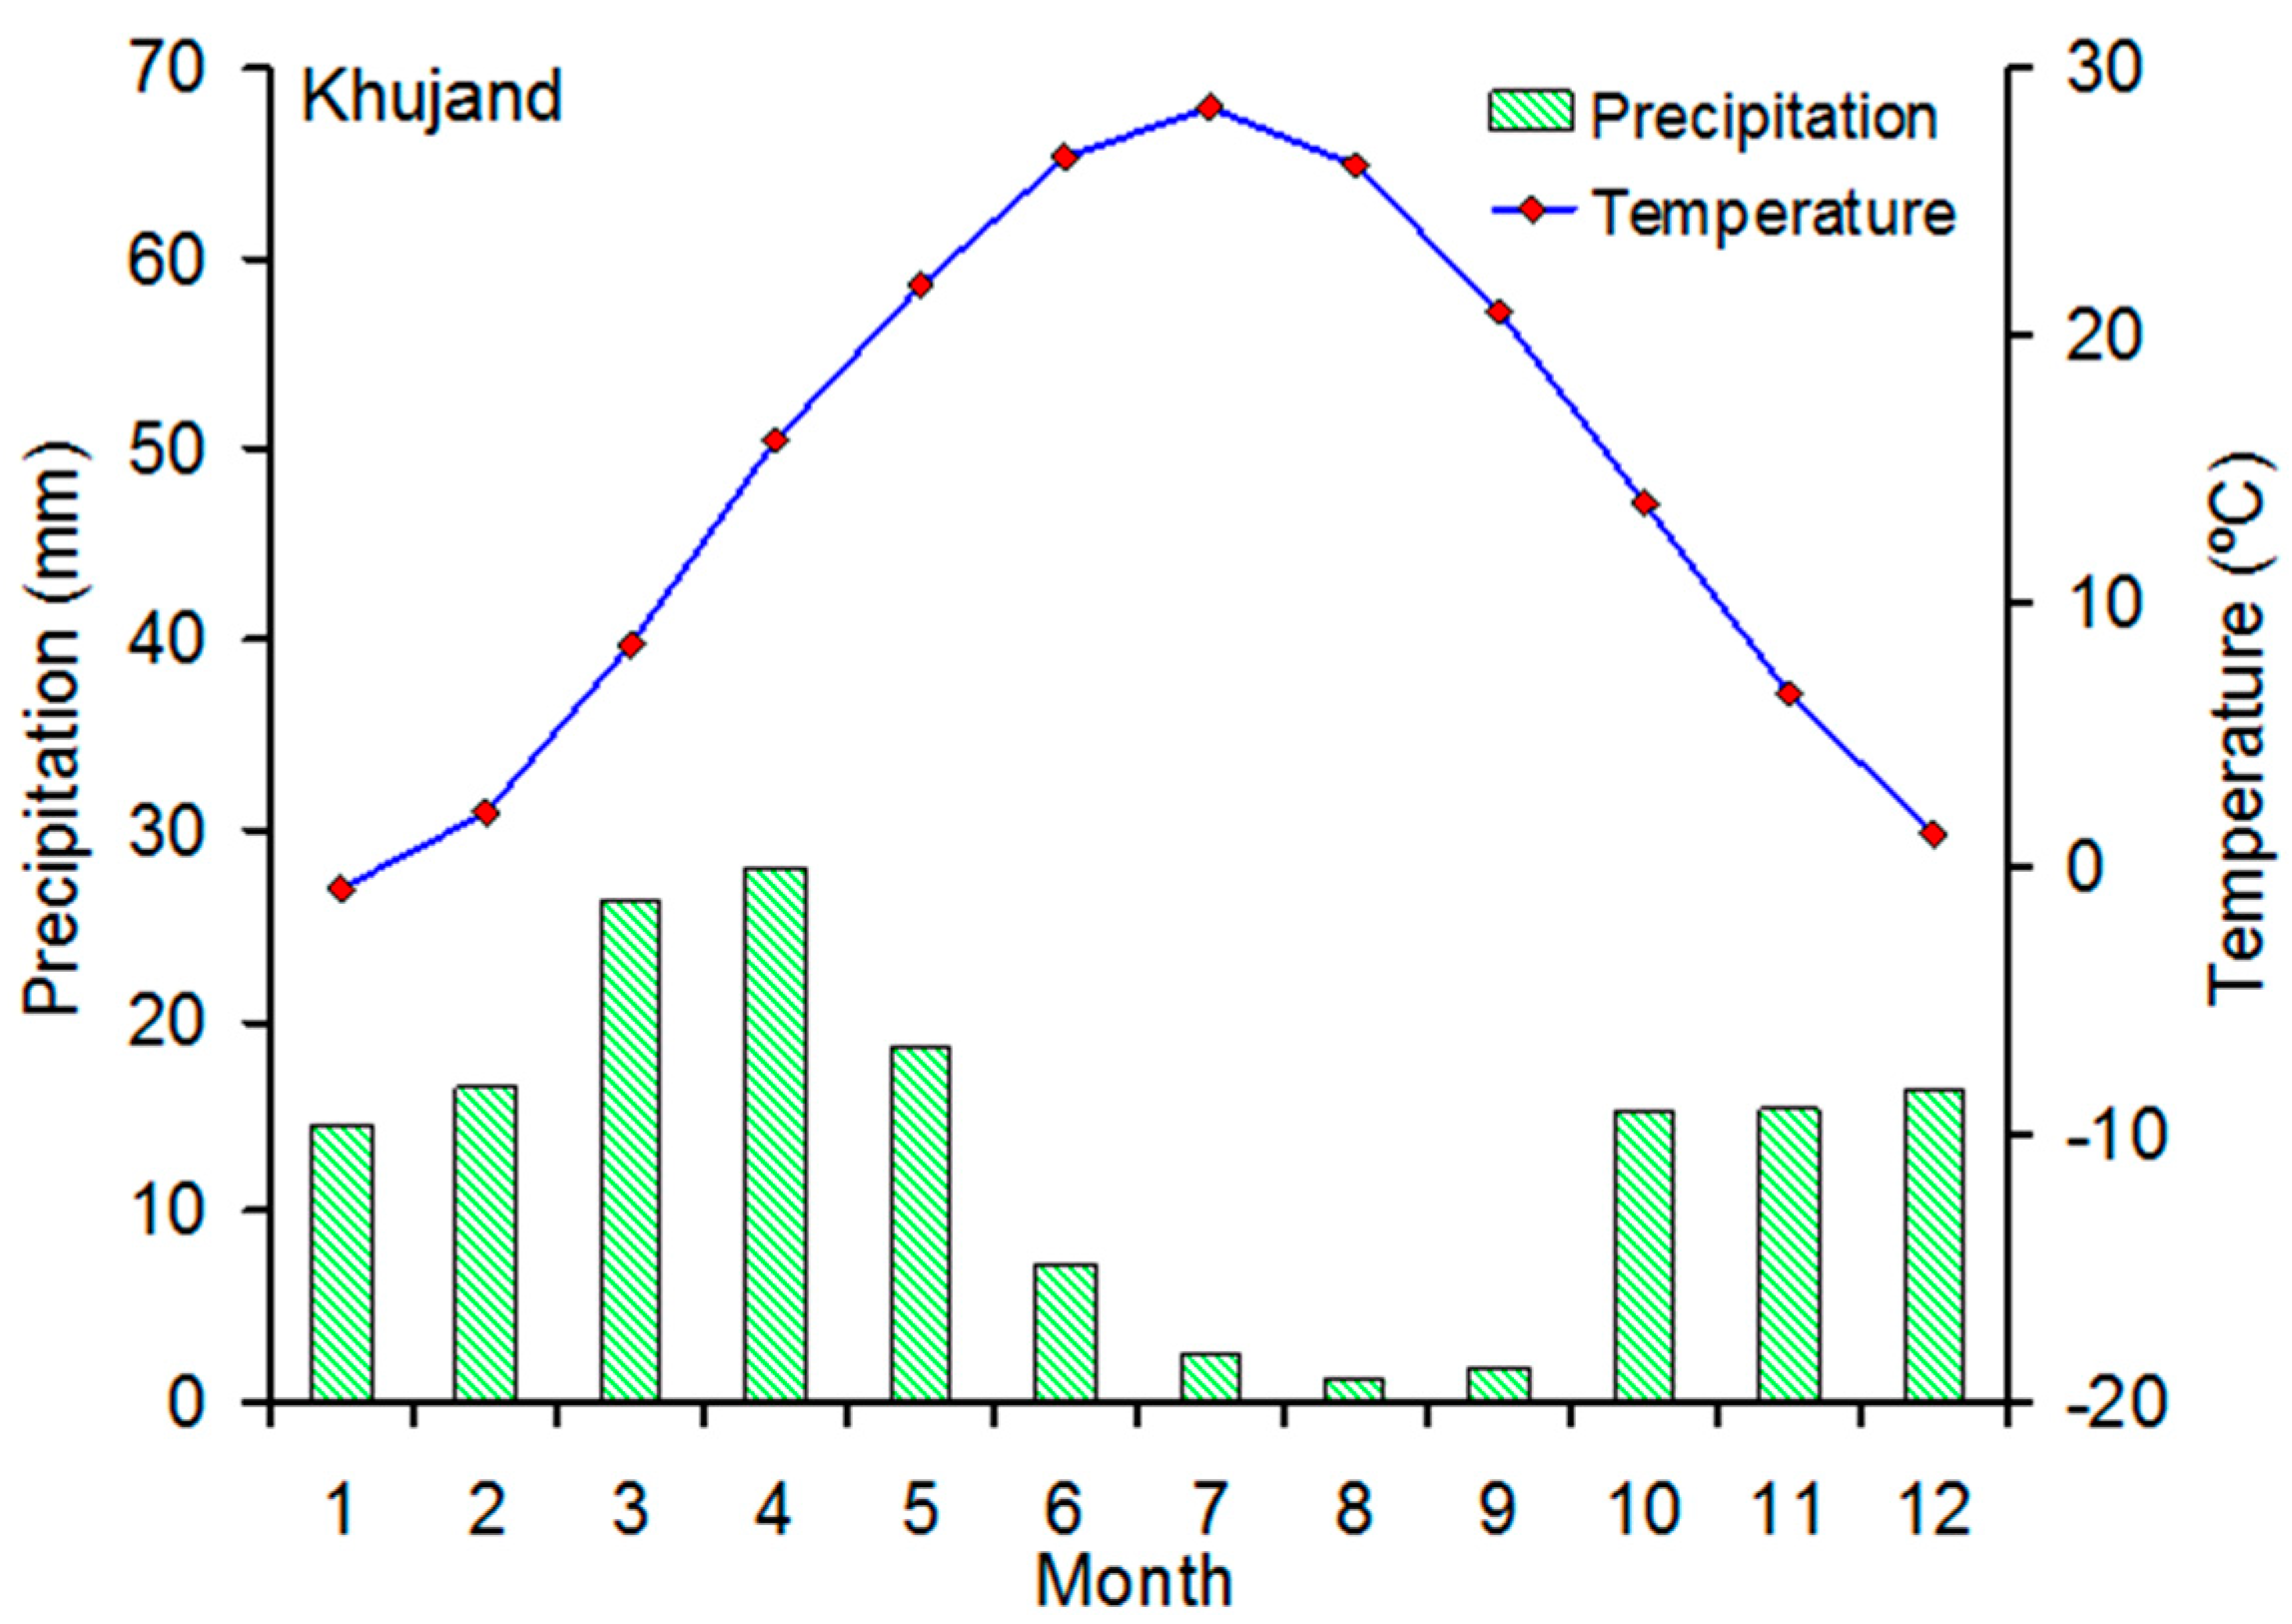
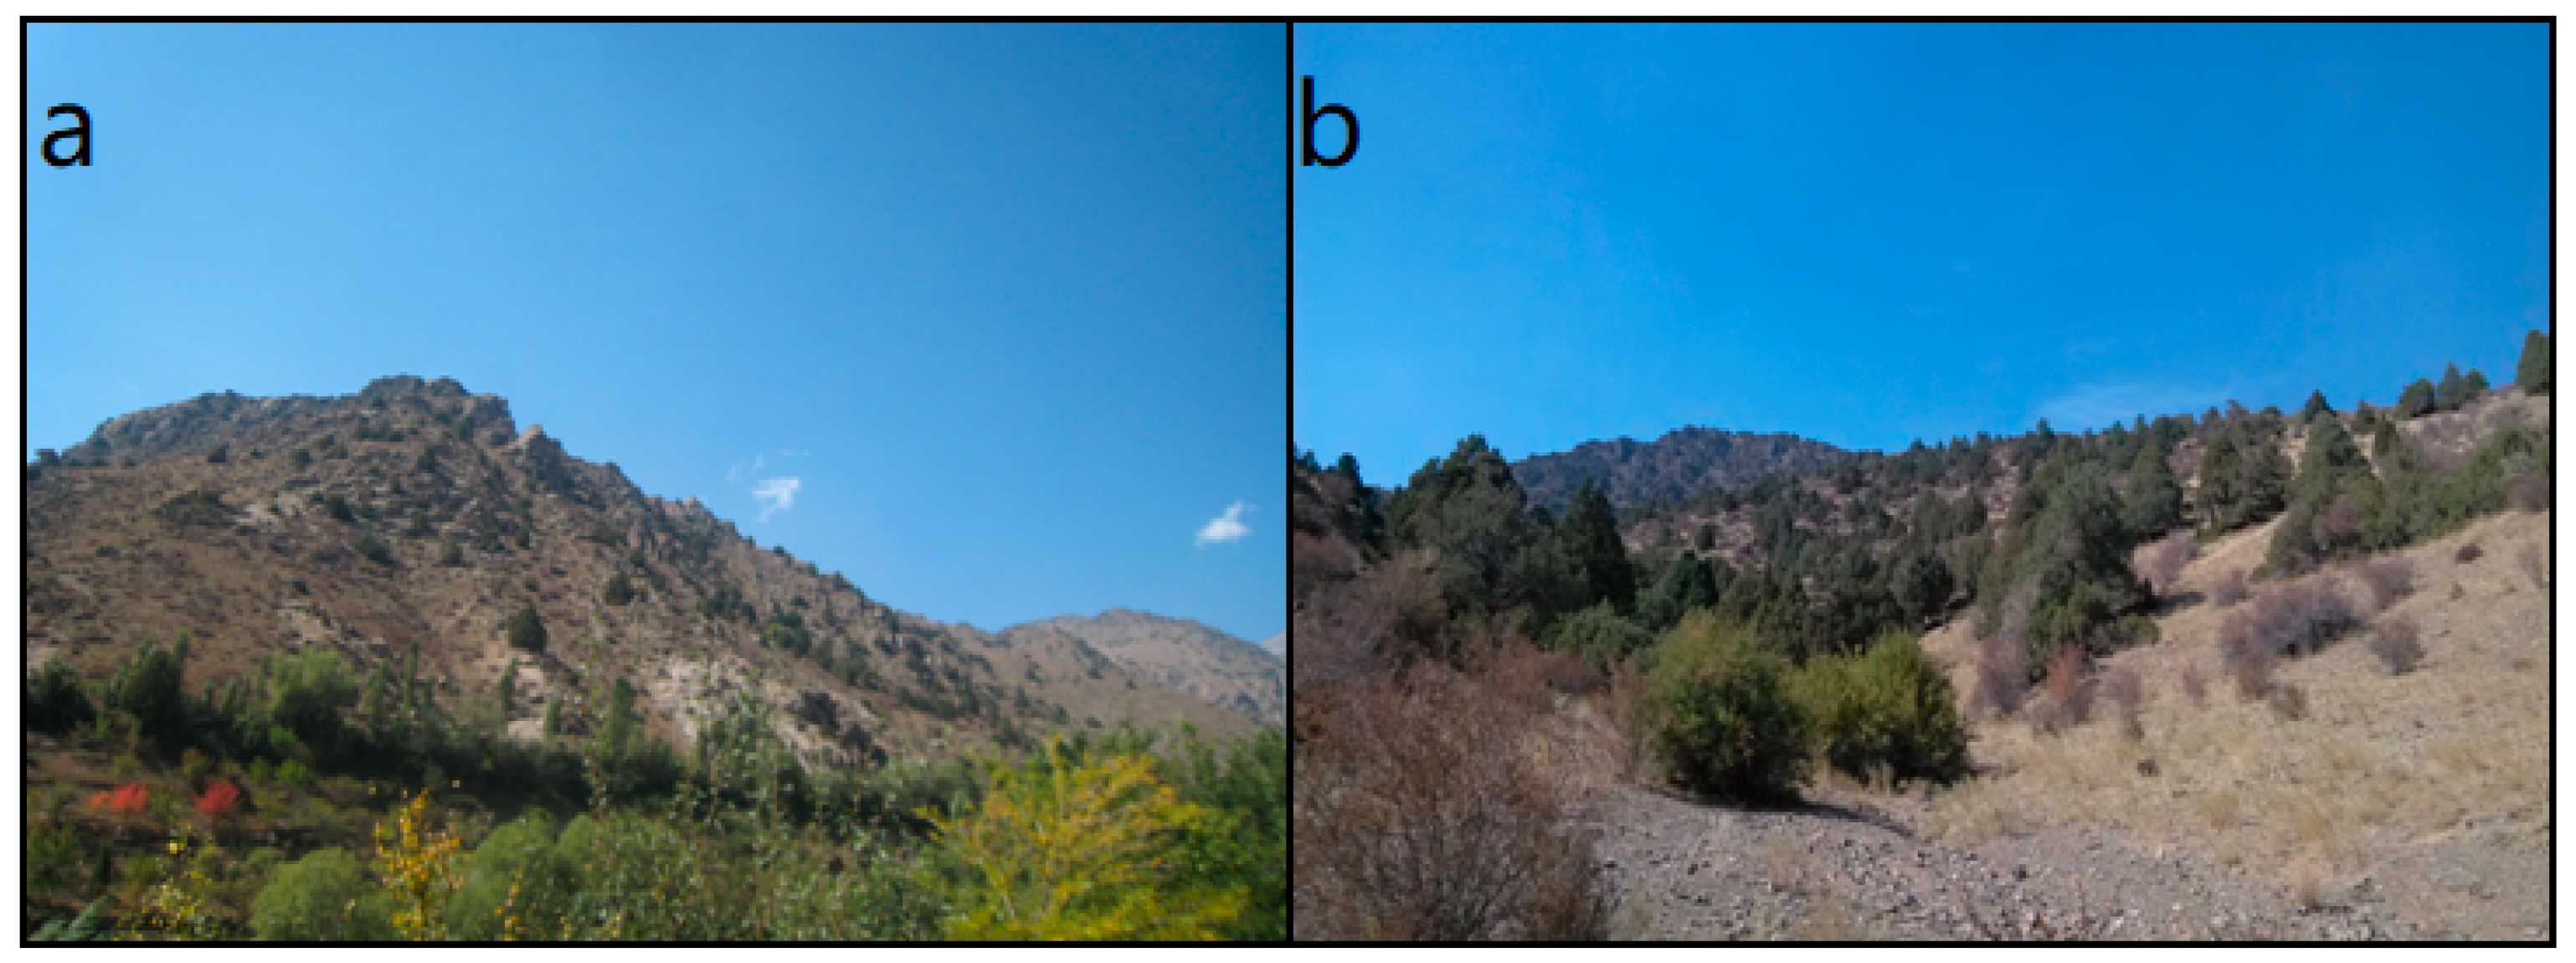
2.1. Geographical Settings and Chronology Development

Due to climatic factors, forests in Central Asia are gradually transitioning from spruce forests to juniper forests in southern Kyrgyzstan. The Central Asian forests divides into the west forest and the east forest, with southern Kyrgyzstan as the border. The west forest is dominated by juniper trees (juniper-dominated Central Asia) and the east forest is dominated by spruce trees (spruce-dominated Central Asia). The research region is located in the Kuramin Range (northern Tajikistan) near the Fergana Basin (Figure 1), where the climate is mainly affected by the Westerlies [35]. The average annual total rainfall from the closest meteorological station (Khujand station, 40°13′ N, 69°44′ E, 414 m a.s.l.) amounts to 164.1 mm, with only 19.1% of the total annual rainfall falling during the warm season, which is approximately from May to September. July (average monthly temperature of 28.6 °C) and January (−0.8 °C) are the warmest and the coldest months, respectively (Figure 2). At the sampling sites Obiasht and Adrasman (Table 1), with sparse vegetation among different trees, open-canopy juniper forests grow on thin soil (Figure 3). All tree-ring samples were collected from the dominant species, the Zeravshan juniper (Juniperus seravschanica). In total, 81 samples (from 40 trees) were taken from the two sites in the low elevation area of Kuramin Range. The oldest tree (1594–2015) was found at the Adrasman site.
After drying and mounting on the mounts, the tree-ring samples were polished with 400 grit sandpaper to enhance the tree-ring boundaries. The Velmex measuring system, with a precision of 0.001 mm, was used to measure annual ring widths. The quality of the cross-dating and measurements was controlled using COFECHA software [38]. The two chronologies of Obiasht and Adrasman showed a common signal, with an altitude difference of 372 m. The strength of the common signal can be assessed using the mean interseries and chronologies correlations (Table 2). The result of correlation analysis reveals that high correlation (r = 0.52, p < 0.001) exists between the site chronologies. These reflected the common responses to climatic influences. This allowed us to use all the tree-ring width series of juniper trees to construct a regional chronology. Consequently, we combined all the series from the two sites into a synthesis chronology. The ARSTAN program [39] was used to develop a regional chronology for the Kuramin Range. Detrending by the negative exponential curve removed the non-climatic trends. The detrended series were then pre-whitened with low-order autoregressive models to remove persistence not related to climatic variations [39]. To minimize the influences of outliers in the tree-ring indices, a bi-weight robust estimate of the mean was used. The regional standard chronology (RC) was used in the further analyses. The fully replicated chronology, with an expressed population signal [40] greater than or equal to 0.85, was achieved with a minimum tree number of five trees from 1650 CE.

2.2. Statistical Analysis

The tree-ring width chronologies were correlated with a set of monthly climate variables (including monthly total rainfall and average temperature) from July of the previous year to September of the current year, from the Khujand station, for the period from 1927 to 1990. Since the surrounding areas have over a century of climate data, the self-calibrating Palmer Drought Severity Index (scPDSI) [3] for the Kuramin Range (averaged over 40°30′–41°30′ N, 70°00′–71°00′ E) for the period from 1901 to 2012 (obtained from the KNMI Climate Explorer website (http://climexp.knmi.nl/) was also used in the correlation analysis.
Correlations between the tree-ring width chronologies and the monthly climate records allowed identification of the main limiting factors for tree growth. Based on linear regression analysis, a statistical model between the predictand (scPDSI) and the predictors (the RC chronology) was calculated for the calibration period (1901–2012) to indicate past drought variations. A split-sample calibration-verification test [39] was used to evaluate the reliability of the scPDSI reconstruction model. The period 1901–2012 was divided into calibration (1957–2012) and verification (1901–1956) sections. Testing statistics were employed to evaluate model ability, including the sign test (ST), coefficient of efficiency (CE) and reduction of error (RE) [39]. In this study, wet and dry periods were determined if the 31 year low-pass values were lower than the average value of the scPDSI reconstruction continuously for more than 10 years.
To investigate common drought signals of juniper-dominated Central Asia, principal component analyses [41] was used over the common period (1700–2012) of the moisture-sensitive tree-ring chronologies of juniper trees (this study; [35,36]). Comparison with regional drought records from spruce-dominated Central Asia considers the tree-ring-based drought reconstruction [34], which accounts for 70.4% of the total variance of spruce tree-ring series from spruce-dominated Central Asia.
Spectral analyses were performed using the cross wavelet transform [42] and the Multi-Taper Method [43]. We used a 5 × 3π taper and a red noise background in the multi-taper spectral analysis. The wavelet function used in the study was a Morlet wavelet with a wave number of six, and the wavelet power, significant at the 5% level, was tested against a red noise process. For better visual comparison, the regional drought series of western and eastern Central Asia were standardized and smoothed with a 20 year low-pass filter. We also calculated the spatial correlation using the KNMI Climate Explorer (http://climexp.knmi.nl/) to reveal the geographical representation of our records and investigate correlation fields with sea surface temperature [44]. In order to explore the linkages between reconstructed scPDSI extreme events and atmospheric circulation patterns over West and Central Asia, NCEP climate data [45] were used to create May–July composite anomaly maps of the geopotential height, SSTs, and 500 hPa vector wind in the driest 10 years and wettest 10 years during the period from 1948 to 2010.

3. Results

3.1. The scPDSI Reconstruction

Statistical results from the ARSTAN program indicated that over the common period from 1901 to 2015, the Kuramin Range chronology had a high standard deviation (0.45), signal-to-noise ratio (32.22), and EPS (0.97). The variance in the eigenvector of all the detrended series accounted for 51.6% of the total variance, indicating that juniper tree growth at the two sites was influenced by similar factors. Significant positive correlations (p < 0.05) between the Kuramin Range chronology and the total monthly precipitation were found in the current April–July (r: 0.26–0.36) (Figure 4). Significant negative correlations with the monthly mean temperature were found in the current May–June (r: −0.28 to −0.44). The Kuramin Range chronology was positively and significantly correlated with scPDSI during the previous July–September, particularly from April to September (r: 0.59–0.637). We also investigated the correlations between the Kuramin Range chronology and the seasonally averaged scPDSI, and the strongest correlation (r: 0.637) was found with mean June–July scPDSI (1901–2012). Thus, the scPDSI reconstruction was developed by calibrating the Kuramin Range chronology with mean June–July scPDSI data. The climate–growth response patterns were similar in the two site chronologies (Figure 4).
During the calibration period, from 1901 to 2012, the predictor variable (the Kuramin Range chronology) accounts for 40.5% of the variance in the instrumental scPDSI data (40.0% after adjustment for loss of degrees of freedom). The model obtained was the following:
Y = −3.857 + 2.647X,
where Y is mean June–July scPDSI and X is the tree-ring index.
The positive RE and CE reveal the good predictive skill of the statistical model (Table 3). The results of the sign and the first-order sign tests both exceed the 99% confidence level. These test results indicated that our statistical equation was reliable. Figure 5 shows a comparison of reconstructed and instrumental mean June–July scPDSI data in the Kuramin Range during the period from 1901 to 2012. The comparison shows that the reconstructed scPDSI is quite consistent with the instrumental scPDSI on short and long timescales during the 20th century.

3.2. Analyses of Drought Variation in the Kuramin Range

The Kuramin Range reconstruction provides insight into past drought variation for this part of northern Tajikistan from 1650 to 2015 CE (Figure 6). In this study, a dry period was determined if the low-pass filtered PDSI values were lower than the long-term average continuously for >10 years. Dry periods occurred in 1659–1696, 1705–1722, 1731–1741, 1758–1790, 1800–1842, 1860–1875, and 1931–1987. Sustained dry decades were centered on 1830, as well as around 1960. Wet periods were identified in 1742–1752, 1843–1859, 1876–1913, 1921–1930, and 1988–2015. Although the period from 1988 to 2015 was characterized by wet summers, the reconstruction shows a downward trend during the past 10 years, which is in agreement with the observations.
The three tree-ring width chronologies of juniper trees (this study; [35,36]) were correlated significantly (p < 0.001) among each other. Correlations between this study, Seim et al. (2015) [36], and Chen et al. (2016) [35], computed over the 1700–2012 common period are 0.34 and 0.40. The principal component analyses indicated that the first principal component (PC1) of the three chronologies exceed an eigenvalue of >1.5 and accounts for 52.53% of the total variance. The comparison between the drought reconstruction of the Kuramin Range and regional drought record for spruce-dominated Central Asia, by Chen et al. (2015) [34], yielded a correlation coefficient of (r = 0.35, p < 0.001, n = 306). The PC1 also mirrors similar dry/wet intervals to the regional drought series from spruce-dominated Central Asia. Common dry periods (1710s, 1770–1780s, 1800s, 1910–1940s, and 1970–1980s) and wet periods (1720–1730s, 1790s, 1850s, 1890s, 1950–1960s, and 1990–2000s) were found in the two regions (Figure 7).
Spatial climate correlation analyses revealed that the actual (Figure 8a) and reconstructed (Figure 8b) scPDSI series correlate significantly with June–July gridded scPDSI and reveal similar spatial correlation fields, albeit the signal strength of the latter is lower. Significant positive correlations were observed in the Fergana Basin. The significant positive correlations of PC1 and June–July gridded scPDSI are also seen from the Fergana Basin and the neighboring areas (Figure 8c), suggesting a similar large-scale drought influence on Western Central Asia.
During the period from 1901 to 2015, significant positive correlations (p < 0.05), for the reconstructed scPDSI series of the Kuramin Range with gridded SSTs over the tropical oceans, were found after removing the linear trends of the SST data (Figure 8d). The multi-taper method (MTM) of spectral analysis indicated that some centennial (128 years), decadal (24.3 and 11.4 years), and interannual (8.0, 3.6, 2.9, and 2.0 years) periodicities were found in the reconstructed scPDSI data for the Kuramin Range (Figure 9).

4. Discussion

4.1. Climate–Growth Relationships

The correlations between the regional chronology and the climate factors reveal that the radial growth of the Zeravshan juniper in the low elevation area of Kuramin Range was mainly limited by the water availability. This linkage resembles other findings in the dryland of the inner Asia and suggests the influence of moisture conditions on the juniper growth there [35,37,46,47,48]. As shown in some studies [22,49], the combination of low precipitation and high temperatures in the previous growing season results in less accumulation of photosynthetic matter for the next year. Additionally, the climatic conditions in the current year have impacts on the earlywood width, which in turn, mostly determines the total tree-ring width. The observational study about the growth of juniper trees in the Qilian Mountains reveals that the radial growth in June accounts for over 50% of the total tree-ring width [50]. As our tree-ring cores were sampled at the low elevation area, with June–September precipitation of only 12.7 mm (from the Khujand station), the radial growth of juniper trees is mostly dependent on soil moisture recharged from rainfall and thus responds to scPDSI and rainfall variation well. The precipitation in June to September accounts for 7.7% of the total annual precipitation, while June–July are the hottest months. The rise in May–June temperatures promotes evaporation and promotes the already existing drought stress [51,52]. As shown in the research [37], junipers growing at lower elevations in western Central Asia are sensitive to summer drought, which has increased in intensity during the studied period. Thus, it is no surprise that the radial growth of the Zeravshan juniper in the low elevation area of the Kuramin Range responds to summer drought variation in summer very well.

4.2. Comparing Reconstructed Drought in Central Asia

Some differences, existing between the drought records (i.e., in the 1700s, 1740–1760s, 1810–1840s, 1860–1880s, and 1900s), may reflect local influences in local geography (such as that the spruce-dominated Central Asia is wetter) or the difference in tree species (juniper and spruce). Despite this, a high correlation coefficient revealed that drought stress is the major limiting factor on the tree growth of Central Asia, and covers the whole region. Chen et al (2015) [34] also found significant correlations (p < 0.05) between the drought series of spruce-dominated Central Asia and gridded SSTs over the tropical ocean, very similar to what was found for the Zeravshan juniper in this study, with a strong response to SSTs. Similar patterns suggest that the drought variations of juniper-dominated and spruce-dominated Central Asia may be linked with these tropical domains. In particular, the juniper-dominated and spruce-dominated Central Asia both exhibited a wetting trend during 1970–2010s, implying a consistent moisture increase in Central Asia, which is of great significance for alleviating the serious shortage of freshwater resources.
In order to further reveal the characteristics of the large-scale extreme drought events in Central Asia, we further extracted the first principal component of PC1s of juniper-dominated and spruce-dominated Central Asia, which accounted for 74.8% of the total variance during the period from 1901 to 2005. The driest year (1917) in the Kuramin Range was also found in other regions of Central Asia [14,32,34,36]. Based on the PC1s of the juniper-dominated and spruce-dominated Central Asia, large-scale severe drought events in the periods 1917–1918, 1944–1945, and 1974–1976 were found in Central Asia during the 20th century. Figure 10 showed that scPDSI anomalies during the periods 1917–1918, 1944–1945, and 1974–1976 are noticeably negative over Central Asia and the Indian subcontinent was anomalously wet. Based on the above analyses, we affirm that the juniper and spruce forests in Central Asia were mainly limited by strong large-scale drought stress.

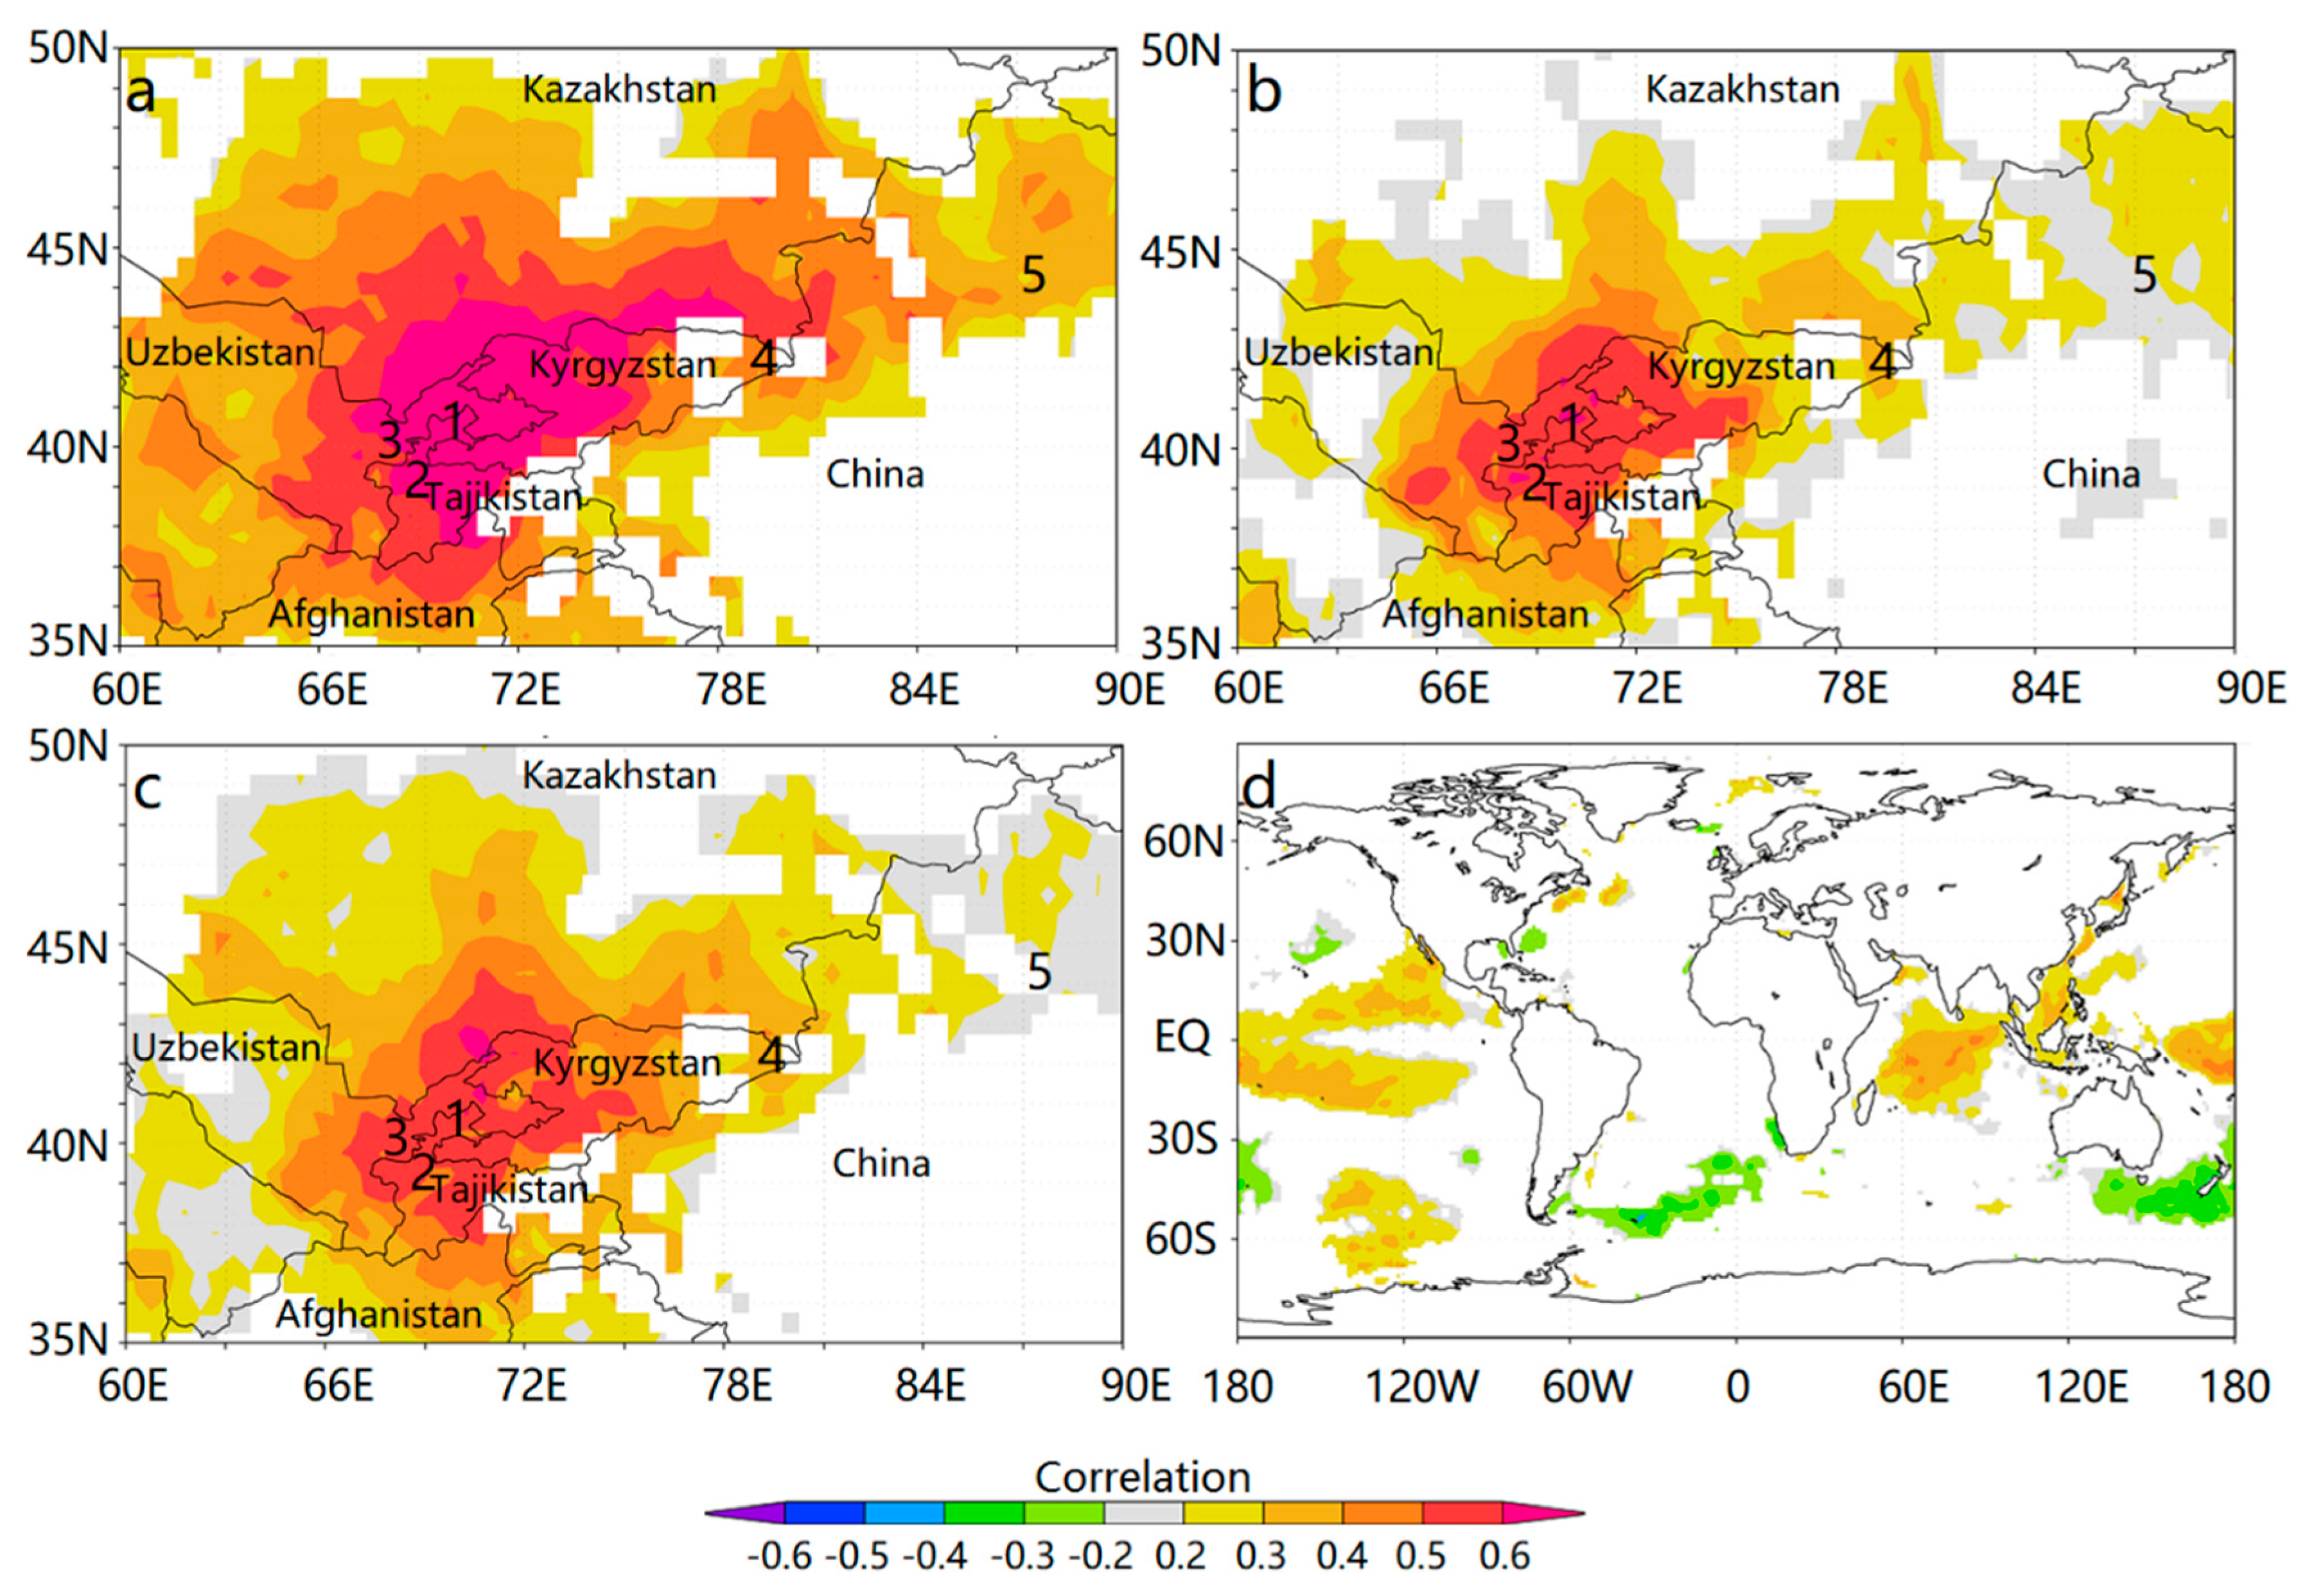
4.3. Possible Climate Drivers

As previously mentioned, the occurrence of drought extremes in Central Asia may be connected with the drought variations in the Indian subcontinent. The wet-year composite is characterized by strengthened southerlies and westerlies entering into Central Asia and is associated with a negative center over Central Asia and some positive height-anomaly centers in the Near East and Indian ocean (Figure 11a,b). Positive SST anomalies were found in the tropical Indian and western Pacific Ocean during the wettest years (Figure 11f). Relatively abundant moisture is brought across the Arabian Peninsula and the Iranian Plateau by the strong westerly jet and travels further northward, causing increased moisture over the southern part of Central Asia. This finding resembles previous research, which has indicated drought variations over southwestern and Central Asia are strongly linked with the subtropical westerly jet and SSTs in the tropical Indian oceans [53,54]. The composite of 500 hPa geopotential height during the driest years is the reverse of the wettest year composite in that the anomaly over Central Asia is relatively high (Figure 11d). This relatively high anomaly, combined with a relatively low one over the Near East and Indian Ocean, shows the Somali jet abnormally southward and that there is perhaps an enhanced dry jet across Central Asia (Figure 11c), causing increased moisture over the Indian subcontinent. These relationships essentially reflect the influences of the Eurasian winter snow cover, and its associated subsequent summer drought conditions of the Asian hinterland, on the intensity of South Asian summer monsoon [55]. Some research has revealed that negative SST anomalies over the tropical Indian Ocean tend to associate with weak southwesterly winds and lead to increased droughts in Central Asia [53,56]. The pattern during the driest years supports such a connection. As seen above, moisture conditions in Central Asia are linked with SSTs in the tropical oceans and large-scale atmosphere circulations.
The 8.0, 3.6, 2.9, and 2.0 year cycles were linked with the variations of the El Niño Southern Oscillation (ENSO) index [57] and the cross-equatorial low-level jet of the western Indian Ocean [58] (Figure 12a,b). Some studies show that the atmosphere circulations between Central and Southern Asia is affected by the ENSO-induced anomalies in southwesterly moisture flux that originates from tropical Africa and the Arabian Sea [54,59]. During warm ENSO events, an anomalously strong southwesterly moisture flux was generated along the northwestern flank of the high-pressure anomaly over the Indian and western Pacific Oceans, causing increased rainfall over central Asia, and vice versa [59,60]. Consistently, the above connection between ENSO and drought variation over Central and southwest Asia was corroborated by the results of our synoptic climatology analysis. The 24.3 and 11.4 year periodicity is likely related to the variations of large-scale modes of solar activity [61,62]. Comparison of the scPDSI reconstruction and the sunspot relative number series (http://www.sidc.be/silso/DATA/yearssn.dat) also reveals that there exists a significant relationship in the 11 year band from 1700 to 2000 (Figure 12c). The influence of solar cycles on Central Asian drought variations has also been indicated by dendroclimatic research [63]. These findings suggest that the solar activity has played a role in driving drought variability over Central Asia in the last three centuries. The sun is considered as the most important driving force of the earth climate system [64] and many studies have revealed good correlation changes between solar activity and the global surface temperature [65,66]. The drought cycles may be linked with temperature variation, which is controlled by the long-term solar activity in some manner, directly or indirectly. Evaporation increases with the rise in temperatures, which accelerates the already existing water stress (Figure 4). Thus, the solar control is best described as a modulation of terrestrial drought-inducing mechanisms [67] and has left fingerprints of solar activity in tree rings from Central Asia. However, large-scale climate modes on the regional drought of the Central Asia are more complicated than expected and a number of unknown physical processes at various timescales await further investigation.

5. Conclusions

In this study, based on tree-ring width series of Zeravshan junipers, we developed a new June–July scPDSI reconstruction from the Kuramin Range in northern Tajikistan, which indicated drought variations at different time scales over the past 366 years. The drought reconstruction captures the recent wetting trend of juniper-dominated Central Asia (western Central Asia) well, and represents drought variations over a large area. The dry/wet periods identified in the drought reconstruction are in good agreement with drought series from spruce-dominated Central Asia. Moreover, the analysis of links between the climate variations and our scPDSI reconstruction reveals that there are some linkages of extremes in this scPDSI reconstruction, with anomalous large-scale atmosphere circulations in the Indian Ocean Rim. In Central Asia, the Zeravshan juniper can live from about 500 to 1000 years. Thus, more efforts should be paid to extend the dendroclimatic reconstructions by collecting the cores from the old trees and developing spatial drought reconstructions to reveal the spatiotemporal drought variations of Central Asia.

Author Contributions

Conceived and designed the experiments: F.C., T.Z., and Z.V.K. Performed the experiments: F.C., T.Z., S.Y., A.A., and A.K. Analyzed the data: F.C., R.Z., and T.Z. Contributed reagents/materials/analysis tools: F.C., T.Z., A.S., and H.W.L. Contributed to the writing of the manuscript: F.C., A.S., and H.W.L.

Funding

This work was supported by The Basic Research Operating Expenses of the Central-level Non-profit Research Institutes (IDM2017002), NSFC Project (U1803341) and National high-level talents special support plan.

Acknowledgments

We thank the reviewers very much whose comments greatly benefitted this manuscript.

Conflicts of Interest

The authors declare that the research was conducted in the absence of any commercial or financial relationships that could be construed as a potential conflict of interest.

References

  1. Easterling, D.R.; Evans, J.; Groisman, P.Y.; Karl, T.; Kunkel, K.E.; Ambenje, P. Observed variability and trends in extreme climate events: a brief review. Bull. Amer. Meteorol. Soc. 2000, 81, 417–425. [Google Scholar] [CrossRef]
  2. Dai, A. Drought under global warming: A review. Wiley Interdiscip. Rev. Clim. Chang. 2011, 2, 45–65. [Google Scholar] [CrossRef]
  3. Schrier, G.; Barichivich, J.; Briffa, K.; Jones, P. A scPDSI-based global data set of dry and wet spells for 1901–2009. J. Geophy. Res. Atmos. 2013, 118, 4025–4048. [Google Scholar] [CrossRef]
  4. Huang, J.; Yu, H.; Guan, X.; Wang, G.; Guo, R. Accelerated dryland expansion under climate change. Nature Clim. Chang. 2015, 6, 166–171. [Google Scholar] [CrossRef]
  5. Huang, W.; Feng, S.; Liu, C.; Chen, J.; Chen, J.H.; Chen, F.H. Changes of climate regimes during the last millennium and the twenty-first century simulated by the Community Earth System Model. Quat. Sci. Rev. 2018, 180, 42–56. [Google Scholar] [CrossRef]
  6. Ososkova, T.; Gorelkin, N.; Chub, V. Water resources of central Asia and adaptation measures for climate change. Environ. Monit. Assess. 2000, 61, 161–166. [Google Scholar] [CrossRef]
  7. Siegfried, T.; Bernauer, T.; Guiennet, R.; Sellars, S.; Robertson, A.W.; Mankin, J.; Bauer-Gottwein, P.; Yakovlev, A. Will climate change exacerbate water stress in Central Asia? Clim. Chang. 2012, 112, 881–899. [Google Scholar] [CrossRef]
  8. Yao, J.; Chen, Y. Trend analysis of temperature and precipitation in the Syr Darya Basin in Central Asia. Theor. Appl. Climatol. 2015, 120, 521–531. [Google Scholar] [CrossRef]
  9. Micklin, P.P. Desiccation of the Aral Sea: a water management disaster in the Soviet Union. Science 1988, 241, 1170–1176. [Google Scholar] [CrossRef]
  10. Lioubimtseva, E.; Cole, R. Uncertainties of climate change in arid environments of Central Asia. Rev. Fish. Sci. 2006, 14, 29–49. [Google Scholar] [CrossRef]
  11. Reyer, C.P.; Otto, I.M.; Adams, S.; Albrecht, T.; Baarsch, F.; Cartsburg, M.; Coumou, D.; Eden, A.; Ludi, E.; Marcus, R. Climate change impacts in Central Asia and their implications for development. Reg. Environ. Chang. 2015, 17, 1639–1650. [Google Scholar] [CrossRef]
  12. Jones, P.; Briffa, K.; Osborn, T.; Lough, J.; van Ommen, T.; Vinther, B.; Luterbacher, J.; Wahl, E.; Zwiers, F.; Mann, M. High-resolution palaeoclimatology of the last millennium: a review of current status and future prospects. Holocene 2009, 19, 3–49. [Google Scholar] [CrossRef]
  13. Esper, J.; Treydte, K.; Gärtner, H.; Neuwirth, B. A tree ring reconstruction of climatic extreme years since 1427 AD for Western Central Asia. Palaeobotanist 2001, 50, 141–152. [Google Scholar]
  14. Esper, J.; Schweingruber, F.H.; Winiger, M. 1300 years of climatic history for Western Central Asia inferred from tree-rings. Holocene 2002, 12, 267–277. [Google Scholar] [CrossRef] [Green Version]
  15. Esper, J.; Shiyatov, S.; Mazepa, V.; Wilson, R.; Graybill, D.; Funkhouser, G. Temperature-sensitive Tien Shan tree ring chronologies show multi-centennial growth trends. Clim. Dyn. 2003, 21, 699–706. [Google Scholar] [Green Version]
  16. Yuan, Y.; Jin, L.; Shao, X.; He, Q.; Li, Z.; Li, J. Variations of the spring precipitation day numbers reconstructed from tree rings in the Urumqi River drainage, Tianshan Mts. over the last 370 years. Chin. Sci. Bull. 2003, 48, 1507–1510. [Google Scholar] [CrossRef]
  17. Chen, F.; Yuan, Y.; Wei, W.; Yu, S.; Li, Y.; Zhang, R.; Zhang, T.; Shang, H. Chronology development and climate response analysis of Schrenk spruce (Picea Schrenkiana) tree-ring parameters in the Urumqi river basin, China. Geochronometria 2010, 36, 17–22. [Google Scholar] [CrossRef]
  18. Chen, F.; Yuan, Y.J.; Wei, W.S.; Zhang, T.W.; Shang, H.M.; Zhang, R. Precipitation reconstruction for the southern Altay Mountains (China) from tree rings of Siberian spruce, reveals recent wetting trend. Dendrochronologia 2014, 32, 266–272. [Google Scholar] [CrossRef]
  19. Zhang, T.W.; Yuan, Y.J.; Liu, Y.; Wei, W.S.; Yu, S.L.; Chen, F.; Fan, Z.A.; Shang, H.M.; Zhang, R.B.; Qin, L. A tree-ring based precipitation reconstruction for the Baluntai region on the southern slope of the central Tien Shan Mountains, China, since AD 1464. Quat. Int. 2013, 283, 55–62. [Google Scholar] [CrossRef]
  20. Solomina, O.; Maximova, O.; Cook, E. Picea schrenkiana ring width and density at the upper and lower tree limits in the Tien Shan mts Kyrgyz republic as a source of paleoclimatic information. Geogr. Environ. Sustain. 2014, 1, 66–79. [Google Scholar] [CrossRef]
  21. Opała-Owczarek, M.; Niedźwiedź, T. Last 1100 yr of precipitation variability in western central Asia as revealed by tree-ring data from the Pamir-Alay. Quat. Res. 2019, 91, 81–95. [Google Scholar] [CrossRef]
  22. Fritts, H.C. Tree-Rings and Climate; Academic Press: London, UK, 1976. [Google Scholar]
  23. Tian, Q.; Gou, X.; Zhang, Y.; Peng, J.; Wang, J.; Chen, T. Tree-ring based drought reconstruction (AD 1855–2001) for the Qilian Mountains, northwestern China. Tree-ring Res. 2007, 63, 27–36. [Google Scholar] [CrossRef]
  24. Vicente-Serrano, S.M.; Beguería, S.; López-Moreno, J.I. A multiscalar drought index sensitive to global warming: the standardized precipitation evapotranspiration index. J. Clim. 2010, 23, 1696–1718. [Google Scholar] [CrossRef]
  25. Palmer, W.C. Meteorological Drought; US Department of Commerce, Weather Bureau: Washington, DC, USA, 1965.
  26. Cook, E.R.; Meko, D.M.; Stahle, D.W.; Cleaveland, M.K. Drought reconstructions for the continental United States. J. Clim. 1999, 12, 1145–1162. [Google Scholar] [CrossRef]
  27. Cook, E.R.; Seager, R.; Kushnir, Y.; Briffa, K.R.; Büntgen, U.; Frank, D.; Krusic, P.J.; Tegel, W.; van der Schrier, G.; Andreu-Hayles, L.; et al. Old World megadroughts and pluvials during the Common Era. Sci. Adv. 2015, 1, e1500561. [Google Scholar] [CrossRef] [PubMed]
  28. Davi, N.; Jacoby, G.; Fang, K.; Li, J.; D’Arrigo, R.; Baatarbileg, N.; Robinson, D. Reconstructed drought across Mongolia based on a large-scale tree-ring network: 1520–1993. J. Geophys. Res. 2010, 115, D22103. [Google Scholar] [CrossRef]
  29. Fang, K.; Davi, N.; Gou, X.; Chen, F.; Cook, E.; Li, J.; D’Arrigo, R. Spatial drought reconstructions for central High Asia based on tree rings. Clim. Dyn. 2010, 35, 941–951. [Google Scholar] [CrossRef]
  30. Seftigen, K.; Björklund, J.; Cook, E.R.; Linderholm, H.W. A tree-ring field reconstruction of Fennoscandian summer hydroclimate variability for the last millennium. Clim. Dyn. 2015, 44, 3141–3154. [Google Scholar] [CrossRef]
  31. Touchan, R.; Anchukaitis, K.J.; Meko, D.M.; Sabir, M.; Attalah, S.; Aloui, A. Spatiotemporal drought variability in northwestern Africa over the last nine centuries. Clim. Dyn. 2011, 37, 237–252. [Google Scholar] [CrossRef]
  32. Chen, F.; Yuan, Y.J.; Chen, F.H.; Wei, W.S.; Yu, S.L.; Chen, X.J.; Fan, Z.A.; Zhang, R.B.; Zhang, T.W.; Shang, H.M. A 426-year drought history for Western Tian Shan, Central Asia, inferred from tree rings and linkages to the North Atlantic and Indo-Pacific Oceans. Holocene 2013, 23, 1095–1104. [Google Scholar] [CrossRef]
  33. Chen, F.; Yuan, Y.J.; Yu, S.L.; Zhang, T.W.; Shang, H.M.; Zhang, R.B.; Qin, L.; Fan, Z.A. A 225-year long drought reconstruction for east Xinjiang based on Siberia larch (Larix sibirica) tree-ring widths: Reveals the recent dry trend of the eastern end of Tien Shan. Quat. Int. 2015, 358, 42–47. [Google Scholar] [CrossRef]
  34. Chen, F.; Yuan, Y.J.; Wei, W.S.; Yu, S.L.; Zhang, T.W.; Shang, H.M.; Zhang, R.B.; Qin, L.; Fan, Z.A. Tree-ring recorded hydroclimatic change in Tienshan mountains during the past 500 years. Quat. Int. 2015, 358, 35–41. [Google Scholar] [CrossRef]
  35. Chen, F.; Yu, S.L.; He, Q.; Zhang, R.B.; Kobuliev, Z.V.; Mamadjonov, Y.M. Comparison of drought signals in tree-ring width records of juniper trees from Central and West Asia during the last four centuries. Arab. J. Geosci. 2016, 9, 255. [Google Scholar] [CrossRef]
  36. Seim, A.; Tulyaganov, T.; Omurova, G.; Nikolyai, L.; Botman, E.; Linderholm, H.W. Dendroclimatological potential of three juniper species from the Turkestan range, northwestern Pamir-Alay Mountains, Uzbekistan. Trees 2016, 30, 733–748. [Google Scholar] [CrossRef]
  37. Seim, A.; Omurova, G.; Azisov, E.; Musuraliev, K.; Aliev, K.; Tulyaganov, T.; Nikolyai, L.; Botman, E.; Helle, G.; Dorado Liñan, I.; et al. Climate change increases drought sensitivity of mountain juniper trees in Central Asia. PloS ONE 2016, 11, e0153888. [Google Scholar] [CrossRef]
  38. Holmes, R.L. Computer-assisted quality control in tree-ring dating and measurement. Tree-Ring Bull. 1983, 43, 69–95. [Google Scholar]
  39. Cook, E.R.; Kairiukstis, L.A. Methods of Dendrochronology: Applications in the Environmental Sciences; Kluwer Academic Publishers: Boston, MA, USA, 1990. [Google Scholar]
  40. Wigley, T.; Briffa, K.R.; Jones, P.D. On the average value of correlated time series, with applications in dendroclimatology and hydrometeorology. J. Appl. Meteorol. Climatol. 1984, 23, 201–213. [Google Scholar] [CrossRef]
  41. Jolliffe, I. Principal component analysis; Springer: Berlin/Heidelberg, Germany, 2002. [Google Scholar]
  42. Torrence, C.; Compo, G.P. A practical guide to wavelet analysis. Bull. Amer. Meteorol. Soc. 1998, 79, 61–78. [Google Scholar] [CrossRef]
  43. Mann, M.E.; Lees, J.M. Robust estimation of background noise and signal detection in climatic time series. Clim. Chang. 1996, 33, 409–445. [Google Scholar] [CrossRef]
  44. Rayner, N.; Parker, D.E.; Horton, E.; Folland, C.; Alexander, L.; Rowell, D.; Kent, E.; Kaplan, A. Global analyses of sea surface temperature, sea ice, and night marine air temperature since the late nineteenth century. J. Geophy. Res. Atmos. 2003, 108, D14. [Google Scholar] [CrossRef]
  45. Kalnay, E.; Kanamitsu, M.; Kistler, R.; Collins, W.; Deaven, D.; Gandin, L.; Iredell, M.; Saha, S.; White, G.; Woollen, J. The NCEP/NCAR 40-year reanalysis project. Bull. Amer. Meteorol. Soc. 1996, 77, 437–471. [Google Scholar] [CrossRef]
  46. Wang, X.; Zhang, Q.B.; Ma, K.; Xiao, S. A tree-ring record of 500-year dry-wet changes in northern Tibet. China. Holocene 2008, 18, 579–588. [Google Scholar] [CrossRef]
  47. Gou, X.; Gao, L.; Deng, Y.; Chen, F.; Yang, M.; Still, C. An 850-year tree-ring-based reconstruction of drought history in the western Qilian Mountains of northwestern China. Int. J. Climatol. 2015, 35, 3308–3319. [Google Scholar] [CrossRef]
  48. Zhang, Q.-B.; Evans, M.N.; Lyu, L. Moisture dipole over the Tibetan Plateau during the past five and a half centuries. Nat. Commun. 2015, 6, 8062. [Google Scholar] [CrossRef]
  49. Anfodillo, T.; Carrer, M.; Rento, S.; Urbinati, C. Long and short term growth dynamics of Picea abies (L.) Karst, Larix decidua Mill., Pinus cembra (L.) and climatic factors: First results of an integrated study at the timberline in eastern Italian Alps. Ecology 1998, 29, 253–259. [Google Scholar]
  50. Gou, X.; Zhou, F.; Zhang, Y.; Chen, Q.; Zhang, J. Forward modeling analysis of regional scale tree-ring patterns around the northeastern tibetan plateau, northwest China. Biogeosci. Discuss. 2013, 10, 9969–9988. [Google Scholar] [CrossRef]
  51. Adams, H.D.; Guardiolaclaramonte, M.; Barrongafford, G.A.; Villegas, J.C.; Breshears, D.D.; Zou, C.B.; Troch, P.A.; Huxman, T.E. Temperature sensitivity of drought-induced tree mortality portends increased regional die-off under global-change-type drought. Proc. Natl. Acad. Sci. USA 2009, 106, 7063–7066. [Google Scholar] [CrossRef] [PubMed] [Green Version]
  52. Williams, A.P.; Allen, C.D.; Macalady, A.K.; Griffin, D.; Woodhouse, C.A.; Meko, D.M.; Swetnam, T.W.; Rauscher, S.A.; Seager, R.; Grissino-Mayer, H.D. Temperature as a potent driver of regional forest drought stress and tree mortality. Nature Clim. Chang. 2013, 3, 292–297. [Google Scholar] [CrossRef]
  53. Li, J.; Cook, E.; Chen, F.; Gou, X.; D’Arrigo, R.; Yuan, Y. An extreme drought event in the central Tien Shan area in the year 1945. J. Arid Environ. 2010, 74, 1225–1231. [Google Scholar] [CrossRef]
  54. Zhao, Y.; Wang, M.; Huang, A.; Li, H.; Huo, W.; Yang, Q. Relationships between the West Asian subtropical westerly jet and summer precipitation in northern Xinjiang. Theor. Appl. Climatol. 2014, 116, 403–411. [Google Scholar] [CrossRef]
  55. Zhang, T.; Wang, T.; Krinner, G.; Wang, X.; Gasser, T.; Peng, S.; Piao, S.L.; Yao, T. The weakening relationship between Eurasian spring snow cover and Indian summer monsoon rainfall. Sci. Adv. 2019, 5, eaau8932. [Google Scholar] [CrossRef] [PubMed] [Green Version]
  56. Vecchi, G.A.; Xie, S.P.; Fischer, A. Ocean-atmosphere covariability in the western Arabian Sea. J. Clim. 2004, 17, 1213–1224. [Google Scholar] [CrossRef]
  57. Li, J.; Xie, S.P.; Cook, E.R.; Morales, M.S.; Christie, D.A.; Johnson, N.C.; Chen, F.H.; D’Arrigo, R.; Fowler, A.M.; Gou, X. El Niño modulations over the past seven centuries. Nature Clim. Chang. 2013, 3, 822–826. [Google Scholar] [CrossRef]
  58. Gong, D.Y.; Luterbacher, J. Variability of the low-level cross-equatorial jet of the western Indian Ocean since 1660 as derived from coral proxies. Geophys. Res. Lett. 2008, 35, L01705. [Google Scholar] [CrossRef]
  59. Mariotti, A. How ENSO impacts precipitation in southwest central Asia. Geophy. Res. Lett. 2007, 34, 16. [Google Scholar] [CrossRef]
  60. Barlow, M.; Cullen, H.; Lyon, B. Drought in central and southwest Asia: La Niña, the Warm Pool, and Indian Ocean precipitation. J. Clim. 2002, 15, 697–700. [Google Scholar] [CrossRef]
  61. Hale, G.E. The law of sun-spot polarity. Proc. Natl. Acad. Sci. USA 1924, 10, 53. [Google Scholar] [CrossRef]
  62. Hodell, D.A.; Brenner, M.; Curtis, J.H.; Guilderson, T. Solar forcing of drought frequency in the Maya lowlands. Science 2001, 292, 1367–1370. [Google Scholar] [CrossRef]
  63. Li, J.; Gou, X.; Cook, E.R.; Chen, F. Tree-ring based drought reconstruction for the central Tien Shan area in northwest China. Geophy. Res. Lett. 2006, 33, L07715. [Google Scholar] [CrossRef]
  64. Beer, J.; Mende, W.; Stellmacher, R. The role of the sun in climate forcing. Quat. Sci. Rev. 2000, 19, 403–415. [Google Scholar] [CrossRef]
  65. Reid, G.C. Influence of solar variability on global sea surface temperatures. Nature 1987, 329, 142–143. [Google Scholar] [CrossRef]
  66. Friis-Christensen, E.; Lassen, K. Length of the solar cycle: an indicator of solar activity closely associated with climate. Science 1991, 254, 698–700. [Google Scholar] [CrossRef] [PubMed]
  67. Mitchell, J.M.; Stockton, C.W.; Meko, D.M. Evidence of a 22-year rhythm of drought in the western United States related to the Hale solar cycle since the 17th century. In Solar-Terrestrial Influences on Weather and Climate; Springer: Berlin/Heidelberg, Germany, 1979; pp. 125–143. [Google Scholar]
Figure 1. Map of the climate station (Khujand) and the sampling sites in the Kuramin Range, northern Tajikistan.
Forests 10 00505 g001
Figure 2. Climate diagrams for the climate station of Khujand in northern Tajikistan.
Forests 10 00505 g002
Figure 3. Juniper trees at the two sites: (a) Obiasht and (b) Adrasman in the Kuramin Range, northern Tajikistan.
Forests 10 00505 g003
Figure 4. Response plots for the tree-ring width chronologies with (a) total monthly precipitation (1927–1990), (b) mean monthly temperature (1927–1990), and (c) monthly scPDSI (1901–2012). The coefficients were calculated from the previous July to the current September. Horizontal dashed lines denote 95% significance levels.
Forests 10 00505 g004
Figure 5. Comparison between the instrumental and reconstructed mean June–July scPDSI for the Kuramin Range during the period from 1901 to 2012.
Forests 10 00505 g005
Figure 6. (a) Reconstructed (thin line) and 31 year low-pass filter (thick line) values of June–July scPDSI for the Kuramin Range from the regional chronology of the Kuramin Range with (b) sample size, EPS (expressed population signal), and Rbar (average correlation between series). The central horizontal line shows the mean of the estimated values, the inner horizontal lines (dotted lines) show the border of one standard deviation, and the outer horizontal lines show two standard deviations. Rbar and EPS used moving 50 year windows, lagged 25 years.
Forests 10 00505 g006
Figure 7. Comparison of between the drought series of western (a) juniper-dominated and spruce-dominated Central Asia ((b), [34]). All series were adjusted for their long-term means over the period from 1700 to 2010 and smoothed with a 20 year low-pass filter to emphasize long-term fluctuations. The arrows indicate the upward/downward trends.
Forests 10 00505 g007
Figure 8. Spatial correlation fields of instrumental June–July scPDSI (a), reconstructed June–July scPDSI (b), and PC1 (c) with regional gridded June–July scPDSI for the period from 1901 to 2012. The numbers 1, 2, 3, 4, and 5 denote the tree ring sites of northern Tajikistan (this study), western Tajikistan [35], Uzbekistan [36], Kyrgyzstan [32], and China [34]. (d) Spatial Pearson correlation plots for the reconstructed June–July scPDSI for the Kuramin Range with February–July averaged HadISST1 SST after removing the linear trends of SST data during the period from 1901 to 2015.
Forests 10 00505 g008
Figure 9. MTM spectral density of the drought reconstruction. The dash-dot and dotted lines indicate the 95% and 99% significance level, respectively.
Forests 10 00505 g009
Figure 10. PDSI anomalies during the dry period (a) 1917–1918, (b) 1944–1945, and (c) 1974–1976 (The study area indicated by a filled triangle).
Forests 10 00505 g010
Figure 11. Composite anomaly maps of the SSTs, 500 hPa vector wind and geopotential height (from May to July) for the 10 wettest (a,b,e) and 10 driest (c,d,f) years for the scPDSI reconstruction during the period 1948–2010. The five-pointed star represent the study area.
Forests 10 00505 g011
Figure 12. A cross wavelet transform of the reconstructed scPDSI of the Kuramin Range with (a) the ENSO index [57], (b) the the low-level cross-equatorial jet of the western Indian Ocean [58], and (c) sunspot number (http://www.sidc.be/silso/DATA/yearssn.dat). The 5% significance level against red noise is shown as a thick contour. The relative phase relationship is shown as arrows (with in-phase pointing to the right, anti-phase pointing to the left).
Forests 10 00505 g012
Table 1. Information about the sampling sites in the Kuramin range.
Site CodeLatitude (N)Longitude (E) Tree NumberElevation (m)Aspect SlopeSpecies
Obiasht40°52’70°27’241663E30°Zeravshan juniper (Juniperus seravschanica)
Adrasman40°42’70°04’272035SE20°Zeravshan juniper (Juniperus seravschanica)
Table 2. Correlations between chronologies and mean tree to tree correlation (RBAR) for the three chronologies.
CorrelationChronology CodeObiashtAdrasmanRegional Chronology
ChronologyObiasht1.00
correlationsAdrasman0.521.00
Regional Chronology0.630.951.00
Mean tree to tree correlation0.560.490.41
Table 3. Calibration and verification statistics for mean June–July scPDSI reconstructions. r: correlation coefficient, RE: reduction of error, CE: coefficient of efficiency, ST: prediction sign test, FST: the first-order sign test prediction sign test ‘+’: pair of actual and predicted temperatures showed same sign of departures from their respective mean values; ‘−’: different sign of departures; * Significant at the 1% level.
StatisticsCalibration (1957–2012)Verification (1901–1956)Calibration (1901–1956)Verification (1957–2012)Full Calibration (1901–2012)
r0.7050.6370.6370.7050.637
r20.4970.4060.4060.4970.406
RE 0.351 0.360
CE 0.282 0.329
Sign test 41+/15* 41+/15*
First-order sign test 45+/10* 46+/9*

