Article

Stakeholders’ Perceptions of Geographical Criteria for Loblolly Pine Management for Bioenergy Production in Virginia

1
Clean Energy and Sustainability Analytics Center, College of Science and Mathematics, Montclair State University, 1 Normal Avenue, Montclair, NJ 07043, USA
2
Department of Forest Resources and Environmental Conservation, College of Natural Resources and Environment, Virginia Polytechnic Institute and State University, 800 Washington Street. SW, Blacksburg, VA 24061, USA
*
Authors to whom correspondence should be addressed.
Forests 2019, 10(9), 801; https://doi.org/10.3390/f10090801
Submission received: 6 August 2019 / Revised: 6 September 2019 / Accepted: 9 September 2019 / Published: 12 September 2019

Abstract

:
This study analyzed the perceptions of four stakeholder groups (forest landowners, private forest consultants, forest management researchers or educators, and federal or state agency foresters), regarding their management practices and preferred geographic growing conditions of loblolly pine in Virginia by combining AHP (analytical hierarchy process) and regression modeling. By ranking the importance of different geographical conditions for managing loblolly pine, we aimed to identify ways to support loblolly growth as a potential feedstock for biofuel generation. We achieved this through collecting survey responses from 43 stakeholders during the 2019 Virginia Forestry Summit. The results showed that the landowner, researcher/educator, and federal/state agency stakeholder groups all indicated that proximity to a mill was the most important criteria, whereas the consultant stakeholder group indicated that proximity to a road was the most important criteria. All the stakeholder groups indicated that distance from protected land was the least important criteria, followed by proximity to a water body and flat land. The regression model revealed that acres of land managed and loblolly rotation age were correlated to the weight given to the distance to a mill criterion, where increased acreage and increased rotation age were associated with an increased prioritization of proximity to a mill. Distance from protected land, the lowest-ranking criteria, was shown to have an association with the level of experience with loblolly, where more experience was associated with a lower prioritization of proximity from protected land. A contingency analysis of the self-identified level of experience with loblolly in each stakeholder group revealed that federal/state agency foresters had the most experience, followed by consultants, landowners, and researchers/educators. The research supports the importance of understanding the variation of perceptions between and within stakeholder groups in order to develop the necessary infrastructural and policy support for the sustainable development of bioenergy.

1. Introduction

With growing concern for energy security and associated environmental benefits, alternative fuels are growing in popularity in the United States and abroad. One such fuel is bioenergy, which has been recognized a sustainable source of energy, and has become a staple in energy plans around the world. Biofuels using forested biomass has considerable potential as an energy source due to its sustainability and relative efficiency [1,2,3,4], but it is not without its issues; uncertainties associated with land-use change, inadequate volume for perennial crop cultivation for biomass feedstock, and a relative uneasiness among investors for producing feedstocks have combined to significantly slow the growth of bioenergy production in the United States [5,6,7]. The feedstock requirements present perhaps the largest challenge; a 2005 US Department of Energy (DoE) and Department of Agriculture (USDA) joint estimate suggested a requirement of around 36,252 Mg of domestic perennial biomass for domestic bioethanol needs, of which little over 10,000 Mg has been produced as of 2016 [8,9]. Thus, there is a growing need for new biofuel feedstocks, especially those grown domestically.
Woody bioenergy feedstock has a number of environmental and economic benefits, including reduced risk of fire, reduced risk of disease outbreak, reduced greenhouse emissions, and a potential to increase wood revenue for landowners, all while being safely outside the food versus fuel debate that plagues many traditional biomass sources such as corn [4,10,11,12]. Loblolly pine (Pinus taeda L.) is a potential woody bioenergy source, and is one of the most abundant and productive trees in the southern United States, largely due to its adaptability to a variety of environmental conditions [4].
Virginia, in the American South, is a native biome for loblolly pine; Virginia has over 6.4 million hectares of forestland, of which around 1.17 hectares are loblolly pine, with much of its forest cover being under the stewardship of private landowners [4,13]. Due to a high density and availability of forested land, Virginia is also one of the top 10 states for biomass supply, making the state a key area for potential biofuel feedstock cultivation [4,14]. Unlike many other bioenergy feedstocks, loblolly pine is already a common product in the state, and therefore, owners and potential growers are already likely acclimated with its needs, yields, and requirements [4,15]. Loblolly pine is also known for its adaptability to a variety of climatic conditions and its relatively quick growth rates; due to this, the species is becoming of increased interest as a potential source for biomass and bioenergy.
However, despite the relative ease with which loblolly pine may be adapted as a biomass energy source, there remains uncertainty surrounding the likelihood of forest landowners adopting growth for bioenergy feedstock [4]. Therefore, stakeholder opinions and perceptions surrounding bioenergy feedstock growth are crucial for improved understanding of this nascent industry. Further, stakeholder preferences in terms of growing conditions, ideal farmland, and other factors may be critical in matching landowner needs with beneficial policies, and may help to inform the future landscape of the bioenergy industry. However, currently, such preferences and perceptions are understudied, and despite Virginia’s considerable hold on the forestry industry, stakeholder opinions remain largely unknown. While best management practices for loblolly pine are well supported in the literature, the forest management practices that affect ecosystem services and are impacted by infrastructural networks are lesser known.
To this end, this study uses a forest industry stakeholder survey, utilizing both analytical hierarchy process (AHP) to understand the preferences of field experts in terms of geographic growing conditions for loblolly pine, in addition to exploring questions pertaining to recommended management practices such as final harvest year and stand density through regression analysis. This novel approach of combining AHP and regression analysis allows for an understanding of how stakeholder groups may act as a whole, and well as how individuals’ opinions may vary within those groups. Understanding these variations are essential in successful policy development, particularly in the circumstance of uncertainty of bioenergy industry development in the US. This survey targets experts including landowners, researchers and educators, state and federal employees, and consultants to cover a range of stakeholders involved in the forestry industry that hold opinions specifically for growing and managing loblolly pine. By understanding how geographic criteria are prioritized by these stakeholders through AHP, we can quantify stakeholder perception and visualize which areas may be prioritized for future bioenergy growth. These preferences can further be compared to current policies to analyze whether or not stakeholder needs are being addressed adequately. Additionally, growing and management practices between different stakeholder groups could better inform policy development to ensure best management practices specific for loblolly growth for biomass. Finally, this data may be used in future research to target areas that may be optimized for bioenergy feedstock harvesting.

2. Background

2.1. Stakeholder Perception of Bioenergy Feedstock

With considerable numbers of varying bioenergy policies, propositions, and opportunities consistently arising, there is a growing need to tailor the needs of local, regional, and national interests to evolving programs. To this end, stakeholder input has become increasingly valuable in guiding policy to reach desired outcomes. Understanding the needs and perceptions of stakeholders can allow for more effective planning for desired social, economic, and environmental outcomes and the design of more effective strategies and incentives for bioenergy stakeholders [16]. Further, identifying relevant perceptions can help fill research gaps to ameliorate educational, extension, and outreach needs [4].
Although woody biomass-based energy research is still a growing and evolving field, stakeholder perceptions have been explored earlier. Lal et al. (2016) assessed forest owner perceptions and willingness to accept allocating areas of their land for woody bioenergy using loblolly pine in Virginia; they found that a number of factors, including price, demographics, and the mode of land acquisition were significant in identifying forest owners that were willing to harvest woody bioenergy [16]. Similarly, Wolde et al. (2016) analyzed factors affecting Virginia forest owners’ willingness to allocate non-forested land to bioenergy growth, and found that price and lesser dependences on forestland for primary income were significant in determining whether a forest owner would commit to woody biomass growth [4]. Silver et al. (2015) used interviews with private forest owners to understand factors influencing the decision to harvest woody biomass for timber markets in Maine; they found that many of their interviewees were unfamiliar with bioenergy markets, and were concerned with nutrient removal, economics, and statewide harvesting levels [17].
Markowski-Lindsay et al. (2013) found that landowner preferences, attitudes, and intentions had a greater effect on the availability of woody biomass than actual physical availability [18]. Leitch et al. (2013) studied private landowners in Kentucky, and found that attitudes and subjective norms had significant effects on the intent to harvest biomass for bioenergy [19]. Further, they identified a number of perceived barriers to bioenergy from their participants, including a lack of bioenergy markets and woodland access issues [19].
Naturally, one of the most critical aspects of these perceptions is how they can inform adoption decisions by identifying factors that are valued by landowners. Hodges et al. (2019) surveyed private forest landowners in the southern US to assess perceptions on producing biomass for bioenergy in areas where a market already existed in shipping wood pellets to the European Union (EU) [20]. They found that the majority of landowners would be willing to grow timber for bioenergy, with age, gender, holding size, distance to property, and opinions of bioenergy viability all being significant factors in the decision. Technical assistance and economic benefits were among the highest desired inputs for increased biomass production, although overall improved health and the safety of the stands were also factors. Joshi and Mehmood (2011) used a similar approach in the southern US, and found that younger landowners with large amounts of land were more willing to grow for bioenergy and were strong candidates for industry growth, although their decisions were affected by other demographics and objectives [21]. Gruchy et al. (2012) surveyed Mississippi residents, and gave them a choice between a more lucrative clear-cutting option and harvesting for biomass, and found that most farmers preferred to provide biomass; education, age, perceptions of climate change and habitat management, and economics were significant factors in the decision [22]. Becker et al. (2013) used a landowner survey to assess the social availability of woody biomass in Minnesota and Wisconsin, and found that payment was significant in landowners’ decisions, but also found that a number of social factors were also significant, including social norms and landowner opinions on physical and social issues such as soil impacts and energy independence [23].

2.2. Environmental and Economic Aspects of Biomass for Bioenergy

Increasing interest in lowering the dependence on fossil fuels has led to a growing demand for renewable energy, and increased the potential market for biomass feedstock. Another key interest is bioenergy’s potential to support rural economies through job generation, increasing land productivity, and improving access to key infrastructure [3]. One of the biggest challenges with producing forest products for biomass for bioenergy is doing so in a sustainable manner. In order to ensure the sustainability of a potential woody bioenergy market, economic and environmental trade-offs must be identified within the bioenergy production system [6,7].
Forest ecosystems contribute to a number of environmental services, carbon capture, water quality, and biodiversity, in addition to their potential for providing biomass for renewable energy. The utilization of bioenergy in congruence with these ecosystem services is important both for greenhouse gas emission mitigation as well as supporting the renewable energy industry in a sustainable manner [24]. However, growing trees for bioenergy can add unintended pressures on the environment such as increased land and water usage, habitat loss, and soil nutrient degradation. The environmental and actual costs to produce bioenergy should be competitive or exceed the costs of non-renewable energy sources [6]. In order to support the renewable energy industry, geographic and infrastructural requirements must also be considered to ensure that a growing bioenergy industry can truly be sustainable [3]. These geographic and infrastructural considerations are addressed further in Section 3.1 of this paper, which allowed us to define our criteria for the AHP portion of the stakeholder surveys.

3. Methods

3.1. AHP Criteria

3.1.1. Distance to Water

Forests in the southern US frequently act as watershed areas that are able to collect, filter, and store water, which is later transported to communities for public use. Forest management can directly impact the quantity and quality of water within these watersheds, thereafter having an effect on the health of plants, wildlife, and humans [25]. A forest watershed generally increases in the volume of available water after the removal of trees and vegetation, due to the increased precipitation landing directly on soil surfaces. While this varies depending on other climatic and geologic factors, this increase can be expected to last for at least one year after harvest [26]. Water table management is critical for the productivity potential of the land as well as long-term groundwater availability, making forestland management an important and dynamic factor in developing the bioenergy industry. To negate some of these concerns, the Riparian Buffer Implementation Plan in Virginia that was initiated in 1996 was established to protect steams and shorelines by maintaining adequate riparian buffers to protect these ecosystem services [27]. Buffer establishment and maintenance does fall to landowners, although the state provides funding to those who establish buffers as required: at least 35 feet on at least one side of a stream [27]. While there are costs to the landowner associated with buffer establishment and maintenance, there are cost share and technical assistance programs to alleviate financial and utilitarian costs led by federal and state agencies such as the Natural Resource Conservation Service, Farm Service Agency, and VA Department of Conservation and Recreation, as well as non-profit conservation organizations such as the Chesapeake Bay Foundation and American Forests [27,28]. Meeting these standards for water quantity and quality can be a challenge for forest landowners, and incorporating best management practices is critical to ensure the sustainability of water resources within a growing industry for bioenergy production.

3.1.2. Distance from Protected Land

The manipulation of vegetation, soil, and water associated with forest management has a direct impact on biodiversity within a forested site. In addition to more direct impact through the harvesting of trees and removal of deadwood, increased road networks and land-use change can have a negative impact on biodiversity. Habitat management is also important to landowners, such that a lack of management could lead to issues with habitat connectivity leading to species overpopulation and the overuse of a habitat [26]. There are several ways to manage tree stands to support biodiversity including longer rotations, thinning and harvesting for structural complexity, creating a habitat through man-made structures (i.e., nest boxes), and through the use of maintaining buffer zones for habitat support [26]. There are also conservation lands managed through federal, local, and state municipalities as well as those managed privately and through non-profit organizations. Forestland adjacent to these conservation areas could cause a number of issues for both parties based on chosen land management practices. The Conserve Virginia conservation strategy has identified additional high-priority land that requires additional protection regarding concerns such as ecosystem diversity, natural habitats, potential rare species richness, cultural and historic preservation, and floodplains and landscape resilience [28]. Meeting these environmental requirements, whether self-imposed or regulated, is an important factor for multiple stakeholders to recognize when attempting to support the development of the bioenergy industry.

3.1.3. Flat Land

Biomass harvesting systems exist to fell, collect, and transport biomass to a collection center or directly to a post-harvest utilization facility (e.g., sawmill). Depending on the scale of the landholding and the mechanical capabilities of equipment, the cost of this process can differ dramatically. Capital equipment, transportation, and operational costs all influence the cost-effectiveness of harvesting systems. Additionally, more level terrain allows for the use of less expensive feller equipment; the cost-effectiveness of feller equipment in a state with a varied topography such as Virginia can call for different best management practices for harvest and transportation processes [26]. The more commonly used one-pass timber harvesting system allows for harvesting both roundwood and biomass simultaneously, and is generally considered to be more cost-efficient than the less common two-pass method [2]. For this purpose, flat land may be a desirable trait when choosing to plant loblolly for woody biomass. While loblolly is known for being geographically resilient and able to grow on a variety of terrain settings, those who deal with the capital cost of equipment and the operational procedure of harvesting may find this feature particularly important to their willingness to participate in providing biomass for bioenergy production. Moreover, those who deal in legislative support in the renewable energy sector may need to consider the feasibility and cost-efficiency of harvesting and transportation ease on a varied topographic setting.

3.1.4. Distance to Road

The collection and transportation of biomass from forested land to the post-harvest use location is a major cost and varies based on the location and harvesting system used. In the US, trucks and trailers are used almost exclusively to transport biomass; roadways are favored, as opposed to railways, for accessing multiple forest sites for biomass pickup/delivery [26]. Most products in the south are currently transported in tractor-trailers with 80,000-pound capacity, which are street legal for road networks without specified weight/height limits [2]. Having access to major road networks is an important consideration for landowners and forest products manufacturers, particularly in the context of developing a feasible bioenergy production system. Biomass that has not been pre-processed (i.e., chipping or shredding) has low bulk density, which thereafter increases the cost of transportation. The rural nature of managed forestland may mean that ideal land for growing loblolly pine is further away from major road networks, making the possibility of a profitable bioenergy industry a true challenge [1,29,30].

3.1.5. Distance to a Mill

The transportation of woody biomass to a manufacturing site accounts for 25–50% of the total delivery costs based on haul distance, fuel cost, vehicle capacity, and biomass density [26]. Further, emissions associated with the transportation of biomass can potentially negate the environmental benefits of manufacturing bioenergy as opposed to fossil fuels. Access to mills is critical for the feasibility of developing a sustainable bioenergy production system and supporting rural development [31]. Much of the land in Virginia, with preferable climatic and environmental growing conditions, lays in the Southern Piedmont and Coastal Plain regions, while many pre-existing mills reside on the northwestern edge of the Piedmont region, closer to the Blue Mountain Ridge [32]. While this distance may be preferable to Virginia residents, so that housing and communities are further from industry, it acts as a challenge toward environmental and economic sustainability. The physical distance between the biomass source and post-harvest systems is a major disparity that could affect the sustainability of a bioenergy production system [26,31].

3.2. Survey Design

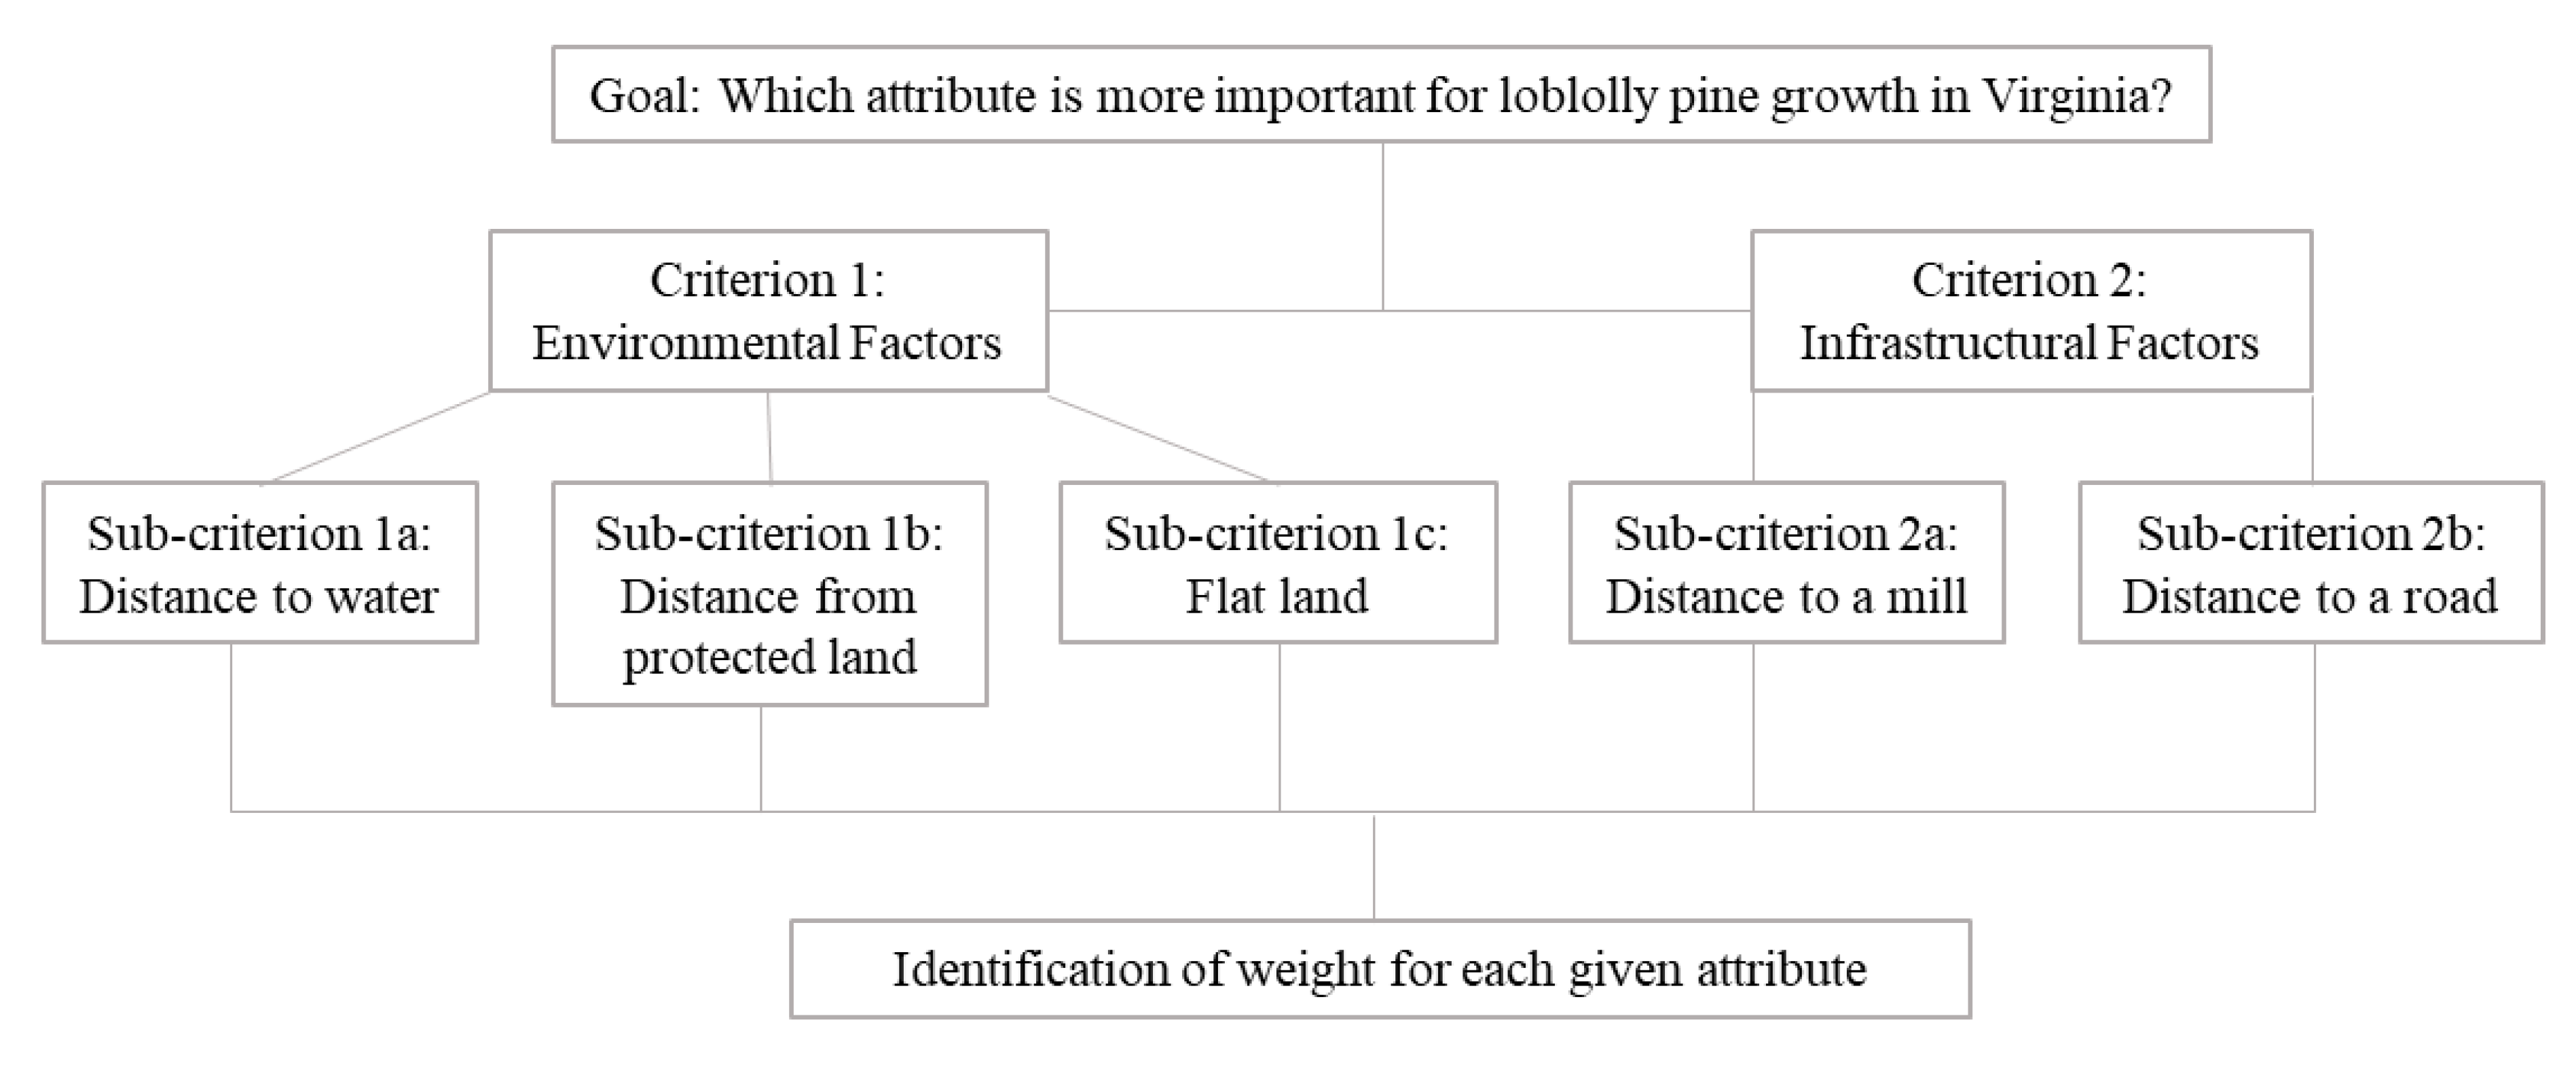
For our survey development, we undertook an existing literature review to delineate the factors that were relatively important for woody biomass for energy development. As such, we did not include biological factors, such as climate or water needs, as these tend to be well studied. We also reached out to a number of researchers in the forestry field to guide our design and suggest concepts for the survey. The five AHP criteria as described in Section 3.1 include distance to water, distance from protected land, flat land, distance to a road, and distance to a mill, and the survey asked: “Which attribute is more important for growing loblolly pine in Virginia?” We solicited the opinions of experts, and used the AHP questions for a number of different surveys permutations, but changed the phrasing of the auxiliary questions, such as harvest year and stand density, to best pertain to specific stakeholder groups. This was done both to avoid bias by any single group, as well as to understand the differences amongst the stakeholder groups and how preferences may vary depending on needs. To expedite the surveying process, the survey was coded into the “Survey 123 Connect for ArcGIS” program on a number of tablets for rapid responses. Once completed, each survey was pretested by researchers and graduate students at Montclair State University for clarity and readability.
In order to solicit responses from experts without specifically targeting individuals, the survey was administered during the annual Virginia Forestry Summit hosted by the Virginia Forestry Association in May 2019. This summit is well attended by a mix of landowners, researchers, and industry stakeholders, and thus was an ideal setting for processing survey responses. Responses were voluntary, and respondents could participate in the survey by visiting our research area at the conference. Surveys were completed via tablets loaned to respondents by our researchers, who then remained nearby for any questions or technical assistance that was required. The survey was carried out in the conference hall over two days. Responses that were incomplete were removed from the final analysis.

3.3. Analytical Hierarchy Process (AHP) Method

The analytical hierarchy process (AHP) method is a framework used to approach complex decision making and rank factors by priority. The method works by reducing complex decision making down to a number of pairwise comparisons, and then using the resulting comparisons to rank individual factors in terms of importance. These pairwise comparisons are given to experts in the given subject, allowing for subjective opinion to be turned, in aggregate, to a more objective ranking. The technique can also check the consistency of responses to reduce bias in decision maker evaluations [33]. Therefore, AHP allows the incorporation of both subjective and objective observations while also providing a framework for complexity, enabling the weighting of different factors in a structured method [34].
We performed the AHP method as laid out by Saaty (1980) and by following the use of the method in the environmental fields, as per Dos Santos et al. (2019), Ananda and Herath (2003), and Dwivedi and Alavalapati (2009) [33,35,36,37]. In order to prepare our survey for the pairwise criteria to be considered (Figure 1), we carried out an extensive literature review in addition to conducting informal interviews with a number of researchers in the forestry field. To produce the hierarchy structure that characterizes the AHP method, we followed the basic method for creating the numerical scale; the pairwise criteria were each given a ranking from 1 to 9, where 1 indicates that two activities or factors are of equal importance, and 9 indicates that one factor is considerably more important than the other [33,35].
The AHP method was then broken down into four steps [33,35]: (1) Define the problem and identify the necessary information; (2) structure the decision hierarchy from the goal, to the broader objectives, throughout the intermediate levels into the lower levels; (3) construct a set of pairwise comparison matrices, wherein the upper level is used to compare the elements in the level immediately below it, and; (4) use the results of the comparisons to weight the priorities for each element, continuing the process by adding to find the overall global priority of each level. In order to analyze the judgments, AHP uses decision matrices in n order with the eigenvectors related to them [32].
Error calculation, eigenvector method:
Δ w i = 1 n 1 k = 1 n ( n λ max a i k w k w i ) 2 ,   i = 1 ,   ,   n
We analyzed each respondent within their stakeholder group: forest landowners, private forest consultants, forest management researchers or educators, and federal or state agency foresters [38]. The result table displayed all five criteria (distance to a water body, distance from protected land, distance to a road, distance to a mill, and flat land) with calculated weights and errors using the eigenvector method [38,39]. Consistency ratios (CR) were used to find inconsistent comparisons in responses; a CR ≤0.1 or 10% is considered to be within the acceptable limit. Using the Alonson/Lamata linear fit, the consistency ratio is calculated based on the principal eigenvalue [40].
Comparison inconsistency (CI) equation:
C I = λ max N N 1
Consistency ratio equation:
C R = C I R I
Consistency ratio using Alonson/Lamata linear fit:
C R = λ max N 27699 N 4.3543 N
After all the surveys were completed, the AHP data was then transcribed into a pre-generated AHP Excel template, which included worksheets for pairwise comparisons, a judgment consolidation sheet, a summary sheet of results, and a sheet for solving the eigenvalue problem when using the eigenvector method [38].

3.4. Survey Regression Model

The AHP criteria weight for each individual respondent were then transcribed into JMP®, along with the other coded responses from the survey, allowing us to compare the stakeholder groups as a whole as well as compare the individual responses within each group. As landowners have the most direct interaction with forestland and were our sample’s largest stakeholder group, we explored what factors, such as landholding size and management practices, may have influenced their weighted decisions for the AHP criteria. To do this, we built a regression model from a set of predictor variables by entering and removing predictors in a stepwise manner to justify the use of certain variables associated with the AHP criteria of interest. In our stepwise model, we ran a forward direction using a p-value threshold of probability to enter α = 0.25 and probability to leave α = 0.1. We made our least squares model based on the stepwise output, which identified the predictor variables that had t-test p-values less than p = 0.1 in order to see how those predictor variables affect the AHP criteria of interest. We did this through the fit model platform, choosing the standard least squares personality based on the continuous-response nature of the dependent variable to construct a linear model.
Similarly, comparing recommended management practices between stakeholder groups, such as the recommended stand density and rotation age, is important to gauge whether what is recommended by industry experts is actually being performed by landowners and managers. To explore this, we performed a one-way analysis of these recommended management practices by the stakeholder groups to compare trends. A one-way analysis allows one to explore the distribution of a continuous variable (AHP criteria) across a group defined by a categorical variable to test for variability within a single stakeholder group and between multiple stakeholder groups. Finally, understanding how self-indicated experience levels with loblolly pine management influences stakeholders’ weighted criteria decision is important to see how increased experience may lead to different geographic criteria recommendations. To explore this, we performed a contingency analysis to explore the distribution of a categorical variable (experience levels) within a single stakeholder group and between multiple stakeholder groups.

4. Results and Discussion

4.1. AHP Analysis

Survey participants self-identified as forest landowners (n = 20), private forest consultants (n = 12), forest management researchers or educators (n = 5), or federal or state agency foresters (n = 6). The stakeholders’ criteria comparison judgments obtained from the survey were input into the developed AHP pairwise comparison model to determine the criteria weights for each individual and summarized for each stakeholder group (Table 1). The criteria weights for each stakeholder group and variation within those groups can be seen in Figure 2. The consistency ratio was also determined to explore any inconsistencies in the participants’ judgment. The results showed that the consistency ratio for each group was in the acceptable limit where CR <0.1.
Forest landowners, forest management researchers or educators, and federal or state agency foresters all indicated that distance to a mill was the highest priority criterion, giving that criterion a weight of 0.375, 0.531, and 0.378, respectively. Judging from the results and comments made by participants, this result likely reflects the economics of growing woody biomass for bioenergy; longer transport times to mills for processing may increase costs and thus overall lower the profits from forests products, and as such, its importance is ranked highly. Unlike the other stakeholder groups, private forest consultants identified distance to a road as the most important criteria, weighting its criteria at 0.362. Distance to roads may be another economic factor combined with concerns over practicality, as the transport of woody biomass may become increasingly difficult without established, maintained roads on which to transport them away. A forest management consultant may not necessarily bear the cost of transportation to a mill, which could justify their alternate opinions. All four stakeholder groups designated distance from protected land as the lowest priority criteria, followed by distance to a water body and flat land. The low priority of distance from protected land may be because most established land plots already avoid protected areas or have plans to circumvent them, and thus do not have further complications (Hubbard et al., 2007). The overall consensus within the forest management researcher or educator was very high at 82.4%, and high amongst the federal or state agency forester stakeholder group at 78.2%. Consensus amongst private forest consultants was moderate at 74.2%, and low amongst forest landowners at 62.0%.

4.2. Landowner Regression Analysis

Unlike the other stakeholder groups, landowners are more likely to have a direct connection to their land and therefore have the largest stake in how geographical conditions impact their land management practices. As distance to a mill was identified as the most important criteria, a stepwise regression model was used to identify which parameters may have an impact on weighting distance to a mill higher. It indicated the rotation age and acres of land owned/managed were significant, and we used a fit least squares regression model to determine how those factors would influence their geographical requirements. An analysis of variance, equivalent to the t test reported in Table 2, designated a significance of p < 0.0001 with an F ratio of 32.812, indicating a large range of variance amongst the landowner group for weight associated with distance to a mill. We found that these characteristics were significant at p = 0.1331 and p < 0.0001, respectively (Table 3). Amongst landowners, the median number of acres managed was 771.1, and the median rotation age was 29.95 years. We also found that when land ownership increases by 300 acres, the weight they attach to proximity to mills increases from 0.3512 to 0.3768, which is an increase of 0.0256 or 2.56%. When the landowner’s preferred rotation age with loblolly pine increases by five years, the weight they attach to proximity to mills increases from 0.3512 to 0.3989, which is an increase of 0.0477 or 4.7%. This may again be economic considerations, as larger amounts of land have more biomass to be processed, and therefore proximity to mills may be more helpful. Figure 3 shows the actual observed values of Y against the marginal predicted values of Y, giving a visual assessment of model fit reflecting variation due to random effects. The dots represent the observed values, and the shaded area represents the predictive range of values; while there are some outliers, Figure 3 shows that our sample group is representative of a greater population.
Forest landowners indicated distance from protected land as the lowest priority criteria at an average of 0.082. A stepwise regression indicated that level of experience managing loblolly and stand density had a significant correlation, with ranking distance from protected land higher. An analysis of variance designated a significance of p = 0.0015 with an F ratio of 10.3426, indicating a lesser range of variance amongst the landowner group for weight associated with distance from protected land as compared to distance to a mill. The fit least squares model revealed that the level of experience in managing loblolly pine was significant (p < 0.0001), where landowners who indicated their experience as ‘somewhat experienced’ or ‘experienced’ indicated a weight of 0.070; in comparison, those who indicated an experience level of ‘very experienced’ or ‘extremely experienced’ attached a weight of 0.322, which was a difference of 25.2% (Table 2). This finding could support that past experiences and a wider base of knowledge on pine management play a role in how landowners have dealt with challenges concerning protected land in the past. Stand density played a lesser role, with a significance of p = 0.0833 (Table 2). The profiler tool showed that when respondents were recommending stand density for loblolly and harvesting increased by 100 trees per acre, the weight associated increased from 0.101 to 0.158, which was an increase of 0.057 or 5.7%. This could be due to considerations for protected area preservation during harvest. Using the same method as described for Figure 3, we can see that in Figure 4, the majority of observed responses fell within the predicted range for ranking distance from protected land, supporting that the sample population is representative of the stakeholder group.

4.3. Multi-Stakeholder Group Analysis

To further explore preferred/recommended rotation age, stand density, and experience amongst each stakeholder group, we ran a one-way analysis and found that the rotation ages recommended by each stakeholder group were not significantly different from each other (p = 0.5574). On average, the forest management researchers or educators suggested a higher rotation age at 34 years, followed by landowners (30 years), private forest consultants (29.3 years), and federal or state agency foresters (27.5 years) (Table 4).
Similarly, a one-way analysis of preferred/recommended stand density upon final harvest showed again that the forest management researcher or educator group differed from the landowner group (p = 0.0002). The difference in response from the landowner group was significantly different from the other stakeholder groups (Table 5). Forest management researchers or educators and private forest consultants recommended an average of 182.5 and 166.7 trees per acre, respectively, whereas landowners and federal or state foresters recommended an average of 350.3 and 208.3 trees per acre, respectively. This may be a result of landowners wanting maximum harvestable volume from their land as opposed to conflicting factors that may influence the other stakeholder groups.
A contingency analysis of self-identified level of experience showed differences between the four stakeholder groups, where (1) indicated not at all experienced, (2) indicated somewhat experienced, (3) indicated experienced, (4) indicated very experienced, and (5) indicated extremely experienced. The private forest consultant and federal or state agency forester groups showed the most experience, with 91.7% and 83.3%, indicating experience levels of 4 and above, respectively. The forest management research or educator group showed the least experience, with all respondents indicating an experience level of 3 or below. The landowner group showed the most variation, with experience levels 2–5 all being represented. Table 6 provides a detailed explanation of the contingency analysis, representing stakeholder groups 1–4 and experience levels 1–5. Overall, the contingency table showed an r-square value of 0.2053 and a p-value of 0.0145, indicating that the distinctions between experience levels amongst each stakeholder group are significant.

5. Conclusions, Limitations, and Future Work

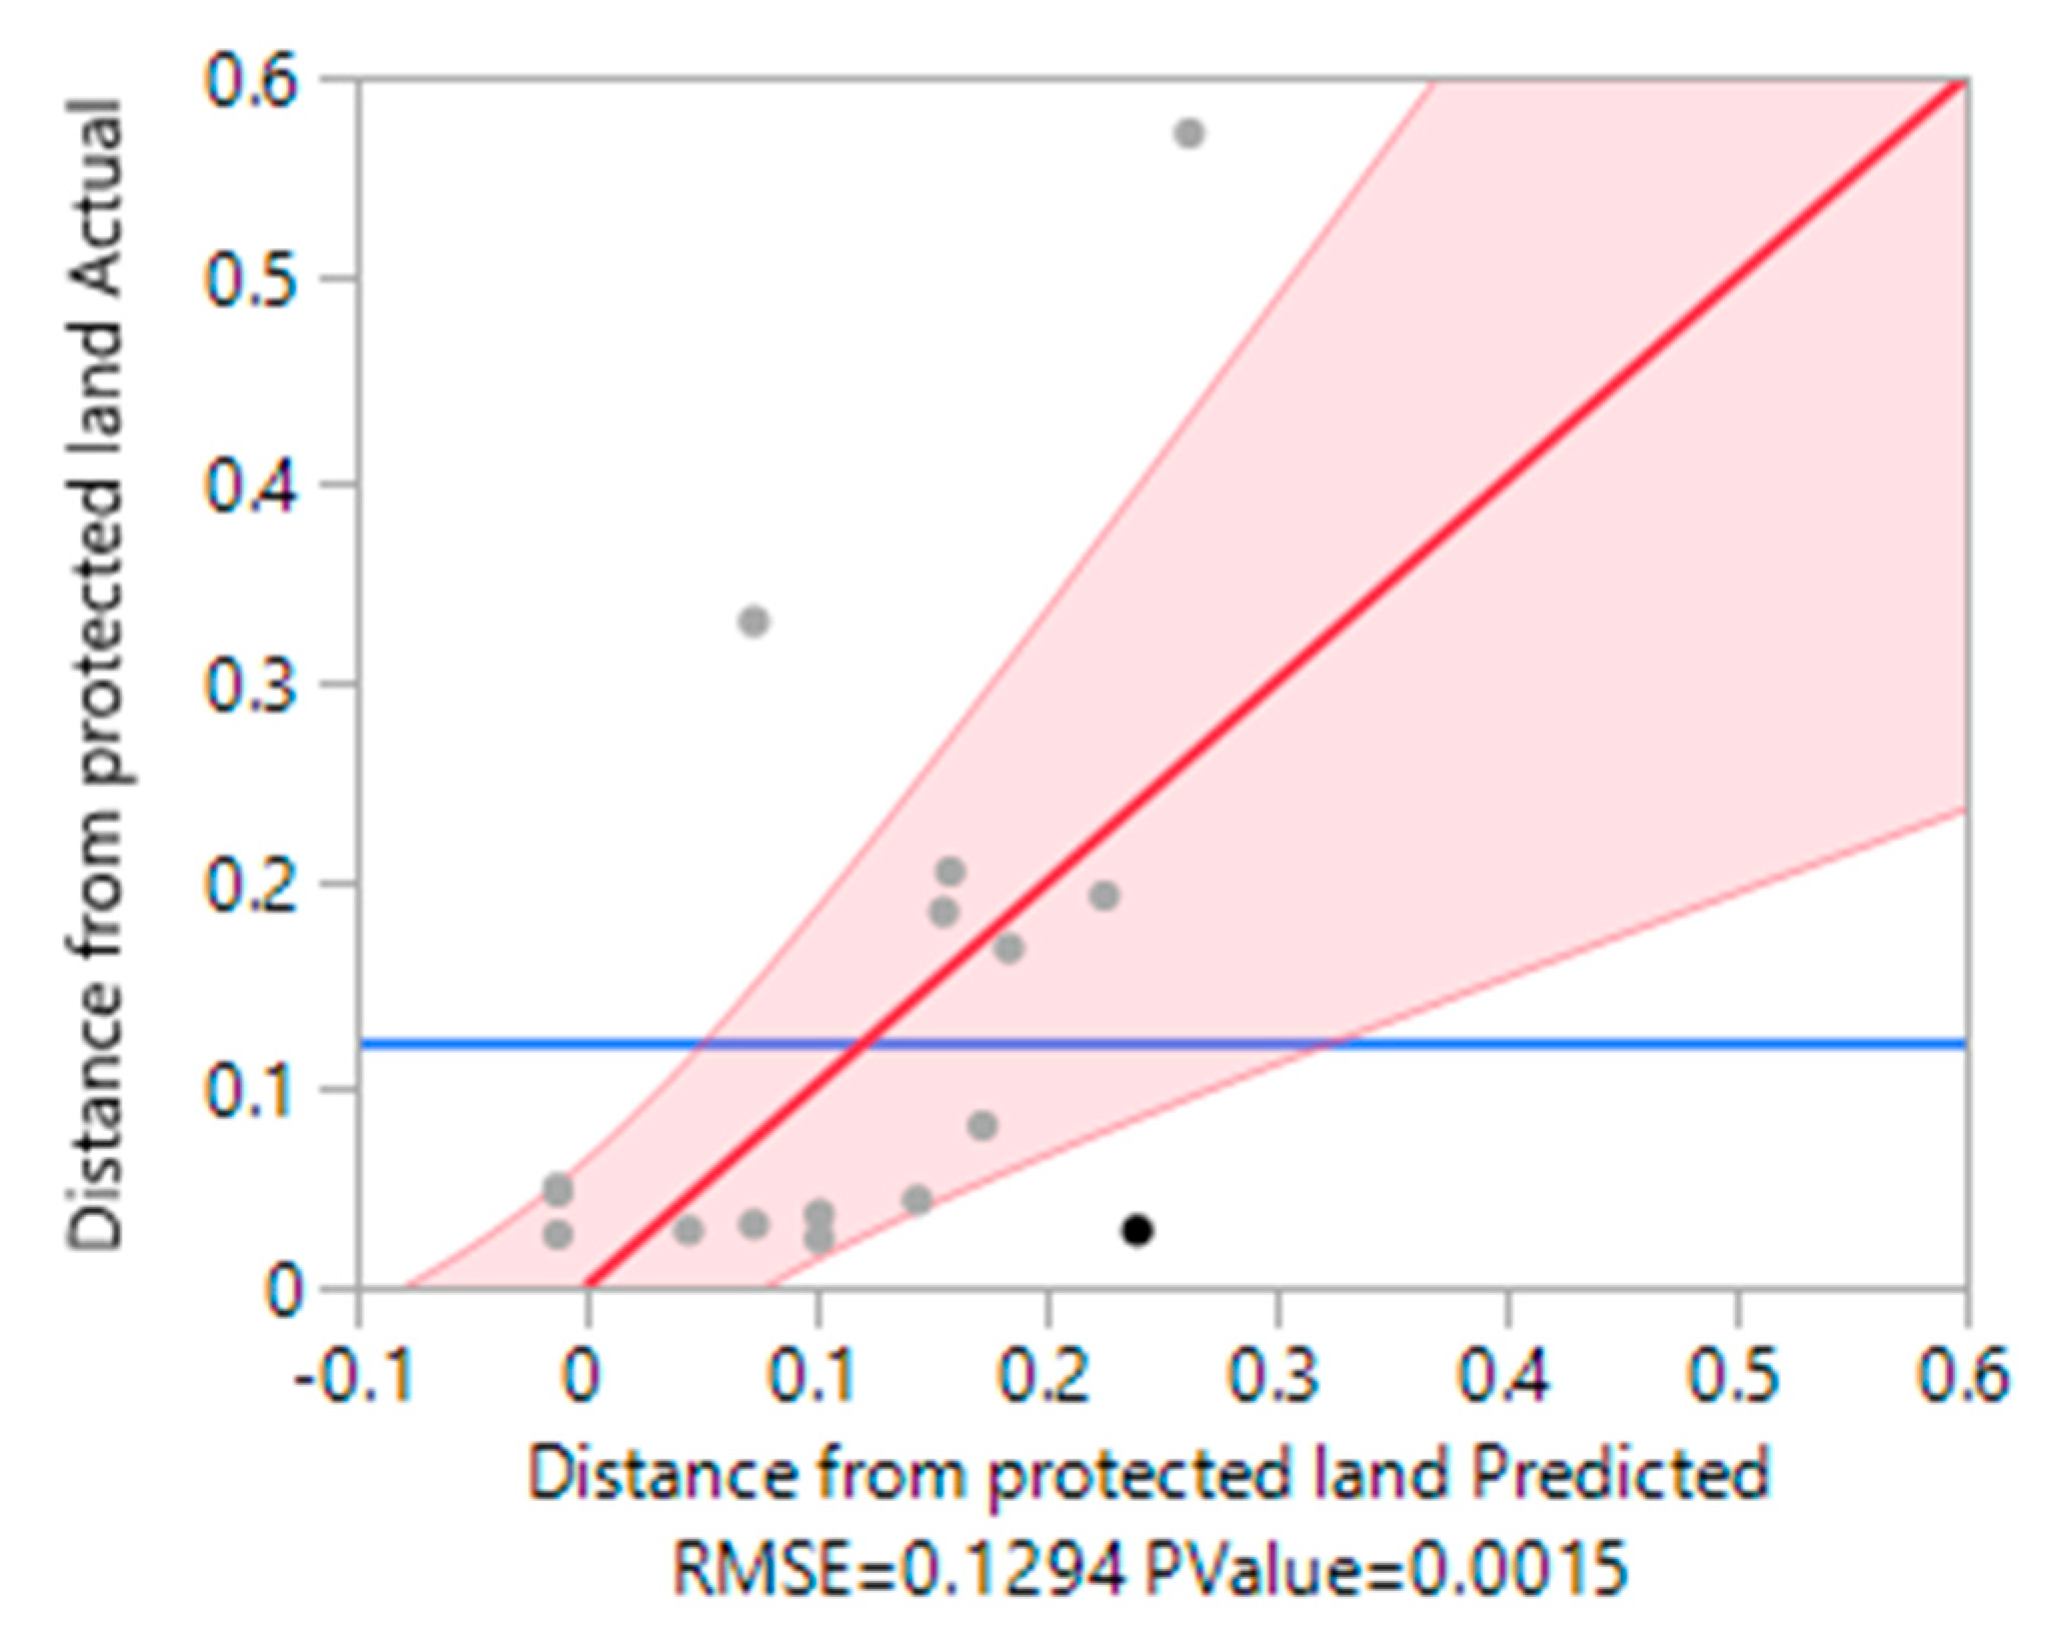
This study utilized an in-person survey to assess the varying opinions both within and between four forestry stakeholder groups in Virginia (forest landowners, private forest consultants, forest management researchers or educators, and federal or state agency foresters) to assess the importance of different factors in growing and managing loblolly pine for bioenergy. The survey followed a standard AHP method, which used pairwise criteria to rank factors by their overall importance and weight across all stakeholders. Our results found that distance to a mill was considered to be the most important factor by all but one group, who instead identified distance to a road as most important, while the distance to protected land was considered to be the least important by all stakeholder groups. With a considerably higher number of respondents, the forest landowner stakeholder group’s responses for distance to a mill and distance to protected land were subjected to regression analyses. These analyses found that the recommended rotation age significantly increased the preference for proximity to a mill, while experience managing loblolly pine significantly increased the preference for proximity from protected land. These findings indicate the need for infrastructural support, and stronger consensus on best management practices in order to support the growth of the biofuel industry.
Although we are confident in our methods and approach, our study did suffer from some limitations. While AHP relies on expert opinions to make an unbiased judgment, our survey relied on self-reporting for levels of experience, and thus, the surveys may not represent the peak of experience that many AHP surveys aim for. However, the varying levels of experience with loblolly pine within each stakeholder group did allow additional insight into management practices, which could be important for future work on transitioning to growth for bioenergy feedstock. We utilized an extensive literature review to identify criteria that were understudied or poorly understood for the survey. While we may have excluded factors that we were unaware of, interaction with the stakeholders allowed us to correct this to some degree. Finally, doing this survey at a forester’s conference may provide some bias due to economic, spatial, and temporal limitations, though we feel that the results provide a reasonably unbiased analysis of the stakeholders in question.
In future work, we aim to use these findings as a factor to better understand suitable growing regions and preferential infrastructural requirements in order to support an economically viable bioenergy industry in Virginia which could utilize loblolly pine as a potential feedstock. We aim to utilize the weighted criterion results from this study to further be exploited as an input of a Geographic Information System (GIS)-based fuzzy logic model. This model will be used to locate suitable regions for developing loblolly pine growth and management in the southern US. The model will involve multiple additional processes for data acquisition and transformation to produce gridded images with fuzzy membership functions for identified factors. Then, these comparable GIS layers will be aggregated with individual criteria weight in order to create a suitable map of the pine cultivation as a potential biomass for clean energy.

Author Contributions

M.S., G.N., B.W., P.L. and J.M. were responsible for the conceptualization, methodology and formal analysis of the research; M.S., G.N., B.W. and T.W. curated the data and undertook manuscript revisions; P.L. supervised and validated this research. All authors discussed the results and commented on the manuscript.

Funding

This research was funded in part by the National Science Foundation (1555123) and the National Institute of Food and Agriculture (2012-67009-19742).

Acknowledgments

The authors gratefully acknowledge the support of the National Science Foundation Award 1555123, and U.S. Department of Agriculture, National Institute of Food and Agriculture Grant 2012-67009-19742, Clean Energy and Sustainability Analytics Center at Montclair State University, and Virginia Polytechnic and State University.

Conflicts of Interest

The authors declare no conflict of interest.

References

  1. Durocher, C.; Thiffault, E.; Achim, A.; Auty, D.; Barrette, J. Untapped volume of surplus forest growth as feedstock for bioenergy. Biomass Bioenergy 2019, 120, 376–386. [Google Scholar] [CrossRef]
  2. Ghaffariyan, M.R.; Brown, M.; Acuna, M.; Sessions, J.; Gallagher, T.; Kühmaier, M.; Spinelli, R.; Visser, R.; Devlin, G.; Eliasson, L.; et al. An international review of the most productive and cost effective forest biomass recovery technologies and supply chains. Renew. Sustain. Energy Rev. 2017, 74, 145–158. [Google Scholar] [CrossRef]
  3. Nepal, S.; Tran, L.T. Identifying trade-offs between socio-economic and environmental factors for bioenergy crop production: A case study from northern Kentucky. Renew. Energy 2019, 142, 272–283. [Google Scholar] [CrossRef]
  4. Wolde, B.; Lal, P.; Alavalapati, J.; Burli, P.; Munsell, J. Factors affecting forestland owners’ allocation of non-forested land to pine plantation for bioenergy in Virginia. Biomass Bioenergy 2016, 85, 69–75. [Google Scholar] [CrossRef]
  5. White, W.A. Chapter 6—Economic and Social Barriers Affecting Forest Bioenergy Mobilisation: A Review of the Literature. In Mobilisation of Forest Bioenergy in the Boreal and Temperate Biomes: Challenges, Opportunities and Case Studies; Academic Press: Cambridge, MA, USA, 2016; pp. 84–101. [Google Scholar]
  6. Padilla-Rivera, A.; Paredes, M.G.; Güereca, L.P. A systematic review of the sustainability assessment of bioenergy: The case of gaseous biofuels. Biomass Bioenergy 2019, 125, 79–94. [Google Scholar] [CrossRef]
  7. Muench, S.; Guenther, E. A systematic review of bioenergy life cycle assessments. Appl. Energy 2013, 112, 257–273. [Google Scholar] [CrossRef]
  8. Schnepf, R. Cellulosic Ethanol: Feedstocks, Conversion Technologies, Economics, and Policy Options; Congressional Research Service: Washington, DC, USA, October 2010; CRS R41460. [Google Scholar]
  9. Langholtz, M.H.; Stokes, B.J.; Eaton, L. 2016 Billion-Ton Report: Advancing Domestic Resources for a Thriving Bioeconomy, Volume 1: Economic Availability of Feedstocks; U.S. Department of Energy, Oak Ridge National Laboratory: Oak Ridge, TN, USA, 2016; p. 448.
  10. Gan, J.; Mayfield, C. Benefits to Landowners from Forest Biomass/Bioenergy Production; Southern Forest Research Partnership, Inc.: Athens, GA, USA, 2011. [Google Scholar]
  11. Soliño, M.; Prada, A.; Vázquez, M.X. Designing a forest-energy policy to reduce forest fires in Galicia (Spain): A contingent valuation application. J. For. Econ. 2010, 16, 217–233. [Google Scholar] [CrossRef]
  12. Biomass as Feedstock for a Bioenergy and Bio-products Industry: The Technical Feasibility of a Billion Ton Annual Supply; DOE/GO–102995–2135; U.S. Department of Energy (DOE) and U.S. Department of Agriculture (USDA): Washington, DC, USA, 2005.
  13. Economic Benefits of the Forest Industry in Virginia; Virginia Department of Forestry (VDoF): Charlottesville, VA, USA, 2015. Available online: http://www.dof.virginia.gov/forestry/benefits/index.htm (accessed on 17 June 2019).
  14. Rose, A.K. Virginia, 2009 Forest Inventory and Analysis Factsheet; U.S. Department of Agriculture Forest Service, Southern Research Station: Asheville, NC, USA, 2011.
  15. USFS Timber Product Output Data 2003; U.S. Department of Agriculture Forest Service, Forest Inventory and Analysis Unit: Newtown Square, PA, USA, 2003.
  16. Lal, P.; Wolde, B.; Alavalapati, J.; Burli, P.; Munsell, J. Forestland owners’ willingness to plant pine on non-forested land for woody bioenergy in Virginia. For. Policy Econ. 2016, 73, 52–57. [Google Scholar] [CrossRef]
  17. Silver, E.J.; Leahy, J.E.; Noblet, C.L.; Weiskittel, A.R. Maine woodland owner perceptions of long rotation woody biomass harvesting and bioenergy. Biomass Bioenergy 2015, 76, 69–78. [Google Scholar] [CrossRef]
  18. Markowski-Lindsay, M.; Stevens, T.; Kittredge, D.B.; Butler, B.J.; Catanzaro, P.; Damery, D. Family forest owner preferences for biomass harvesting in Massachusetts. For. Policy Econ. 2012, 14, 127–135. [Google Scholar] [CrossRef]
  19. Leitch, Z.J.; Lhotka, J.M.; Stainback, G.A.; Stringer, J.W. Private landowner intent to supply woody feedstock for bioenergy production. Biomass Bioenergy 2013, 56, 127–136. [Google Scholar] [CrossRef]
  20. Hodges, D.G.; Chapagain, B.; Watcharaanantapong, P.; Poudyal, N.C.; Kline, K.L.; Dale, V.H. Opportunities and attitudes of private forest landowners in supplying woody biomass for renewable energy. Renew. Sustain. Energy Rev. 2019, 113, 109205. [Google Scholar] [CrossRef]
  21. Joshi, O.; Mehmood, S.R. Factors affecting nonindustrial private forest landowners’ willingness to supply woody biomass for bioenergy. Biomass Bioenergy 2011, 35, 186–192. [Google Scholar] [CrossRef]
  22. Gruchy, S.R.; Grebner, D.L.; Munn, I.A.; Joshi, O.; Hussain, A. An assessment of nonindustrial private forest landowner willingness to harvest woody biomass in support of bioenergy production in Mississippi: A contingent rating approach. For. Policy Econ. 2012, 15, 140–145. [Google Scholar] [CrossRef]
  23. Becker, D.R.; Eryilmaz, D.; Klapperich, J.J.; Kilgore, M.A. Social availability of residual woody biomass from nonindustrial private woodland owners in Minnesota and Wisconsin. Biomass Bioenergy 2013, 56, 82–91. [Google Scholar] [CrossRef]
  24. USEIA. Biomass and the Environment; U.S. Energy Information Administration: Washington, DC, USA, 2019. Available online: https://www.eia.gov/energyexplained/index.php?page=biomass_environment (accessed on 19 June 2019).
  25. Hughes, A.O.; Quinn, J.M. The effect of forestry management activities on stream water quality within a headwater plantation Pinus radiata forest. For. Ecol. Manag. 2019, 439, 41–54. [Google Scholar] [CrossRef]
  26. Hubbard, W.; Biles, L.; Mayfield, C.; Ashton, S. Sustainable Forestry for Bioenergy and Bio-Based Products: Trainers Curriculum Notebook; Southern Forest Research Partnership, Inc.: Athens, GA, USA, 2007; pp. 225–228. [Google Scholar]
  27. Klapproth, J.C.; Johnson, J.E. Understanding the Science behind Riparian Forest Buffers: Resources for Virginia Landowners; Virginia Cooperative Extension: Blacksburg, VA, USA, 2009. [Google Scholar]
  28. DCR. Virginia’s Managed Conservation Lands Map; Virginia Department of Conservation and Recreation: Richmond, VA, USA, 2019; Available online: http://vanhde.org/content/map (accessed on 19 June 2019).
  29. Lu, X.; Withers, M.R.; Seifkar, N.; Field, R.P.; Barrett, S.R.; Herzog, H.J. Biomass logistics analysis for large scale biofuel production: Case study of loblolly pine and switchgrass. Bioresour. Technol. 2015, 183, 1–9. [Google Scholar] [CrossRef]
  30. Hassegawa, M.; Gelinas, N.; Beaudoin, D.; Achim, A. Assessing the potential impact of a biorefinery product from sawmill residues on the profitability of a hardwood value chain. Can. J. For. Res. 2018, 48, 857–868. [Google Scholar] [CrossRef]
  31. Schelhas, J.; Hitchner, S.; Brosius, J.P. Envisioning and implementing wood-based bioenergy systems in the southern United States: Imaginaries in everyday talk. Energy Res. Soc. Sci. 2018, 35, 182–192. [Google Scholar] [CrossRef]
  32. Prisley, S.P. Baseline Analysis of Virginia’s Commercial Wood Supply. Assessment and Decision Support, 2015; pp. 1–45. Available online: https://www.cenrads.cnre.vt.edu/documents/FinalAssessmentReport.pdf (accessed on 10 June 2019).
  33. Saaty, T.L. The Analytic Hierarchy Process; McGraw-Hill: New York, NY, USA, 1980. [Google Scholar]
  34. Nguyen, H.L.; Fong, C.-M.; Ho, C.-T. Using Analytical Hierarchy Process in Decision Analysis—The Case of Vietnam State Securities Commission. Business 2010, 2, 139–144. [Google Scholar] [CrossRef]
  35. Dos Santos, P.H.; Neves, S.M.; Sant’Anna, D.O.; De Oliveira, C.H.; Carvalho, H.D. The analytic hierarchy process supporting decision making for sustainable development: An overview of applications. J. Clean. Prod. 2019, 212, 119–138. [Google Scholar] [CrossRef]
  36. Ananda, J.; Herath, G. The use of Analytic Hierarchy Process to incorporate stakeholder preferences into regional forest planning. For. Policy Econ. 2003, 5, 13–26. [Google Scholar] [CrossRef]
  37. Dwivedi, P.; Alavalapati, J.R. Stakeholders’ perceptions on forest biomass-based bioenergy development in the southern US. Energy Policy 2009, 37, 1999–2007. [Google Scholar] [CrossRef]
  38. Goepel, K.D. Implementing the Analytic Hierarchy Process as a Standard Method for Multiple Criteria Decision Making in Corporate Enterprises—A new AHP Excel Template with Multiple Inputs. In Proceedings of the International Symposium on the Analytic Hierarchy Process 2013, Kuala Lumpur, Malaysia, 23–36 June 2013; pp. 1–10. [Google Scholar]
  39. Tomashevskii, I. Eigenvector ranking method as a measuring tool: Formulas for errors. Eur. J. Oper. Res. 2015, 240, 774–780. [Google Scholar] [CrossRef]
  40. Alonso, J.A.; Lamata, M.T. Consistency in the analytic hierarchy process: A new approach. Int. J. Uncertain. Fuzziness Knowl. Based Syst. 2006, 14, 445–459. [Google Scholar] [CrossRef]
Figure 1. Analytical hierarchy process general framework (adapted from Saaty, 1980).
Forests 10 00801 g001
Figure 2. Distribution of stakeholder groups’ weighted criteria.
Forests 10 00801 g002
Figure 3. Actual by predicted plot—distance to a mill.
Forests 10 00801 g003
Figure 4. Actual by predicted plot—distance from protected land.
Forests 10 00801 g004
Table 1. Stakeholder groups’ summary of weighted criteria.
Stakeholder GroupForest LandownerPrivate Forest ConsultantForest Management Researcher or EducatorFederal or State Agency Forester
Weighted criteria +/− +/− +/− +/−
Distance to a water body0.1063.4%0.0872.4%0.0521.6%0.0700.9%
Distance from protected land0.0822.1%0.0531.4%0.0381.6%0.0571.3%
Distance to a road0.2544.7%0.3627.1%0.26014.5%0.3015.3%
Distance to a mill0.3756.2%0.3427.4%0.53133.2%0.3788.6%
Flat land0.1841.5%0.1574.7%0.1184.6%0.1946.0%
Consistency ratio0.021 0.028 0.099 0.022
Consensus62.0% 74.2% 82.4% 78.2%
Table 2. Parameter estimates—distance from protected land.
TermEstimate of Model CoefficientStd Errort RatioProb > |t|
What is your stand density for LLP when harvesting?0.00010.00011.820.0833
How would you rate your level of experience managing LLP {1, 2–3, 4 and 5}0.00950.00175.43<0.0001 *
Significance code: ‘*’ ≤ 0.01.
Table 3. Parameter estimates—distance to a mill.
TermEstimate of Model CoefficientStd Errort RatioProb > |t|
How many acres of land do you own/manage?0.00009290.0000511.820.1331
What is your rotation age with loblolly pine?0.009450.001745.43<0.0001 *
Significance code: ‘*’ ≤ 0.01.
Table 4. Ordered difference report—recommended rotation age.
Level - LevelDifferenceStd Err DifLower CLUpper CLp-Value
426.5000004.622898−2.8506915.850690.1676 Forests 10 00801 i001
434.6666674.063754−3.5530512.886380.2578 Forests 10 00801 i002
414.0500003.817232−3.6710811.771080.2952 Forests 10 00801 i003
122.4500003.553650−4.737939.637930.4946 Forests 10 00801 i004
321.8333333.817232−5.887759.554410.6337 Forests 10 00801 i005
130.6166672.787712−5.022016.255350.8261 Forests 10 00801 i006
Where levels represent groups (1) Forest landowners, (2) Federal or state agency foresters, (3) Private forest consultants, and (4) Forest management researchers or educators.
Table 5. Ordered difference report—recommended stand density.
Level - LevelDifferenceStd Err DifLower CLUpper CLp-Value
13183.583339.45678103.707263.4594<0.0001 * Forests 10 00801 i007
14167.750059.1851747.936287.56410.0073 * Forests 10 00801 i008
12141.916750.2977340.094243.73910.0076 * Forests 10 00801 i009
2341.666754.02843−67.708151.04150.4454 Forests 10 00801 i010
2425.833369.75040−115.369167.03560.7132 Forests 10 00801 i011
4315.833362.38665−110.462142.12850.8010 Forests 10 00801 i012
Where levels represent groups (1) Forest landowners, (2) Federal or state agency foresters, (3) Private forest consultants, and (4) Forest management researchers or educators.
Table 6. Contingency analysis of “How would you rate your level of experience?”
Count12345Total
Total %
Col %
Row %
Landowner0546520
011.639.313.9511.6346.51
071.43505033.33
025203025
Federal or state agency forester001146
002.332.339.313.95
0012.58.3326.67
0016.6716.6766.67
Private forest consultant0105612
02.33011.6313.9527.91
014.29041.6740
08.33041.6750
Forest management researcher or educator113005
2.332.336.980011.63
10014.2937.500
20206000
Total178121543
2.3316.2818.627.9134.88
Where levels represent (1) Not at all experienced, (2) Somewhat experienced, (3) Experienced, (4) Very experienced, and (5) Extremely experienced.

