Hedonic Analysis of Forest Pest Invasion: the Case of Emerald Ash Borer


1
Center for Health Services Research, University of Kentucky, 740 South Limestone, J515 Kentucky Clinic, Lexington, KY 40536, USA
2
Forestry Sciences Lab, Southern Research Station, USDA Forest Service, Research Triangle Park, NC 27709, USA
3
Agricultural and Applied Economics Department, Virginia Polytechnic Institute and State University, 430A Bishop Favrao Hall, Blacksburg, VA 24060, USA
4
Department of Forestry and Natural Resources, University of Kentucky, 121 Thomas Poe Cooper Building, Lexington, KY 40546, USA
5
Forest Health Research and Education Center, Southern Research Station, USDA Forest Service, 208 Thomas Poe Cooper Building, Lexington, KY 40546, USA
*
Author to whom correspondence should be addressed.
Forests 2019, 10(9), 820; https://doi.org/10.3390/f10090820
Submission received: 29 July 2019
/
Revised: 13 September 2019
/
Accepted: 17 September 2019
/
Published: 19 September 2019
(This article belongs to the Special Issue Understanding Forest Health under Increasing Climate and Trade Challenges: Social System Considerations)
Abstract
:The emerald ash borer (EAB) was first detected in North America in 2002, and since its introduction, this invasive pest has killed millions of ash trees. While EAB kills native North American ash trees in all settings, its impacts have been especially large in urban areas where ash has been a dominant street tree, especially in residential areas. While some management costs, such as insecticide treatment, tree removal, or tree replacement, are relatively straightforward to compute, the impact that EAB has had on residential property values is less clear. To better understand the economic cost of EAB in urban settings, we conducted a hedonic property value analysis to evaluate the impact of ash tree damages due to EAB infestation on housing sales prices. This study was conducted in the city of Milwaukee, Wisconsin, which had high stocking levels of ash trees prior to EAB’s arrival. The objectives of the study are to investigate: (1) how EAB-infested ash trees affect property values; (2) whether the benefits from healthy ash trees to property value change after arrival of EAB; and (3) whether healthy ash trees located within infested neighborhoods provide the same benefits as the healthy ash trees located outside of infested neighborhoods. In general, our results show that the EAB outbreak has had a negative impact on home values for properties located in close proximity to the ash tree component of the urban forest. This result holds true for neighborhoods where EAB does not yet pose an imminent threat, and is amplified for neighborhoods where EAB has been detected. Our results highlight the early stages of a dynamic economic process that impacts urban residential property owners subject to the risk of EAB or other tree pests and diseases. In general, we find that forward-looking behavior of residential property owners is capitalized into property values during the process of forest pest infestation.
1. Introduction
The emerald ash borer (EAB) was first detected in North America in 2002, and is thought to have been introduced from Asia by packaging materials [1]. Since its introduction, this invasive pest has spread out from Michigan to over 30 states and killed tens of millions of ash trees. EAB is an invasive wood-boring beetle that can kill ash trees within 2–4 years from infestation, as larvae tunnel into the vascular system of the tree and cut off transpiration of water and nutrients. Ash trees are important forest trees species in the U.S. and Canada, accounting for more than 20% of trees in many U.S. municipalities [2]. They are well suited as street trees due to their tree and crown form, tolerance of a variety of conditions, and rapid growth rate, and were commonly planted as replacement trees after the wide-scale death of American elms due to a different invasive tree killer, Dutch elm disease, in the mid-1900s. This rapid loss of ash trees due to EAB has generated devastating ecological and economic impacts to both municipalities and private households [3].
Most of the documented economic impacts of EAB are associated with insecticide treatments to protect ash trees from EAB and removal or replacement of high-value trees in urban and residential areas [2,4]. For example, the estimated cost for removal and replacement of ash trees was $1.0–$4.2 billion in Ohio communities and $26 billion in four Midwestern states [5,6]. Kovacs et al. simulated the spread of EAB from 2009 to 2019 and predicted that the costs of treating or removing of ash trees in urban area would be $10.7 billion [2].
Several studies have investigated the effects of trees on property values and most indicate that (healthy) trees increase property values [7,8,9], while an invasive pest that degrades tree quality and ultimately kills trees will diminish property values [10,11]. Tree mortality can impact property values via the diminishment of ecosystem services such as the provision of shade, visual aesthetics, recreational qualities, and regulation of the hydrological cycle [3,12]. Dead and dying trees also pose risks to residents and their homes and impose a real cost in terms of tree removal. In addition, studies have shown that the loss of ash trees caused by EAB can harm human health in a range of different ways. For example, after loss of ash trees due to EAB, some studies have found higher human mortality rates due to increased cardiovascular and lower-respiratory diseases [13,14,15,16].
The loss of residential property value should be an important part of the total economic cost from EAB infestation. However, no study has directly investigated this impact. Kovacs employed the annual benefit of an ash tree based on estimates from Anderson and Cordell [2,17], which showed the presence of one medium size hardwood tree in the front yard of a single-family home increased the property’s value by 0.8%. Kovacs estimated the annual residential land use benefit of an ash tree to be $54 [18], which is based on estimates from McPherson et al. [19]. Previous studies have employed hedonic models to investigate the effects on property values from forest pest infestations, including mountain pine beetle, spruce budworm, gypsy moth, sudden oak death, and hemlock woolly adelgid [20,21,22]. In these studies, the authors focused on the impacts from current forest health conditions surrounding properties without explicitly considering that both healthy and damaged (infested/infected) host trees compose forest stands.
One question is whether healthy host trees in neighborhoods with high tree mortality from an invasive pest like EAB contribute to property value in the same way as healthy trees in neighborhoods with no mortality. Healthy host trees could increase property values, as do trees in non-infested forest stands or on city streets because of the ecosystem services or benefits to human health they provide. If so, decreases in household property values would only result from an increased number of dead trees. Alternatively, if homeowners exhibit forward-looking behavior by predicting that the remaining host trees will soon die as well, they may instead consider healthy host trees as threats rather than benefits for their properties. In this case, healthy host trees in partially damaged urban forest stands would decrease property values as well. To our knowledge, no study has yet investigated this potential outcome.
Here, we employed a hedonic analysis to estimate the impact of ash tree loss due to EAB on residential property values to provide insight into how property values change during the dynamic process of EAB infestation in an urban setting. We chose Milwaukee, Wisconsin, as our study city, due to its abundance of ash trees prior to EAB and the fact that we were able to obtain a detailed ash tree inventory dataset for the city. The tree inventory dataset provided information related to both the live ash trees before the EAB infestation and the number of EAB-infested ash trees in the few years after the infestation was initiated. In particular, we investigated: (1) how EAB-infested ash trees affect property values; (2) whether the benefits from healthy ash trees to property value change after arrival of EAB; and (3) whether healthy ash trees located within infested neighborhoods provide the same benefits as the healthy ash trees located outside of infested neighborhoods.
The results from this study contribute to an accurate estimation of the loss of property values from EAB infestations. Furthermore, these estimates contribute to assessments of the total economic impact from EAB while helping municipalities justify tree protection expenditures and design optimal EAB management strategies that benefit public and private ownerships.
2. Previous Research
Previous hedonic studies have shown that healthy trees and forests provide scenic and recreation value to residential properties [17,23,24,25]. Inversely, these findings suggest the potential for property value losses from various disturbances occurring in residential forests. Insects and diseases that kill trees are known to negatively affect the value of forest ecosystem services [10,26,27]. For example, mountain pine beetle, spruce budworm, gypsy moth, sudden oak death, and hemlock woolly adelgid have caused substantial damages to forests in the U.S., and a number of studies have used hedonic property value models to estimate the diminution in property values from damages caused by forest pest infestations [20,21,22].
Based upon empirical evidence reported in the literature, however, definitive conclusions are difficult to draw regarding functional relationships linking tree damages from insects, diseases, and other natural disturbances with residential property values, due to inconsistent data collection and analytical methods used across studies and variations in the landscape settings and severity/extent of natural disturbances examined at study locations. For example, using GIS data showing the location of host trees (coast live oaks), Kovacs et al. [22] investigated the economic losses induced by the sudden oak death pathogen Phytophthora ramorumWerres, de Cock & Man in’t Veld in Marin County, California (located along the central coast). Their results indicated that proximity to coast live oak woodlands (within 0.72 km) prior to the invasion enhanced property values by about 3–4%, relative to homes with similar characteristics, while proximity to host trees after the invasion decreased property values by about 3–6%, relative to similar homes. Similarly, using GIS data providing the location of host trees susceptible to infestation by mountain pine beetle in Colorado’s Front Range (east side of the Rocky Mountains), Cohen et al. [20] investigated the joint impacts from wildfires and beetle-caused mortality on home prices. They concluded that the mountain pine beetle outbreak reduced property values in, and in close proximity to (within 0.1 km), the host tree zones of the study area by roughly 13–22%. They also reported that wildfires, within 5 years and 5 km of residential properties, had a lesser impact on property values, decreasing home prices by up to 4%.
While the procedures used in the above two studies could only identify whether a particular forest health threat existed within stands of host trees located within a certain distance of residential properties, other hedonic price studies have utilized more spatially explicit data to identify specific areas impacted by forest disturbances. For example, data collected using aerial detection surveys (ADS) were used by Price et al. [28] to estimate the property value impacts of trees killed by mountain pine beetle in Grand County, Colorado (west side of the Rocky Mountains). The authors concluded that the marginal implicit price of a tree killed within a 0.1 km, 0.5 km, and 1 km radius of a home is $648, $43, and $17, respectively. ADS data were also used by Hansen and Naughton [29] to investigate the joint impact from wildfires and a spruce bark beetle outbreak on assessed property values in the Kenai Peninsula of south–central Alaska. In contrast to other studies investigating the impacts of natural disturbances on home sale prices, they concluded that some disturbances increase (rather than decrease) property values. In particular, they report that bark beetle outbreaks located from 0.1–1.0 km from property centroids enhanced property values by 2.1–3%, and that large wildfires within 0.1 km of property centroids enhanced home prices by 18.6%. Their explanation for these positive effects of natural disturbances on property values is that properties located in their study area were surrounded by relatively dense forest. Following a disturbance, the trees were killed and fell, which opened up more pleasing aesthetic views.
The potential bias in using ADS data in models investigating the impact of natural disturbances on home prices was studied by Moeltner et al. [30]. The authors recognized that two types of measurement error, erroneous damage assessment and imprecise geocoding, can lead to substantial biases in estimated losses of home values. In their experiment, which focused on mountain pine beetle mortality in the Colorado Front Range, remotely sensed data were used to visually identify precise home locations and surrounding tree health. These data were then entered into econometric models of home prices using matching estimators and compared with estimates obtained using ADS data. While the authors found that model estimates consistently revealed home price losses from the mountain pine beetle outbreak, consistent with previous studies in the region [20,31], they also concluded that the use of ADS data resulted in substantial over- and under-estimates of lost home values.
Holmes et al. [21] used remote sensing data, interpreted using the image differencing technique, to map canopy defoliation from the invasive pest hemlock woolly adelgid in the New Jersey highlands region. Based on the percentage of canopy defoliation, the study classified hemlock health conditions into four classes: healthy or lightly impacted hemlocks, moderately defoliated hemlocks, severely defoliated hemlocks, and dead hemlocks. The authors found that home prices declined with the area of dead hemlocks found on homeowner parcels, and prices also declined for homes in close proximity to dead hemlocks where parcels did not contain hemlocks (a negative spillover effect). Overall, home prices affected by dead hemlocks declined by about 1–2% in the study region.
In hedonic analyses, previous studies have shown that expected future changes in neighborhood characteristics can influence current property sale prices, representing “forward-looking behavior” [30,31,32,33]. Ignoring the forward-looking behavior of housing markets may lead to a misspecification of the hedonic model, and biased estimates of the marginal price for relevant time-varying attribute variables. Severen et al. incorporated future climate change (index of temperature and precipitation) projections into the analysis of agricultural land prices, which decreased estimates of climate change damages by 50–62% [32]. Bishop and Murphy [33] built up a dynamic model which adjusted the static model with forward-looking estimates with two applications: willingness to pay to avoid violent crime and willingness to pay to avoid air pollution. The results of both applications supported the potential bias related to the estimates from static models.
Insect infestation and disease spread are also dynamic processes, with the capacity to continuously change the environmental conditions of residents’ communities. With invasive insects and diseases, once trees are infested or infected within a given neighborhood, it is likely that other susceptible trees will be affected. Property owners may perceive the risk of this potential process once there are damaged trees within their neighborhood, causing a real change in property values. Therefore, in our study, we will test whether forward-looking behavior in property values has occurred in response to EAB infestation on urban ash trees.
3. Data
The first confirmation of EAB in the state of Wisconsin occurred in July 2008. The insect then spread throughout the southern half of the state and to several northern counties. EAB was first confirmed in the city of Milwaukee (located in southeastern Wisconsin) in 2012. Prior to the arrival of EAB, Milwaukee contained about 3.4 million trees, of which about 587,000 trees were ash species, accounting for about 16 percent of the total urban tree canopy in the city. Based on the 2014 inventory, there were 27,369 green ash (c), comprising 14.1% of total street trees. There were 3990 (2.1%) white ash (Fraxinus americana L.) and 208 (1.1%) other ash species.
In 2008, to help Milwaukee communities become aware of the safety risk of ash trees on their private properties, the Forestry Division within Department of Public Works mapped out the distribution of ash trees throughout residential and business districts within the city. They employed a combination of high-resolution remotely sensed hyperspectral and Lidar data to detect the presence of ash trees [34], and their results identified over 15,000 parcels in the city with ash trees. Their analysis was evaluated using field surveys, which showed 84% overall accuracy and 93% accuracy for large trees. These data in the form of ArcGIS polygon files illustrate whether or not each parcel in Milwaukee had ash trees at the time of the analysis (Figure 1).
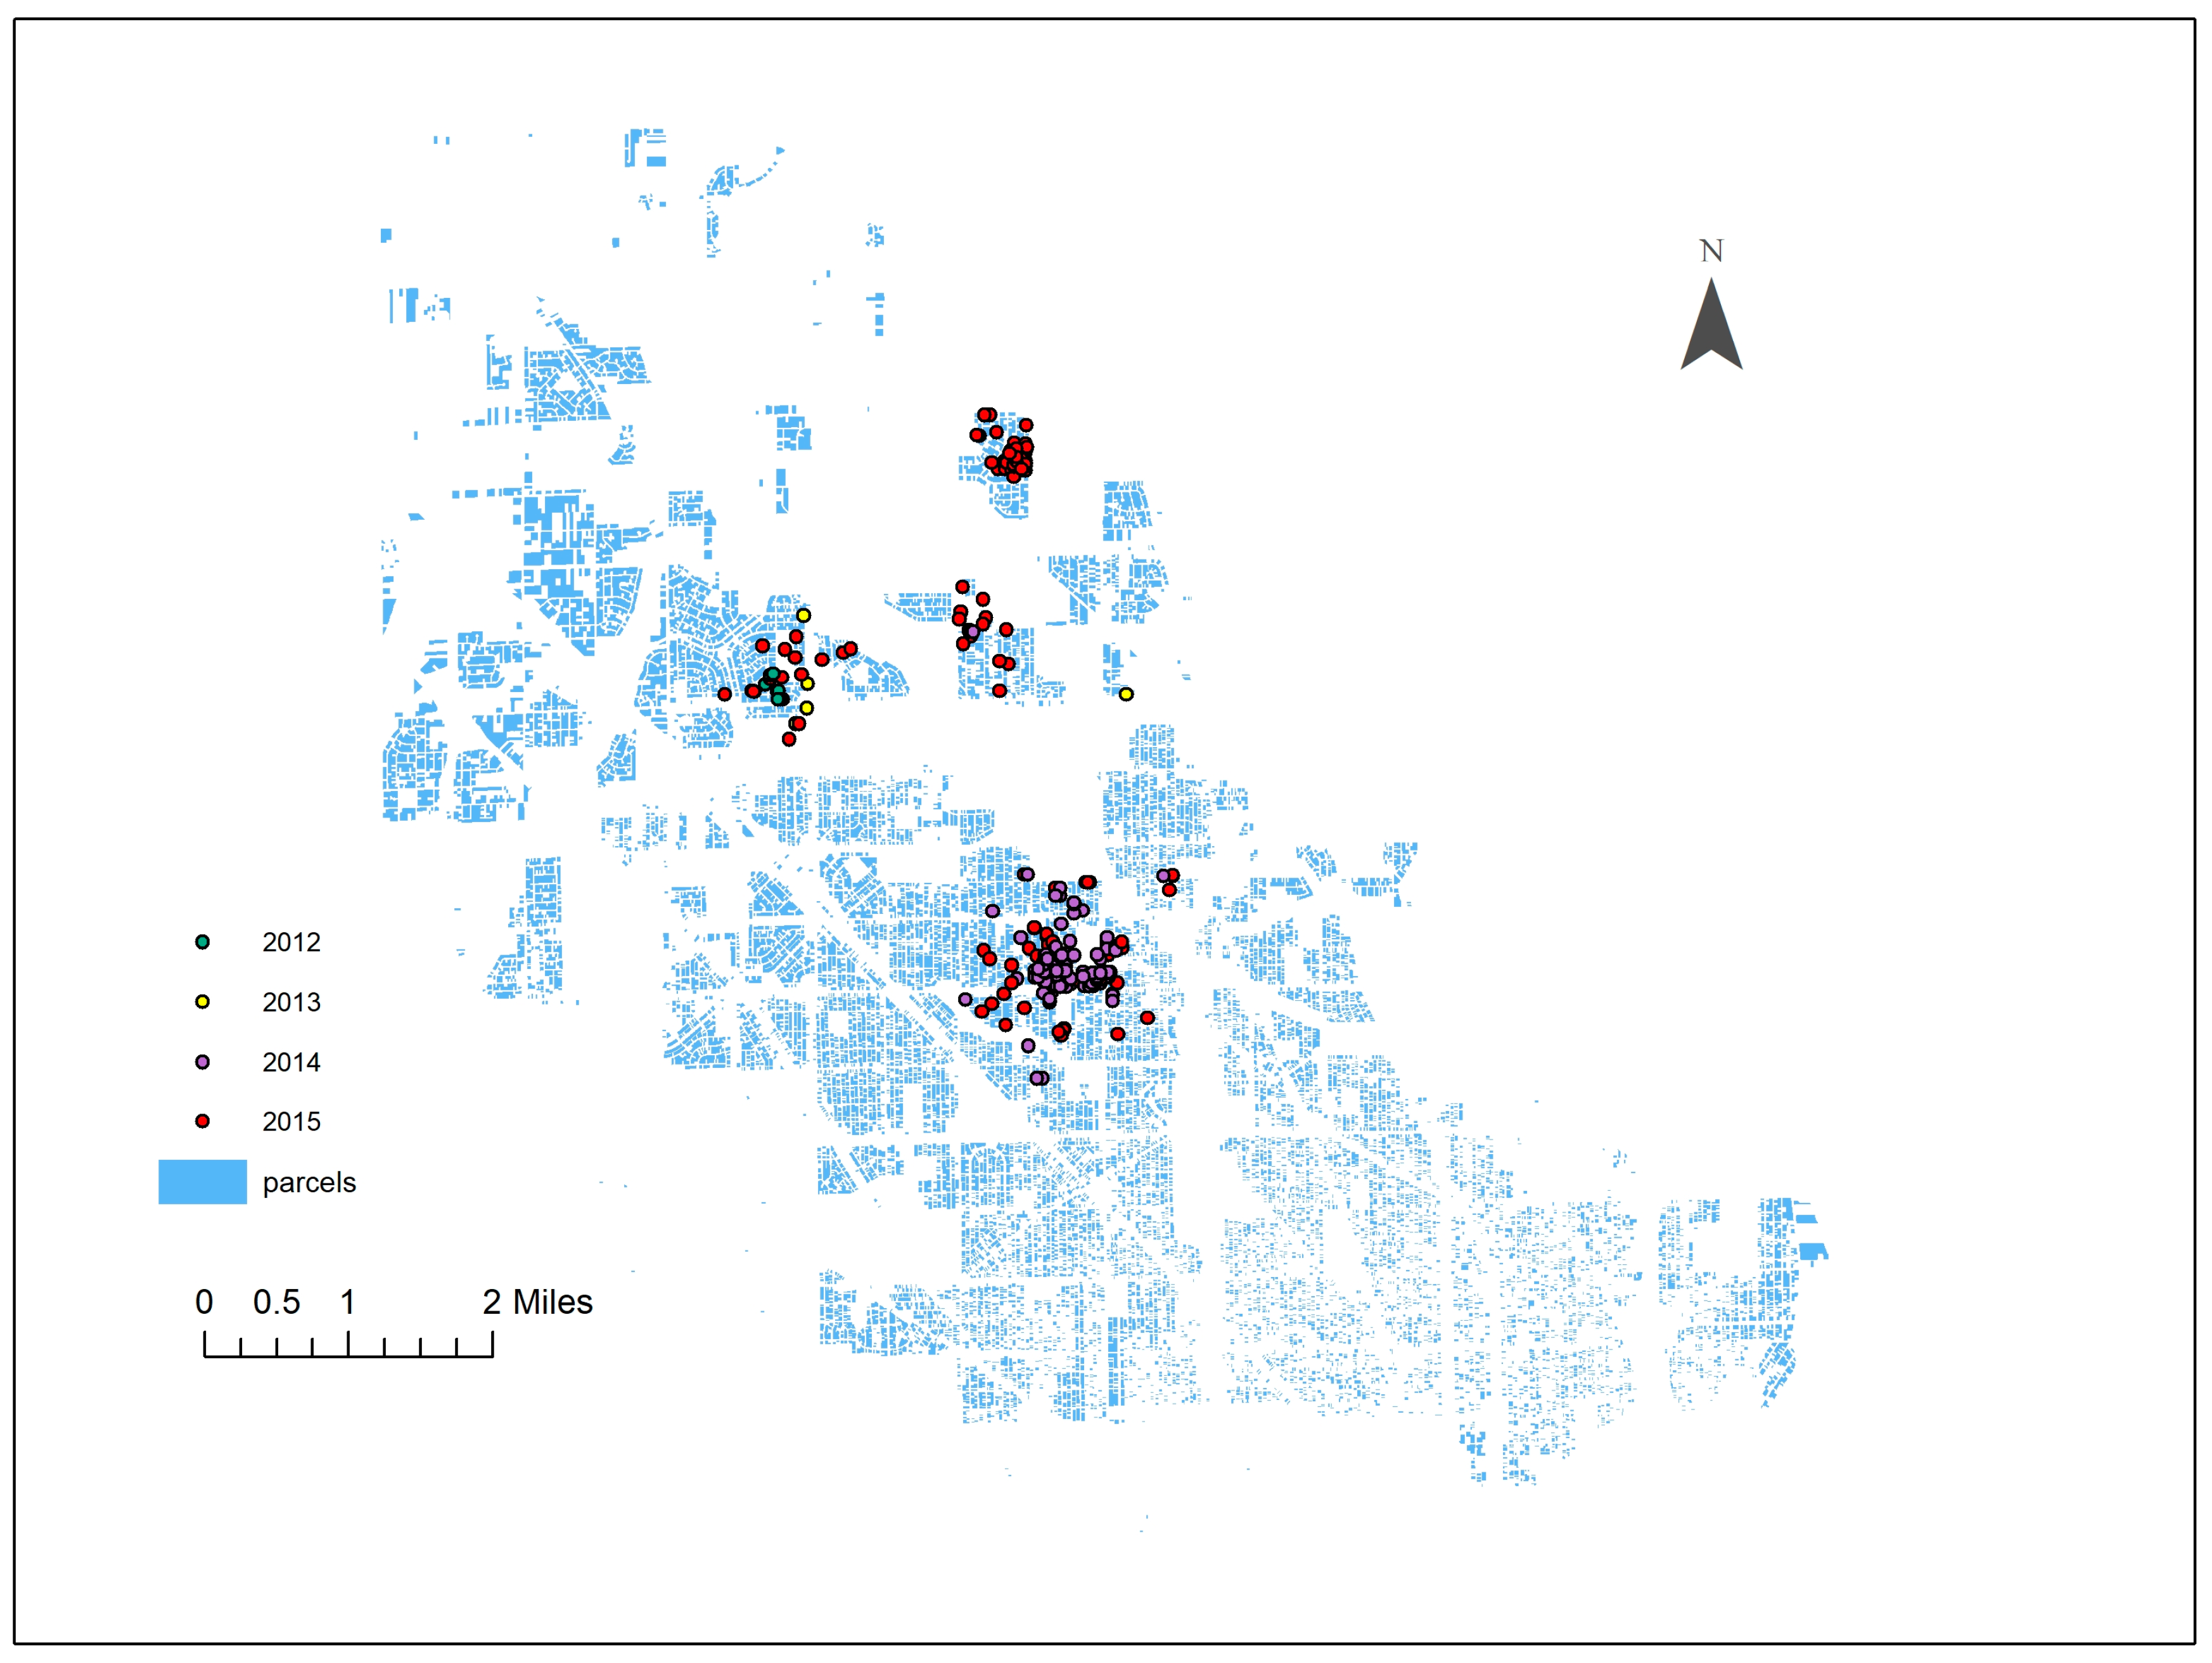
Since the arrival of EAB in 2012, Milwaukee has conducted field surveys to track the spread of EAB infestation. The inventory provides information on each infested ash tree in the city, including the year detected, tree size, street address, and location (longitude and latitude). In our study, we only focus on the northern part of Milwaukee (including ten zip codes) where most of the infested ash trees were located. There are only several infested ash trees located outside of our study area. They are also far away from the study area, which will not impact the property sale price in our analysis. The distribution of ash trees infested with EAB in the northern part of the city (our study area) from 2012 to 2015 is shown in Figure 2. As can be seen, EAB spread quickly throughout these neighborhoods.
To determine the impact of ash tree damages caused by EAB on residential property values, we obtained residential property sale data from CoreLogic for the northern part of Milwaukee (same 10 zip codes as in Figure 2) from 2008 to 2015. These data included various property characteristics, including size of living area, total lot size, number of bathrooms, number of bedrooms, number of stories, age of the building, size of basement area, size of garage or parking area, and whether the property building had air conditioning, fireplace, or pool. Moreover, the property sale data provided sale prices and geographic locations for each property. We included property sale data from 2008 to 2011 as a control to identify the impact of ash trees on property values before and after the outbreak of EAB.
Land cover in neighborhoods can also influence property values [35,36]. We constructed land cover variables based on EPA EnviroAtlas satellite data (2010) using rasters of 1-meter resolution [37]. The three types of land cover variables used for analysis include water, trees or forest, and grass or herbaceous plants. Land cover was assumed to be constant during the study period. In addition, we constructed variables of distances from the properties to the nearest highway, railway, and airport based on U.S. Census Bureau TIGER shapefiles (2014), as they have been shown to influence the residential property value in urban areas [38].
From the above datasets, we constructed a set of property characteristic variables for analysis, listed in Table 1. Variable is defined at four different levels, including parcel level (within property boundaries), 0.1 km buffer, 0.5 km buffer, and 1 km buffer (Table 1). Note, these buffers are overlapping circles, rather than donuts. At the parcel level, is a dummy variable that indicates whether or not the parcel has ash trees. For the other three levels, variable is defined as the percentage of properties located within the buffer that have ash trees on their parcels. It is worth noting that the definition of is different from most of the previous studies in the literature, which usually look at the percentage of tree cover within buffer areas. Here we do not know the number of ash trees within each property’s boundary. We also could not identify the ash tree size, tree species, and age in our dataset which could impact the home sale prices. This would be one limitation of our analysis. Variable is defined as the number of EAB infested ash trees located within the parcel or different buffer levels in different years. Variable is defined as a dummy variable, which equals 1 if the sales happen after 2012, and is otherwise 0. Variable , another dummy variable, is defined as 1 if there are infested ash trees within 1000 m buffer in year t; otherwise it is 0. We also calculated the percentage of the buffer area (1 km) around each property covered by each land cover type as explanatory variables.
Within the study area, roughly equal proportions of the land area within 1 km of sales properties were covered by trees/forest and grass/herbaceous plants (27% each; Table 1). Nearly one third (31%) of sales parcels contained ash trees, and similar proportions of parcels within buffers up to 1 km surrounding sales parcels also contained ash trees (27–30% of parcels). These statistics suggest that, in terms of the ash component of the urban landscape, sales parcels were generally representative of other residential parcels within the study area.
The summary statistics which describe the spread of EAB are listed in Table 2. These measurements were based on the field surveys consistently conducted over four years. It shows that 16 ash trees were infested in 2012, with 34 infested trees in 2013, 240 infested trees in 2014, and 528 infested trees in 2015 (Table 2). The sizes of the infested ash trees ranged from 3 to 40 inches, with a mean of 17.0 inches. However, very few EAB-infested trees occurred on sales properties. In 2015, there were only four property sales with infested ash trees identified on the parcel. If we assume the sale price could be impacted by the EAB infested ash trees located within a 1 km buffer, there would be 222 property sales impacted in 2015.
4. Model Specification
4.1. Traditional Hedonic Model
A fixed-effect hedonic model was estimated to address the potential for spatially correlated omitted variables in the model specification. The base model used to estimate the effects of ash trees
where is the sale price for property i at time t, is a vector of property-specific characteristics and distance measurements, measurements (distance to road, railway, and airport) are included in the model in both linear and quadratic functional forms, τt is the time fixed-effect for the year of sale, ωi is the spatial fixed effect specified based on the zip code of the sales property, and is the equation error. This model is estimated for the years 2008–2011 to test the hypothesis that ash trees enhanced residential property values prior to the EAB outbreak.
After the outbreak of EAB, the damages from EAB infestation would impact the property sales. In Model 2, we constructed a fixed-effect hedonic model following the previous literature, which linked the forest pest infestation together with property sale values.
The property sale data for estimating Model 2 run from 2012 to 2015. A statistically significant negative coefficient estimate associated with would suggest that the presence of infested trees in the vicinity of residential properties decreases property value. The model is separately estimated for each of the four different spatial specifications—parcel level, and the 0.1 km, 0.5 km, and 1.0 km buffers (Table 1).
4.2. Quasi-Experimental Design
A limitation of the Model 2 specification is that it does not provide information on whether the capitalized value of the entire stock of ash trees is affected by the EAB outbreak. After the arrival of EAB, both infested and healthy ash trees had the potential to affect property values. This limitation is addressed in Model 3, which estimates whether a structural change occurred in the capitalized value of ash trees after the arrival of EAB. We construct a difference-in-difference model following the quasi-experiment design, which could test the specific treatment effect by comparing the changes in sale prices before and after the outbreak of EAB between the properties with ash trees in the neighborhood and the other properties in the study area.
The property sale data for estimation is from 2008 to 2015. The hypothesis being tested here is that the presence of infested ash trees within a 1 km buffer of the sales parcel provides a signal that other ash trees near the property are at risk of becoming infested in the near future.
Finally, in Model 5, we tested whether the presence of ash trees, the occurrence of an EAB infestation within 1 km, and the severity of an outbreak within 1 km affect property value.
Using the parameter estimates obtained from Model 3, the percentage change in property values, resulting from a possible structural change in the capitalized value of ash trees located around properties which do not have EAB infestation within 1 km buffers, would be the sum for the period after 2012. Further, the percentage change in property values due to changes in capitalized value for ash trees plus the capitalized value of a localized (within 1 km buffer) risk of EAB infestation would be the sum after 2012. Using the delta method, we were able to test whether these summed values were statistically different than 0.
5. Results
During the study period from 2008 to 2015, there were 4502 single-family property sales reported in our dataset. Among these properties, 30.7% of properties had ash trees on their parcels. On average, about 27.4% of properties within 1 km of a property sale had ash trees on their parcel.
5.1. Before the Outbreak of Emerald Ash Borer (EAB)
In the four years prior to the EAB outbreak (2008 to 2011), there were 1710 residential property sales recorded in the city of Milwaukee. The coefficient estimates for variables in the hedonic model generally showed significant impacts on property value, except the number of bedrooms, pool present at the parcel, and the percentage of land covered by water within a 1 km buffer of the parcel (Table 3). Both the linear and quadratic terms of the distance variables are significant. Property sale price is positively correlated with distance to a highway within 5.857 km, and then turns negative with increasing distance to highway. The coefficient estimates of distance to a railway or airport show similar patterns, but with the opposite signs compared with distance to a highway.
Variables related to “greenness” are seen to enhance residential property values in Milwaukee (Table 3). One percent increase in Grass/Herbaceous plants is seen to increase property values by about 0.52% when located on the sales parcel, and by about 0.44–0.46% when located in buffers surrounding the parcel. The presence of tree cover was found to have a relatively larger enhancement value for residential properties. A one percentage point increase in Trees/Forest on sales parcels is seen to increase home value by about 1.7% and by about 1.44–1.51% when located in surrounding buffer zones. Using average home values in the study area (Table 1), a one percentage point increase (decrease) in tree cover on the sales parcel can be seen to increase (decrease) sales value by about $1934. Additionally, the presence of ash trees, which are a common street-tree species, further enhance home values by adding a premium to the capitalized value of urban trees. Although statistically insignificant at the parcel level, a one percentage point increase in the percentage of properties surrounding sales properties that contain ash trees increases the value of sales parcels from 0.17–0.76%. This means that a one percentage point increase (decrease) in the percent of properties containing an ash component of tree cover in buffers surrounding sales parcels can increase (decrease) sales value by roughly $188–$865.
5.2. After the Outbreak of Emerald Ash Borer (EAB)
The presence of EAB-infested trees in nearby locations, combined with media attention given to the growing outbreak, likely raised awareness among city residents that the entire stock of ash trees in Milwaukee was at risk of infestation and death. This type of forward-looking behavior might be detected in sales data, where EAB-infested ash trees are located in relatively close proximity to sales properties. As the impact of nearby EAB-infested ash trees on home sales prices may be rather subtle, a substantial number of observations that possibly include forward-looking behavior would be needed to detect a measurable effect with statistical significance. Within our data, this possibility is suggested, as the number of property sales within 0.1–1 km of EAB-infested trees ranges from 54 to 484 observations, respectively, representing roughly 2–17% of the 2792 sales after the EAB outbreak.
Model 2 includes EAB detections in the model specification, and results indicate that residents in the general vicinity of known EAB detections were negatively impacted in terms of property values by the outbreak (Table 4). While results are only statistically significant at the 1 km buffer level, and the impacts per tree on housing price are rather small, this result may reflect an inadequate number of impacted property sales to detect significant impacts for the other buffer levels. However, Model 2 suggests that nearby EAB detections provide a signal to homeowners that ash resources in their neighborhood are at risk of infestation.
Model 3 provided a more nuanced test of the hypothesis that residential property owners were forward-looking and perceived a risk that healthy ash trees on, or close to, their property may become infested in the future. The results of Model 3 estimation generally indicated that the capitalized value of the entire stock of ash trees located near sales properties decreased as the EAB infestation spread (Table 5). Two measures illustrate this result. First, by summing the coefficient estimates obtained for ash trees over the entire study period (γ) and during the post-outbreak period (), a diminishment in the capitalized value of ash trees is observed that is statistically significant within each of the buffer zones (Sum 1 = ). For example, prior to the EAB outbreak, a one percentage point increase in the number of properties containing ash trees located within 0.5 km of sales properties increased property values by about 0.76% (Table 3). However, after the outbreak began, the marginal percentage increase in home value from properties containing ash located in that buffer was only about 0.20%. Both of these parameter estimates are significant at the 0.01 level. Second, adding the parameter estimate for the variable indicating that an EAB infected tree had been located within 1 km of the sales parcel to the previous measure (Sum 2 = ) can be seen to further reduce the capitalized value of ash trees. The existence of a healthy ash tree would no longer statistically beneficial to the community.
In Model 4, which includes the severity of EAB outbreak within a 1 km buffer in the model specification, it is noted that the coefficient estimates for Ash*Outbreak are still negative but no longer significant (Table 6). This is due to a high degree of correlation between this interaction variable (indicating the occurrence of EAB) and the severity of an EAB outbreak (the number of infested trees). Further, the negative effects from EAB-infested ash trees within a 1 km buffer are shown to be significant at the parcel level and all buffer levels. These results suggest that one additional EAB-infested ash tree within a 1 km buffer of a property decreases sales price by 0.1%. Based upon the average home price, this result suggests that the decrease in sales price due to one additional EAB-infested ash tree within a 1km buffer is about $114. Looking at estimates of Sum 1 and Sum 2, it can be seen that these coefficient estimates are similar to those estimates from Model 3 and indicate that the capitalized value of nearby stocks of ash trees diminished after the onset of the EAB outbreak.
6. Discussion and Conclusions
In our study, we conducted a hedonic analysis to investigate the impacts of the outbreak of EAB on household property values in Milwaukee, Wisconsin. Our results show that, in general, tree cover was positively capitalized into property values, and that prior to the arrival of EAB, ash trees added a premium to the general value of tree cover. Although this value premium is not found for ash trees located on individual sales parcels, it is consistently found for ash trees located at various buffer distances in surrounding neighborhoods, suggesting that healthy ash trees (as well as tree cover of general types of urban forest) provide a public good that is capitalized into home values. It is suggested that the ash tree premium may be due to their widespread use as street trees within the study area.
Notably, the value premium attributed to ash trees throughout the study area (northern 10 zip codes in Milwaukee) is dramatically diminished after the arrival of EAB infestation. This result holds true for the entire study area, whether or not EAB-infested trees were found near sales properties, and suggests that homeowners have forward-looking expectations regarding tree health in their neighborhoods. These expectations are capitalized into diminishing values for ash trees. In general, static models that only evaluate the impacts from existing damages to trees from insects and diseases will likely produce downwardly-biased damage estimates in cases where biological invasions are expanding.
Although the capitalized value of ash trees diminished during the study period, our estimates suggest they still contributed positive value to homeowners. This result may reflect the fact that preventive measures, such as the use of insecticides, can protect ash tree health. Or, this result may also reflect the fact that our study was conducted during the early stages of the EAB outbreak. Whether or not ash trees retain a positive capitalized value during the later stages of an invasion is unknown. However, we note that previous research has indicated that once an insect invasion reaches a threshold value, all host trees, regardless of health condition, are capitalized into negative values by homeowners [21]. The fact that our Milwaukee case study represents just one of many urban forested areas impacted by EAB suggests that further analysis of this problem is warranted to help urban forest managers understand the trade-offs between the cost and benefits of protective management activities.
While treatment ash trees are implemented on a two-year cycle in Milwaukee, there have not yet been enough trees replanted for the lost ones. The plan is to replace removed ash trees with diverse species of trees that are more resilient to biotic stressors and climate change. In our study, the outbreak of EAB in Milwaukee is still in the early stage. Therefore, we did not consider the replacement programs in the analysis. It will generally take a long time for the newly-planted trees to grow back. The replacement programs should be able to increase property value in the long run. This would also warrant further hedonic study to investigate the benefits from replacement management practices.
Our study result is highly flexible and useful for other non-native forest insects and pathogens. In the evaluation studies of these long-lasting effects, more studies examining the dynamic response of property values from invasive species are needed. Not only the tree health conditions, but also the treatment and replacement procedures could impact property sale values, as they could potentially change the expectation of property values based on our analysis results. Tracking the change of property value related to invasive species during all the stages, including infestation, removal, treatment, and restoration, would be useful to guide long-term management plans.
The EAB infestation is posing a significant threat of reduction in ecosystem services provided by ash tree canopies. The value estimates from the hedonic model represent the portion of value of ecosystem services provided by ash trees to the family residential properties, including largely aesthetic views, recreational opportunities, and cultural values of trees. Comparing the estimates from ash trees before and after the EAB infestation, we would be able to check the degradation of these ecosystem services. However, the total economic value of benefits from numerous ecosystem services provided by ash trees are not captured in the hedonic study. Further studies are needed to investigate the reduction of value for other types of ecosystem services from EAB infestation, such as carbon sequestration, reductions in stormwater runoff, or wildlife habitat.
Author Contributions
Methodology: X.L., T.P.H., and K.J.B.; Formal analysis: X.L.; Resources: X.L., K.J.B., T.P.H. and C.D.N; Writing—original draft preparation: X.L; Writing—review and editing: X.L, T.P.H. and K.J.B.; C.D.N., and E.V.C.; Funding acquisition: T.P.H. and C.D.N.
Funding
This research was funded by the Forest Health Research and Education Center, University of Kentucky and the USDA Forest Service, Southern Research Station.
Acknowledgments
We thank Terrell Baker and Andrew Stainback for encouraging this research at the outset. We thank David Sivyer for providing data resources about EAB infestation in Milwaukee.
Conflicts of Interest
The authors declare no conflict of interest.
References
- Cappaert, D.; McCullough, D.G.; Poland, T.M.; Siegert, N.W. Emerald Ash Borer in North America: A Research and Regulatory Challenge. Am. Entomol. 2005, 51, 152–165. [Google Scholar] [CrossRef] [Green Version]
- Kovacs, K.F.; Haight, R.G.; McCullough, D.G.; Mercader, R.J.; Siegert, N.W.; Liebhold, A.M. Cost of potential emerald ash borer damage in U.S. communities, 2009–2019. Ecol. Econ. 2010, 69, 569–578. [Google Scholar] [CrossRef]
- Herms, D.A.; McCullough, D.G. Emerald Ash Borer Invasion of North America: History, Biology, Ecology, Impacts, and Management. Ann. Rev. Entomol. 2013, 59, 13–30. [Google Scholar] [CrossRef]
- Kovacs, K.F.; Mercader, R.J.; Haight, R.G.; Siegert, N.W.; McCullough, D.G.; Liebhold, A.M. The influence of satellite populations of emerald ash borer on projected economic costs in U.S. communities, 2010–2020. J. Environ. Manag. 2011, 92, 2170–2181. [Google Scholar] [CrossRef]
- Sydnor, T.D.; Bumgardner, M.; Todd, A. The potential economic impacts of emerald ash borer (Agrilus planipennis) on Ohio, US, communities. Arboric. Urban For. 2007, 33, 48–54. [Google Scholar]
- Sydnor, T.D.; Bumgardner, M.; Subburayalu, S. Community ash densities and economic impact potential of emerald ash borer (Agrilus planipennis) in four Midwestern states. Aboriculture Urban For. 2011, 37, 84–89. [Google Scholar]
- Sander, H.; Polasky, S.; Haight, R.G. The value of urban tree cover: A hedonic property price model in Ramsey and Dakota Counties, Minnesota, USA. Ecol. Econ. 2010, 69, 1646–1656. [Google Scholar] [CrossRef]
- Siriwardena, S.D.; Boyle, K.J.; Holmes, T.P.; Wiseman, P.E. The implicit value of tree cover in the U.S.: A meta-analysis of hedonic property value studies. Ecol. Econ. 2016, 128, 68–76. [Google Scholar] [CrossRef]
- Mei, Y. Demand for urban tree cover: A two-stage hedonic price analysis in California. For. Policy Econ. 2017, 83, 29–35. [Google Scholar] [CrossRef]
- Rosenberger, R.S.; Bell, L.A.; Champ, P.A.; Smith, E.L. Nonmarket Economic Values of Forest Insect Pests: An Updated Literature Review; Gen. Tech. Rep. RMRS-GTR-275WWW; US Department of Agriculture, Forest Service, Rocky Mountain Research Station: Fort Collins, CO, USA, 2012; Volume 275, 46p.
- Aukema, J.E.; Leung, B.; Kovacs, K.; Chivers, C.; Britton, K.O.; Englin, J.; Frankel, S.J.; Haight, R.G.; Holmes, T.P.; Liebhold, A.M.; et al. Economic Impacts of Non-Native Forest Insects in the Continental United States. PLoS ONE 2011, 6, e24587. [Google Scholar] [CrossRef]
- Arnberger, A.; Schneider, I.E.; Ebenberger, M.; Eder, R.; Venette, R.C.; Snyder, S.A.; Gobster, P.H.; Choi, A.; Cottrell, S. Emerald ash borer impacts on visual preferences for urban forest recreation settings. Urban For. Urban Green. 2017, 27, 235–245. [Google Scholar] [CrossRef]
- Jones, B.A. Invasive Species Impacts on Human Well-being Using the Life Satisfaction Index. Ecol. Econ. 2017, 134, 250–257. [Google Scholar] [CrossRef]
- Jones, B.A.; McDermott, S.M. Health impacts of invasive species through an altered natural environment: Assessing air pollution sinks as a causal pathway. Environ. Resour. Econ. 2018, 71, 23–43. [Google Scholar] [CrossRef]
- Jones, B.A.; McDermott, S.M. Linking environmental management to health outcomes: A case study of the emerald ash borer. Appl. Econ. Lett. 2015, 22, 1409–1414. [Google Scholar] [CrossRef]
- Donovan, G.H.; Butry, D.T.; Michael, Y.L.; Prestemon, J.P.; Liebhold, A.M.; Gatziolis, D.; Mao, M.Y. The Relationship between Trees and Human Health: Evidence from the Spread of the Emerald Ash Borer. Am. J. Prev. Med. 2013, 44, 139–145. [Google Scholar] [CrossRef] [PubMed]
- Anderson, L.M.; Cordell, H.K. Residential Property Values Improved by Landscaping with Trees. South. J. Appl. For. 1985, 9, 162–166. [Google Scholar] [CrossRef]
- Kovacs, K.F.; Haight, R.G.; Mercader, R.J.; McCullough, D.G. A bioeconomic analysis of an emerald ash borer invasion of an urban forest with multiple jurisdictions. Resour. Energy Econ. 2014, 36, 270–289. [Google Scholar] [CrossRef]
- Mcpherson, E.G.; Simpson, J.R.; Peper, P.J.; Maco, S.E.; Gardner, S.L.; Cozad, S.K.; Xiao, Q.; Sievert, R.; Hermann, J. City of Minneapolis, Minnesota Municipal Tree Resource Analysis; Center for Urban Forest Research, USDA Forest Service, Pacific Southwest Research Station: Davis, CA, USA, 2005; Volume 1, p. 25.
- Cohen, J.; Blinn, C.E.; Boyle, K.J.; Holmes, T.P.; Moeltner, K. Hedonic valuation with translating amenities: Mountain Pine Beetles and host trees in the Colorado Front Range. Environ. Resour. Econ. 2016, 63, 613–642. [Google Scholar] [CrossRef]
- Holmes, T.P.; Murphy, E.A.; Bell, K.P.; Royle, D.D. Property Value Impacts of Hemlock Woolly Adelgid in Residential Forests. For. Sci. 2010, 56, 529–540. [Google Scholar] [CrossRef]
- Kovacs, K.; Holmes, T.P.; Englin, J.E.; Alexander, J. The dynamic response of housing values to a forest invasive disease: Evidence from a sudden oak death infestation. Environ. Resour. Econ. 2011, 49, 445–471. [Google Scholar] [CrossRef]
- Dombrow, J.; Rodriguez, M.; Sirmans, C.F. The market value of mature trees in single-family housing markets. Apprais. J. 2000, 68, 39–43. [Google Scholar]
- Tyrväinen, L.; Miettinen, A. Property Prices and Urban Forest Amenities. J. Environ. Econ. Manag. 2000, 39, 205–223. [Google Scholar] [CrossRef] [Green Version]
- Netusil, N.R.; Chattopadhyay, S.; Kovacs, K.F. Estimating the demand for tree canopy: A second-stage hedonic price analysis in Portland, Oregon. Land Econ. 2010, 86, 281–293. [Google Scholar] [CrossRef]
- Huggett, R.J.; Murphy, E.A.; Holmes, T.P. Forest disturbance impacts on residential property values. In The Economics of Forest Disturbances; Springer: Berlin/Heidelberg, Germany, 2008; pp. 209–228. [Google Scholar]
- Holmes, T.P.; Aukema, J.E.; Von Holle, B.; Liebhold, A.; Sills, E. Economic impacts of invasive species in forests. Ann. N. Y. Acad. Sci. 2009, 1162, 18–38. [Google Scholar] [CrossRef] [PubMed]
- Price, J.I.; McCollum, D.W.; Berrens, R.P. Insect infestation and residential property values: A hedonic analysis of the mountain pine beetle epidemic. For. Policy Econ. 2010, 12, 415–422. [Google Scholar] [CrossRef]
- Hansen, W.D.; Naughton, H.T. The effects of a spruce bark beetle outbreak and wildfires on property values in the wildland–urban interface of south-central Alaska, USA. Ecol. Econ. 2013, 96, 141–154. [Google Scholar] [CrossRef]
- Kiefer, H. The house price determination process: Rational expectations with a spatial context. J. Hous. Econ. 2011, 20, 249–266. [Google Scholar] [CrossRef]
- Bayer, P.; McMillan, R.; Murphy, A.; Timmins, C. A Dynamic Model of Demand for Houses and Neighborhoods; National Bureau of Economic Research Working Paper Series; No. 17250; National Bureau of Economic Research: Cambridge, MA, USA, 2011. [Google Scholar] [CrossRef]
- Severen, C.; Costello, C.; Deschênes, O. A Forward-Looking Ricardian Approach: Do land markets capitalize climate change forecasts? J. Environ. Econ. Manag. 2018, 89, 235–254. [Google Scholar] [CrossRef] [Green Version]
- Bishop, K.C.; Murphy, A.D. Valuing Time-Varying Attributes Using the Hedonic Model: When Is a Dynamic Approach Necessary? Rev. Econ. Stat. 2019, 101, 134–145. [Google Scholar] [CrossRef]
- Sivyer, D. Mapping the future for EAB readiness and response planning in Milwaukee. For. Source 2010, 15, 12–15. [Google Scholar]
- Irwin, E.G. The effects of open space on residential property values. Land Econ. 2002, 78, 465–480. [Google Scholar] [CrossRef]
- Paterson, R.W.; Boyle, K.J. Out of sight, out of mind? Using GIS to incorporate visibility in hedonic property value models. Land Econ. 2002, 78, 417–425. [Google Scholar] [CrossRef]
- Pickard, B.R.; Daniel, J.; Mehaffey, M.; Jackson, L.E.; Neale, A. EnviroAtlas: A new geospatial tool to foster ecosystem services science and resource management. Ecosyst. Serv. 2015, 14, 45–55. [Google Scholar] [CrossRef] [Green Version]
- Survey, U.S.G. NLCD 2014 Land Cover-National Geospatial Data Asset (NGDA) Land Use Land Cover; U.S. Geological Survey: Reston, VA, USA, 2014.
Figure 1.
Parcels with ash trees in Milwaukee.

Figure 2.
Distribution of emerald ash borer (EAB) infestation from 2012 to 2015 in our study area (northern part of Milwaukee).
Figure 2.
Distribution of emerald ash borer (EAB) infestation from 2012 to 2015 in our study area (northern part of Milwaukee).


Table 1.
Descriptive Statistics of Property Characteristic Variables (n = 4502). (EAB = emerald ash borer).
Table 1.
Descriptive Statistics of Property Characteristic Variables (n = 4502). (EAB = emerald ash borer).
| Variable | Means | Standard Deviations | Description |
|---|---|---|---|
| Ln(Sale price) | 11.642 | 0.009 | Log transformation of sale price ($2005) |
| Living area | 1.462 | 0.010 | 1000 ft2 |
| Lot size | 7.647 | 0.106 | 1000 ft2 |
| Baths | 1.900 | 0.012 | Number |
| Bedrooms | 3.200 | 0.012 | Number |
| Age | 65.000 | 0.372 | Home age at sale; Years |
| Stories | 1.200 | 0.006 | Number |
| Air conditioning | 67% | 0.7% | 1 if air-conditioned; 0 otherwise |
| Fireplace | 32% | 0.9% | 1 if has fireplace; 0 otherwise |
| Pool | 2% | 0.2% | 1 if a pool present; 0 otherwise |
| Basement area | 1.029 | 0.005 | 1000 ft2 |
| Garage area | 0.410 | 0.002 | 1000 ft2 |
| Distance to highway | 2.300 | 0.030 | Kilometers |
| Distance to railway | 4.700 | 0.100 | Kilometers |
| Distance to Airport | 16.800 | 0.200 | Kilometers |
| Water | 1% | 0.1% | Percentage of land covered by water in 1 km buffer of parcel |
| Trees/Forest % | 27% | 0.1% | Percentage of land covered by trees and forest in 1 km buffer of parcel |
| Grass/herbaceous plants % | 27% | 0.1% | Percentage of land covered by grass & herbaceous plants in 1 km buffer of parcel |
| Ash_parcel | 31% | 0.7% | 1 if ash trees on the parcel; 0 otherwise |
| Ash_buffer0.1 | 30% | 0.2% | Percentage of properties located within 0.1 km buffer of parcel that have ash trees |
| Ash_buffer0.5 | 28% | 0.2% | Percentage of properties located within 0.5 km buffer of parcel that have ash trees |
| Ash_buffer1.0 | 27% | 0.1% | Percentage of properties located within 1 km buffer of parcel that have ash trees |
| EAB_parcel | 0.002 | 0.001 | Number of EAB infested ash trees within the parcel |
| EAB_buffer0.1 | 0.047 | 0.011 | Number of EAB infested ash trees within 0.1 km buffer of parcel |
| EAB_buffer0.5 | 1.217 | 0.142 | Number of EAB infested ash trees within 0.5 km buffer of parcel |
| EAB_buffer1.0 | 3.803 | 0.298 | Number of EAB infested ash trees within 1 km buffer of parcel |
| post | 0.620 | 0.007 | 1 if sale occurred after 2011; 0 otherwise |
| outbreak | 0.033 | 0.003 | 1 if EAB infested ash tree within 1 km of parcel |
Table 2.
The Number of emerald ash borer (EAB) Infested Ash Trees and Impacted Properties with Sales.
Table 2.
The Number of emerald ash borer (EAB) Infested Ash Trees and Impacted Properties with Sales.
| Year | Total EAB | Parcel | Buffer 0.1 km | Buffer 0.5 km | Buffer 1 km |
|---|---|---|---|---|---|
| 2012 | 16 | 0 | 1 | 13 | 32 |
| 2013 | 34 | 1 | 7 | 29 | 66 |
| 2014 | 240 | 0 | 12 | 81 | 164 |
| 2015 | 528 | 4 | 34 | 137 | 222 |
| Total | 5 | 54 | 260 | 484 |
Table 3.
Coefficient Estimates of Hedonic Model 1, Home Sales 2008–2011 (N = 1710).
| Variable | Parcel | Buffer 0.1 km | Buffer 0.5 km | Buffer 1 km |
|---|---|---|---|---|
| Living area | 0.212 *** | 0.214 *** | 0.215 *** | 0.214 *** |
| (0.029) | (0.029) | (0.029) | (0.029) | |
| Lot size | 0.006 *** | 0.004 ** | 0.004 ** | 0.004 ** |
| (0.001) | (0.002) | (0.002) | (0.002) | |
| Baths | 0.069 *** | 0.070 *** | 0.068 *** | 0.068 *** |
| (0.014) | (0.014) | (0.014) | (0.014) | |
| Bedrooms | 0.010 | 0.008 | 0.010 | 0.008 |
| (0.012) | (0.012) | (0.012) | (0.012) | |
| Age | −0.002 *** | −0.002 *** | −0.002 *** | −0.002 *** |
| (0.0004) | (0.0004) | (0.0004) | (0.0004) | |
| Stories | 0.082 *** | 0.084 *** | 0.081 *** | 0.083 *** |
| (0.029) | (0.029) | (0.029) | (0.029) | |
| Air conditioning | 0.105 *** | 0.106 *** | 0.105 *** | 0.105 *** |
| (0.015) | (0.015) | (0.015) | (0.015) | |
| Fireplace | 0.092 *** | 0.089 *** | 0.091 *** | 0.092 *** |
| (0.016) | (0.016) | (0.016) | (0.016) | |
| Pool | 0.014 | 0.007 | 0.013 | 0.011 |
| (0.052) | (0.052) | (0.052) | (0.052) | |
| Basement area | 0.125 *** | 0.131 *** | 0.124 *** | 0.127 *** |
| (0.037) | (0.037) | (0.036) | (0.036) | |
| Garage parking area | 0.329 *** | 0.323 *** | 0.325 *** | 0.324 *** |
| (0.049) | (0.049) | (0.049) | (0.049) | |
| Distance to highway | 0.041 *** | 0.043 *** | 0.044 *** | 0.043 *** |
| (0.014) | (0.014) | (0.014) | (0.014) | |
| Square Distance to highway | −0.007 *** | −0.007 *** | −0.007 *** | −0.007 *** |
| (0.002) | (0.002) | (0.002) | (0.002) | |
| Distance to Railway | −0.036 *** | −0.034 *** | −0.032 *** | −0.030 *** |
| (0.011) | (0.011) | (0.011) | (0.011) | |
| Square Distance to Railway | 0.003 *** | 0.003 *** | 0.003 *** | 0.003 *** |
| (0.001) | (0.001) | (0.001) | (0.001) | |
| Distance to Airport | −0.030 *** | −0.030 *** | −0.028 *** | −0.028 *** |
| (0.006) | (0.006) | (0.006) | (0.006) | |
| Square Distance to Airport | 0.001 *** | 0.001 *** | 0.001 *** | 0.001 *** |
| (0.0002) | (0.0002) | (0.0002) | (0.0002) | |
| Water | 0.151 | 0.132 | 0.059 | −0.009 |
| (0.322) | (0.321) | (0.323) | (0.326) | |
| Trees/Forest | 1.664 *** | 1.514 *** | 1.437 *** | 1.429 *** |
| (0.206) | (0.211) | (0.225) | (0.220) | |
| Grass/herbaceous plants | 0.517 *** | 0.461 ** | 0.440 ** | 0.454 ** |
| (0.194) | (0.194) | (0.196) | (0.195) | |
| Ash | 0.005 | 0.165 *** | 0.757 ** | 0.380 *** |
| (0.015) | (0.056) | (0.095) | (0.129) | |
| constant | 10.678 | 10.700 *** | 10.665 *** | 10.539 *** |
| (0.154) | (0.154) | (0.154) | (0.161) | |
| Adjust R2 | 0.7558 | 0.7570 | 0.7567 | 0.7570 |
Note: *** denotes significant at the 1% level, ** denotes significant at the 5% level, * denotes significant at the 10% level. Standard errors in parentheses.
Table 4.
Coefficient Estimates of Hedonic Model 2, emerald ash borer (EAB) Detections, 2012–2015 (n = 2792).
Table 4.
Coefficient Estimates of Hedonic Model 2, emerald ash borer (EAB) Detections, 2012–2015 (n = 2792).
| Variable | Parcel | Buffer 0.1 km | Buffer 0.5 km | Buffer 1 km |
|---|---|---|---|---|
| EAB | 0.0006 | 0.0055 | −0.0005 | −0.0006 *** |
| (0.054) | (0.0060) | (0.0005) | (0.0002) | |
| Adjusted R2 | 0.7737 | 0.7738 | 0.7738 | 0.7742 |
Note: *** denotes significant at the 1% level, ** denotes significant at the 5% level, * denotes significant at the 10% level. Standard errors in parentheses.
Table 5.
Coefficient Estimates of Hedonic Model 3 for Ash and emerald ash borer (EAB) variables, 2008–2015 (n = 4502).
Table 5.
Coefficient Estimates of Hedonic Model 3 for Ash and emerald ash borer (EAB) variables, 2008–2015 (n = 4502).
| Variable | Parcel | Buffer 0.1 km | Buffer 0.5 km | Buffer 1 km |
|---|---|---|---|---|
| Ash | 0.007 | 0.183 *** | 0.298 *** | 0.393 *** |
| (0.016) | (0.049) | (0.075) | (0.101) | |
| Ash*Post | −0.002 | −0.066 | −0.102 | −0.204 ** |
| (0.020) | (0.056) | (0.077) | (0.098) | |
| Ash*Outbreak | −0.021 | −0.066 | −0.093 * | −0.095 * |
| (0.028) | (0.048) | (0.051) | (0.054) | |
| Adjusted R2 | 0.7647 | 0.7657 | 0.7658 | 0.7657 |
| Sum 1 | −0.005 | 0.117 *** | 0.196 *** | 0.188 ** |
| (0.040) | (0.042) | (0.064) | (0.090) | |
| Sum 2 | −0.026 | 0.050 | 0.103 | 0.093 |
| (0.043) | (0.059) | (0.078) | (0.100) |
Note: *** denotes significant at the 1% level, ** denotes significant at the 5% level, * denotes significant at the 10% level. Standard errors in parentheses.
Table 6.
Coefficient Estimates of Hedonic Model 4, Ash and emerald ash borer (EAB), 2008–2015 (n = 4502).
Table 6.
Coefficient Estimates of Hedonic Model 4, Ash and emerald ash borer (EAB), 2008–2015 (n = 4502).
| Variable | Parcel | Buffer 0.1 km | Buffer 0.5 km | Buffer 1 km |
|---|---|---|---|---|
| Ash | 0.007 | 0.182 *** | 0.301 *** | 0.393 *** |
| (0.016) | (0.049) | (0.075) | (0.101) | |
| Ash*Post | −0.005 | −0.070 | −0.104 | −0.210 ** |
| −(0.020) | −(0.056) | −(0.077) | −(0.098) | |
| Ash*Outbreak | 0.001 | −0.011 | −0.033 | −0.044 |
| (0.029) | (0.054) | (0.058) | (0.060) | |
| EAB_Buffer3 | −0.001 *** | −0.001 ** | −0.001 ** | −0.001 * |
| (0.0002) | (0.0003) | (0.0003) | (0.0003) | |
| Adjusted R2 | 0.7650 | 0.7659 | 0.7660 | 0.7658 |
| Sum 1 | −0.011 | 0.112 *** | 0.198 *** | 0.183 ** |
| (0.040) | (0.042) | (0.064) | (0.090) | |
| Sum 2 | −0.010 | 0.100 | 0.164 ** | 0.139 |
| (0.044) | (0.063) | (0.083) | (0.103) |
Note: *** denotes significant at the 1% level, ** denotes significant at the 5% level, * denotes significant at the 10% level. Standard errors in parentheses.
© 2019 by the authors. Licensee MDPI, Basel, Switzerland. This article is an open access article distributed under the terms and conditions of the Creative Commons Attribution (CC BY) license (http://creativecommons.org/licenses/by/4.0/).
Share and Cite
MDPI and ACS Style
Li, X.; Holmes, T.P.; Boyle, K.J.; Crocker, E.V.; Nelson, C.D. Hedonic Analysis of Forest Pest Invasion: the Case of Emerald Ash Borer. Forests 2019, 10, 820. https://doi.org/10.3390/f10090820
AMA Style
Li X, Holmes TP, Boyle KJ, Crocker EV, Nelson CD. Hedonic Analysis of Forest Pest Invasion: the Case of Emerald Ash Borer. Forests. 2019; 10(9):820. https://doi.org/10.3390/f10090820
Chicago/Turabian StyleLi, Xiaoshu, Thomas P. Holmes, Kevin J. Boyle, Ellen V. Crocker, and C. Dana Nelson. 2019. "Hedonic Analysis of Forest Pest Invasion: the Case of Emerald Ash Borer" Forests 10, no. 9: 820. https://doi.org/10.3390/f10090820
Note that from the first issue of 2016, this journal uses article numbers instead of page numbers. See further details here.