Long- and Short-Term Inorganic Nitrogen Runoff from a Karst Catchment in Austria

 ,
,
Abstract
:
1. Introduction
2. Methods
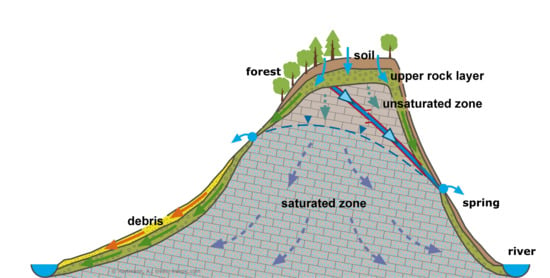
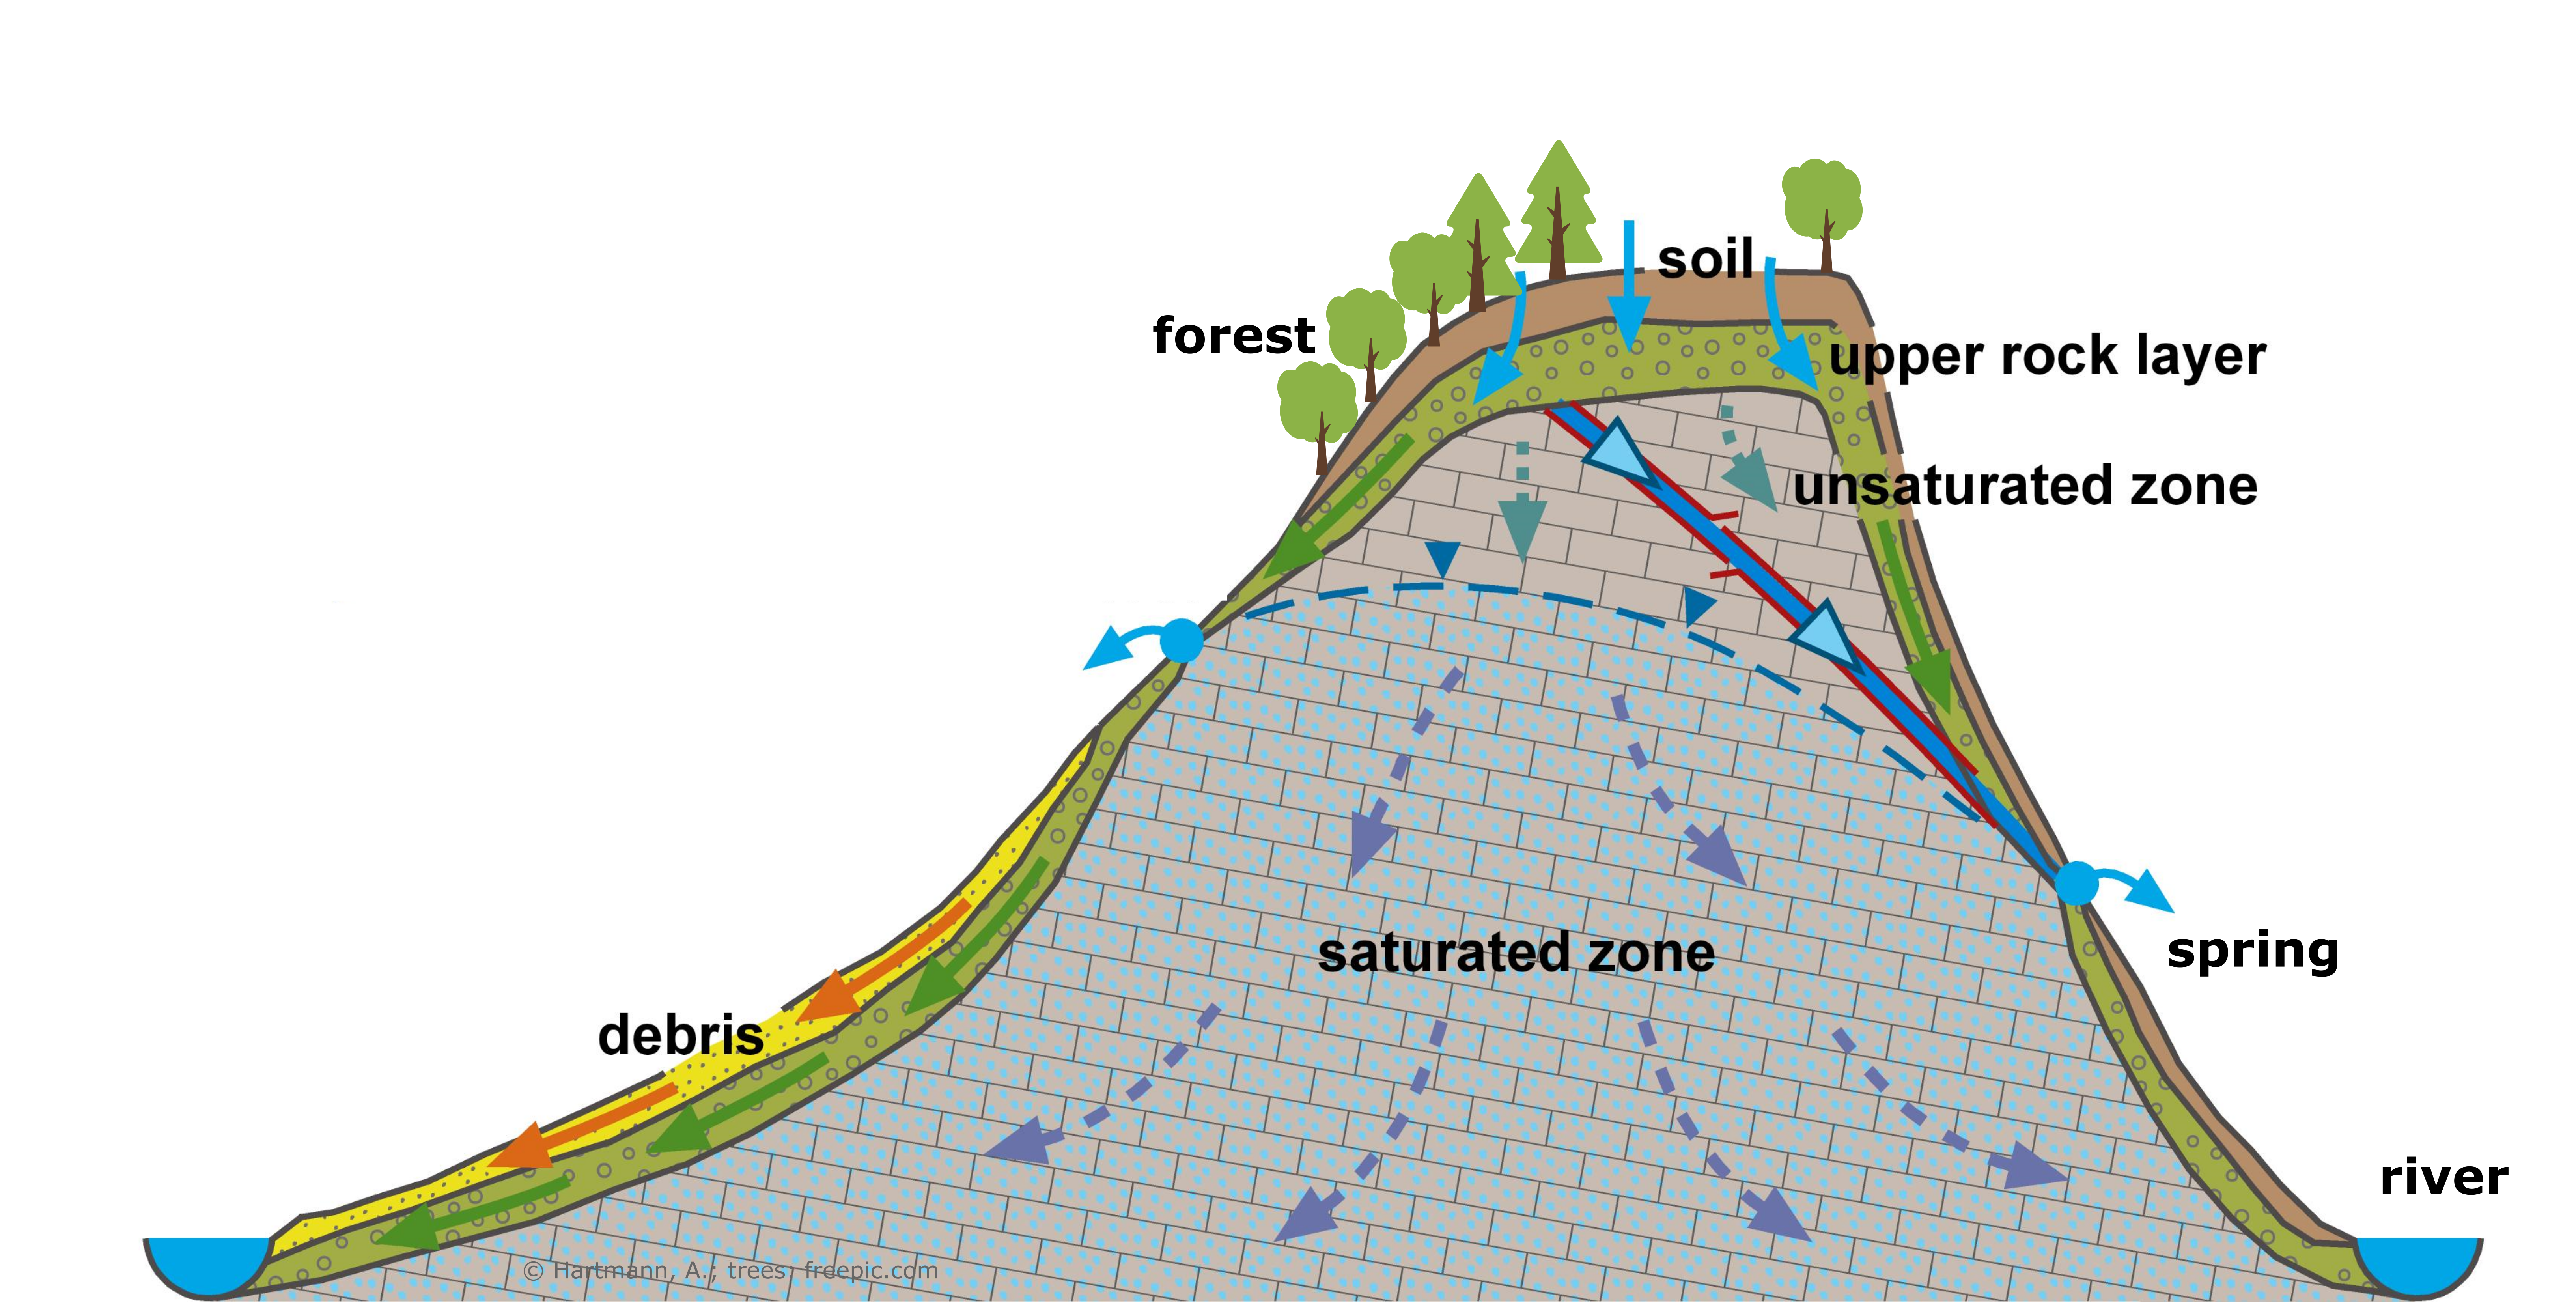
2.1. Study Site
2.2. Climate and Air Pollution
2.3. Foliage Nutrient Concentrations
2.4. Soil Chemistry
2.5. Catchment Hydrology and N Measurements
2.6. Hydrochemical Modelling
3. Results
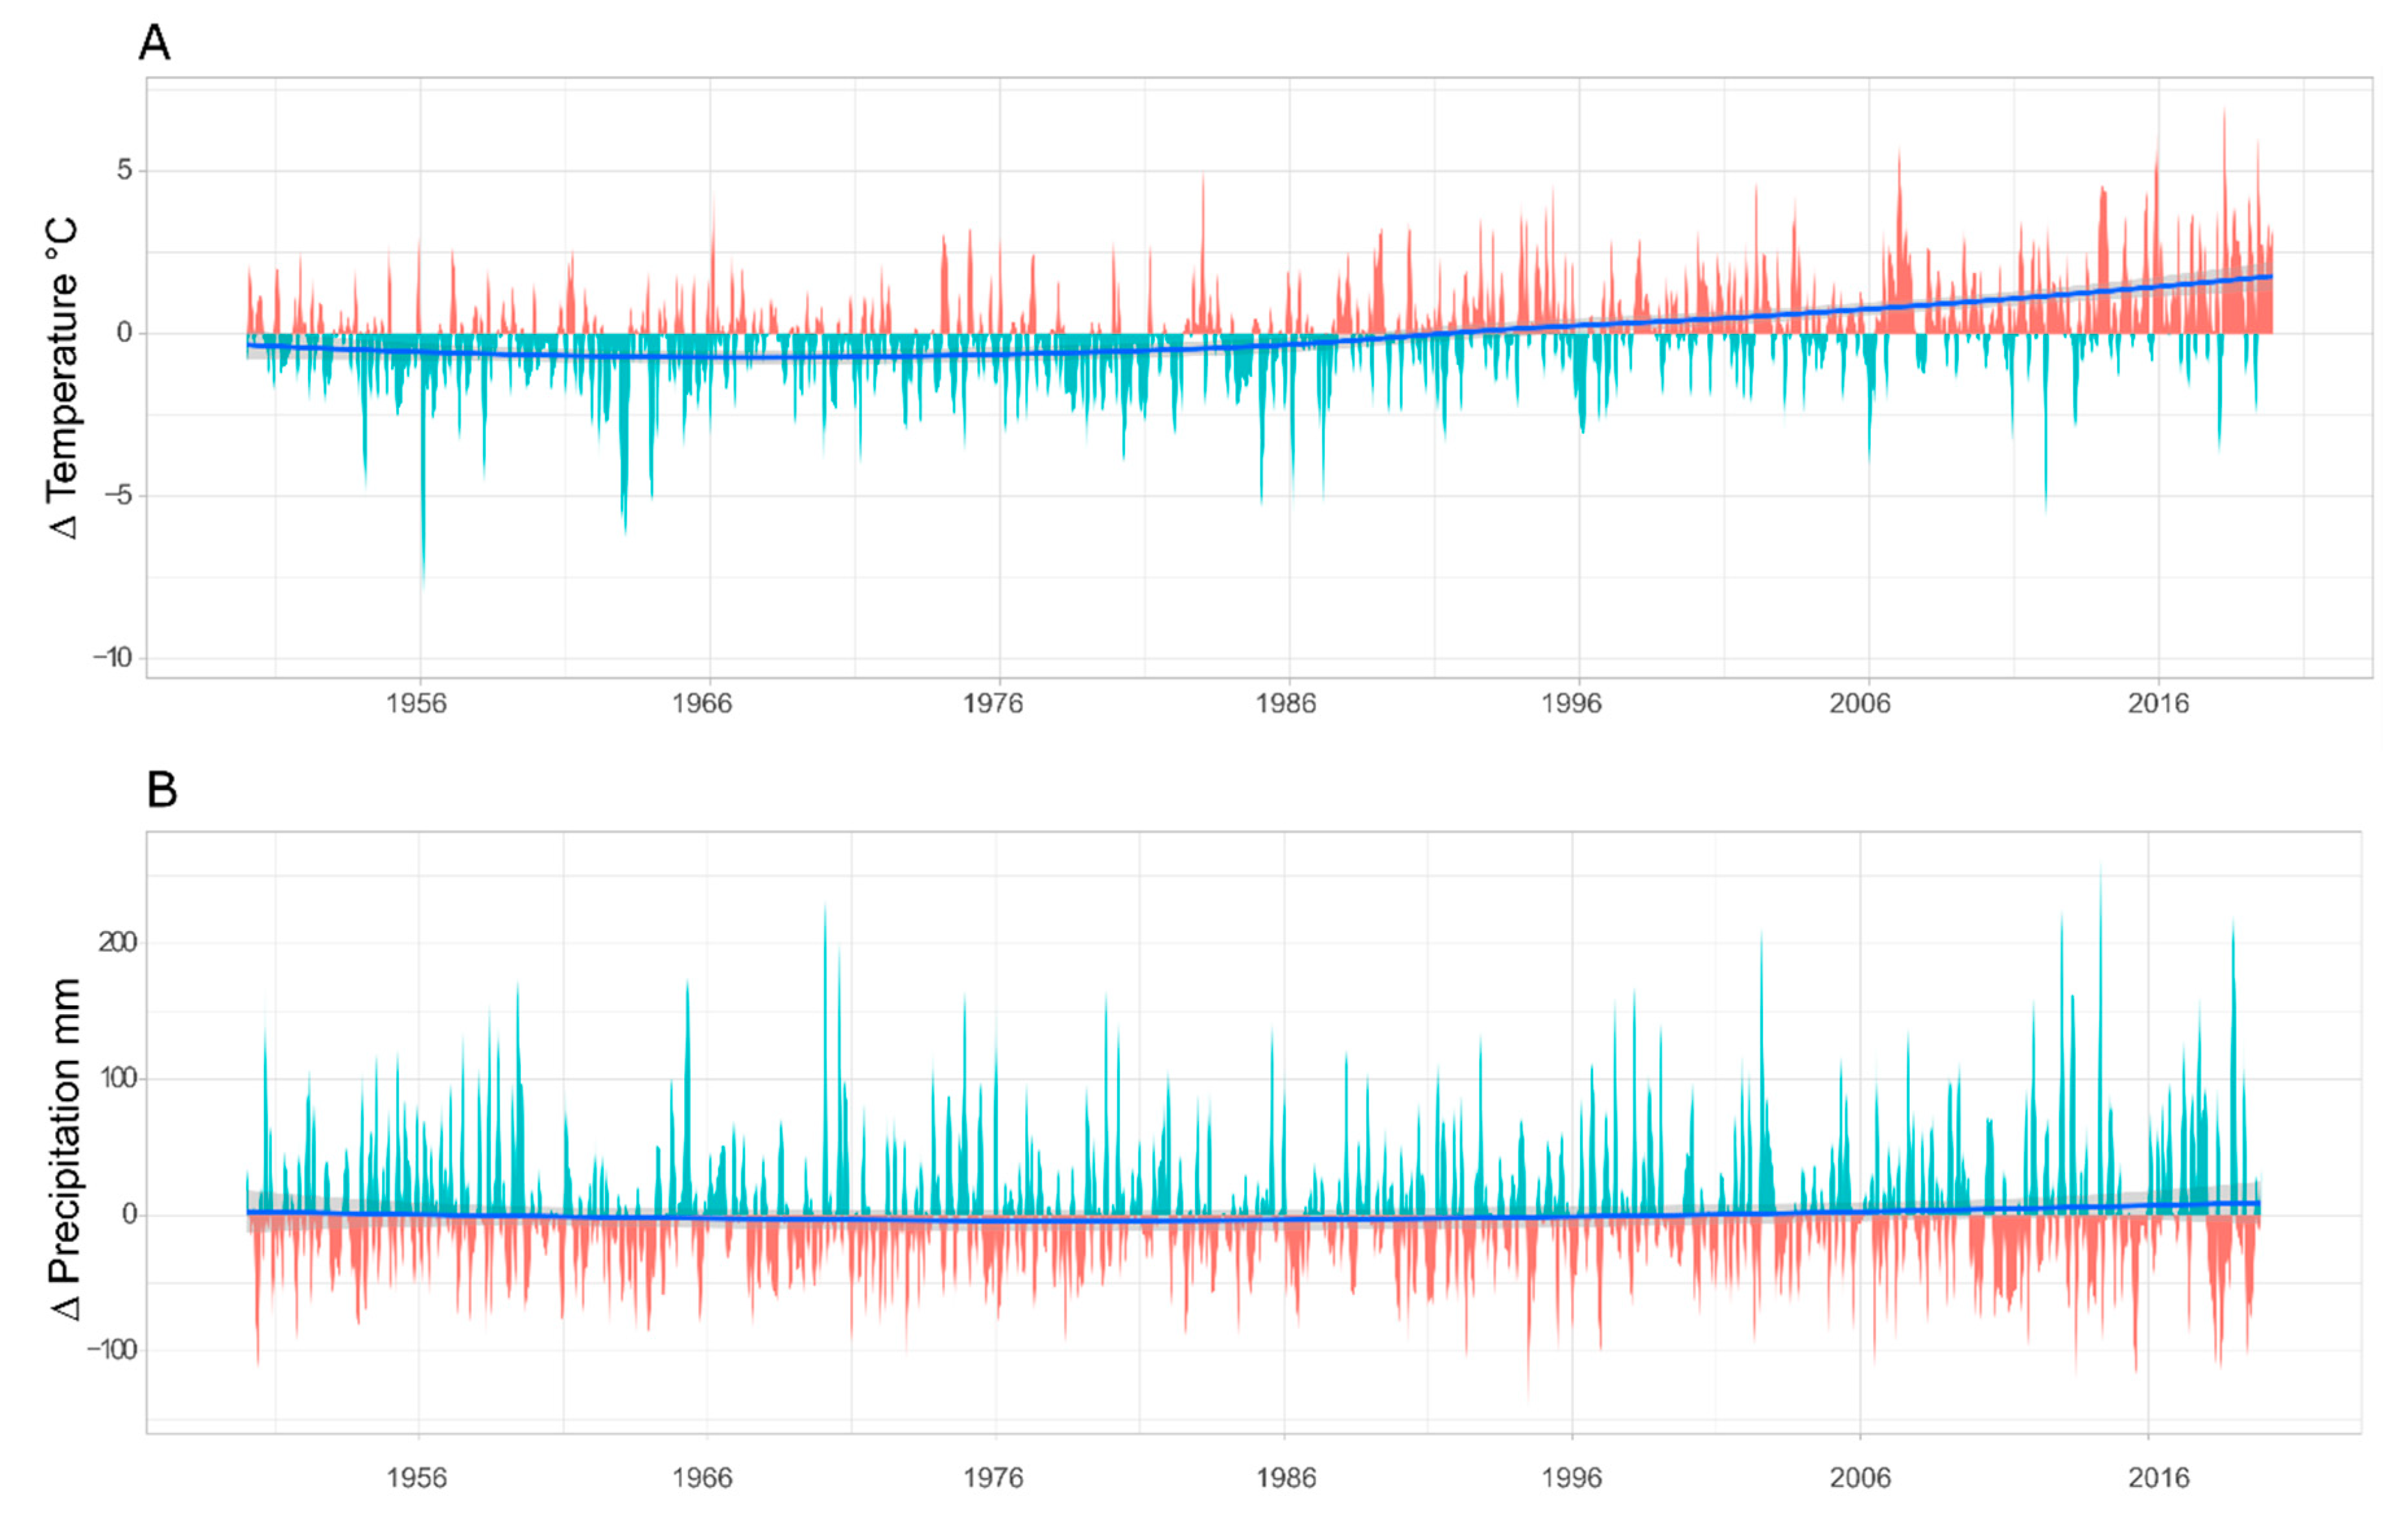
3.1. Climate and Deposition Trends
3.2. Foliage Nutrient Concentrations
3.3. Soil N, C, and C:N Ratio
3.4. Long Term Changes in N Discharge
3.5. Future Projections of Climate and Discharge
4. Discussion
4.1. Catchment N Retention
4.2. Long-Term Trends Versus Short Pulses
4.3. Expected Future Pathways
5. Conclusions
Author Contributions
Funding
Acknowledgments
Conflicts of Interest
References
- Bobbink, R.; Hicks, K.; Galloway, J.; Spranger, T.; Alkemade, R.; Ashmore, M.; Bustamante, M.; Cinderby, S.; Davidson, E.; Dentener, F.; et al. Global assessment of nitrogen deposition effects on terrestrial plant diversity: A synthesis. Ecol. Appl. 2010, 20, 30–59. [Google Scholar] [CrossRef] [PubMed] [Green Version]
- de Vries, W.; Du, E.; Butterbach-Bahl, K. Short and long-term impacts of nitrogen deposition on carbon sequestration by forest ecosystems. Curr. Opin. Environ. Sustain. 2014, 9, 90–104. [Google Scholar] [CrossRef]
- Gruber, N.; Galloway, J.N. An Earth-system perspective of the global nitrogen cycle. Nature 2008, 451, 293–296. [Google Scholar] [CrossRef] [PubMed]
- Yue, K.; Peng, Y.; Peng, C.; Yang, W.; Peng, X.; Wu, F. Stimulation of terrestrial ecosystem carbon storage by nitrogen addition: A meta-analysis. Sci. Rep. 2016, 6, 19895. [Google Scholar] [CrossRef] [Green Version]
- Vet, R.; Artz, R.S.; Carou, S.; Shaw, M.; Ro, C.-U.; Aas, W.; Baker, A.; van Bowersox, C.; Dentener, F.; Galy-Lacaux, C.; et al. A global assessment of precipitation chemistry and deposition of sulfur, nitrogen, sea salt, base cations, organic acids, acidity and pH, and phosphorus. Atmos. Environ. 2014, 93, 3–100. [Google Scholar] [CrossRef]
- EMEP. Transboundary Particulate Matter, Photo-Oxidants, Acidifying and Eutrophying Components; EMEP Status Report; EMEP(MSC-W of EMEP): Oslo, Norway, 2017. [Google Scholar]
- Schmitz, A.; Sanders, T.; Bolte, A.; Bussotti, F.; Dirnböck, T.; Johnson, J.; Penuelas, J.; Pollastrini, M.; Prescher, A.-K.; Sardans, J.; et al. Responses of forest ecosystems in Europe to decreasing nitrogen deposition. Environ. Pollut. 2019, 244, 980–994. [Google Scholar] [CrossRef]
- Dirnböck, T.; Pröll, G.; Austnes, K.; Beloica, J.; Beudert, B.; Canullo, R.; de Marco, A.; Fornasier, M.F.; Futter, M.; Georgen, K.; et al. Currently legislated decreases in nitrogen deposition will yield only limited plant species recovery in European forests. Environ. Res. Lett. 2018, 13, 125010. [Google Scholar] [CrossRef] [Green Version]
- Amann, M.; Anderl, M.; Borken-Kleefeld, J.; Cofala, J.; Heyes, C.; Höglund-Isaksson, L.; Kiesewetter, G.; Klimont, Z.; Moosmann, L.; Rafaj, P.; et al. Progress towards the Achievement of the EU’s Air Quality and Emissions Objectives; IIASA: Laxenburg, Austria, 2018. [Google Scholar]
- COST. COST 65: Hydrogeological Aspects of Groundwater Protection in Karstic Areas—Final Report. EUROPEAN COMMISSION Directorate-General XII Science, Research and Development Environment Research Programme; European Commission: Luxenbourg, 1995; p. 446. [Google Scholar]
- Ford, D.; Wiliams, P. Karst Hydrology and Geomorphology; Wiley: New York, NY, USA, 2007. [Google Scholar]
- Jandl, R.; Smidt, S.; Schindlbacher, A.; Englisch, M.; Zechmeister-Boltenstern, S.; Mikovits, C.; Schöftner, P.; Strebl, F.; Fuchs, G. The carbon and nitrogen biogeochemistry of a montane Norway spruce (Picea abies (L.) Karst.) forest: A synthesis of long-term research. Plant Ecol. Divers. 2012, 5, 105–114. [Google Scholar] [CrossRef] [Green Version]
- Jost, G.; Dirnböck, T.; Grabner, M.-T.; Mirtl, M. Nitrogen Leaching of Two Forest Ecosystems in a Karst Watershed. Water Air AMP Soil Pollut. 2011, 218, 633–649. [Google Scholar] [CrossRef]
- Grimvall, A.; Stålnacke, P.; Tonderski, A. Time scales of nutrient losses from land to sea—A European perspective. Ecol. Eng. 2000, 14, 363–371. [Google Scholar] [CrossRef]
- Sutton, M.A.; Howard, C.M.; Erisman, J.W.; Billen, G.; Bleeker, A.; Grennfelt, P.; van Grinsven, H.; Grizzetti, B. (Eds.) The European Nitrogen Assessment; Cambridge University Press: Cambridge, UK, 2011. [Google Scholar]
- Aber, J.; McDowell, W.; Nadelhoffer, K.; Magill, A.; Berntson, G.; Kamakea, M.; McNulty, S.; Currie, W.; Rustad, L.; Fernandez, I. Nitrogen saturation in temperate forest ecosystems: Hypotheses revisited. BioScience 1998, 48, 921–934. [Google Scholar] [CrossRef]
- Lovett, G.M.; Goodale, C.L. A new conceptual model of nitrogen saturation based on experimental Nitrogen addition to an oak forest. Ecosystems 2011, 14, 615–631. [Google Scholar] [CrossRef]
- Vuorenmaa, J.; Augustaitis, A.; Beudert, B.; Bochenek, W.; Clarke, N.; de Wit, H.A.; Dirnböck, T.; Frey, J.; Hakola, H.; Kleemola, S.; et al. Long-term changes (1990–2015) in the atmospheric deposition and runoff water chemistry of sulphate, inorganic nitrogen and acidity for forested catchments in Europe in relation to changes in emissions and hydrometeorological conditions. Sci. Total Environ. 2018, 625, 1129–1145. [Google Scholar] [CrossRef] [PubMed] [Green Version]
- Vuorenmaa, J.; Augustaitis, A.; Beudert, B.; Clarke, N.; de Wit, H.A.; Dirnböck, T.; Frey, J.; Forsius, M.; Indriksone, I.; Kleemola, S.; et al. Long-term sulphate and inorganic nitrogen mass balance budgets in European ICP Integrated Monitoring catchments (1990–2012). Ecol. Indic. 2017, 76, 15–29. [Google Scholar] [CrossRef]
- Groffman, P.M.; Driscoll, C.T.; Durán, J.; Campbell, J.L.; Christenson, L.M.; Fahey, T.J.; Fisk, M.C.; Fuss, C.; Likens, G.E.; Lovett, G.; et al. Nitrogen oligotrophication in northern hardwood forests. Biogeochemistry 2018, 141, 523–539. [Google Scholar] [CrossRef]
- Horn, K.J.; Thomas, R.Q.; Clark, C.M.; Pardo, L.H.; Fenn, M.E.; Lawrence, G.B.; Perakis, S.S.; Smithwick, E.A.H.; Baldwin, D.; Braun, S.; et al. Growth and survival relationships of 71 tree species with nitrogen and sulfur deposition across the conterminous U.S. PLoS ONE 2018, 13, e0205296. [Google Scholar] [CrossRef] [PubMed]
- Braun, S.; Schindler, C.; Rihm, B. Growth trends of beech and Norway spruce in Switzerland: The role of nitrogen deposition, ozone, mineral nutrition and climate. Sci. Total Environ. 2017, 599–600, 637–646. [Google Scholar] [CrossRef]
- Solberg, S.; Dobbertin, M.; Reinds, G.J.; Lange, H.; Andreassen, K.; Fernandez, P.G.; Hildingsson, A.; de Vries, W. Analyses of the impact of changes in atmospheric deposition and climate on forest growth in European monitoring plots: A stand growth approach. For. Ecol. Manag. 2009, 258, 1735–1750. [Google Scholar] [CrossRef]
- Lilleskov, E.A.; Kuyper, T.W.; Bidartondo, M.I.; Hobbie, E.A. Atmospheric nitrogen deposition impacts on the structure and function of forest mycorrhizal communities: A review. Environ. Pollut. 2019, 246, 148–162. [Google Scholar] [CrossRef]
- van der Linde, S.; Suz, L.M.; Orme, C.D.L.; Cox, F.; Andreae, H.; Asi, E.; Atkinson, B.; Benham, S.; Carroll, C.; Cools, N.; et al. Environment and host as large-scale controls of ectomycorrhizal fungi. Nature 2018. [Google Scholar] [CrossRef] [Green Version]
- Templer, P.H.; Mack, M.C.; Iii, F.S.C.; Christenson, L.M.; Compton, J.E.; Crook, H.D.; Currie, W.S.; Curtis, C.J.; Dail, D.B.; D’Antonio, C.M.; et al. Sinks for nitrogen inputs in terrestrial ecosystems: A meta-analysis of 15N tracer field studies. Ecology 2012, 93, 1816–1829. [Google Scholar] [CrossRef] [PubMed] [Green Version]
- Janssens, I.A.; Dieleman, W.; Luyssaert, S.; Subke, J.A.; Reichstein, M.; Ceulemans, R.; Ciais, P.; Dolman, A.J.; Grace, J.; Matteucci, G.; et al. Reduction of forest soil respiration in response to nitrogen deposition. Nat. Geosci. 2010, 3, 315–322. [Google Scholar] [CrossRef]
- Forstner, S.J.; Wechselberger, V.; Müller, S.; Keibinger, K.M.; Díaz-Pinés, E.; Wanek, W.; Scheppi, P.; Hagedorn, F.; Gundersen, P.; Tatzber, M.; et al. Vertical Redistribution of Soil Organic Carbon Pools After Twenty Years of Nitrogen Addition in Two Temperate Coniferous Forests. Ecosystems 2019, 22, 379–400. [Google Scholar] [CrossRef] [PubMed] [Green Version]
- Dise, N.B.; Wright, R.F. Nitrogen leaching from European forests in relation to nitrogen deposition. For. Ecol. Manag. 1995, 71, 153–161. [Google Scholar] [CrossRef]
- MacDonald, J.A.; Dise, N.B.; Matzner, E.; Armbruster, M.; Gundersen, P.; Forsius, M. Nitrogen input together with ecosystem nitrogen enrichment predict nitrate leaching from European forests. Glob. Chang. Biol. 2002, 8, 1028–1033. [Google Scholar] [CrossRef]
- Moldan, F.; Hruška, J.; Evans, C.; Hauhs, M. Experimental simulation of the effects of extreme climatic events on major ions, acidity and dissolved organic carbon leaching from a forested catchment, Gårdsjön, Sweden. Biogeochemistry 2011, 107, 455–469. [Google Scholar] [CrossRef] [Green Version]
- Huber, C. Long Lasting Nitrate Leaching after Bark Beetle Attack in the Highlands of the Bavarian Forest National Park. J. Environ. Qual. 2005, 34, 1772–1779. [Google Scholar] [CrossRef]
- Kohlpaintner, M.; Huber, C.; Weis, W.; Göttlein, A. Spatial and temporal variability of nitrate concentration in seepage water under a mature Norway spruce [Picea abies (L.) Karst] stand before and after clear cut. Plant Soil 2010, 314, 285–301. [Google Scholar] [CrossRef]
- Rothe, A.; Mellert, K. Effects of Forest Management on Nitrate Concentrations in Seepage Water of Forests in Southern Bavaria, Germany. Water Air Soil Pollut 2004, 156, 337–355. [Google Scholar] [CrossRef]
- Bernal, S.; Hedin, L.O.; Likens, G.E.; Gerber, S.; Buso, D.C. Complex response of the forest nitrogen cycle to climate change. Proc. Natl. Acad. Sci. USA 2012, 109, 3406–3411. [Google Scholar] [CrossRef] [Green Version]
- Aber, J.D.; Ollinger, S.V.; Driscoll, C.T.; Likens, G.E.; Holmes, R.T.; Freuder, R.J.; Goodale, C.L. Inorganic nitrogen losses from a forested ecosystem in response to physical, chemical, biotic, and climatic perturbations. Ecosystems 2002, 5, 648–658. [Google Scholar] [CrossRef]
- Hartmann, A.; Kobler, J.; Kralik, M.; Dirnböck, T.; Humer, F.; Weiler, M. Model-aided quantification of dissolved carbon and nitrogen release after windthrow disturbance in an Austrian karst system. Biogeosciences 2016, 13, 159–174. [Google Scholar] [CrossRef] [Green Version]
- Schleppi, P.; Curtaz, F.; Krause, K. Nitrate leaching from a sub-alpine coniferous forest subjected to experimentally increased N deposition for 20 years, and effects of tree girdling and felling. Biogeochemistry 2017, 134, 319–335. [Google Scholar] [CrossRef]
- Senf, C.; Pflugmacher, D.; Zhiqiang, Y.; Sebald, J.; Knorn, J.; Neumann, M.; Hostert, P.; Seidl, R. Canopy mortality has doubled in Europe’s temperate forests over the last three decades. Nat. Commun. 2018, 9, 4978. [Google Scholar] [CrossRef] [PubMed]
- Schelhaas, M.J.; Nabuurs, G.J.; Schuck, A. Natural disturbances in the European forests in the 19th and 20th centuries. Glob. Chang. Biol. 2003, 9, 1620–1633. [Google Scholar] [CrossRef]
- Jonard, M.; Fürst, A.; Verstraeten, A.; Thimonier, A.; Timmermann, V.; Potočić, N.; Waldner, P.; Benham, S.; Hansen, K.; Merilä, P.; et al. Tree mineral nutrition is deteriorating in Europe. Glob. Chang. Biol. 2015, 21, 418–430. [Google Scholar] [CrossRef]
- Staelens, J.; Houle, D.; de Schrijver, A.; Neirynck, J.; Verheyen, K. Calculating Dry Deposition and Canopy Exchange with the Canopy Budget Model: Review of Assumptions and Application to Two Deciduous Forests. Water Air Soil Pollut. 2008, 191, 149–169. [Google Scholar] [CrossRef]
- Schöpp, W.; Posch, M.; Mylona, S.; Johansson, M. Long-term development of acid deposition (1880–2030) in sensitive freshwater regions in Europe. Hydrol. Earth Syst. Sci. 2003, 7, 436–446. [Google Scholar] [CrossRef] [Green Version]
- Mellert, K.H.; Göttlein, A. Comparison of new foliar nutrient thresholds derived from van den Burg’s literature compilation with established central European references. Eur. J. For. Res. 2012, 131, 1461–1472. [Google Scholar] [CrossRef]
- Kralik, M.; Humer, F.; Papesch, W.; Tesch, R.; Suckow, A.; Han, L.F. (Eds.) Karstwater-Ages in an Alpine Dolomite Catchment, Austria: Delta-18O, 3H, 3H/3He, CFC and Dye Tracer Investigations; EGU General Assembly: Vienna, Austria, 2009. [Google Scholar]
- Hartmann, A.; Kralik, M.; Humer, F.; Lange, J.; Weiler, M. Identification of a karst system’s intrinsic hydrodynamic parameters: Upscaling from single springs to the whole aquifer. Environ. Earth Sci. 2011, 65, 2377–2389. [Google Scholar] [CrossRef]
- Hartmann, A.; Weiler, M.; Wagener, T.; Lange, J.; Kralik, M.; Humer, F.; Mizyed, N.; Rimmer, A.; Barberá, J.A.; Andreo, B.; et al. Process-based karst modelling to relate hydrodynamic and hydrochemical characteristics to system properties. Hydrol. Earth Syst. Sci. 2013, 17, 3305–3321. [Google Scholar] [CrossRef] [Green Version]
- Hartmann, A.; Mudarra, M.; Andreo, B.; Marín, A.; Wagener, T.; Lange, J. Modeling spatiotemporal impacts of hydroclimatic extremes on groundwater recharge at a Mediterranean karst aquifer. Water Resour. Res. 2014, 50, 6507–6521. [Google Scholar] [CrossRef]
- Giorgi, F.; Jones, C.; Asrar, G.R. Addressing climate information needs at the regional level: The CORDEX framework. Bull. World Meteorol. Organ. 2009, 58, 175–183. [Google Scholar]
- Gutowski, W.J., Jr.; Giorgi, F.; Timbal, B.; Frigon, A.; Jacob, D.; Kang, H.-S.; Raghavan, K.; Lee, B.; Lennard, C.; Nikulin, G.; et al. WCRP COordinated Regional Downscaling EXperiment (CORDEX): A diagnostic MIP for CMIP6. Geosci. Model Dev. 2016, 9, 4087–4095. [Google Scholar] [CrossRef] [Green Version]
- Cinquini, L.; Crichton, D.; Mattmann, C.; Harney, J.; Shipman, G.; Wang, F.; Ananthakrishnan, R.; Miller, N.; Denvil, S.; Morgan, M.; et al. The Earth System Grid Federation: An open infrastructure for access to distributed geospatial data. Future Gener. Comput. Syst. 2014, 36, 400–417. [Google Scholar] [CrossRef]
- Adriaenssens, S.; Staelens, J.; Baeten, L.; Verstraeten, A.; Boeckx, P.; Samson, R.; Verheyen, K. Influence of canopy budget model approaches on atmospheric deposition estimates to forests. Biogeochemistry 2013, 116, 215–229. [Google Scholar] [CrossRef]
- Bobbink, R.; Hettelingh, J.P. Review and Revision of Empirical Critical Loads and Dose-Response Relationships: Proceedings of the Expert Workshop, Noordwijkerhout 23–24 June 2010; RIVM: Bilthoven, The Netherlands, 2011.
- Moldan, F.; Jutterström, S.E.A.K.; Hruška, J.; Wright, R.F. Experimental addition of nitrogen to a whole forest ecosystem at Gårdsjön, Sweden (NITREX): Nitrate leaching during 26 years of treatment. Environ. Pollut. 2018, 242, 367–374. [Google Scholar] [CrossRef]
- Patel, K.F.; Fernandez, I.J.; Nelson, S.J.; Gruselle, M.-C.; Norton, S.A.; Weiskittel, A.R. Forest N Dynamics after 25 years of Whole Watershed N Enrichment: The Bear Brook Watershed in Maine. Soil Sci. Soc. Am. J. 2019, 83, S161–S174. [Google Scholar] [CrossRef]
- Magill, A.H.; Aber, J.D.; Currie, W.S.; Nadelhoffer, K.J.; Martin, M.E.; McDowell, W.H.; Melillo, J.M.; Steudler, P. Ecosystem response to 15 years of chronic nitrogen additions at the Harvard Forest LTER, Massachusetts, USA. For. Ecol. Manag. 2004, 196, 7–28. [Google Scholar] [CrossRef]
- Michalzik, B.; Kalbitz, K.; Park, J.H.; Solinger, S.; Matzner, E. Fluxes and concentrations of dissolved organic carbon and nitrogen—A synthesis for temperate forests. Biogeochemistry 2001, 52, 173–205. [Google Scholar] [CrossRef]
- Leitner, S.; Dirnböck, T.; Kobler, J.; Zechmeister-Boltenstern, S. Legacy effects of drought on nitrate leaching in a temperate mixed forest on karst. J. Environ. Manag. 2020, 262. [Google Scholar] [CrossRef] [PubMed]
- Dirnböck, T.; Foldal, C.; Djukic, I.; Kobler, J.; Haas, E.; Kiese, R.; Kitzler, B. Historic nitrogen deposition determines future climate change effects on nitrogen retention in temperate forests. Clim. Chang. 2017, 1, 15. [Google Scholar] [CrossRef]
- Pretzsch, H.; Biber, P.; Schütze, G.; Uhl, E.; Rötzer, T. Forest stand growth dynamics in Central Europe have accelerated since 1870. Nat. Commun. 2014, 5. [Google Scholar] [CrossRef] [Green Version]
- Carrière, S.D.; Martin-StPaul, N.K.; Cakpo, C.B.; Patris, N.; Gillon, M.; Chalikakis, K.; Doussan, C.; Olioso, A.; Babic, M.; Jouineau, A.; et al. The role of deep vadose zone water in tree transpiration during drought periods in karst settings—Insights from isotopic tracing and leaf water potential. Sci. Total Environ. 2020, 699, 134332. [Google Scholar] [CrossRef]
- Wilhartitz, I.C.; Kirschner, A.K.T.; Stadler, H.; Herndl, G.J.; Dietzel, M.; Latal, C.; Mach, R.L.; Farnleitner, A.H. Heterotrophic prokaryotic production in ultraoligotrophic alpine karst aquifers and ecological implications. FEMS Microbiol. Ecol. 2009, 68, 287–299. [Google Scholar] [CrossRef]
- Jandl, R.; Smidt, S.; Mutsch, F.; Fürst, A.; Zechmeister, H.; Bauer, H.; Dirnböck, T. Acidification and Nitrogen Eutrophication of Austrian Forest Soils. Appl. Environ. Soil Sci. 2012, 2012, 9. [Google Scholar] [CrossRef]
- Glatzel, G. The nitrogen status of Austrian forest ecosystems as influenced by atmospheric deposition, biomass harvesting and lateral organomass exchange. Plant Soil 1990, 128, 67–74. [Google Scholar] [CrossRef]
- Dirnböck, T.; Kobler, J.; Kraus, D.; Grote, R.; Kiese, R. Impacts of management and climate change on nitrate leaching in a forested karst area. J. Environ. Manag. 2016, 165, 243–252. [Google Scholar] [CrossRef]
- Yin, J.; Gentine, P.; Zhou, S.; Sullivan, S.C.; Wang, R.; Zhang, Y.; Guo, S. Large increase in global storm runoff extremes driven by climate and anthropogenic changes. Nat. Commun. 2018, 9, 4389. [Google Scholar] [CrossRef] [Green Version]
- Barnett, T.P.; Adam, J.C.; Lettenmaier, D.P. Potential impacts of a warming climate on water availability in snow-dominated regions. Nature 2005, 438, 303–309. [Google Scholar] [CrossRef]
- Crossman, J.; Catherine Eimers, M.; Casson, N.J.; Burns, D.A.; Campbell, J.L.; Likens, G.E.; Mitchell, M.J.; Nelson, S.J.; Shanley, J.B.; Watmough, S.A.; et al. Regional meteorological drivers and long term trends of winter-spring nitrate dynamics across watersheds in northeastern North America. Biogeochemistry 2016, 130, 247–265. [Google Scholar] [CrossRef]
- Casson, N.J.; Eimers, M.C.; Buttle, J.M. The contribution of rain-on-snow events to nitrate export in the forested landscape of south-central Ontario, Canada. Hydrol. Process. 2010, 24, 1985–1993. [Google Scholar] [CrossRef]
- Durán, J.; Morse, J.L.; Groffman, P.M.; Campbell, J.L.; Christenson, L.M.; Driscoll, C.T.; Fahey, T.J.; Fisk, M.C.; Likens, G.E.; Melillo, J.M.; et al. Climate change decreases nitrogen pools and mineralization rates in northern hardwood forests. Ecosphere 2016, 7, 53. [Google Scholar] [CrossRef]
- Li, W.; Wu, J.; Bai, E.; Guan, D.; Wang, A.; Yuan, F.; Wang, S.; Jin, C. Response of terrestrial nitrogen dynamics to snow cover change: A meta-analysis of experimental manipulation. Soil Biol. Biochem. 2016, 100, 51–58. [Google Scholar] [CrossRef]
- Schütt, M.; Borken, W.; Stange, C.F.; Matzner, E. Substantial net N mineralization during the dormant season in temperate forest soils. J. Plant Nutr. Soil Sci. 2014, 177, 566–572. [Google Scholar] [CrossRef]
- Hartl-Meier, C.; Zang, C.; Büntgen, U.; Esper, J.; Rothe, A.; Göttlein, A.; Dirnböck, T.; Treydte, K. Uniform climate sensitivity in tree-ring stable isotopes across species and sites in a mid-latitude temperate forest. Tree Physiol. 2014, 35, 4–15. [Google Scholar] [CrossRef] [Green Version]
- Kobler, J.; Jandl, R.; Dirnböck, T.; Mirtl, M.; Schindlbacher, A. Effects of stand patchiness due to windthrow and bark beetle abatement measures on soil CO2 efflux and net ecosystem productivity of a managed temperate mountain forest. Eur. J. For. Res. 2015, 134, 683–692. [Google Scholar] [CrossRef]
- Blankinship, J.C.; Meadows, M.W.; Lucas, R.G.; Hart, S.C. Snowmelt timing alters shallow but not deep soil moisture in the Sierra Nevada. Water Resour. Res. 2014, 50, 1448–1456. [Google Scholar] [CrossRef]
- Pröll, G.; Dullinger, S.; Dirnböck, T.; Kaiser, B.; Richter, A. Effects of nitrogen on tree recruitment in a temperate montane forest as analysed by measured variables and Ellenberg indicator values. Preslia 2011, 83, 111–127. [Google Scholar]
- Emmett, B.A. Nitrogen Saturation of Terrestrial Ecosystems: Some Recent Findings and Their Implications for Our Conceptual Framework. Water Air Soil Pollut. Focus 2007, 7, 99–109. [Google Scholar] [CrossRef]
- Brumme, R.; Khanna, P.K. Ecological and site historical aspects of N dynamics and current N status in temperate forests. Glob. Chang. Biol. 2008, 14, 125–141. [Google Scholar] [CrossRef]
- Jandl, R. Climate-induced challenges of Norway spruce in Northern Austria. Trees For. People 2020, 1, 100008. [Google Scholar] [CrossRef]
- Thom, D.; Rammer, W.; Seidl, R. The impact of future forest dynamics on climate: Interactive effects of changing vegetation and disturbance regimes. Ecol. Monogr. 2017, 87, 665–684. [Google Scholar] [CrossRef] [PubMed] [Green Version]


| RCM Model | Institute | Resolution |
|---|---|---|
| CLMcom-CCLM4-8-17 | CNRM-CERFACS-CNRM-CM5 | 12 km, daily |
| SMHI-RCA4 | CNRM-CERFACS-CNRM-CM5 | |
| KNMI-RACMO22E | ICHEC-EC-EARTH | |
| IPSL-INERIS-WRF331F | IPSL-IPSL-CM5A-MR | |
| CLMcom-CCLM4-8-17 | MPI-M-MPI-ESM-LR | |
| MPI-CSC-REMO2009 | MPI-M-MPI-ESM-LR | |
| SMHI-RCA4 | MPI-M-MPI-ESM-LR | |
| DMI-HIRHAM5 | NCC-NorESM1-M |
| g kg−1 | Spruce | Beech | |
|---|---|---|---|
| Current Year Needles | One-Year Needles | ||
| N | 12.0 ± 0.08 | 11.4 ± 0.08 | 20.5 ± 0.13 |
| P | 1.1 ± 0.01 | 0.8 ± 0.01 | 0.7 ± 0.01 |
| K | 4.3 ± 0.08 | 3.4 ± 0.06 | 6.1 ± 0.1 |
| Ca | 5.1 ± 0.1 | 7.6 ± 0.14 | 12.8 ± 0.22 |
| Mg | 2.0 ± 0.03 | 2.2 ± 0.03 | 2.7 ± 0.5 |
| N:P | 11.3 ± 0.11 | 13.8 ± 0.14 | 29.0 ± 0.41 |
| N:K | 3.1 ± 0.07 | 3.5 ± 0.07 | 3.5 ± 0.06 |
| N:Ca | 2.5 ± 0.05 | 1.6 ± 0.03 | 1.7 ± 0.03 |
| N:Mg | 4.6 ± 0.09 | 5.6 ± 0.1 | 7.8 ± 0.14 |
| 1992 | 2004 | 2014 | ∆ 1992 to 2004 | ∆ 1992 to 2014 | |
|---|---|---|---|---|---|
| Mean ± SE concentrations [%] and C:N ratio in the mineral soil (0–10 cm) | |||||
| Total N | 0.71 ± 0.04 | 0.62 ± 0.04 | 0.60 ± 0.03 | ↓ 0.11 ** | ↓ 0.9 *** |
| Organic C | 10.44 ± 0.57 | 9.83 ± 0.55 | 7.98 ± 0.46 | ↓ 0.61 | ↓ 2.46 *** |
| C:N ratio | 15.4 ± 0.5 | 16 ± 0.2 | 13.7 ± 0.5 | ↑ 0.6 | ↓ 1.6 * |
| Stocks [kg ha−1] of total N (median and median absolute deviation) | |||||
| Organic layer | 113 (79) | 255 (151) | - | ↑ 142.4 *** | - |
| Mineral layer 0–5 | 1644 (624) | 1430 (433) | - | ↓ 214.6 ** | - |
| Mineral layer 5–10 | 1851 (747) | 1599 (484) | - | ↓ 251.4 ** | - |
| Mineral layer 10–20 | 2414 (2197) | 1918 (1074) | - | ↓ 496.1 | - |
Publisher’s Note: MDPI stays neutral with regard to jurisdictional claims in published maps and institutional affiliations. |
© 2020 by the authors. Licensee MDPI, Basel, Switzerland. This article is an open access article distributed under the terms and conditions of the Creative Commons Attribution (CC BY) license (http://creativecommons.org/licenses/by/4.0/).
Share and Cite
Dirnböck, T.; Brielmann, H.; Djukic, I.; Geiger, S.; Hartmann, A.; Humer, F.; Kobler, J.; Kralik, M.; Liu, Y.; Mirtl, M.; et al. Long- and Short-Term Inorganic Nitrogen Runoff from a Karst Catchment in Austria. Forests 2020, 11, 1112. https://doi.org/10.3390/f11101112
Dirnböck T, Brielmann H, Djukic I, Geiger S, Hartmann A, Humer F, Kobler J, Kralik M, Liu Y, Mirtl M, et al. Long- and Short-Term Inorganic Nitrogen Runoff from a Karst Catchment in Austria. Forests. 2020; 11(10):1112. https://doi.org/10.3390/f11101112
Chicago/Turabian StyleDirnböck, Thomas, Heike Brielmann, Ika Djukic, Sarah Geiger, Andreas Hartmann, Franko Humer, Johannes Kobler, Martin Kralik, Yan Liu, Michael Mirtl, and et al. 2020. "Long- and Short-Term Inorganic Nitrogen Runoff from a Karst Catchment in Austria" Forests 11, no. 10: 1112. https://doi.org/10.3390/f11101112