Study on Gene Differential Expression in Tetraploid Populus Leaves


1
Advanced Innovation Center for Tree Breeding by Molecular Design, National Engineering Laboratory for Tree Breeding, College of Biological Sciences and Technology, Beijing Forestry University, Beijing 100083, China
2
Key Laboratory of Genetics and Breeding in Forest Trees and Ornamental Plants, Ministry of Education, College of Biological Sciences and Technology, Beijing Forestry University, Beijing 100083, China
3
Beijing Laboratory of Urban and Rural Ecological Environment, College of Biological Sciences and Technology, Beijing Forestry University, Beijing 100083, China
*
Author to whom correspondence should be addressed.
Forests 2020, 11(11), 1233; https://doi.org/10.3390/f11111233
Submission received: 23 October 2020
/
Revised: 17 November 2020
/
Accepted: 20 November 2020
/
Published: 23 November 2020
(This article belongs to the Section Forest Ecophysiology and Biology)
Abstract
:Polyploids exhibit different phenotypes compared to those of diploids in plants, and the important role of polyploids in tree breeding has been widely recognized. The transcriptomes detected by RNA-seq in the Populus triploid by doubling the chromosomes of the female gamete, in the triploid by doubling the chromosomes of somatic cells and the diploid with the parent were compared to reveal the patterns of gene expression of tetraploid leaves and their influence on growth. The results showed that the high expression of GATA and PORA in tetraploid leaves was the reason for the higher chlorophyll content in the leaves than in diploid and triploid leaves. The 11-day-old tetraploid leaves began to enter the aging stage. Compared with that in the diploid, GRF was significantly upregulated, while the amylase genes were downregulated. Compared with those in the triploid, 3 STN7 genes that regulate photosynthetic genes and PGSIP genes which are related to starch synthesis, were significantly downregulated in the tetraploid, and the auxin receptor protein TIR1 was also significantly downregulated. In the tetraploid, auxin-regulating genes such as GH3 and AUX/IAA as well as genes involved in the regulation of leaf senescence, SAG genes and SRG genes were significantly up-regulated, resulting in a decrease in the auxin content. In senescent leaves, CHLD, CHLI1, and CHLM in the early stage of chlorophyll synthesis all began to downregulate their expressions, leading to the downregulation of LHC genes and a decrease in their photosynthetic efficiency, which led to the downregulation of carbon fixation-related genes such as SS genes, thus affecting carbon synthesis and fixation. This finally led to the slow growth of tetraploid plants. These data represent the transcriptome characteristics of tetraploid, and they can be used as a resource for further research on polyploids and provide a reference for further understanding of the function of polyploid vegetative growth-related genes.
1. Introduction
Compared with diploid plants, polyploid plants usually have strong stems, large fruits, and rich metabolites [1,2,3]. In 1935, Nilsson-Ehle discovered the natural triploid of giant European aspen [4]. The wood increment of artificial triploid poplar was 2−3 times higher than that of common poplar, and the growth rate of artificial triploid poplar had reached the growth level of fast-growing black poplar [5]. The Medicago sativa tetraploid is taller than the diploid [6]. Meanwhile, the Arabidopsis thaliana tetraploid has larger leaves than diploid, and tetraploid is more robust [7,8]. Most of the world’s wheat production comes from two polyploid varieties [9]. Hexaploid wheat Triticum aestivum accounts for 95% of global wheat production, and the remaining 5% depends on T. turgidum, a tetraploid variety with high protein and gluten levels [9,10]. Tetraploid cotton has a higher yield and better quality than diploid cotton under the same environmental conditions [11]. However, not all polyploids exhibit the same growth advantages as the plants described above. For example, the diploid plants grew more vigorously than the tetraploid plants, even though the leaves, stems, and roots of the tetraploid plants of Lambic lime were larger than the diploid plants and the cells were larger [12]. Similar to Lambic lime, tetraploid birch was lower in height than diploid [13]. Although polyploid growth was different, they showed great variation in leaves.
Previous studies have shown that polyploid character variation is closely related to mRNA transcription [9,14,15]. For example, ploidy changes lead to subtle changes in the expression of a significant portion of the potato genome [16]. The transcriptome analysis of polyploid wheat and its diploid ancestors during the embryonic development of grain was found to be very different [9]. However, it has also been reported that the great changes in anatomy and physiology between the diploid and homologous tetraploid of Lambic lime have nothing to do with the changes in leaf gene expression [12]. No major changes related to the ploidy change were found in the proteomic analysis of the Chinese cabbage homologous polyploid [17].
The triploid poplar had more advantages than the diploid poplar with regards to the vegetative growth status, net photosynthetic rate, and related chlorophyll content index [18]. The phenotype and increment of poplar with different ploidy were significantly different. The Populus triploid antioxidant activity and carbohydrate metabolism, biological process related-genes changed significantly. Chlorophyll synthesis, light capture, photosynthesis, carbon fixation, and sugar and starch synthesis and decomposition raised the expressions of related genes, made the endogenous hormone synthesis and signal transduction process more robust, and the miRNA expression showed no significant difference between the triploid and diploid. Moreover, the changes in growth-related gene expression are the molecular basis of the triploid growth advantage of Populus [19,20,21]. The high expressions of the WRKY transcription factor, cyclin CYCD, and genes related to the synthesis of auxin, cytokinin, and brassinolide made the triploid leaves large [22]. In terms of the growth rate, the triploid grows the fastest, the diploid grows the second fastest, and the tetraploid grows the slowest [23]. Why is triploid vegetative growth high and tetraploid vegetative growth relatively poor after chromosome doubling? What are the differences in gene expression between tetraploid, diploid, and triploid? Further study is required.
In this study, the diploid obtained from the hybridization of (P. pseudosimonii × P. nigra ‘zheyin3#’) × (Populus × beijingensis), the triploid obtained from the doubling of the female gamete chromosome, and the tetraploid obtained from the doubling of diploid F1 somatic chromosomes were used as materials, and transcriptomic sequencing was performed on the mature leaves of diploid, triploid and tetraploid Populus to compare gene expression differences. Compared with those of the diploid and triploid, the differentially expressed genes related to leaf growth and the development of metabolic pathways of the tetraploid were analyzed. This laid the foundation for revealing the variation of vegetative growth of different ploidy levels in poplars.
2. Materials and Methods
2.1. Plant Materials and Growth Conditions
Synthetic tetraploid, triploid and diploid poplars were used as plant materials in this study. Triploid and diploid poplars were generated by a female parent Populus pseudo-simonii × P. nigra ‘Zheyin3#’ (2n = 2x = 38) and a male parent P. beijingensis (2n = 2x = 38) and triploid was derived from hybridization with 2n female gametes upon exposure to high temperature [24]. The tetraploid was induced by chromosome doubling of the diploid hybrid progeny described above through colchicine treatment [25]. The ploidy levels of these plant materials were determined by flow cytometry and the number of chromosomes was determined by the conventional pressing plate method.
These plants were transplanted from half-strength MS (Murashige and Skoog) root medium (3% (w/v) sucrose, 0.6% (w/v) agar, 0.1 mg/L IBA (indolebutyric acid)) to plastic pots that contained sand, turf, and peat (1:1:1, v/v/v). All plant materials were grown in the greenhouse of the National Engineering for Tree Breeding (Beijing, China) at 18/26 °C (night/day) and a relative humidity of 45%–70%. To ensure the accuracy of the experiment, there were 30 well-growing plants for each ploidy, and the height of the tree was measured. Three-month-old saplings were used to assess variation in phenotypic traits, microscopic and submicroscopic structures, and physiology in this study. The experiment followed a completely randomized design with three replicates.
2.2. Measurement of Leaf Areas
The leaves grown for 11 days were used to measure the leaf areas with three biological replicates per ploidy. A portable area meter (LI-3100C, LI-COR, Lincoln, NE, USA) was used to measure the leaf areas.
2.3. Determination of the Chlorophyll Content
The chlorophyll contents of different ploidy leaves were determined according to the method described in Lichtenthaler and Buschmann [26]. The pigments were extracted from plant leaves by acetone with 20% (v/v) water. The concentrations of pigments were quantified by light spectroscopy at 470, 645, and 663 nm (UV-VIS spectrophotometer, Shimadzu, Kyoto, Japan), including chlorophyll a and chlorophyll b.
2.4. Determination of the Auxin Content
The endogenous auxin (IAA) contents of three types of leaves (diploid, triploid, and tetraploid) were determined by high-performance liquid chromatography-mass spectrometry (LC-MS). The leaf samples were frozen in liquid nitrogen and stored at −80 °C in a fridge until they were analyzed as described [27]. Sample analysis was performed using an AB Sciex QTRAP 5500 LC System (AB Sciex Pte., Waltham, MA, USA).
2.5. RNA Extraction, RNA-seq Library Preparation, and Sequencing
11-day-old leaves (mature and functional leaves) to be used for transcriptional sequencing were immediately frozen in liquid nitrogen and stored at −80°C until analysis. The total RNA was extracted from 50–100 mg of tissue from separate leaf samples using TRIzol Reagent Kits (Invitrogen, Carlsbad, CA, USA) according to the manufacturer’s recommendations. The quality and quantity of the purified RNA were determined based on absorbance ratios at 260/280 nm (A260/A280) and 260/230 nm (A260/A230) using a Nanodrop instrument. The RNA integrity was further verified by 1.5% agarose gels and an Agilent 2100 bioanalyzer, and RNA integrity number (RIN) values were ≥7 for all biological replicates. Three biological replicates were used in this experiment.
For high-throughput sequencing, the libraries were prepared using the NEBNext UltraTM RNA Library Prep Kit for Illumina (NEB, Ipswich, Massachusetts, USA) following the manufacturer’s instructions. The libraries were sequenced on an Illumina HiSeq platform at the Beijing Yuanyi Biological Technology Co., Ltd. (Beijing, China), and paired-end reads were obtained.
After the high-throughput sequencing, the raw data, which contained adapter and low-quality cycles of reads, were filtered. The clean reads were mapped with the reference genome by TopHat2. The gene expression level was calculated by FPKM (Fragments Per Kilobase of transcript per Million fragments mapped). Genomic annotations were obtained from Phytozome (https://phytozome.jgi.doe.gov/pz/portal.html#!info?alias=Org_Ptrichocarpa). GO (Gene Ontology, http://geneontology.org/) and KEGG (Kyoto Encyclopedia of Genes and Genomes, https://www.kegg.jp/) pathways enrichment analyses were performed for the DEGs.
2.6. Quantitative Real-Time PCR Analysis of Gene Expression
The total RNA was extracted from 50–100 mg of tissue from separate leaf samples using RNAprep Pure Plant Kits (Tiangen; http://www.tiangen.com) according to the manufacturer’s recommendations. The cDNA was synthesized from 2 μg of total RNA using a cDNA Synthesis Kit (Solarbio, http://www.solarbio.com). Gene-specific primers were designed according to the reference unigene sequences using the DNAMAN 6.0, and all primer sequences are listed in Table S1. A pair of primers were also designed for the ubiquitin gene (Accession number: FJ438462.1; Gene ID: Potri.001G418500) to normalize the amplification efficiency [28]. qRT-PCR assays were performed in triplicate using the Kapa Probe Fast qPCR Kit (KAPA Biosystems, Boston, Massachusetts, USA) with a Bio-Rad CFX96 Real-Time Detection System (Bio-Rad, Hercules, CA, USA). The ubiquitin gene was used as an internal control for data normalization, and quantitative variation in the different replicates was calculated using the delta-delta threshold cycle relative quantification method.
2.7. Statistical Analysis
The SPSS Statistical Package, version 24.0 (SPSS Inc., Chicago, Illinois, USA), was used to assess variations in phenotypic traits, structures, and physiology in the three ploidy poplars. The significance of difference among means was determined by Duncan’s multiple range tests at p ≤ 0.05. The R language was used for plotting.
3. Results
3.1. Variation of the Polyploidy Plant Growth, Leaf Morphology and Physiological Characteristic in Poplar
After growing for three months, the triploid saplings were taller than their full-sibling diploid plants, but the tetraploid saplings were shorter than the diploids (Figure 1A). The average heights of diploids, triploids, and tetraploids were 92.8, 125.5, and 60.1 cm, respectively (Figure 2A). The tissue culture seedlings with the same culture time and same growth conditions were transplanted to the greenhouse, and even the tetraploid grew slightly stronger than the diploid plants before transplantation. Therefore, the transplantation process is not the cause of the differences in the growth rates of the polyploids and diploid. Phenotypic differences among the diploid, triploid, and tetraploid such as different plant heights, higher greenness of polyploidy leaves, larger polyploidy leaf blades, and different internode lengths, were observed (Figure 1).
Polyploids had larger leaves than the diploids in poplars. The average areas of 11-day-old leaves of diploids, triploids, and tetraploids were 45.6, 79.8, and 63.7 cm2, respectively (Figure 2B). The leaf areas were significantly different between diploids and triploids (p < 0.01), as well as between diploids and tetraploids (p < 0.05), whereas no significant difference was observed between triploids and tetraploids. The leaf shape of tetraploids was similar to that of diploids, and both of them were nearly ovate, although the leaf blades of tetraploids were wider and more plicated compared to diploids. The leaf blades of triploids were close to broadly ovate, and the blades were flatter.
The leaves of three different ploidies exhibited different pigmentation (Figure 2C). We pooled the data of chlorophyll a (Chla) and chlorophyll b (Chlb), and we found that the content of chlorophylls showed a significant upward trend from diploid to tetraploid. This indicated that the chlorophyll content increases with the increase of ploidy.
High-performance liquid chromatography-mass spectrometric (HPLC-MS) analysis of leaf samples showed different levels of IAA in tetraploid, triploid, and diploid leaves (Figure 2D). Compared with the parent diploid, the content of IAA in the triploid mature leaf increased more than 1.5 times, but it declined slightly in the tetraploid. There was not a significant correlation between the auxin content and ploidy.
3.2. Gene Expressions and Differentially Expressed Genes (DEGs) among Tetraploid, Triploid, and Diploid
To investigate and compare the mRNA expression levels in diploid, triploid, and tetraploid, transcriptome sequencing was performed on mature leaves aged 11 days. As a result, we obtained 28,444, 27,954, and 29,263 genes from diploid, triploid, and tetraploid poplar leaves, respectively. Compared with diploid, there were 3403 genes differentially expressed in mature tetraploid leaves (q value < 0.05, |fold change| ≥ 1.5), of which 2604 DEGs are upregulated and 799 genes are downregulated (Figure 3A). Compared with triploids, there were 7504 genes differentially expressed in tetraploid mature leaves (q value < 0.05, |fold change| ≥ 1.5), among which 4940 DEGs were upregulated, and 2564 DEGs were downregulated (Figure 3A). The number of common DEGs in the above two groups was 2394, including 1877 co-upregulated DEGs and 327 co-downregulated DEGs (Figure 3A). The clustering heat map shows that the samples are clearly separated, with the triploid and tetraploid separated from the diploid (Figure 3B). In addition, through the annotation analysis of the DEGs, it was found that the incidence of genes related to cytochrome, cell membrane, disease resistance, and pectin was higher, and the frequency of genes related to auxin was higher in genes involved in the differentially expressed hormones (Figure 3C). To verify the differences in gene expression among tetraploid, diploid, and triploid, some genes were selected for qRT-PCR analysis. The figure shows that all of the selected genes were successfully amplified, and the results of qRT-PCR were consistent with the RNA-seq data (Figure 4).
3.3. Analysis of the Differential Expression and Functional Enrichment of Leaf Genes in Poplar Tetraploid and Diploid
3.3.1. GO Enrichment Analysis of Differential Genes in Poplar Tetraploid and Diploid Leaves
All unigenes were annotated based on the results of BLASTX searches against the GO database in poplars of different ploidies. A lot of 1275 differential genes were found between tetraploid and diploid. The results showed that the genes differentially expressed in tetraploid versus diploid were mainly concentrated in terms of ATP binding, oxidation-reduction process, DNA binding, nucleus, and carbohydrate metabolism process (Figure 5). Compared with diploid, only 1 light-harvesting related gene, LHCA6 (Potri.006G139600), was significantly downregulated in the photosynthesis, the light term of tetraploid, and the differences in other genes were not significant. 6 plant glycogenin-like starch initiation protein (PGSIP) genes were enriched in transferase activity, transferring glycosyl groups term, and one PGSIP3 (Potri.014G029900) was significantly downregulated in tetraploid. There were 22 genes related to amylase activity in the carbohydrate metabolic process and polysaccharide catabolic process, among which 6 genes were significantly downregulated in tetraploid and 1 was upregulated. In the items of sucrose metabolic process and sucrose synthase activity, the up-regulation and down-regulation of genes related to sucrose synthesis and metabolism in tetraploid are equivalent. In the GO item of the developmental process, 13 growth regulatory factor (GRF) genes, including GRF1, GRF2, GRF3, GRF5, GRF7, and GRF9, were significantly upregulated in the tetraploid, and the difference was as high as 102 times (Figure 6A). The 10 GATA transcription factors GATA1, GATA2, GATA4, GATA9, GATA12, GATA15, and GATA18 in the transcription factor activity term were significantly upregulated in tetraploid (Figure 6B). The above data was shown in Table S2.
3.3.2. KEGG Enrichment Analysis of Differential Genes in Poplar Tetraploid and Diploid Leaves
The KEGG pathway enrichment analysis of all genes of different ploidy leaves of poplar showed that the differential genes between tetraploid and diploid were mainly enriched in metabolic pathways, biosynthesis of secondary metabolites, biosynthesis of amino acids, starch and sucrose metabolism, DNA replication, and phenylpropanoid biosynthesis pathways. Compared with diploid, the genes involved in starch synthesis in the biosynthesis of secondary metabolites pathway are all downregulated, and only SS4 (Potri.001G351800) exhibited a significant difference. Sucrose phosphate synthases SPS1F (Potri.018G025100, Potri.018G124700), SPS3F (Potri.001G317600), and SPS4F (Potri.013G095500), which are related to sucrose synthesis in starch and sucrose metabolic pathway, were significantly downregulated in tetraploid compared to diploid. The sucrose synthase gene SUS5 (Potri.017G139100), which catalyzes sucrose synthesis, was upregulated in tetraploid. The sucrose-6F-phosphate phosphohydrolase family protein genes Potri.006G199800, Potri.008G013300, and Potri.016G066100, which catalyze the last step of sucrose synthesis, were slightly downregulated in tetraploid. The sucrose transporter related genes were not significantly different. In the pathway of porphyrin and chlorophyll metabolism, protochlorophyllide oxidoreductase A (PORA, Potri.011G122400), a gene that promotes chlorophyll formation, was significantly upregulated in tetraploid. The chlorophyll-degrading gene SRG1 was upregulated in tetraploid. In plant hormone signal transduction, four auxin conjugating enzymes that bind to auxin to reduce auxin levels were differentially expressed in GH3 family protein genes, Potri.001G298300, Potri.007G050300 and Potri.009G092900, were significantly upregulated in tetraploid. The term of the oxidation-reduction process showed that the gibberellin oxidase gene GA20OX2 (Potri.007G103800) involved in gibberellin biosynthesis was significantly downregulated, and GA3OX1 (Potri.001G176600) was significantly upregulated in tetraploid. The DEGs were shown in Table S3.
3.4. Analysis of the Differential Expression and Functional Enrichment of Leaf Genes in Poplar Tetraploid and Triploid
3.4.1. GO Enrichment Analysis of Differential Genes in Poplar Tetraploid and Triploid Leaves
The 2822 differential genes between tetraploid and triploid were annotated with the GO database. The DEGs of tetraploid and triploid were mainly enriched in ATP binding, protein kinase activity, protein phosphorylation, oxidation-reduction process, cell nucleus, and carbohydrate metabolic process. This is similar to the GO terms in which diploid and tetraploid differential genes were predominantly enriched. In the photosynthesis, light term, compared with triploid, light-harvesting related genes, including LHCA1 (Potri.008G041000), LHCA2 (Potri.003G171500), LHCA5 (Potri.014G029700), LHCA6 (Potri.006G139600), LHCB1.4 (Potri.002G189300), LHCB3 (Potri.011G126700, Potri.001G407100), LHCB4.2 (Potri.016G115200), LHCB4.3 (Potri.008G067300) and LHCB6 (Potri.003G020400), were all significantly downregulated in tetraploid (Table S4). Compared with triploids, tetraploid had 2 STN7 genes (Potri.008G116800, Potri.010G129500) that regulate the expressions of photosynthetic genes, which significantly downregulate the expression. The term of transferase activity, transferring glycosyl groups enriched PGSIP genes, of which the genes PGSIP1 (Potri.007G107200) and PGSIP3 (Potri.014G029900) were significantly downregulated in tetraploid. Among the genes related to amylase activity in carbohydrate metabolic process and polysaccharide catabolic process terms, 9 tetraploid genes were significantly downregulated, 5 were significantly upregulated, and other differences were not significant. In terms of sucrose metabolic process and sucrose synthase activity, there were more downregulated genes than upregulated genes in tetraploid. Related genes that promote plant senescence, including SAG14 (Potri.006G067400), SAG20 (Potri.010G182200), SAG21 (Potri.002G203500), SAG101 (Potri.009G086100), SAG12 (Potri.005G089100), SRG1 (Potri.001G355100, Potri.001G355200, Potri.001G381700) and SRG3 (Potri.017G063500) were highly expressed in tetraploid, and two were significantly downregulated. The expression levels of 10 genes including GRF1, GRF2, GRF5, GRF7, and GRF9, which are significantly upregulated during the developmental process, in tetraploid were 2.4−45 times those of triploid. Compared with triploid, 8 GATA transcription factors including GATA1, GATA2, GATA5, GATA9, GATA12, GATA15, and GATA18 were significantly upregulated in tetraploid, and GATA21 and GATA25 were significantly downregulated with regard to transcription factor activity.
3.4.2. KEGG Enrichment Analysis of Differential Genes in Poplar Tetraploid and Triploid Leaves
Enrichment analysis of the KEGG pathway found that the differential genes between tetraploid and triploid were mainly enriched in pathways of starch and sucrose metabolism, plant hormone signal transduction, protein processing in the endoplasmic reticulum, and carbon metabolism. Compared with triploids, most of the key genes that make up the light-harvesting chlorophyll protein complex in the photosynthesis-antenna proteins pathway are downregulated in tetraploid. This is basically the same as in the GO photosynthesis, light term. The genes SS1 (Potri.015G012400), SS3 (Potri.004G014100), and SS4 (Potri.001G351800) involved in starch synthesis in the biosynthesis of secondary metabolites pathway were all significantly downregulated (Table S5). Sucrose phosphate synthases SPS1F, SPS3F, and SPS4F, which are genes related to sucrose synthesis in starch and sucrose metabolism pathway, were significantly downregulated in tetraploid. Four genes including sucrose synthase genes SUS5 and SUS6, which catalyze sucrose synthesis, were upregulated in tetraploid. Sucrose-6F-phosphate phosphohydrolase family protein gene Potri.016G066100 was significantly downregulated in tetraploid. The differences in genes related to the sucrose transporter were not significant. In the pathway of porphyrin and chlorophyll metabolism, the FtsH extracellular protease family gene VAR1 (Potri.005G249200) that promotes chloroplast development, plastid transcriptionally active chromosomal protein PTAC genes (PTAC2 (Potri.015G069100), PTAC4 (Potri.006G123600), PTAC5 (Potri.001G049900), PTAC14 (Potri.003G155100) PTAC16 (Potri.001G244800) and PTAC15 (Potri.015G005200)), and Fe superoxide dismutase FSD2 (Potri.015G110400) were significantly downregulated in tetraploid. The Mg-chelator gene CHLD (Potri.009G049400) and CHLI1 (Potri.011G063400), Mg-protoporphyrin IX methyltransferase gene CHLM (Potri.012G106600), and Mg-protoporphyrin IX monomethyl ester cyclase gene CRD1 (Potri.016G025000, Potri.006G027300) involved in chlorophyll synthesis were downregulated in tetraploid, while SGR1, which degrades chlorophyll, was upregulated in tetraploid. However, the prochlorophyll ester oxidoreductase gene PORA (Potri.011G122400), which promotes chlorophyll formation, was significantly upregulated in tetraploid. 3 GH3 genes in the plant hormone signal transduction pathway were upregulated in tetraploid. Compared with triploid, the gene expression of auxin receptor protein TIR1 was significantly downregulated in tetraploid. Meanwhile, the gene encoding the AUX/IAA protein, an inhibitor of auxin signaling, was significantly upregulated in tetraploid. In the pathway of the oxidation-reduction process, GA20OX2 (Potri.015G134600), GA2OX1 (Potri.001G378400), and GA2OX7 (Potri.010G096800) were significantly downregulated in tetraploid compared with triploid.
4. Discussion
Polyploidy is ubiquitous in plants. Polyploidization is the main driving force of plant evolution and an important method of plant breeding. Recent studies have demonstrated the effects of polyploidy on phenotypes, epigenetics, gene expression, regulatory networks, etc. [29]. Changes in gene expression and epigenetic inheritance caused by ploidy are often considered to be the cause of polyploidy variation [30]. Here, we applied high-throughput sequencing technology to perform mRNA sequencing on the 11-day-old leaves of triploid, tetraploid, and the same parent diploid poplar. Approximately 30,000 mRNA transcripts were obtained, including 3403 differential genes obtained by comparing tetraploid and diploid. The number of differential genes between tetraploid and triploid was 7504. A large number of DEGs between tetraploid and triploid was not only resulted from the ploidy property, but also the difference of the genomic constitution. Among them, the number of differential genes shared by tetraploid, diploid, and triploid is 2394. These DEGs may be most associated with the slow vegetative growth of tetraploid.
4.1. Differential Expression of Genes Related to Leaf Growth and Chlorophyll Synthesis of Tetraploid Poplar
Chlorophyll has the function of absorbing and transforming light energy and fixing carbon dioxide, which plays an indispensable role in plant growth and development [31]. Protochlorophyllide oxidoreductase (POR) is a key enzyme in the process of chlorophyll synthesis, which combines the active site of protochlorophyllide (Pchlide) to convert it into chlorophyllide (Chlide) under light [32]. PORA, a regulatory gene of POR, plays an important role in chlorophyll synthesis and accumulation [33,34]. In addition, the GATA transcription factor is widely involved in the regulation of plant growth and development process [35]. Studies have found that the chlorophyll content of Arabidopsis thaliana gata loss-of-function mutants decrease, and GATA can act on PORA to promote chlorophyll synthesis [36,37,38]. The overexpression of GATA not only promotes the increase of the leaf chlorophyll content but also inhibits plant growth and yield [39]. This study found that compared with diploid, the key genes acting on PORA for chlorophyll synthesis and the GATA transcription factor related to growth and development were significantly upregulated in tetraploid leaves, which may be the main reason why tetraploid leaves had a higher chlorophyll content than diploid leaves.
4.2. Differential Expression of Auxin and Senescence-Related Genes in Tetraploid Poplar Leaves
Auxin is a small molecular substance with very low intracellular content, which plays an important positive regulatory role in plant organ differentiation and vegetative growth, leaf development, and even the process of plant response to environmental stimuli [40,41,42]. GH3 is a class of genes that negatively regulate auxin and encodes auxin binding enzyme, which reduces the content of auxin by binding IAA to amino acids [43,44]. The overexpression of GH3 will cause plant dwarfism and a decrease in the auxin content [45,46]. AUX/IAA transcriptional repressors can bind to auxin response factors (ARFs) to inhibit the auxin response and negatively regulate plant growth and development, and the overexpression of the AUX/IAA gene makes hypocotyls and stems significantly shorter [47,48]. TIR1 is a receptor protein that mediates auxin response, which can bind to and degrade AUX/IAA protein to activate the transcription of auxin response genes and promote plant growth and development [49,50,51,52,53]. There is a correlation between the expression levels of SAG and SRG genes and the severity of senescence-related phenotypes, which are genes that regulate leaf senescence [54,55,56]. This study showed that the GH3 gene and multiple auxin inhibitors AUX/IAA were significantly upregulated, and TIR1 was significantly downregulated in tetraploid leaves compared with diploid and triploid leaves. GH3 genes caused a decrease in the tetraploid auxin content, and a low auxin concentration caused TIR1 to fail to bind AUX/IAA. AUX/IAA genes were significantly upregulated so that auxin cannot function, thus resulting in the hindrance of the vegetative growth of tetraploid, which is relatively slower than diploid and triploid. At the same time, it was also found that 9 senescence-related genes (SAG and SRG) in tetraploid leaves were significantly upregulated compared with triploid leaves, indicating that tetraploid leaves entered the senescence stage earlier.
4.3. Differential Expression of Genes Related to Chlorophyll Synthesis in Tetraploid Poplar Leaves
The chlorophyll of higher plants is synthesized from L-glutamyl-tRNA through a series of reactions catalyzed by various enzymes [57,58,59]. Recent studies have shown that tetrapyrrole synthase protoporphyrinogen IX oxidase 1 catalyzes protoporphyrinogen to become protoporphyrin, and promotes chlorophyll biosynthesis by promoting chloroplast development [60]. Mg-chelatase catalyzes a key step in chlorophyll biosynthesis by inserting Mg ions into protoporphyrin IX (PPIX), and CHLD and CHLI are the two subunits of Mg-chelatase [61,62]. CHLD connects the motor of Mg-chelatase and the porphyrin-binding subunit to activate the activity of Mg-chelatase during chlorophyll biosynthesis [63,64,65]. CHLI1, a subtype of CHLI, has a strong ATPase activity, which can hydrolyze ATP and catalyze the rapid entry of magnesium ions into chlorophyll molecules [66,67]. Chlorophyll synthesis also requires the conversion of Mg-protoporphyrin IX to Mg-protoporphyrin IX monomethyl ester through methylation, a reaction catalyzed by Mg-protoporphyrin IX methyltransferase (CHLM) [59,62,68,69]. In this study, compared with triploid, CHLD, CHLI1, and CHLM were significantly downregulated in tetraploid leaves grown for 11 days, resulting in a decrease in the chlorophyll synthesis ability. Nevertheless, since the expression of GATA and PORA in tetraploid is significantly higher than that in triploid, the chlorophyll content of tetraploid is slightly higher than that of triploid, but the difference is not significant.
4.4. Differential Expression of Genes Related to Photosynthesis and Carbon Fixation in Tetraploid Poplar Leaves
Higher plants capture the energy of light through a photosynthetic antenna system composed of light-harvesting complexes (LHC), and LHC proteins absorb light energy, transfers the excitation energy to the reaction center for a photochemical reaction, and store it in a chemical form for use by plants [70,71]. Six genes encoding LHC protein complexes, including LHCA1, LHCB1.4, LHCB3, LHCB4.2, and LHCB6, play important positive regulatory roles in light capture [72,73,74]. LHCA1, LHCA2, and LHCA5 can all transfer energy to the photosystem I complex [75]. The stromal loop of LHCA6 may be necessary for interaction with chloroplast NDH [76]. In this experiment, LHCA1 was significantly downregulated in tetraploid compared with diploid and triploid, and LHCA2, LHCA5, and LHCA6 were significantly downregulated in tetraploid compared with triploid, indicating that it is different from diploid and triploid, the tetraploid photosynthetic efficiency was lower and there were fewer photosynthetic products for plant growth.
Starch and sucrose are products of photosynthesis and are stored in plants as energy [77]. SSI has a special and critical function in the synthesis of transient starch in Arabidopsis thaliana leaves [78]. The formation of starch granules requires the presence of SS3 or SS4 [79,80]. Sucrose phosphate synthase (SPS) promotes sucrose biosynthesis, plant growth, and biomass accumulation [81]. This study showed that compared with diploid or triploid, the expressions of genes SSI, SS3, and SS4 that promote starch synthesis and the sucrose phosphate synthase genes SPS1F, SPS3F, and SPS4F, which promote sucrose synthesis, were all downregulated in tetraploid poplar, resulting in a low efficiency of tetraploid starch and sucrose synthesis and insufficient energy reserve for vegetative growth.
In this study, by comparing the transcriptome data of the three ploidies of poplars, we found that the high expressions of GATA and PORA in tetraploid poplar were the reason for the high chlorophyll content. The tetraploid leaves that had grown for 11 days began to age. The expression of auxin inhibitory genes such as GH3 and AUX/IAA genes and the genes involved in the regulation of leaf senescence, SAG and SRG genes, were significantly upregulated, resulting in a decrease in the auxin content that promotes plant growth and leaf senescence. In senescent leaves, chlorophyll synthesis genes such as PPO1, CHLD, CHLI1, and CHLM began to be downregulated, leading to the downregulated expressions of LHC genes and a decrease in their photosynthetic efficiency [82,83], thus down-regulating carbon fixation related genes such as SS genes and affecting carbon synthesis and fixation, eventually resulting in the slow growth of tetraploid poplars. These data represent the transcriptome characteristics of tetraploid, and they can be used as a resource for further research on polyploid and provide a reference for further understanding of the function of polyploid vegetative growth-related genes.
Supplementary Materials
The following are available online at https://www.mdpi.com/1999-4907/11/11/1233/s1, Table S1: The corresponding primers of qRT-PCR, Table S2: Gene expression level data enriched by GO in Diploid versus Tetraploid, Table S3: Gene expression level data enriched by KEGG in Diploid versus Tetraploid, Table S4: Gene expression level data enriched by GO in Triploid versus Tetraploid, Table S5: Gene expression level data enriched by KEGG in Triploid versus Tetraploid.
Author Contributions
Y.Z. and X.K. conceived and designed the experiments. Y.Z. and Y.R. performed the experiments. Y.Z. and Y.R. analyzed the data. Y.Z. wrote the manuscript. X.K. contributed to the revision of the manuscript and funded the study. All authors have read and agreed to the published version of the manuscript.
Funding
This research was funded by the National Natural Science Foundation of China, grant number 31530012.
Acknowledgments
We thank Ori-Gene Science and Technology Co., Ltd. for helping with RNA-sequencing.
Conflicts of Interest
The authors declare no conflict of interest.
References
- Leitch, A.R.; Leitch, I.J. Perspective—Genomic plasticity and the diversity of polyploid plants. Science 2008, 320, 481–483. [Google Scholar] [CrossRef] [PubMed]
- Chen, Z.J. Molecular mechanisms of polyploidy and hybrid vigor. Trends Plant Sci. 2010, 15, 57–71. [Google Scholar] [CrossRef] [PubMed] [Green Version]
- Ng, D.W.-K.; Lu, J.; Chen, Z.J. Big roles for small RNAs in polyploidy, hybrid vigor, and hybrid incompatibility. Curr. Opin. Plant Biol. 2012, 15, 154–161. [Google Scholar] [CrossRef] [PubMed]
- Nilsson-Ehle, H. Note regarding the gigas form of Populus tremula found in nature. Hereditas 1936, 21, 372–382. [Google Scholar]
- Zhu, Z.; Lin, H.; Kang, X. Studies on allotriploid breeding of Populus tomentosa B301 clones. Sci. Silvae Sin. 1995, 31, 499–506. [Google Scholar]
- Kondorosi, E.; Roudier, F.; Gendreau, E. Plant cell-size control: Growing by ploidy? Curr. Opin. Plant Biol. 2000, 3, 488–492. [Google Scholar] [CrossRef]
- Ni, Z.; Kim, E.-D.; Ha, M.; Lackey, E.; Liu, J.; Zhang, Y.; Sun, Q.; Chen, Z.J. Altered circadian rhythms regulate growth vigour in hybrids and allopolyploids. Nat. Cell Biol. 2009, 457, 327–331. [Google Scholar] [CrossRef] [Green Version]
- Miller, M.E.; Zhang, C.; Chen, Z.J. Ploidy and Hybridity Effects on Growth Vigor and Gene Expression in Arabidopsis thaliana Hybrids and Their Parents. G3 Genes Genomes Genet. 2012, 2, 505–513. [Google Scholar] [CrossRef] [Green Version]
- Xiang, D.; Quilichini, T.D.; Liu, Z.; Gao, P.; Pan, Y.; Li, Q.; Nilsen, K.T.; Venglat, P.; Esteban, E.; Pasha, A.; et al. The Transcriptional Landscape of Polyploid Wheats and Their Diploid Ancestors during Embryogenesis and Grain Development. Plant Cell 2019, 31, 2888–2911. [Google Scholar] [CrossRef] [Green Version]
- Shewry, P.R. Wheat. J. Exp. Bot. 2009, 60, 1537–1553. [Google Scholar] [CrossRef]
- Jiang, C.-X.; Wright, R.J.; El-Zik, K.M.; Paterson, A.H. Polyploid formation created unique avenues for response to selection in Gossypium (cotton). Proc. Natl. Acad. Sci. USA 1998, 95, 4419–4424. [Google Scholar] [CrossRef] [PubMed] [Green Version]
- Allario, T.; Brumos, J.; Colmenero-Flores, J.M.; Tadeo, F.; Froelicher, Y.; Talon, M.; Navarro, L.; Ollitrault, P.; Morillon, R. Large changes in anatomy and physiology between diploid Rangpur lime (Citrus limonia) and its autotetraploid are not associated with large changes in leaf gene expression. J. Exp. Bot. 2011, 62, 2507–2519. [Google Scholar] [CrossRef] [PubMed] [Green Version]
- Mu, H.-Z.; Liu, Z.-J.; Lin, L.; Li, H.-Y.; Jiang, J.; Liu, G. Transcriptomic Analysis of Phenotypic Changes in Birch (Betula platyphylla) Autotetraploids. Int. J. Mol. Sci. 2012, 13, 13012–13029. [Google Scholar] [CrossRef] [PubMed] [Green Version]
- Estrada-Johnson, E.; Csukasi, F.; Pizarro, C.M.; Vallarino, J.G.; Kiryakova, Y.; Vioque, A.; Brumos, J.; Medina-Escobar, N.; Botella, M.A.; Alonso, J.M.; et al. Transcriptomic Analysis in Strawberry Fruits Reveals Active Auxin Biosynthesis and Signaling in the Ripe Receptacle. Front. Plant Sci. 2017, 8, 889. [Google Scholar] [CrossRef] [Green Version]
- Saminathan, T.; Nimmakayala, P.; Manohar, S.; Malkaram, S.; Almeida, A.; Cantrell, R.; Tomason, Y.; Abburi, L.; Rahman, M.A.; Vajja, V.G.; et al. Differential gene expression and alternative splicing between diploid and tetraploid watermelon. J. Exp. Bot. 2015, 66, 1369–1385. [Google Scholar] [CrossRef]
- Stupar, R.M.; Bhaskar, P.B.; Yandell, B.S.; Rensink, W.A.; Hart, A.L.; Ouyang, S.; Veilleux, R.E.; Busse, J.S.; Erhardt, R.J.; Buell, C.R.; et al. Phenotypic and Transcriptomic Changes Associated With Potato Autopolyploidization. Genetics 2007, 176, 2055–2067. [Google Scholar] [CrossRef] [Green Version]
- Albertin, W.; Brabant, P.; Catrice, O.; Eber, F.; Jenczewski, E.; Chèvre, A.M.; Thiellement, H. Autopolyploidy in cabbage (Brassica oleracea L.) does not alter significantly the proteomes of green tissues. Proteomics 2005, 5, 2131–2139. [Google Scholar] [CrossRef]
- Liao, T.; Cheng, S.; Zhu, X.; Min, Y.; Kang, X. Effects of triploid status on growth, photosynthesis, and leaf area in Populus. Trees 2016, 30, 1137–1147. [Google Scholar] [CrossRef]
- Cheng, S. Gene expression changes in the full-sib allotriploid population of Populus spp. (Section Tacamahaca). Euphytica 2015, 203, 683–700. [Google Scholar] [CrossRef]
- Suo, Y.; Min, Y.; Dong, C.; Wang, Y.; Cheng, S.; Kang, X. MicroRNA expression changes following synthesis of three full-sib Populus triploid populations with different heterozygosities. Plant Mol. Biol. 2017, 95, 215–225. [Google Scholar] [CrossRef]
- Du, K.; Liao, T.; Ren, Y.; Geng, X.; Kang, X. Molecular mechanism of vegetative growth advantage in allotriploid Populus. Int. J. Mol. Sci. 2020, 21, 441. [Google Scholar] [CrossRef] [PubMed] [Green Version]
- Du, K.; Han, Q.; Zhang, Y.; Kang, X. Differential Expression of Genes Related to the Formation of Giant Leaves in Triploid Poplar. Forests 2019, 10, 920. [Google Scholar] [CrossRef] [Green Version]
- Congping, X. Tetraploid induction and molecular basic of vegetative slowly growth in tetrapoid Populus spp. (Section Tcamahaca). Silva Fenn. 2018, 47, 2. [Google Scholar]
- Dong, C.-B.; Suo, Y.-J.; Kang, X.-Y. Assessment of the genetic composition of triploid hybrid Populus using SSR markers with low recombination frequencies. Can. J. For. Res. 2014, 44, 692–699. [Google Scholar] [CrossRef]
- Xu, C.; Huang, Z.; Liao, T.; Li, Y.; Kang, X. In vitro tetraploid plants regeneration from leaf explants of multiple genotypes in Populus. Plant Cell Tissue Organ Cult. (PCTOC) 2015, 125, 1–9. [Google Scholar] [CrossRef]
- Lichtenthalermpresidentoffespp, H.; Buschmann, C. Chlorophylls and Carotenoids: Measurement and Characterization by UV-VIS Spectroscopy. Curr. Protoc. Food Anal. Chem. 2001, 1, F4.3.1–F4.3.8. [Google Scholar] [CrossRef]
- Novák, O.; Hényková, E.; Sairanen, I.; Kowalczyk, M.; Pospíšil, T.; Ljung, K. Tissue-specific profiling of theArabidopsis thalianaauxin metabolome. Plant J. 2012, 72, 523–536. [Google Scholar] [CrossRef]
- Xiaojuan, S.; Baoguo, F.; Lichai, Y.; XiuNa, C.; Shanfa, L. Selection and Validation of Reference Genes for Quantitative RT-PCR Analysis of Gene Expression in Populus trichocarpa. Chin. Bull. Bot. 2014, 48, 507–518. [Google Scholar] [CrossRef]
- Zhang, L.; Zou, J.; Li, S.; Wang, B.; Raboanatahiry, N.; Li, M. Characterization and expression profiles of miRNAs in the triploid hybrids of Brassica napus and Brassica rapa. BMC Genom. 2019, 20, 649. [Google Scholar] [CrossRef] [Green Version]
- Meng, Y.; Li, J.; Liu, J.; Hu, H.; Li, W.; Liu, W.; Chen, S. Ploidy effect and genetic architecture exploration of stalk traits using DH and its corresponding haploid populations in maize. BMC Plant Biol. 2016, 16, 50. [Google Scholar] [CrossRef] [Green Version]
- Lichtenthaler, H.K. Chlorophylls and Carotenoids: Pigments of Photosynthetic Biomembranes. Methods in Enzymology; Academic Press: Orlando, FL, USA, 1987; Volume 148, pp. 183–350. [Google Scholar]
- Heyes, D.J.; Hunter, C.N. Making light work of enzyme catalysis: Protochlorophyllide oxidoreductase. Trends Biochem. Sci. 2005, 30, 642–649. [Google Scholar] [CrossRef] [PubMed]
- Paddock, T.; Mason, M.E.; Lima, D.F.; Armstrong, G.A. Arabidopsis protochlorophyllide oxidoreductase A (PORA) restores bulk chlorophyll synthesis and normal development to a porB porC double mutant. Plant Mol. Biol. 2009, 72, 445–457. [Google Scholar] [CrossRef] [PubMed]
- Kim, C.; Apel, K. Arabidopsis light-dependent NADPH: Protochlorophyllide oxidoreductase A (PORA) is essential for normal plant growth and development: An addendum. Plant Mol. Biol. 2012, 80, 237–240. [Google Scholar] [CrossRef] [PubMed]
- Reyes, J.C.; Muro-Pastor, M.I.; Florencio, F.J. The GATA Family of Transcription Factors in Arabidopsis and Rice. Plant Physiol. 2004, 134, 1718–1732. [Google Scholar] [CrossRef] [Green Version]
- Bi, Y.-M.; Zhang, Y.; Signorelli, T.; Zhao, R.; Zhu, T.; Rothstein, S. Genetic analysis of Arabidopsis GATA transcription factor gene family reveals a nitrate-inducible member important for chlorophyll synthesis and glucose sensitivity. Plant J. 2005, 44, 680–692. [Google Scholar] [CrossRef]
- Hudson, D.; Guevara, D.R.; Hand, A.J.; Xu, Z.; Hao, L.; Chen, X.; Zhu, T.; Bi, Y.-M.; Rothstein, S.J. Rice Cytokinin GATA Transcription Factor1 Regulates Chloroplast Development and Plant Architecture. Plant Physiol. 2013, 162, 132–144. [Google Scholar] [CrossRef] [Green Version]
- An, Y.; Zhou, Y.; Han, X.; Shen, C.; Wang, S.; Liu, C.; Yin, W.; Xia, X. The GATA transcription factor GNC plays an important role in photosynthesis and growth in poplar. J. Exp. Bot. 2019, 71, 1969–1984. [Google Scholar] [CrossRef]
- Zhang, C.; Huang, Y.; Xiao, Z.; Yang, H.; Hao, Q.; Yuan, S.; Chen, H.; Chen, L.; Chen, S.; Zhou, X.; et al. A GATA Transcription Factor from Soybean (Glycine max) Regulates Chlorophyll Biosynthesis and Suppresses Growth in the Transgenic Arabidopsis thaliana. Plants 2020, 9, 1036. [Google Scholar] [CrossRef]
- Teale, W.D.; Paponov, I.; Palme, K. Auxin in action: Signalling, transport and the control of plant growth and development. Nat. Rev. Mol. Cell Biol. 2006, 7, 847–859. [Google Scholar] [CrossRef]
- Leyser, O. Auxin Signaling. Plant Physiol. 2018, 176, 465–479. [Google Scholar] [CrossRef] [Green Version]
- Mroue, S.; Simeunovic, A.; Robert, H.S. Auxin production as an integrator of environmental cues for developmental growth regulation. J. Exp. Bot. 2018, 69, 201–212. [Google Scholar] [CrossRef] [PubMed]
- Woodward, A.W. Auxin: Regulation, Action, and Interaction. Ann. Bot. 2005, 95, 707–735. [Google Scholar] [CrossRef] [PubMed] [Green Version]
- E Staswick, P.; Serban, B.; Rowe, M.; Tiryaki, I.; Maldonado, M.T.; Maldonado, M.C.; Suza, W. Characterization of an Arabidopsis Enzyme Family That Conjugates Amino Acids to Indole-3-Acetic Acid. Plant Cell 2005, 17, 616–627. [Google Scholar] [CrossRef] [PubMed] [Green Version]
- Zhang, S.W.; Li, C.H.; Cao, J.; Zhang, Y.C.; Zhang, S.Q.; Xia, Y.F.; Sun, D.Y.; Sun, Y. Altered architecture and enhanced drought tolerance in rice via the down-regulation of indole-3-acetic acid by TLD1/OsGH3.13 activation. Plant Physiol. 2009, 151, 1889–1901. [Google Scholar] [CrossRef] [Green Version]
- Du, H.; Wu, N.; Fu, J.; Wang, S.; Li, X.; Xiao, J.; Xiong, L. A GH3 family member, OsGH3-2, modulates auxin and abscisic acid levels and differentially affects drought and cold tolerance in rice. J. Exp. Bot. 2012, 63, 6467–6480. [Google Scholar] [CrossRef] [Green Version]
- Nagpal, P.; Walker, L.M.; Young, J.C.; Sonawala, A.; Timpte, C.; Estelle, M.; Reed, J.W. AXR2 Encodes a Member of the Aux/IAA Protein Family. Plant Physiol. 2000, 123, 563–574. [Google Scholar] [CrossRef] [Green Version]
- Luo, J.; Zhou, J.-J.; Zhang, J.-Z. Aux/IAA Gene Family in Plants: Molecular Structure, Regulation, and Function. Int. J. Mol. Sci. 2018, 19, 259. [Google Scholar] [CrossRef] [Green Version]
- Zenser, N.; Ellsmore, A.; Leasure, C.; Callis, J. Auxin modulates the degradation rate of Aux/IAA proteins. Proc. Natl. Acad. Sci. USA 2001, 98, 11795–11800. [Google Scholar] [CrossRef] [Green Version]
- Gray, W.M.; Kepinski, S.; Rouse, D.; Leyser, O.; Estelle, M. Auxin regulates SCFTIR1-dependent degradation of AUX/IAA proteins. Nature 2001, 414, 271–276. [Google Scholar] [CrossRef]
- Kepinski, S.; Leyser, O. The Arabidopsis F-box protein TIR1 is an auxin receptor. Nat. Cell Biol. 2005, 435, 446–451. [Google Scholar] [CrossRef]
- Tan, X.; Calderon-Villalobos, L.I.A.; Sharon, M.; Zheng, C.; Robinson, C.V.; Estelle, M.; Zheng, N. Mechanism of auxin perception by the TIR1 ubiquitin ligase. Nat. Cell Biol. 2007, 446, 640–645. [Google Scholar] [CrossRef] [PubMed]
- Maraschin Fdos, S.; Memelink, J.; Offringa, R. Auxin-induced, SCF(TIR1)-mediated poly-ubiquitination marks AUX/IAA proteins for degradation. Plant J. 2009, 59, 100–109. [Google Scholar] [CrossRef] [PubMed]
- Yoshida, S. Molecular regulation of leaf senescence. Curr. Opin. Plant Biol. 2003, 6, 79–84. [Google Scholar] [CrossRef] [PubMed]
- Lim, P.O.; Woo, H.R.; Gil Nam, H. Molecular genetics of leaf senescence in Arabidopsis. Trends Plant Sci. 2003, 8, 272–278. [Google Scholar] [CrossRef]
- Li, Z.; Woo, H.R.; Guo, H. Genetic redundancy of senescence-associated transcription factors in Arabidopsis. J. Exp. Bot. 2017, 69, 811–823. [Google Scholar] [CrossRef]
- Nagata, N.; Tanaka, R.; Satoh, S.; Tanaka, A. Identification of a Vinyl Reductase Gene for Chlorophyll Synthesis in Arabidopsis thaliana and Implications for the Evolution of Prochlorococcus Species. Plant Cell 2005, 17, 233–240. [Google Scholar] [CrossRef] [Green Version]
- Beale, S.I. Green genes gleaned. Trends Plant Sci. 2005, 10, 309–312. [Google Scholar] [CrossRef]
- Bollivar, D.W. Recent advances in chlorophyll biosynthesis. Photosynth. Res. 2007, 90, 173–194. [Google Scholar] [CrossRef]
- Zhang, F.; Tang, W.; Hedtke, B.; Zhong, L.; Liu, L.; Peng, L.; Lu, C.; Grimm, B.; Lin, R. Tetrapyrrole biosynthetic enzyme protoporphyrinogen IX oxidase 1 is required for plastid RNA editing. Proc. Natl. Acad. Sci. USA 2014, 111, 2023–2028. [Google Scholar] [CrossRef] [Green Version]
- Walker, J.C.; Willows, R. Mechanism and regulation of Mg-chelatase. Biochem. J. 1997, 327, 321–333. [Google Scholar] [CrossRef] [Green Version]
- Masuda, T. Recent overview of the Mg branch of the tetrapyrrole biosynthesis leading to chlorophylls. Photosynth. Res. 2008, 96, 121–143. [Google Scholar] [CrossRef] [PubMed]
- Papenbrock, J.; Grafe, S.; Kruse, E.; Hanel, F.; Grimm, B. Mg-chelatase of tobacco: Identification of a Chl D cDNA sequence encoding a third subunit, analysis of the interaction of the three subunits with the yeast two-hybrid system, and reconstitution of the enzyme activity by co-expression of recombinant CHL D, CHL H and CHL I. Plant J. 1997, 12, 981–990. [Google Scholar] [CrossRef] [PubMed] [Green Version]
- Sawicki, A.; Zhou, S.; Kwiatkowski, K.; Luo, M.; Willows, R. 1-N-histidine phosphorylation of ChlD by the AAA+ ChlI2 stimulates magnesium chelatase activity in chlorophyll synthesis. Biochem. J. 2017, 474, 2095–2105. [Google Scholar] [CrossRef] [PubMed]
- Farmer, D.A.; Brindley, A.A.; Hitchcock, A.; Jackson, P.J.; Johnson, B.; Dickman, M.J.; Hunter, C.N.; Reid, J.D.; Adams, N.B.P. The ChlD subunit links the motor and porphyrin binding subunits of magnesium chelatase. Biochem. J. 2019, 476, 1875–1887. [Google Scholar] [CrossRef] [Green Version]
- Ikegami, A.; Yoshimura, N.; Motohashi, K.; Takahashi, S.; Romano, P.G.N.; Hisabori, T.; Takamiya, K.-I.; Masuda, T. The CHLI1 Subunit ofArabidopsis thalianaMagnesium Chelatase Is a Target Protein of the Chloroplast Thioredoxin. J. Biol. Chem. 2007, 282, 19282–19291. [Google Scholar] [CrossRef] [Green Version]
- Kobayashi, K.; Mochizuki, N.; Yoshimura, N.; Motohashi, K.; Hisabori, T.; Masuda, T. Functional analysis of Arabidopsis thaliana isoforms of the Mg-chelatase CHLI subunit. Photochem. Photobiol. Sci. 2008, 7, 1188–1195. [Google Scholar] [CrossRef]
- Block, M.A.; Tewari, A.K.; Albrieux, C.; Maréchal, E.; Joyard, J. The plant S -adenosyl-l -methionine: Mg-protoporphyrin IX methyltransferase is located in both envelope and thylakoid chloroplast membranes. JBIC J. Biol. Inorg. Chem. 2002, 269, 240–248. [Google Scholar] [CrossRef]
- Alawady, A.; Reski, R.; Yaronskaya, E.; Grimm, B. Cloning and expression of the tobacco CHLM sequence encoding Mg protoporphyrin IX methyltransferase and its interaction with Mg chelatase. Plant Mol. Biol. 2005, 57, 679–691. [Google Scholar] [CrossRef]
- Alboresi, A.; Ballottari, M.; Hienerwadel, R.; Giacometti, G.M.; Morosinotto, T. Antenna complexes protect Photosystem I from Photoinhibition. BMC Plant Biol. 2009, 9, 71. [Google Scholar] [CrossRef] [Green Version]
- Fox, K.F.; Ünlü, C.; Balevičius, V.; Ramdour, B.N.; Kern, C.; Pan, X.; Li, M.; Van Amerongen, H.; Duffy, C.D.P. A possible molecular basis for photoprotection in the minor antenna proteins of plants. Biochim. Biophys. Acta (BBA) Bioenerg. 2018, 1859, 471–481. [Google Scholar] [CrossRef]
- De Bianchi, S.; Betterle, N.; Kouril, R.; Cazzaniga, S.; Boekema, E.; Bassi, R.; Osto, L.D. Arabidopsis Mutants Deleted in the Light-Harvesting Protein Lhcb4 Have a Disrupted Photosystem II Macrostructure and Are Defective in Photoprotection. Plant Cell 2011, 23, 2659–2679. [Google Scholar] [CrossRef] [PubMed] [Green Version]
- Adamiec, M.; Gibasiewicz, K.; Luciński, R.; Giera, W.; Chełminiak, P.; Szewczyk, S.; Sipińska, W.; Van Grondelle, R.; Jackowski, G. Excitation energy transfer and charge separation are affected in Arabidopsis thaliana mutants lacking light-harvesting chlorophyll a/b binding protein Lhcb3. J. Photochem. Photobiol. B Biol. 2015, 153, 423–428. [Google Scholar] [CrossRef] [PubMed]
- Chen, Y.-E.; Ma, J.; Wu, N.; Su, Y.-Q.; Zhang, Z.-W.; Yuan, M.; Zhang, H.-Y.; Zeng, X.-Y.; Yuan, S. The roles of Arabidopsis proteins of Lhcb4, Lhcb5 and Lhcb6 in oxidative stress under natural light conditions. Plant Physiol. Biochem. 2018, 130, 267–276. [Google Scholar] [CrossRef] [PubMed]
- Ihalainen, J.A.; Klimmek, F.; Ganeteg, U.; Van Stokkum, I.H.; Van Grondelle, R.; Jansson, S.; Dekker, J.P. Excitation energy trapping in photosystem I complexes depleted in Lhca1 and Lhca4. FEBS Lett. 2005, 579, 4787–4791. [Google Scholar] [CrossRef] [PubMed] [Green Version]
- Otani, T.; Yamamoto, H.; Shikanai, T. Stromal Loop of Lhca6 is Responsible for the Linker Function Required for the NDH–PSI Supercomplex Formation. Plant Cell Physiol. 2017, 58, 851–861. [Google Scholar] [CrossRef] [Green Version]
- Wright, I.J.; Reich, P.B.; Westoby, M.; Ackerly, D.; Baruch, Z.; Bongers, F.; Cavender-Bares, J.; Chapin, T.; Cornelissen, J.H.C.; Diemer, M.; et al. The worldwide leaf economics spectrum. Nature 2004, 428, 821–827. [Google Scholar] [CrossRef]
- Delvallé, D.; Dumez, S.; Wattebled, F.; Roldán, I.; Planchot, V.; Berbezy, P.; Colonna, P.; Vyas, D.; Chatterjee, M.; Ball, S.; et al. Soluble starch synthase I: A major determinant for the synthesis of amylopectin in Arabidopsis thaliana leaves. Plant J. 2005, 43, 398–412. [Google Scholar] [CrossRef]
- Szydlowski, N.; Ragel, P.; Raynaud, S.; Lucas, M.M.; Roldán, I.; Montero, M.; Muñoz, F.J.; Ovecka, M.; Bahaji, A.; Planchot, V.; et al. Starch Granule Initiation in Arabidopsis Requires the Presence of Either Class IV or Class III Starch Synthases. Plant Cell 2009, 21, 2443–2457. [Google Scholar] [CrossRef] [Green Version]
- Crumpton-Taylor, M.; Pike, M.; Lu, K.; Hylton, C.M.; Feil, R.; Eicke, S.; Lunn, J.E.; Zeeman, S.C.; Smith, A.M. Starch synthase 4 is essential for coordination of starch granule formation with chloroplast division during Arabidopsis leaf expansion. New Phytol. 2013, 200, 1064–1075. [Google Scholar] [CrossRef]
- Maloney, V.; Park, J.-Y.; Unda, F.; Mansfield, S.D. Sucrose phosphate synthase and sucrose phosphate phosphatase interact in planta and promote plant growth and biomass accumulation. J. Exp. Bot. 2015, 66, 4383–4394. [Google Scholar] [CrossRef] [Green Version]
- Matile, P.; Hörtensteiner, S.; Thomas, H. CHLOROPHYLL DEGRADATION. Annu. Rev. Plant Biol. 1999, 50, 67–95. [Google Scholar] [CrossRef] [PubMed] [Green Version]
- Park, S.-Y.; Yu, J.-W.; Park, J.-S.; Li, J.; Yoo, S.-C.; Lee, N.-Y.; Lee, S.-K.; Jeong, S.-W.; Seo, H.S.; Koh, H.-J.; et al. The Senescence-Induced Staygreen Protein Regulates Chlorophyll Degradation. Plant Cell 2007, 19, 1649–1664. [Google Scholar] [CrossRef] [PubMed] [Green Version]
Figure 1.
Morphological features of diploid, triploid, and tetraploid poplar saplings. (A) The phenotype of diploid, triploid, and tetraploid saplings grown for 3 months in greenhouse conditions, and tetraploid is the lowest and triploid is the highest. (B) Morphology of leaves grown for 11 days, and polyploid leaves are greener than diploid, and triploid leaf is the largest. (C) Comparison of stem internodes and that of tetraploid is the shortest and that of the triploid is the longest. Diploid, triploid, and tetraploid are in order from left to right. Scale bars are 5 cm (B) and 2 cm (C). Di., Tri., and Tetra. represent diploids, triploids, and tetraploids, respectively.
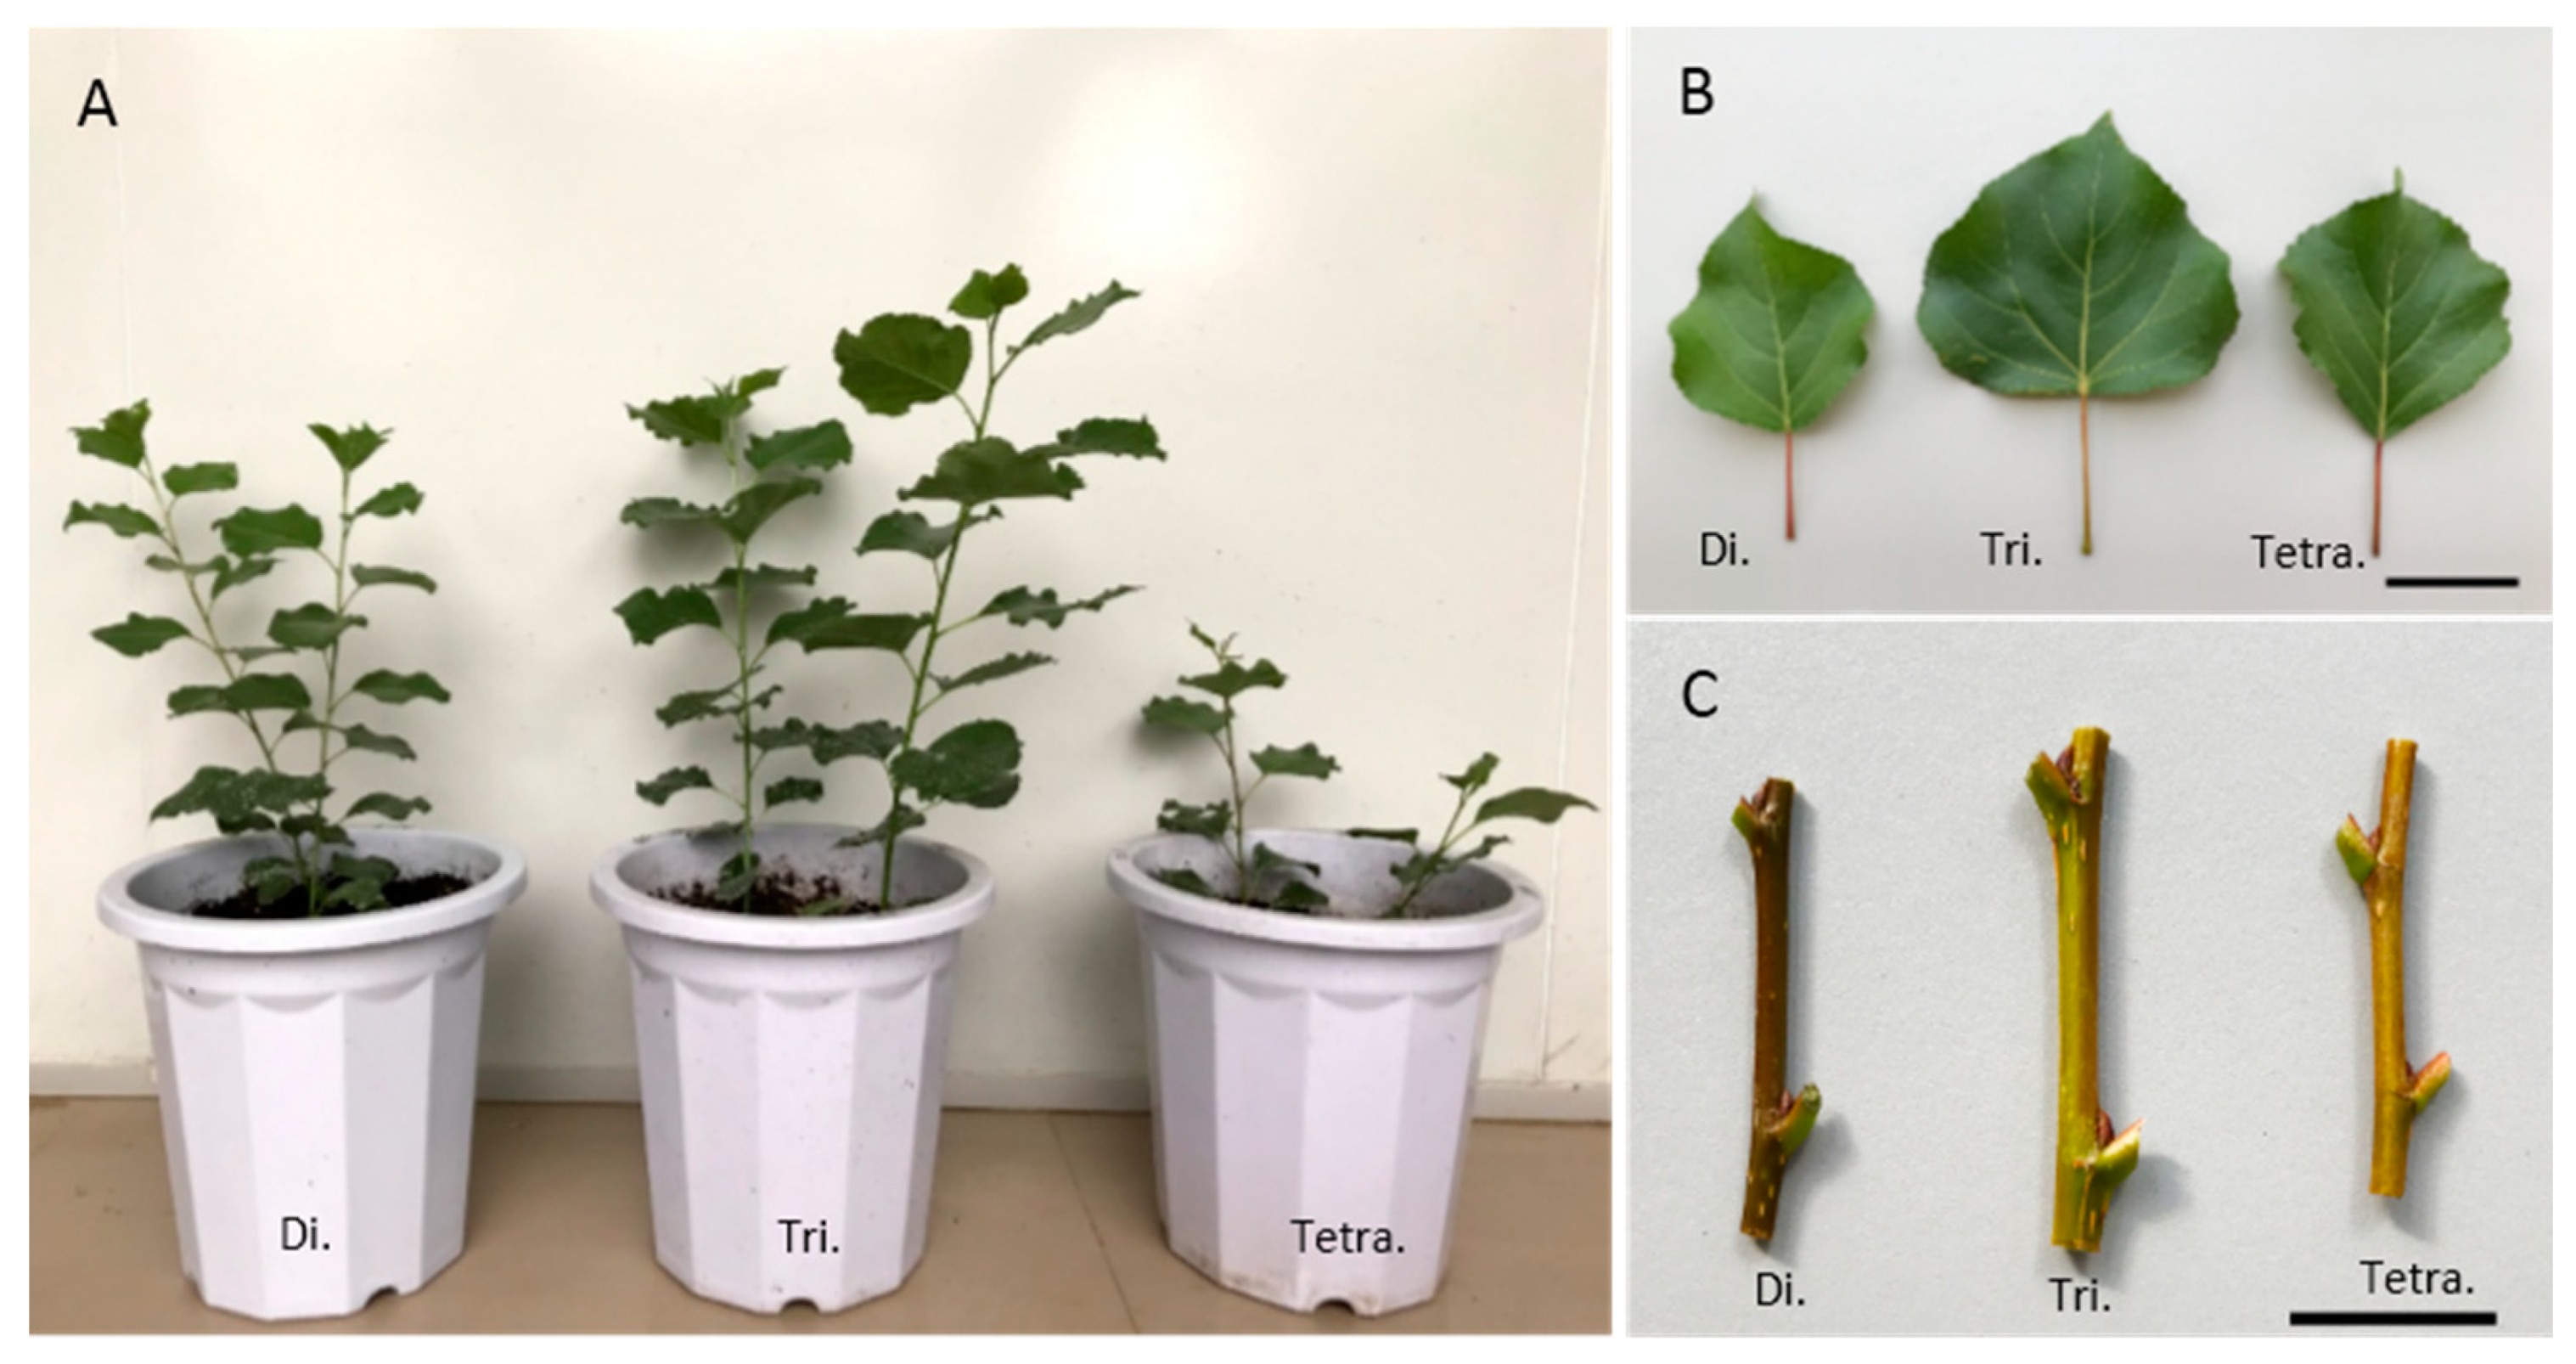
Figure 2.
Phenotypic and physiological analysis of diploid, triploid, and tetraploid poplar saplings. (A) Tree height of diploid, triploid, and tetraploid saplings grown for 3 months in greenhouse conditions, and the height is consistent with the phenotype seen. (B) Leaf area, (C) chlorophyll content, and (D) the endogenous auxin (IAA) content of leaves grown for 11 days. The area of triploid and tetraploid is significantly larger than that of diploid leaves, and it is consistent with the leaf area. IAA content of triploid leaves is the highest. Different letters above the bars indicate statistically significant differences (p < 0.05). Di., Tri., and Tetra. represent diploids, triploids, and tetraploids, respectively.
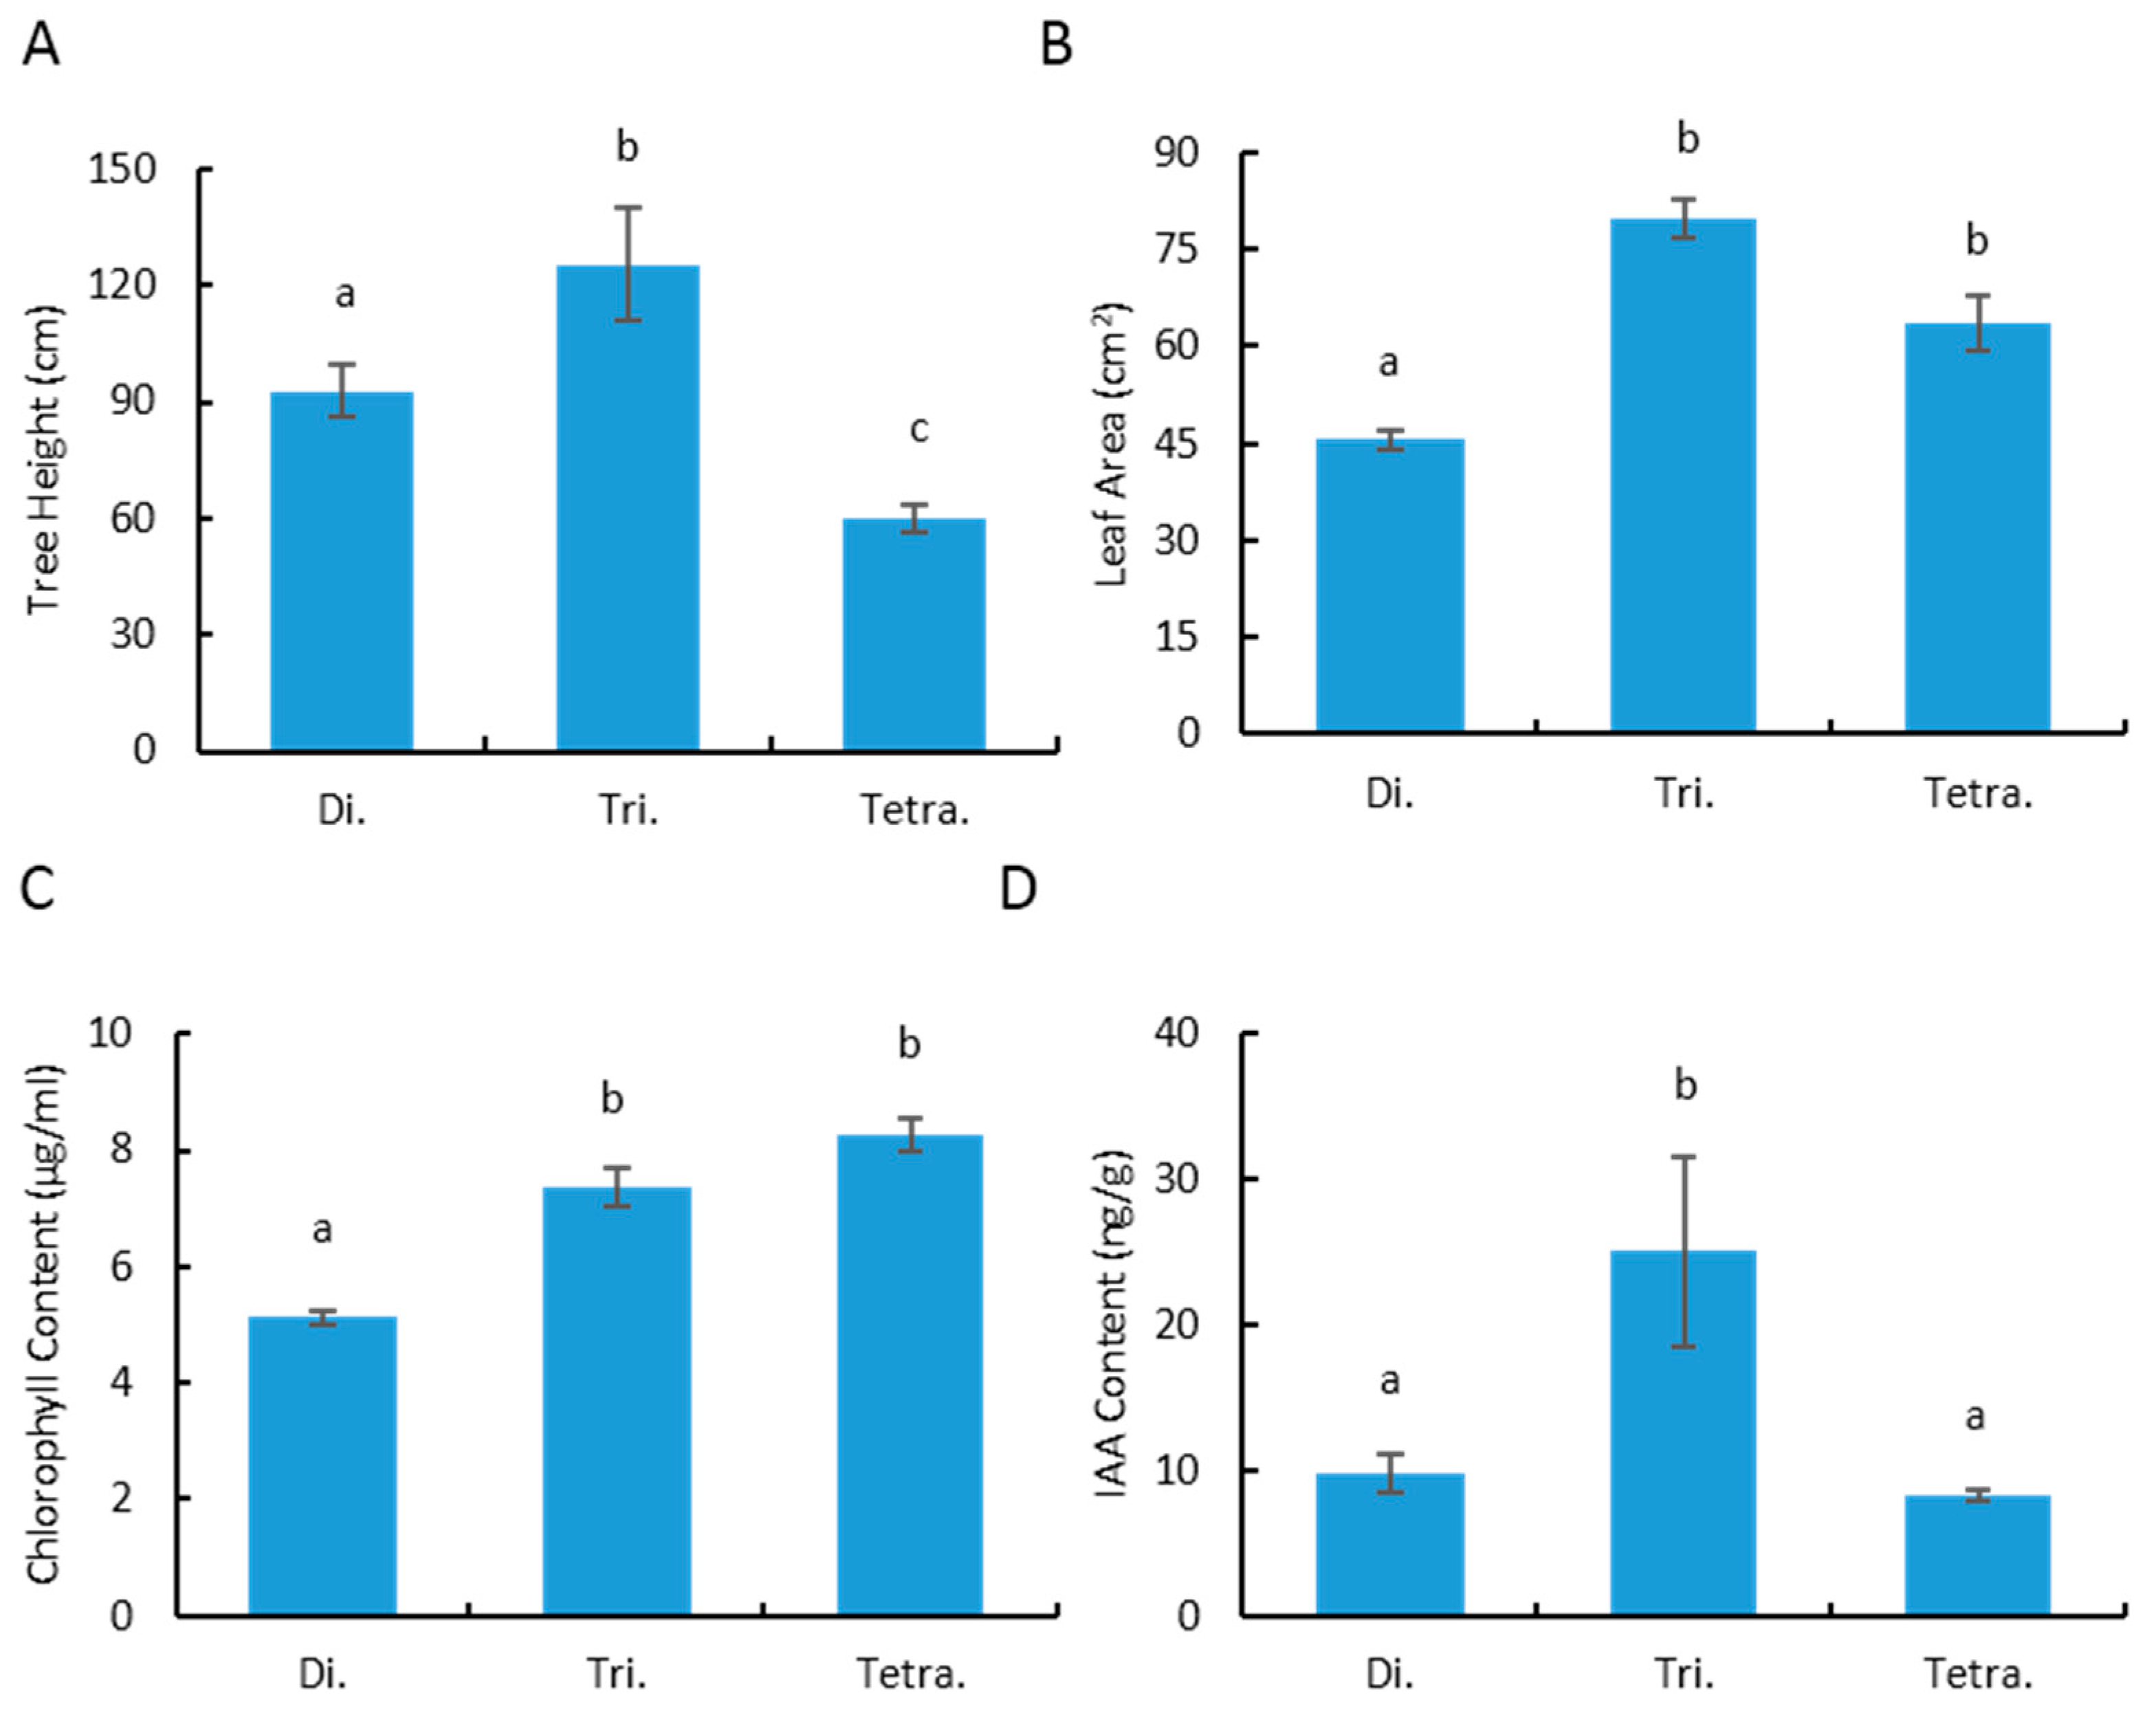
Figure 3.
Differential gene expression in leaves as determined by RNA sequencing. (A) Venn diagrams illustrating overlaps between the gene sets that were differentially expressed in leaves of diploid versus triploid, diploid versus tetraploid, and triploid versus tetraploid and the number of DEGs between triploid and tetraploid is greatest. (B) Cluster analysis of different RNA sequencing samples, and triploid and tetraploid are the farthest from each other. (C) Word cloud from annotations of genes differentially expressed between diploid versus tetraploid, or triploid versus tetraploid, and auxin is the hormone with the largest number of DEGs. vs. represents versus.
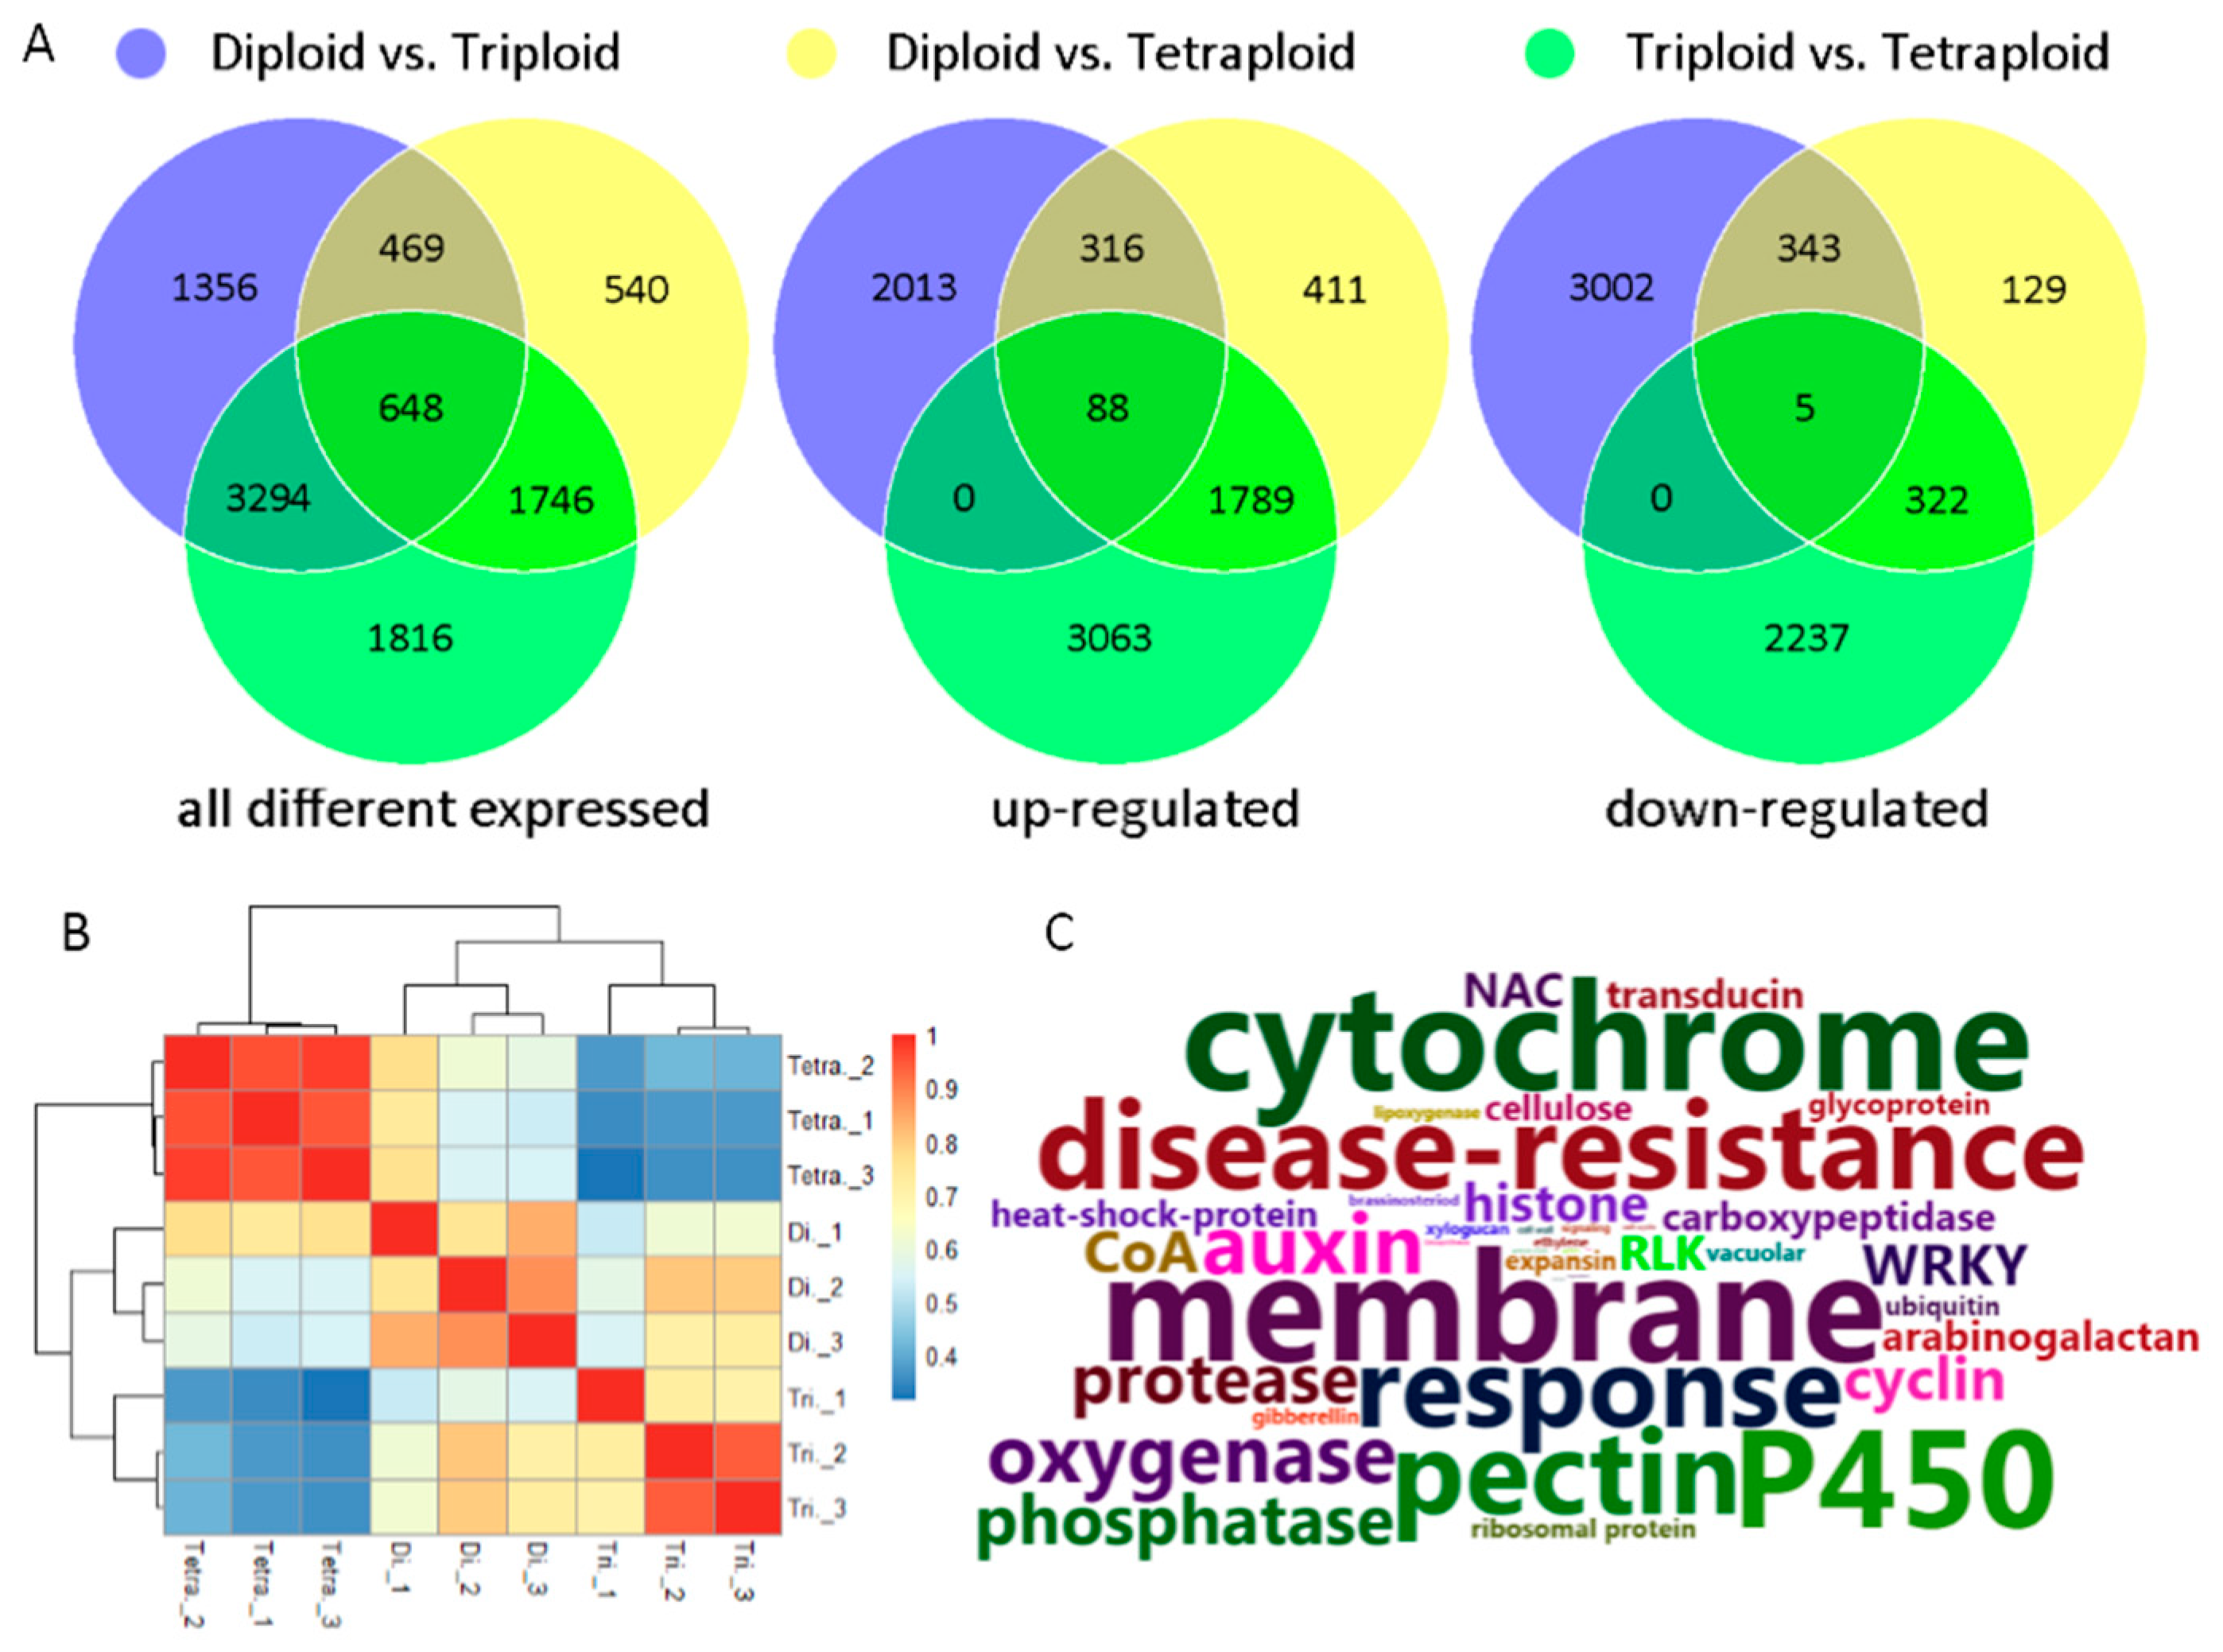
Figure 4.
qRT-PCR validation of differentially expressed known gene sequences obtained from deep sequencing, and the expression trends are consistent with RNA-seq data. Di., Tri., and Tetra. represent diploids, triploids, and tetraploids, respectively.
Figure 4.
qRT-PCR validation of differentially expressed known gene sequences obtained from deep sequencing, and the expression trends are consistent with RNA-seq data. Di., Tri., and Tetra. represent diploids, triploids, and tetraploids, respectively.
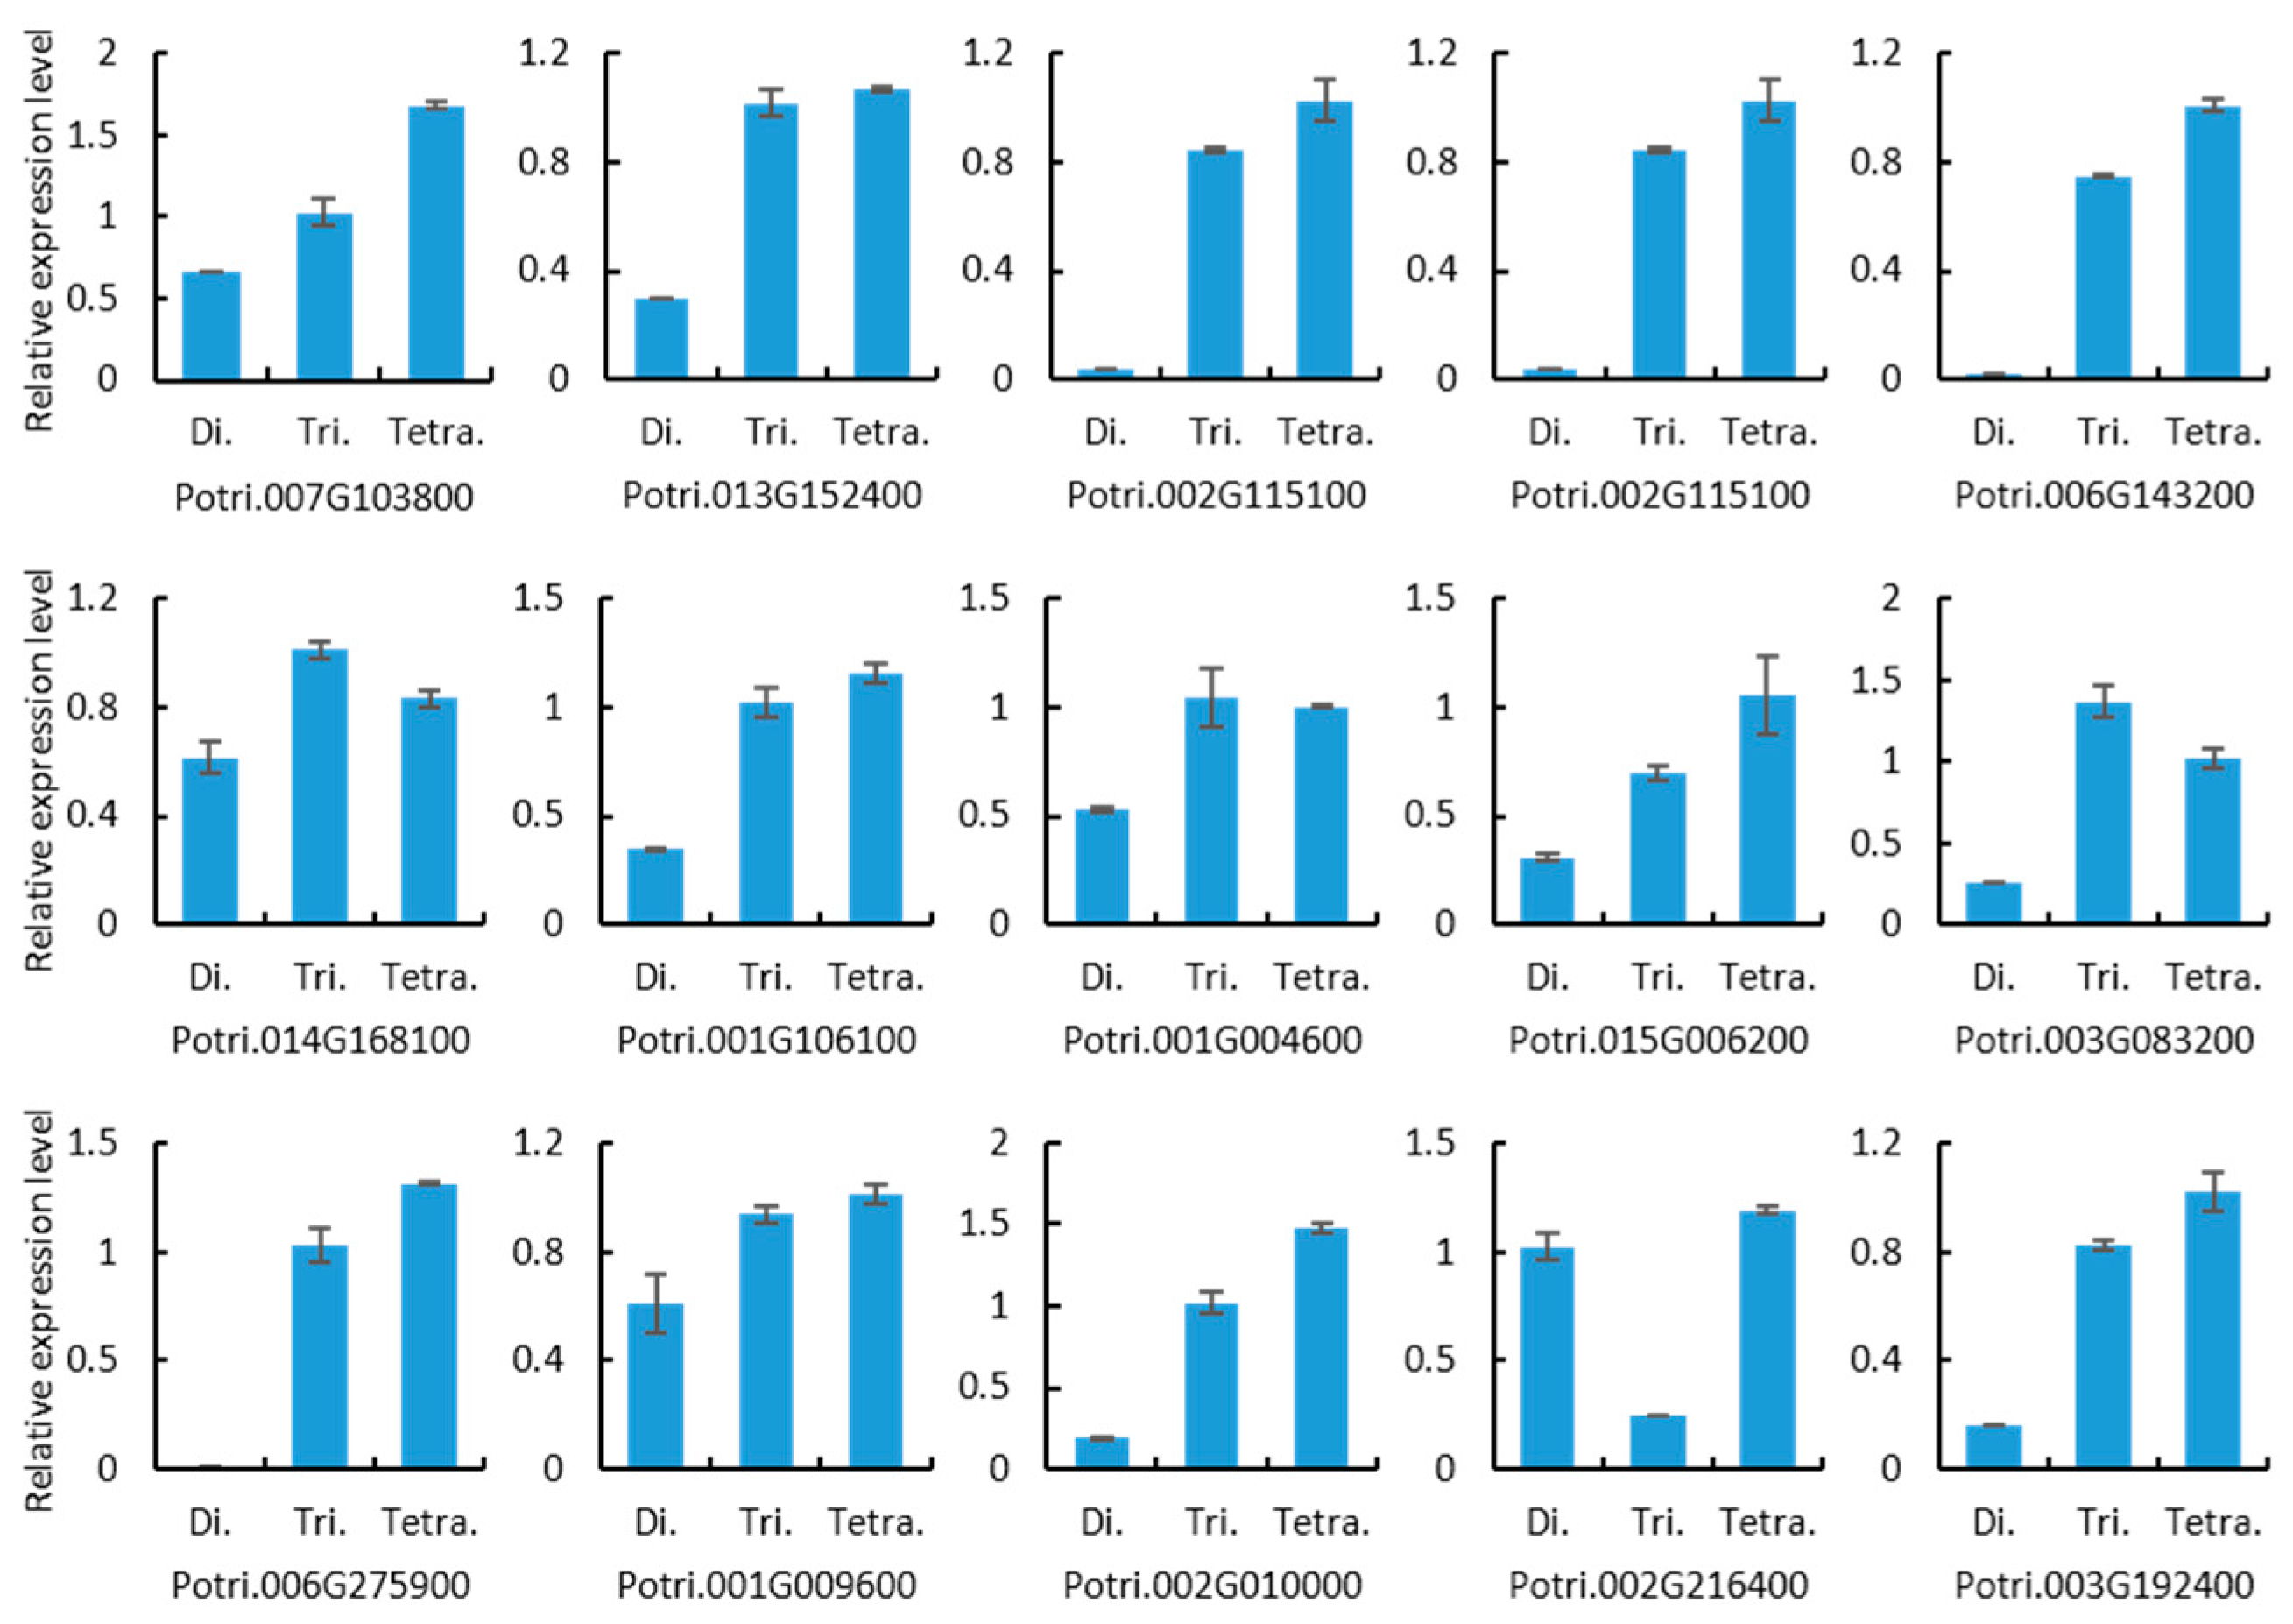
Figure 5.
GO analysis of differentially expressed genes (DEGs) of diploid versus triploid, diploid versus tetraploid, and triploid versus tetraploid. Di., Tri., and Tetra. represent diploids, triploids, and tetraploids, respectively.
Figure 5.
GO analysis of differentially expressed genes (DEGs) of diploid versus triploid, diploid versus tetraploid, and triploid versus tetraploid. Di., Tri., and Tetra. represent diploids, triploids, and tetraploids, respectively.
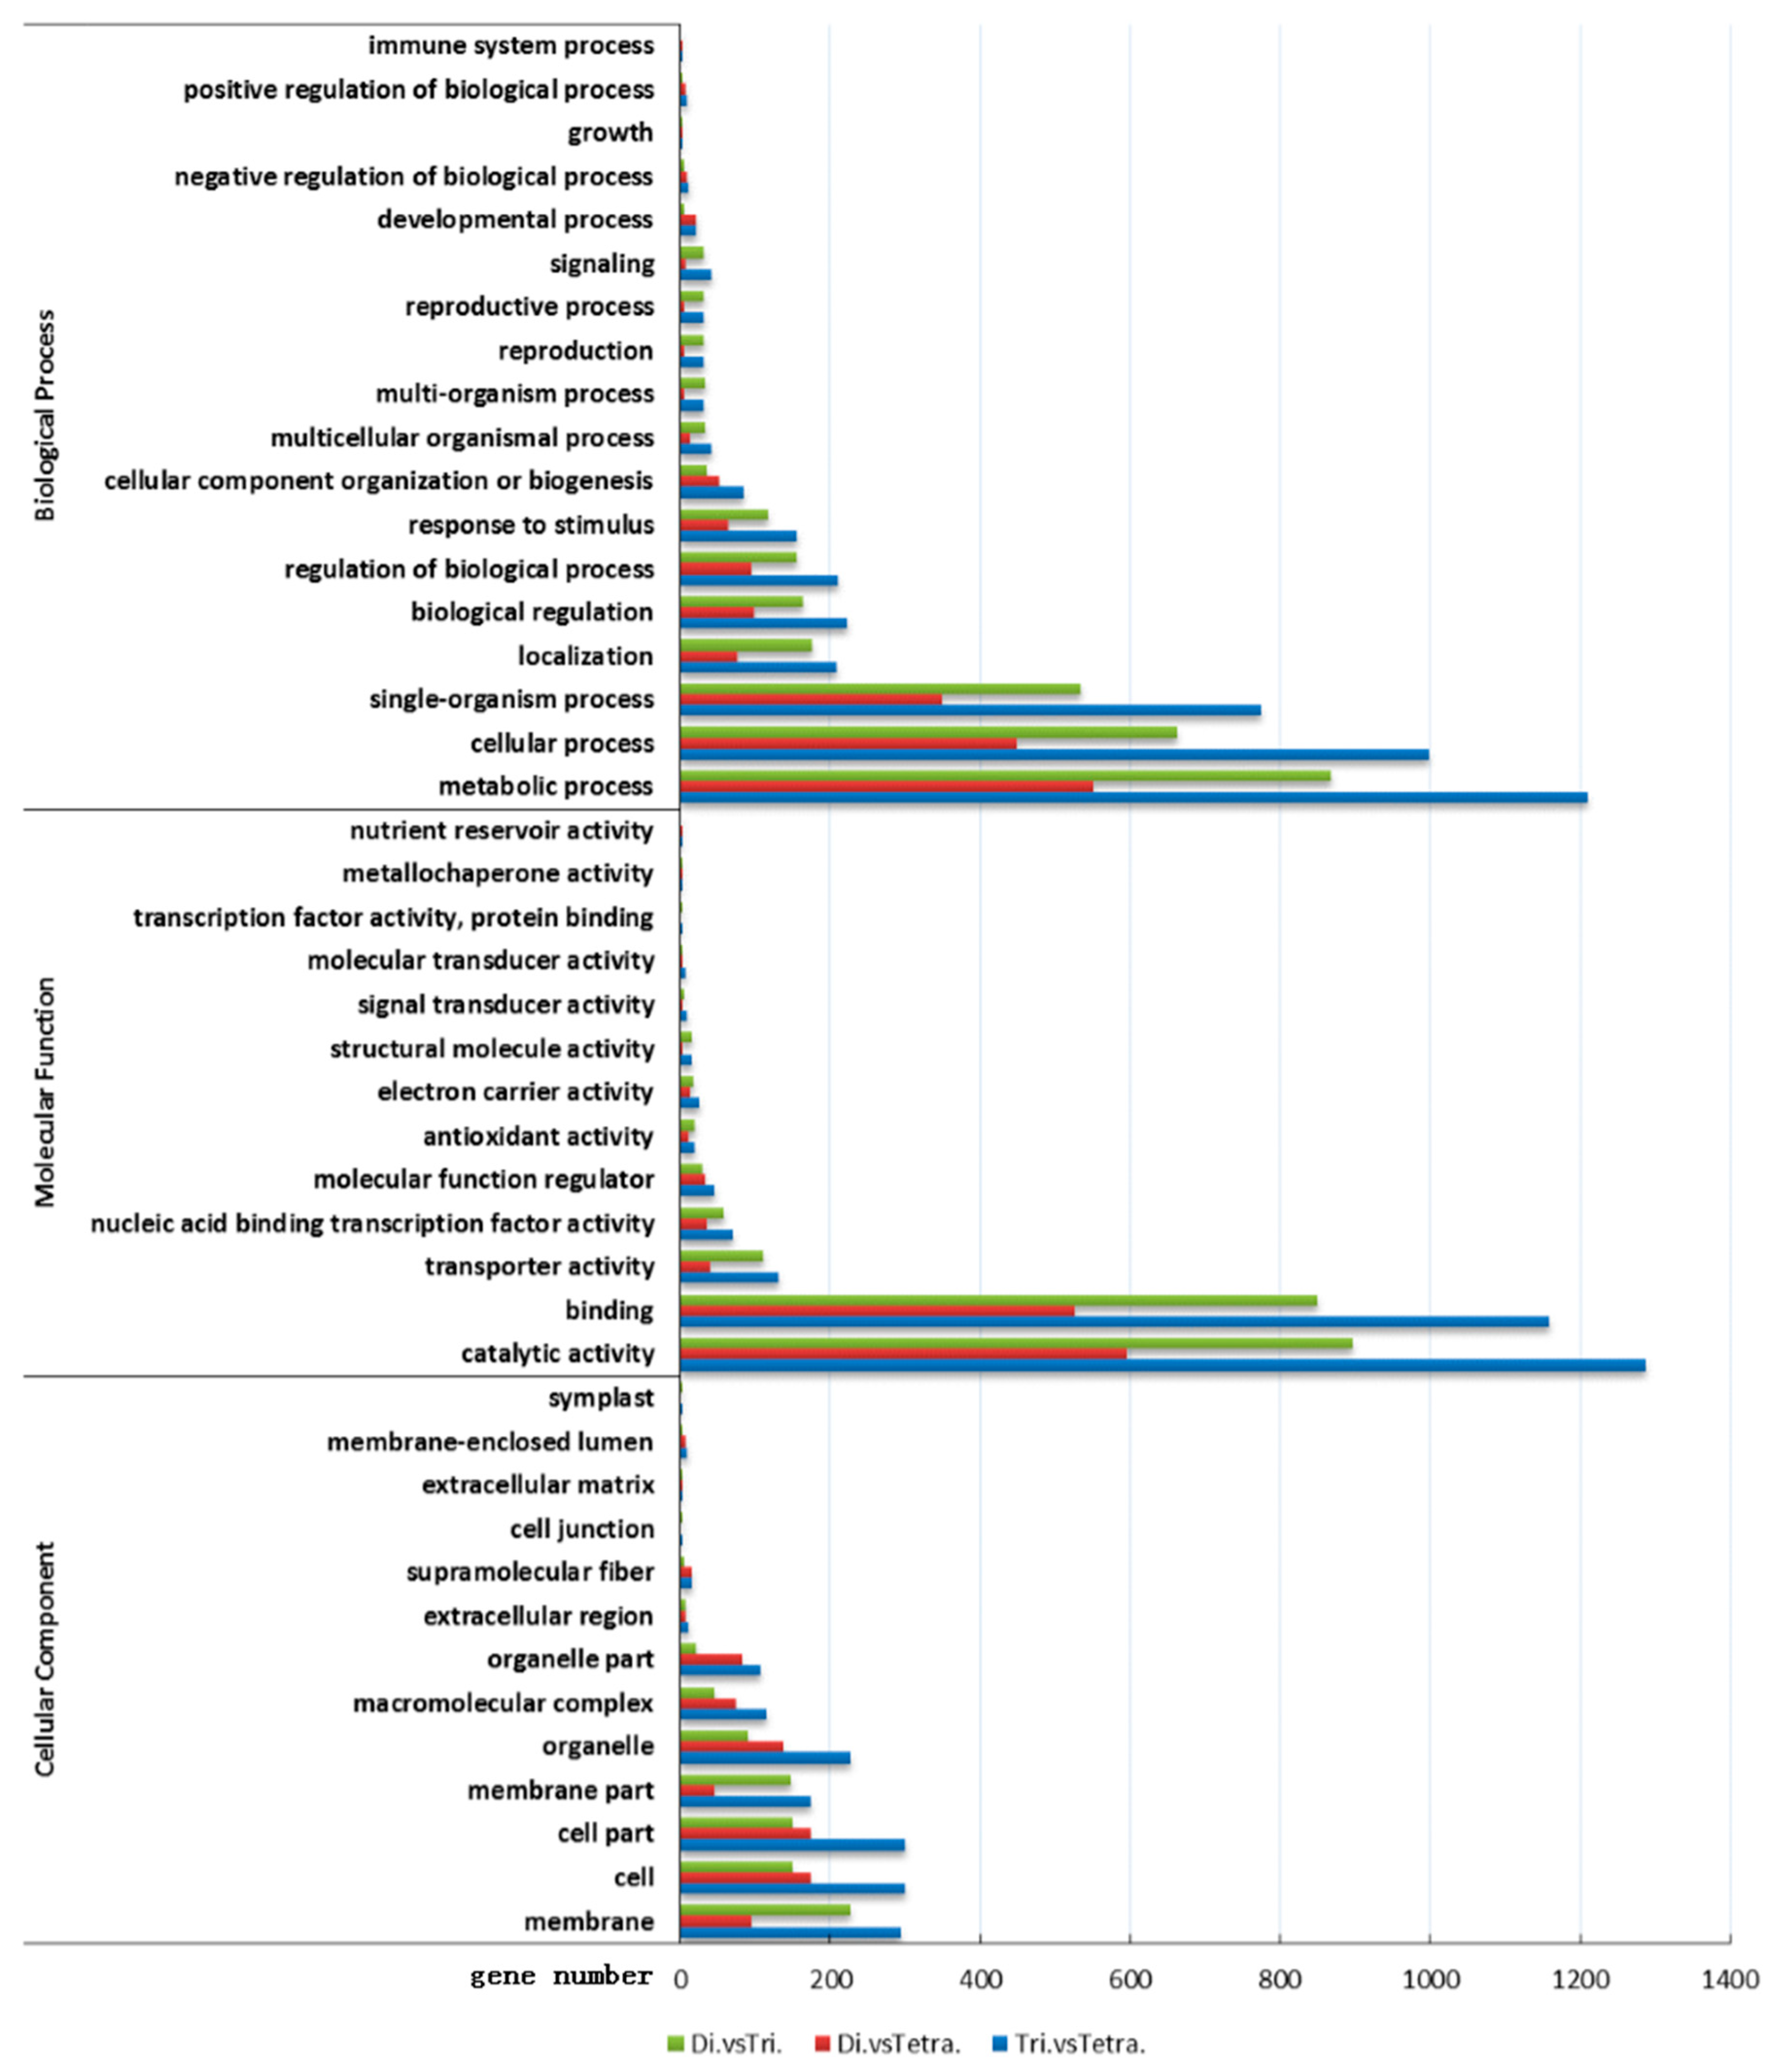
Figure 6.
Heat map. (A) GRFs expression level of diploid versus tetraploid. (B) GATAs expression level of diploid versus tetraploid. (C) GRFs expression level of triploid versus tetraploid. (D) GATAs expression level of triploid versus tetraploid. And compared with diploid and triploid, most GRFs and GATAs are upregulated in tetraploid. Di., Tri., and Tetra. represent diploids, triploids, and tetraploids, respectively.

Publisher’s Note: MDPI stays neutral with regard to jurisdictional claims in published maps and institutional affiliations. |
© 2020 by the authors. Licensee MDPI, Basel, Switzerland. This article is an open access article distributed under the terms and conditions of the Creative Commons Attribution (CC BY) license (http://creativecommons.org/licenses/by/4.0/).
Share and Cite
MDPI and ACS Style
Zhang, Y.; Ren, Y.; Kang, X. Study on Gene Differential Expression in Tetraploid Populus Leaves. Forests 2020, 11, 1233. https://doi.org/10.3390/f11111233
AMA Style
Zhang Y, Ren Y, Kang X. Study on Gene Differential Expression in Tetraploid Populus Leaves. Forests. 2020; 11(11):1233. https://doi.org/10.3390/f11111233
Chicago/Turabian StyleZhang, Ying, Yongyu Ren, and Xiangyang Kang. 2020. "Study on Gene Differential Expression in Tetraploid Populus Leaves" Forests 11, no. 11: 1233. https://doi.org/10.3390/f11111233
Note that from the first issue of 2016, this journal uses article numbers instead of page numbers. See further details here.