The Impact of Water-Soluble Inorganic Ions in Particulate Matter (PM2.5) on Litter Decomposition in Chinese Subtropical Forests


1
School of Life Sciences, Nanjing University, Nanjing 210023, China
2
Key Laboratory of Ecological Security for Water Source Region of Mid-line Project of South-to-North Diversion Project of Henan Province, College of Agricultural Engineering, Nanyang Normal University, Nanyang 473061, China
3
Co-Innovation Center for Sustainable Forestry in Southern China, Nanjing Forestry University, Nanjing 210037, China
*
Author to whom correspondence should be addressed.
Forests 2020, 11(2), 238; https://doi.org/10.3390/f11020238
Submission received: 1 December 2019
/
Revised: 17 February 2020
/
Accepted: 18 February 2020
/
Published: 21 February 2020
(This article belongs to the Section Forest Ecology and Management)
Abstract
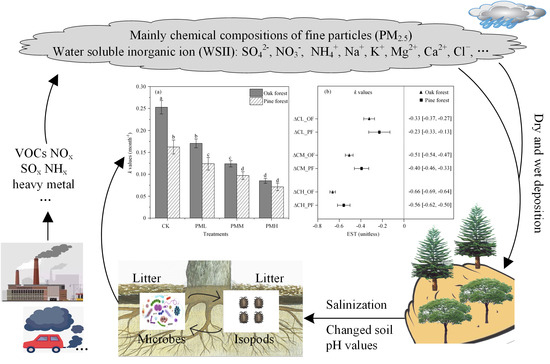
:Although numerous studies have demonstrated the toxic effects of fine particulates less than 2.5 µm (PM2.5) on the health of humans, little information is available on the ecotoxicity of PM2.5. Water-soluble inorganic ions (WSII, including Na+, NH4+, K+, Mg2+, Ca2+, Cl−, NO3−, and SO42−) can compose more than 60% of PM2.5. To better understand the possible impacts of WSII-PM2.5 on leaf litter decomposition, we conducted an experiment in which two leaf litters from oak (Quercus variabilis) and pine (Pinus massoniana) dominant forests in subtropical China were incubated in microcosms containing their respective forest soils and treated with WSII-PM2.5. Our results showed that, after six-months of decomposition, the WSII-PM2.5 treatments inhibited leaf litter decomposition rates, carbon and nitrogen loss, microbial biomass, and enzyme activities in the two forests. In addition, higher WSII-PM2.5 concentration led to stronger negative effects. Comparative analysis showed that the negative effects of WSII-PM2.5 on oak forest were greater than on pine forest, relating to the higher susceptibility to changes of soil microenvironment in oak forests. WSII-PM2.5 may influence decomposition through soil acidification and salinization, which could also cause a sub-lethal depression in soil isopod activity. However, in the first month of decomposition, mass loss of the oak and pine leaf litters under the low concentration WSII-PM2.5 were 21.63% and 35.64% higher than that under the control, respectively. This suggests that transitory low concentrations of WSII-PM2.5 have a promoting effect on decomposition. Long-term PM2.5 exposure, therefore, may have profound ecosystem consequences by altering the balance of ecosystem carbon flux, nutrient cycling, and humus formation in the future.
1. Introduction
Airborne pollutants are often microscopic particulates, which can come from factories, power plants, refuse incinerators, motor vehicles, construction activity, fires, and natural windblown dust [1,2]. Particulate matter (PM) is a harmful form of air pollution due to its ability to penetrate deep into the lungs and bloodstream unfiltered, causing permanent DNA mutations, heart attacks, respiratory disease, and premature death [3,4]. Fine particles with a diameter of 2.5 μm or less (PM2.5) are particularly deadly [5]. Thus, an increasing number of studies are focused on this class of pollutants [6,7,8]. To the extent of our knowledge, although many studies have been performed examining the effects of PM2.5 on human health [1,4,9], very little information is available on the ecotoxicity of PM2.5 [6,7].
Recent research has shown that PM2.5 can affect aquatic ecosystems. Zhao et al. [6] found that acute exposure to high concentrations of PM2.5 and prolonged exposure to low concentrations of PM2.5 resulted in adverse effects on development, lifespan, reproduction, locomotive behavior, and intestinal development of nematodes (Caenorhabditis elegans). Hartono et al. [7] showed that high PM2.5 deposition in water bodies, associated with acidification, had an adverse effect on aquatic organisms. Wu and Zhang [8] also found that PM2.5 had a significant impact on aquatic ecosystem function, such as leaf litter decomposition, through increasing acidification in aquatic environments.
Terrestrial forest ecosystems are also exposed to the acidic and toxic chemicals in PM2.5 [10]. However, studies on the ecotoxicity of PM2.5 on leaf litter decomposition in terrestrial forest ecosystems are still lacking. Water-soluble inorganic ions (WSII, including Na+, NH4+, K+, Mg2+, Ca2+, Cl−, NO3−, and SO42−) constitute more than 60% of PM2.5, and SO42−, NO3−, and NH4+ are greatly enhanced during haze days [11,12,13,14]. In addition, ion balance calculations also showed that PM2.5 samples were highly acidic during haze periods and close to neutral during non-haze days [14]. Lv et al. [15] and Wang et al. [16] showed that acidic precipitation is associated with sulfates and nitrates, which are also largely included in WSII–PM2.5, and this negatively affects litter decomposition by damaging the ecological functions of soil microbes. Furthermore, an excess of water-soluble inorganic ions in PM2.5 (WSII–PM2.5) may cause soil salinization, reducing the activity of soil enzyme proteins [17,18]. This suggests that the chemical compositions of PM2.5 have the ability to affect litter decomposition, but the specific impact is rarely studied. Therefore, research on investigating the effects of WSII–PM2.5 on forest litter decomposition is an important topic of terrestrial ecology.
Soil organisms control many processes in detrital food webs, enhance the decomposition of organic matter, and are essential for humus formation and its further transformation in all terrestrial ecosystems [19]. Soil microbes are, therefore, an integral part of plant and soil ecosystems [20] and play pivotal roles in litter decomposition and nutrient cycling in forest ecosystems [21]. Long-term WSII–PM2.5 exposure may alter vegetation and soil [22], possibly affecting soil microbial function [23]. Extracellular enzymes (such as cellobiohydrolase, glucosidase, nitrate reductase, urease, phosphatase, polyphenol oxidase, and peroxidase) play a crucial role in litter decomposition and nutrient cycling in forest ecosystems [24]. Measurement of soil extracellular enzyme activities has been recommended as the most appropriate indicator of microbial function, soil fertility, and ecological stability [25]. In addition, soil faunas regulate litter decomposition directly by preying on litter and indirectly by interacting with microbes [26]. Compared with the micro- (nematodes) and meso- invertebrates (oribatids and collembolans), macro-invertebrates (woodlice and millipedes) are better able to dramatically affect microbial function [27]. In a polluted ecosystem, terrestrial macro-invertebrates may be exposed to pollutants because both their food source and their microhabitat in the upper layer of soil are likely to be contaminated [28]. However, to our knowledge, no researchers have yet studied the effects of WSII–PM2.5 on the synergies between the soil microbes and faunas in regulating the decomposition of litter belowground.
In the present study, we performed a microcosm experiment to investigate the potential impacts of WSII–PM2.5 on leaf litter decomposition in two typical forests (oak forest vs. pine forest) in subtropical China. We paid special attention to how WSII–PM2.5 alters the ecological functions of the decomposer community in mediating litter decomposition, thereby regulating soil carbon and nutrient cycles. Specifically, we tested three hypotheses. First, given the potential ecotoxicity of WSII–PM2.5, we hypothesized that leaf litter decomposition and the associated decomposer activities (e.g., soil extracellular enzyme activities, microbial biomass, and survival of soil fauna) would be depressed under WSII-PM2.5 exposure. Second, a previous study confirmed that the litter–microbial decomposer interactions may modify the trajectory of litter mineralization via extracellular enzymatic synthesis [29]. Thus, we hypothesize that the decreasing activity of the related soil extracellular enzymes under WSII–PM2.5 exposure would slow down carbon and nitrogen mineralization rates of the two leaf litters in their corresponding forest soils. Finally, it is suggested that biota may adapt more easily to anthropogenic stresses after they are exposed to similar natural stresses [30]. Considering that the initial soil acidity of the oak forest was higher than that of the pine forest in this study, we hypothesize that the resistance of microbial communities to WSII–PM2.5 would be higher in the oak forest than that in the pine forest [15,16].
2. Methods and Materials
2.1. Study Site
Soil and leaf litter for the experiments were collected from a 67-year-old oak forest dominated by Q. acutissima and a 47-year-old pine plantation of P. massoniana in Xiashu forest farm (31°59′ N, 119°14′E), Zhenjiang, Jiangsu, China. The mean diameter at breast height (DBH) was 32.50 cm in the oak forest and 21.30 cm in the pine forest, and the height of the trees varied between 15 to 20 m in the oak forest and 10 to 15 m in the pine forest. The region has an area of 314.40 ha, including forestland of 298.90 ha. The mean annual temperature is 15.20 °C. The recorded extreme maximum and minimum temperatures are 39.60 and −16.70 °C, respectively. The mean annual precipitation is 1055.60 mm with a range from 425.20 to 1408.30 mm. Based on the Chinese Soil Taxonomic Classification (Revised Proposal, 1995), the soil was classified as luvisol. The humus content of the surface soil is generally 2.50%. Because most of the salts have been leached, the soil has an acid or strongly acid reaction [31].
2.2. Collection of Soil, Leaf Litter, and Isopods
Four discrete plots (2 × 2 m), separated from each other by approximately 10 m, were chosen in both oak forest and pine forest. In December 2016, freshly fallen leaves of oak and pine were collected at each of the four plots. All leaf litter samples were taken back to the laboratory and oven-dried at 60 °C for 48 h to achieve a constant weight for further study. Four soil samples from each forest type were collected from the top layers (0–5 cm) of each plot. All soil samples were kept in sealed bags and immediately taken back to the laboratory. After collection, soil samples were passed through a 2-mm sieve to remove leaves, plant roots, and gravel. The soil samples derived from the two forests were selected as the sources of microbes. Four soil samples from each forest type were then kept in a refrigerator at 4 °C until the start of incubation.
Isopods (Armadillidium vulgare) are widespread, easily identified, and a dominant component of the soil arthropod macro-decomposer community in the forest [32]. A. vulgare is also the most extensively investigated terrestrial isopod species [33]. They feed on dead organic material and are key system regulators of decomposition and nutrient recycling [34]. They can be sampled readily by hand, through pitfall traps or extracted from soil by heat and light [34]. For our study, adult isopods (>1 cm) were hand-collected in oak and pine forests in March 2017 and were cultured in two large clear plastic containers with soil from their respective forests. Isopods cultivated in the soil of oak forests were fed with Q. variabilis leaf litter, while those from pine forests were fed with P. massoniana leaf litter. Both containers were then stored in the dark at 25 °C and moistened weekly using deionized water before being introduced into the experimental microcosms.
2.3. Experiment Design
To simulate the leaf litter decomposition process from natural ecosystems, 0.5 g air-dried leaf litters of Q. acutissima and P. massoniana mixed with 40 g of their respective soils were put into 240 mL plastic incubation boxes (a basal area of 75 cm2), and covered with a ventilated lid. Two isopods with the same body size were put in each incubation box based on the average isopod density in Jiangsu Province (approximately 180 individuals/m2) [35]. We checked all incubation boxes daily and replaced the dead isopods with similarly sized ones from the container with the same food source and treatment and then labeled to count the deaths of isopods. This study employed a full-factorial experimental design with two representative forest types (oak and pine) × four treatments expressed as control (CK), low concentration WSII–PM2.5 (PML), medium concentration WSII–PM2.5 (PMM), and high concentration WSII–PM2.5 (PMH) dose. As measured by the deposition quantity of PM2.5 per incubation box per day (DQ), 2 mL of simulated WSII–PM2.5 solution was sprayed evenly into each incubation box every day. The experiment began on 5 April 2019 and ended on 5 October 2019. Samples were harvested monthly. Overall, the experiment comprised 192 microcosms (2 forests × 4 repetitions × 4 treatments × 6 sampling times).
All incubation boxes were incubated at 25 °C and soil moisture was monitored and maintained within 50% to 60% of the gravimetric moisture. From May to October 2017, 32 incubation boxes (2 forests × 4 treatments × 4 repetitions) were harvested for monthly analysis. The leaf litters and soils were harvested and put into sealed bags. The leaf litters were carefully cleaned and dried at 60 °C for 48 h to determine the mass loss.
2.4. Preparation of Simulated WSII-PM2.5 Solutions
Water-soluble inorganic ions in PM2.5 (WSII–PM2.5) mainly include Na+, NH4+, K+, Mg2+, Ca2+, Cl−, NO3−, and SO42− [11,12,13,14]. This study simulated WSII–PM2.5 concentrations during non-hazy, mild, moderate and severe haze days according to the scale used in Zhang et al. [14]. The WSII–PM2.5 concentration on non-hazy days was used as the control (CK), and the WSII–PM2.5 concentrations on the mild (low), moderate (medium), and severe (high) haze days were used as the PML, PMM, and PMH, respectively (Table S1).
According to the PM2.5 concentrations in the air (Table S1) and deposition velocities (Vd) in the study area (Table S2), the deposition quantity of PM2.5 per incubation box per day () was calculated. The corresponding to CK, PML, PMM, and PMH were 0.21, 0.39, 0.62, and 0.98 mg, respectively. According to the and the volume of quantitative nebulizer (2 mL), we calculated the simulated WSII–PM2.5 solutions applied for the control and all PM2.5 treatments. The PM2.5 concentrations for CK, PML, PMM, and PMH were 105, 195, 310, and 490 mg·L−1. The WSII–PM2.5 solutions are shown in Table 1. The measured pH of the control and all WSII–PM2.5 solutions were 6.55, 4.44, 3.59, and 3.32, respectively. The detailed calculation methods and procedures are shown in the Supplementary Materials.
2.5. Soil Physiochemical Properties and Litter Decomposition Parameter
The leaf litter and soil samples were oven-dried at 60 °C for 48 h to determine initial chemical properties before the experiments. The total C and N concentrations were determined with an elemental analyzer (Elemental Vario MICRO, Germany). The lignin concentration of the leaf litter samples was measured by a gravimeter using hot sulfuric acid digestion [36]. Soil pH values were measured using a glass electrode at a ratio of 1:2.5 (soil: water) after shaking equilibration for approximately 30 min [21].
Soil microbial biomass and enzymatic activities were measured to monitor the functional responses of microorganisms to WSII–PM2.5. All soil samples harvested each time were stored in the refrigerator at 4 °C before the soil enzyme activity and microbial biomass were measured. Soil microbial biomass was measured using the substrate-induced respiration (SIR) method [36]. Subsamples of fresh soil (1 g) were placed in a 100-mL glass vial. Next, 1 mL of an aqueous glucose solution (10 mg glucose g−1 soil) was added to each vial. Then samples were sealed and incubated at 25 °C for 1 h. CO2 produced by soil microbes was determined using an infrared gas analyzer [37]. Initial chemical properties of oak and pine leaf litters and soil characteristics of the two forests are shown in Table 2. Enzyme activities involved in the cycling of C (cellobiohydrolase, β-1,4-glucosidase), N (nitrate reductase, urease), P (acid phosphatase, alkaline phosphatase), and polyphenol metabolism (peroxidase, phenol oxidase) were determined with a spectrophotometer. The detailed assay methods are described in the Supplementary Materials.
2.6. Statistical Analyses
The decomposition coefficient (k, month−1) was calculated by fitting a negative exponential model following Olson (1963) [38], using a nonlinear regression function as Equation (1):
where is the original dry mass of leaf litter, is the mass at time t (month), and k is the leaf litter decomposition rate constant (month−1). Mean R2 of the regressions was 0.92 ± 0.047 (mean ± SD).
The relative differences of leaf litter decomposition rates between contrasting treatments (hereafter, Δtreatment) were evaluated for each leaf litter, so as to directly test the influences of WSII–PM2.5 with different concentrations on leaf litter decomposition in each forest. A bootstrapping technique (sample size corresponded with the real data structure, 1000 permutations) was used to calculate the relative differences of k in two contrasting treatments, which was referred as the effect size of Δtreatment (EST) in Equation (2):
where kiA represents the mean decomposition rate k of species i in the treatment A, a positive ESTiAB indicates that leaf litter decomposed more rapidly in treatment B compared to A, and a negative ESTiAB indicates that leaf litter decomposed more slowly in treatment B compared to A. Moreover, the larger the absolute values of ESTiAB, the greater the effect size of Δ treatment (EST).
All statistical tests were performed using SPSS (version 19.0, SPSS Inc., Chicago, IL, USA). Data were checked for deviations from normality and homogeneity of variance before analysis. Analysis of variance (ANOVA) and Tukey’s HSD (honest significant difference) test were applied to assess differences among treatments [39,40]. We used two-way ANOVAs to analyze the effects of leaf litter species and treatment on leaf litter decomposition rates. Repeated-measures ANOVA was used to determine the effects of sampling time (repeated factor), treatment, and leaf litter species on soil pH, microbial biomass (SIR), and enzyme activities. The effects of leaf litter species and treatment on mass loss over time were also analyzed by repeated-measures ANOVA. To evaluate and visualize the relationship among enzymatic activities, treatment, and the decomposition coefficient, principal component analysis (PCA) was carried out using CANOCO 5.0 for Windows (Microcomputer Power, Ithaca, NY, USA).
3. Results
3.1. Soil pH, Carbon and Nitrogen Contents
After six-months of decomposition, the average soil pH values were higher in the pine forest than in the oak forest under all WSII–PM2.5 treatments (Tukey′s test, p < 0.001, Table 3). Compared with the control, the decreases in soil pH values with WSII–PM2.5 treatments were greater in oak forest (PML—2.28%, PMM—3.65%, PMH—4.34%) than in pine forest (PML—0.65%, PMM—1.73%, PMH—2.16%). Soil total C and N contents were higher in microcosms exposed to the WSII–PM2.5, but C/N ratios were nearly the same among all WSII–PM2.5 treatments in the two forests (Table 3).
3.2. Leaf Litter Accumulative Mass Loss and Decomposition Rates
Our results showed that leaf litter mass loss varied with sampling time, leaf litter species, WSII–PM2.5 treatment, and their interactions during six-month decomposition (p < 0.05, Table S3). Under the control (CK) and treatments (PML, PMM, and PMH), the respective accumulative mass losses of the oak leaf litters were 78.00%, 64.00%, 52.44%, 40.00% (p < 0.05, Figure 1a), while the same of the pine leaf litters were 62.75%, 54.12%, 45.54%, 36.12% (p < 0.05, Figure 1b). The leaf litter decomposition rates (k values) in oak forest were significantly higher than those in pine forest in most cases (p < 0.05, Figure 2a). In addition, the k values decreased with the increasing WSII–PM2.5 concentrations (p < 0.05, Figure 2a).
Although WSII–PM2.5 treatments significantly inhibited the decomposition of both forest leaf litters after the six-month incubation (p < 0.001, Figure 1 and Figure 2a), the inhibitory effects were significantly different between the two forests (p < 0.05, Figure 2b).
The effect size of WSII–PM2.5 (EST) is smaller in pine forests than in oak forests (i.e., ΔCL_OF vs. ΔCL_PF; ΔCM_OF vs. ΔCM_PF; ΔCH_OF vs. ΔCH_PF, Figure 2b), implying higher negative impacts of WSII–PM2.5 on decomposition rates of oak leaf litter than that of pine leaf litter (p < 0.05, Figure 2b). Statistical analysis of the factorial ANOVA showed that leaf litter species, WSII–PM2.5 treatments, and their interactions had significant effects on the leaf litter decomposition rates (p < 0.001, Table S4).
We also found that during the first month, mass loss of the oak and pine leaf litters under the PML treatment were 21.63% and 35.64% higher than in the control, respectively (Tukey test, p < 0.05, Figure 1). However, the second month is a turning point, and the mass loss of the two leaf litters under low concentration WSII-PM2.5 became lower than that of control from the third month on (Tukey’s test, p < 0.05).
3.3. Leaf Litter Carbon and Nitrogen Loss
Higher C content remaining in the oak leaf litters was observed under all the WSII–PM2.5 treatments compared with the control (Tukey′s test, p < 0.05), and higher leaf litter N contents were observed in PMM and PMH (Tukey′s test, p < 0.05, Table 3) after six-month decomposition. C/N ratios were not significantly different among all WSII–PM2.5 treatments in the two leaf litters (Tukey′s test, p > 0.05, Table 3). After a six-month decomposition, the leaf litter C and N loss in oak forest were significantly higher than those in pine forest in most cases (p < 0.05, Figure 3a,b). Leaf litter C and N loss were inhibited in oak and pine forests, with increasing WSII–PM2.5 concentrations leading to higher inhibition (p < 0.05, Figure 3a,b). Changes in leaf litter C/N ratios were similar between the control and all treatments (p > 0.05, Figure 3c).
3.4. Soil Microbial Biomass and Survival of Isopods
Overall, compared with the control, all WSII–PM2.5 treatments significantly inhibited the SIR of the oak (PML—27.83%, PMM—58.13%, PMH—76.11%) and pine (PML—21.56%, PMM—38.40%, PMH—55.24%) forests after six-month decomposition (p ≤ 0.001, Table 3). However, microbial biomass in the oak and pine forests were increased by 9.31% and 8.47%, respectively, in the first month under PML treatments (Figure 4), with the inhibitory effects emerging from months 2 (oak forest, Figure 4a) and 3 (pine forest, Figure 4b). In addition, the decreases in SIR of oak forest were greater than those of pine forest under the PMM and PMH treatments (Tukey’s test, p < 0.001). Repeated-measures ANOVA also showed that habitat, treatment, sampling time, and their interactions had significant effects on the SIR (p < 0.001, Table 4). Pearson′s correlation analysis showed negative relations between SIR and decomposition rates of oak (r2 = 0.27, p = 0.009) and pine (r2 = 0.24, p = 0.014) leaf litters in the control, and positive correlations between SIR and decomposition rates of the two leaf litters in the WSII–PM2.5 treatments (p ≤ 0.001, Table S5) except the PMM in oak forest (r2 = 0.02, p = 0.512).
To examine the possible adverse effects of WSII–PM2.5 on isopods, we regularly scored the number of dead isopods during the six-month incubation. No significant differences in mortality of the isopods were observed among the various WSII–PM2.5 treatments (Tukey’s test, p > 0.05), and total number of dead isopods were similar between the two forests (t-test, p > 0.05, Figure S1).
3.5. Soil Extracellular Enzymes
In PCA, the first two axes explained 59.15% and 19.99% of the variation in the oak forest (Figure 5a), while 64.97% and 18.45% of the variation in the pine forest (Figure 5b). We found that all the enzymatic activities and k values were highly correlated with PC1 (except the PER and PHO in pine forest). The control led to higher enzymatic activities than WSII–PM2.5 treatments, and enzymatic activities in the PMH were the lowest (Table 5, Figure 5).
Compared with the control, soil extracellular enzyme activity involved in C (BG and CBH1), N (NR and URE), and P (ACP, ALP) cycles decreased more in oak forest soil than in pine forest soil. On the other hand, phenol oxidase activity decreased more in the pine forest soil than in the oak forest soil under all WSII–PM2.5 treatments (Tukey′s test, p < 0.05, Table 5). Overall, soil enzyme activity varied with collection time, habitat, and WSII–PM2.5 treatment during the incubation period (Table 4). Most of the enzyme activity decreased with increasing WSII–PM2.5 concentration, except for the ACP, which only significantly decreased in the PMH treatments (Table 5).
In addition, the alkaline phosphatase/acid phosphatase (ALP/ACP) ratios in oak forest were lower than those in pine forest under the control, PMM, and PMH treatments during the incubation period (p < 0.05, Figure S2). Results of two-way ANOVA showed that habitat and treatment had significant effects on the ALP/ACP ratios (Tukey′s test, p ≤ 0.001), but their interactions had no effects on the ALP/ACP ratios (Tukey′s test, p = 0.164, Figure S2).
4. Discussion
Our study found strong and complex effects of WSII–PM2.5 on leaf litter decomposition, significantly adding to our understanding of how particulate matter can affect terrestrial forest ecosystems. Consistent with our first hypothesis, WSII–PM2.5 treatments showed obvious adverse impacts in the decomposition of forest litter. For example, the accumulative mass loss and decomposition rates (k values) of the two leaf litters were negatively affected by the WSII–PM2.5 treatments, with higher WSII–PM2.5 concentrations showing stronger negative effects (Figure 1 and Figure 2). Microbial biomass (Table 3, Figure 4) and most soil extracellular enzyme activity involved in C, N, and P cycles (Table 5, Figure 5) in both forests were also inhibited by all WSII–PM2.5 treatments. In addition, WSII–PM2.5 treatments significantly decelerated the C and N mineralization rates of the two leaf litters during six-month decomposition (Table 3, Figure 3), which was consistent with our second hypothesis. We propose the following influencing mechanisms of WSII–PM2.5 on leaf litter decomposition.
First, WSII-PM2.5 may reduce microbial activities by acidifying the soil. Our results showed that for oak forests, pH values for soil treated with WSII–PM2.5 decreased significantly compared to those of control soils (p < 0.05, Table 3). Such acidity, an important characteristic of WSII–PM2.5, can alter soil properties by decreasing soil pH or altering the quality of organic carbon sources, thereby affecting the soil nutrient pool and associated micro-environmental factors [41,42,43,44]. These changes can lead to decreases in the microbial biomass and extracellular enzyme activities, inhibiting leaf litter decomposition [15,16]. Acid characteristics of WSII–PM2.5 can also solidify soil structure and thus retard oxygen and water circulation in soils [45] by reducing the amount of soil macro-aggregates, leading to a decline in microbial activities [43]. In our study, most soil extracellular enzyme activities were inhibited by the WSII–PM2.5 in the two forests, except acid phosphatase activity (Table 5). This may be due to the low pH mediated by WSII–PM2.5, which was close to the optimal pH value of acid phosphatase [15].
Second, WSII–PM2.5 can accumulate over time and may cause soil salinization. Soil salinization has a known negative effect on microbial biomass and enzyme activity [18]. In addition, soil salinization can subject soil enzymes to a “salting-out” effect. This will subsequently modify the ionic conformation of the active site of the enzyme, thereby reducing the activity of soil enzymes [17]. Furthermore, these WSII–PM2.5 may also inhibit microbial activity through cytotoxicity [46,47,48]. For example, among the multiple chemical components in WSII-PM2.5, one of the primary components is SO42-, which contains the sulfur necessary for specific amino-acids (e.g., methionine and cysteine) that participate in the biosynthesis of proteins in organisms [49]. A small quantity of sulfur increases cellular metabolism of microbes, but excess SO42- induces the production of reactive oxygen species in biological cells, causing an oxidative stress response, and eventually leading to DNA damage, inhibiting cell proliferation, and damaging cell activity [50,51]. The same effects have been found for Ca2+ and Mg2+ [3].
We also uncovered a notable phenomenon in which low concentration WSII–PM2.5 accelerated litter mass loss and soil respiration in the first month in both forests (Figure 1 and Figure 4). The mechanisms behind this phenomenon are rather complex. There are at least two possible explanations. First, the acidification and salinization effects resulting from the low WSII–PM2.5 may be tolerable for soil organisms in the short-term. Appropriate nutrient supply (such as N, S, K, Ca, Mg, and Na) in low WSII–PM2.5 concentrations can even cause some hyperactivity of soil organisms [7]. For example, studies have shown that appropriate N addition can increase microbial biomass and enzyme activity, enhancing decomposition by increasing soil N availability [24,52]. Second, leaching accounts for a large proportion in the early stage of leaf litter decomposition. We suggest that moderate WSII–PM2.5 concentration may aggravate leaching, promoting leaf litter mass loss. Meanwhile, leaching releases a great proportion of nutrients into the surrounding environment, increasing decomposer colonization and promoting their growth [53]. Moreover, short-term leaching can also change the chemical composition of leaf litters, affecting the subsequent biodegradation [53,54].
Furthermore, WSII–PM2.5 treatments may affect the leaf litter decomposition by inhibiting soil fauna activity. An animal′s behavioral activity [7], including feeding and grazing, and physiological function, including defecation [6], respiratory and neural systems [55], may be affected by WSII–PM2.5-induced acidification and salinization. These individual changes may have important ecosystem consequences by in turn affecting microbial activities [35,56,57] and leaf litter decomposition. Notably, even high concentrations of WSII–PM2.5 did not induce significant lethality of isopods (Tukey’s test, p > 0.05, Figure S1). The WSII–PM2.5 may merely affect isopods via sub-lethal behavioral depression [7]. Namely, the whole microcosms still maintained an equilibrium of leaf litter–microbe–soil fauna. The potential behavioral changes are part of the conclusions of this study (i.e., that WSII–PM2.5 affects leaf litter decomposition in complex ways).
Compared with the pine leaf litter (higher C/N ratio), oak leaf litter (lower C/N ratio, Table 2) is an easily degradable litter (e.g., rich in soluble and holocellulose contents). In contrast, pine leaf litter is a recalcitrant litter that is more resistant to decay (e.g., rich in lignin and secondary metabolites) [29]. Thus, decomposition of oak leaf litter was faster than that of pine leaf litter (Figure 2a and Figure 3a,b). Considering that the initial soil acidity of the oak forest was higher than that of the pine forest in this study (Table 2), we expected that resistance to WSII–PM2.5-induced acidification of microbial communities in the pine forest would be lower than that in the oak forest, in accordance with previous studies [15,16]. However, contrary to the third hypothesis, this study showed higher inhibitory effects of WSII–PM2.5 on the leaf litter decomposition in the oak forest (Figure 2b). This may be because the acidic buffering capacity of oak forest soil was lower than that of pine forest soil. The results of this study also showed that the decreases in soil pH values with WSII–PM2.5 treatments were greater in oak forest than in pine forest (Table 3). Some investigators suggest that the ALP/ACP ratio is an indicator of susceptibility to soil pH [21] and microbial community status [24,38]. Results in this study showed that the ALP/ACP ratio of the oak forest was lower than that of the pine forest in most cases (p < 0.05, Figure S2), suggesting that the susceptibility of microbial communities in the oak forest soil was higher than that in the pine forest [44,58]. This, in turn, confirms the result that soil pH and microbial biomass of oak forest decreased more significantly than those of pine forest under the WSII–PM2.5 treatments (Table 3, Figure 4). Overall, this could be explained by the different initial status of the soil pH values, metabolic activities of microbial communities, and/or other soil physicochemical properties between the two forests [15,16].
We attribute the lower C and N losses under the WSII–PM2.5 treatments to the decreasing activity of degradative enzymes (such as BG, CBH1, NR and URE), which play pivotal roles in the degradation of C and N organic matter from the fallen leaf litter [15,16,59]. Soil extracellular enzymes have been shown to be the main driver of litter–decomposer interactions modifying the trajectory of litter C and N mineralization [29]. Given the higher resistance to WSII–PM2.5-induced acidification of microbial communities in the pine forest as demonstrated above, C and N mineralization of oak leaf litter were more inhibited compared to in the pine leaf litter (Figure 3). The higher soil C concentrations in the microcosms exposed to the WSII–PM2.5 treatments (Table 3) suggest that soil organic carbon may accumulate as a consequence of continuous WSII–PM2.5 exposure. Additionally, this will have profound ecosystem consequences by altering the balance of ecosystem carbon flux, nutrient cycling, and humus formation in the future.
5. Conclusions
In summary, the water-soluble chemicals in PM2.5 (WSII–PM2.5) inhibit leaf litter decomposition rates (k values), carbon and nitrogen loss, extracellular enzyme activity and microbial biomass. Higher WSII–PM2.5 concentrations induce stronger negative effects. Our comparative analysis showed that the negative effects of WSII-PM2.5 on oak forest were greater than on pine forest, relating to the higher susceptibility to changes of soil microenvironment in oak forests. The possible mechanisms by which WSII–PM2.5 affects decomposition include soil acidification and salinization, which can suppress microbial activities and affect isopods as sub-lethal behavioral depression. However, in the first month of decomposition, low WSII–PM2.5 concentration had a positive promoting effect on leaf litter decomposition. Long-term PM2.5 exposure may have profound ecosystem consequences by altering the balance of ecosystem carbon flux, nutrient cycling, and humus formation in the future. This study provides novel insights into understanding the ecotoxicity of WSII–PM2.5 on terrestrial forest ecosystems.
Supplementary Materials
The following are available online at https://www.mdpi.com/1999-4907/11/2/238/s1, Figure S1: The deaths of isopods (Armadillidium vulgare) (ind.) (mean ± SD, n = 4) in the oak and pine forests under different WSII-PM2.5 treatments. Different uppercase and lowercase letters indicate significant differences (p < 0.05) in oak and pine forests, respectively. Asterisks indicate statistical significance: * p < 0.05; ** p < 0.01; *** p < 0.001; ns, not significant. Abbreviations: CK—control; PML—low concentration WSII–PM2.5; PMM—medium concentration WSII–PM2.5; PMH—high concentration WSII–PM2.5. Figure S2: Changes of ACP/ALP ratios with different WSII–PM2.5 treatments in the two forests during 6 months of leaf litter decomposition. Error bars indicate standard error. Different lowercase letters indicate significant differences (p < 0.05) in oak and pine forests, respectively. See Figure S1 for abbreviations, Table S1: Mass concentrations of the main water-soluble inorganic ions (WSII) in the PM2.5 (µg /m3). The WSII–PM2.5 concentration on non-hazy days was used as the control (CK), and the WSII–PM2.5 concentrations on the mild (low), moderate (medium), and severe (high) haze days were used as the PML, PMM, and PMH, respectively, Table S2: Deposition velocities and percent resuspension by wind speed, Table S3: Effects (indicated by P values from ANOVA for repeated measurements) of sampling time (repeated factor), WSII–PM2.5 treatment, litter species, and their interactions on leaf litter mass loss. Significant differences are indicated by bold-face p-values, Table S4: Statistics of the factorial ANOVA used to analyze the effects of litter species (Quercus variabilis and Pinus massoniana) and treatments (control, low concentration WSII–PM2.5, medium concentration WSII–PM2.5, high concentration WSII–PM2.5) on leaf litter decomposition rates (k, month−1). Significant p values are highlighted in bold, Table S5: Correlations between microbial respiration (SIR) and leaf litter decomposition rates under the control and all WSII–PM2.5 treatments. Significant differences are indicated by bold-face p-values. See Figure S1 for abbreviations; detailed methods for soil enzyme activity analyses were described in the supplementary materials as well.
Author Contributions
Conceptualization, Y.J. and X.T.; Data curation, Y.J. and Q.L.; Investigation, Y.J., Q.L. and R.Y.; Formal analysis, Y.J. and K.T.; Writing–original draft, Y.J.; Writing–review & editing, Y.J. and X.T.; Funding acquisition, X.T. All authors have read and agreed to the published version of the manuscript.
Funding
This study was financially supported by the National Key Research and Development Program of China (No. 2016YFD0600204); the National Natural Science Foundation of China (No. 31870598); the National Natural Science Foundation of China (No. 31870598); the specimen platform of China and the teaching specimens sub-platform (2005DKA21403-JK).
Acknowledgments
We would like to thank Stephen Gaughran at Yale University for his assistance with English language and grammatical editing.
Conflicts of Interest
The authors declare no conflict of interest.
References
- Kampa, M.; Castanas, E. Human health effects of air pollution. Environ. Pollut. 2008, 151, 362–367. [Google Scholar] [CrossRef]
- Ma, Y.; Tigabu, M.; Guo, X.; Zheng, W.; Guo, L.; Guo, F. Water-Soluble Inorganic Ions in Fine Particulate Emission During Forest Fires in Chinese Boreal and Subtropical Forests: An Indoor Experiment. Forests 2019, 10, 994. [Google Scholar] [CrossRef] [Green Version]
- Shang, Y.; Zhu, T.; Lenz, A.G.; Frankenberger, B.; Tian, F.; Chen, C.Y.; Stoeger, T. Reduced in vitro toxicity of fine particulate matter collected during the 2008 summer Olympic Games in Beijing: The roles of chemical and biological components. Toxicol. In Vitro 2013, 27, 2084–2093. [Google Scholar] [CrossRef]
- Wei, Y.J.; Han, I.K.; Shao, M.; Hu, M.; Zhang, J.F.; Tang, X.Y. PM2.5 Constituents and Oxidative DNA Damage in Humans. Environ. Sci. Technol. 2009, 43, 4757–4762. [Google Scholar] [CrossRef]
- Raaschou-Nielsen, O.; Andersen, Z.J.; Beelen, R.; Samoli, E.; Stafoggia, M.; Weinmayr, G.; Hoffmann, B.; Fischer, P.; Nieuwenhuijsen, M.J.; Brunekreef, B.; et al. Air pollution and lung cancer incidence in 17 European cohorts: Prospective analyses from the European Study of Cohorts for Air Pollution Effects (ESCAPE). Lancet Oncol. 2013, 14, 813–822. [Google Scholar] [CrossRef]
- Zhao, Y.L.; Lin, Z.Q.; Jia, R.H.; Li, G.J.; Xi, Z.G.; Wang, D.Y. Transgenerational effects of traffic-related fine particulate matter (PM2.5) on nematode Caenorhabditis elegans. J. Hazard. Mater. 2014, 274, 106–114. [Google Scholar] [CrossRef]
- Hartono, D.; Lioe, B.; Zhang, Y.X.; Li, B.L.; Yu, J.Z. Impacts of particulate matter (PM2.5) on the behavior of freshwater snail Parafossarulus striatulus. Sci. Rep. 2017, 7, 644. [Google Scholar] [CrossRef] [PubMed] [Green Version]
- Wu, W.T.; Zhang, Y.X. Effects of particulate matter (PM2.5) and associated acidity on ecosystem functioning: Response of leaf litter breakdown. Environ. Sci. Pollut. Res. 2018, 25, 30720–30727. [Google Scholar] [CrossRef] [PubMed]
- Callen, M.S.; Iturmendi, A.; Lopez, J.M. Source apportionment of atmospheric PM2.5-bound polycyclic aromatic hydrocarbons by a PMF receptor model. Assessment of potential risk for human health. Environ. Pollut. 2014, 195, 167–177. [Google Scholar] [CrossRef] [PubMed]
- Cheng, N.L.; Meng, F.; Wang, J.K.; Chen, Y.B.; Xiao, W.; Han, H.F. Numerical simulation of the spatial distribution and deposition of PM_(2.5) in East China coastal area in 2010. J. Saf. Environ. 2015, 15, 305–310. [Google Scholar]
- Gao, J.J.; Tian, H.Z.; Cheng, K.; Lu, L.; Zheng, M.; Wang, S.X.; Hao, J.M.; Wang, K.; Hua, S.B.; Zhu, C.Y.; et al. The variation of chemical characteristics of PM2.5 and PM10 and formation causes during two haze pollution events in urban Beijing, China. Atmos. Environ. 2015, 107, 1–8. [Google Scholar] [CrossRef]
- Han, T.T.; Liu, X.G.; Zhang, Y.H.; Qu, Y.; Zeng, L.M.; Hu, M.; Zhu, T. Role of secondary aerosols in haze formation in summer in the Megacity Beijing. J. Environ. Sci.-China 2015, 31, 51–60. [Google Scholar] [CrossRef] [PubMed]
- Sun, Y.L.; Zhuang, G.S.; Tang, A.H.; Wang, Y.; An, Z.S. Chemical characteristics of PM2.5 and PM10 in haze-fog episodes in Beijing. Environ. Sci. Technol. 2006, 40, 3148–3155. [Google Scholar] [CrossRef] [PubMed]
- Zhang, Y.; Huang, W.; Cai, T.Q.; Fang, D.Q.; Wang, Y.Q.; Song, J.; Hu, M.; Zhang, Y.X. Concentrations and chemical compositions of fine particles (PM2.5) during haze and non-haze days in Beijing. Atmos. Res. 2016, 174, 62–69. [Google Scholar] [CrossRef]
- Lv, Y.; Wang, C.Y.; Jia, Y.Y.; Wang, W.W.; Ma, X.; Du, J.J.; Pu, G.Z.; Tian, X.J. Effects of sulfuric, nitric, and mixed acid rain on litter decomposition, soil microbial biomass, and enzyme activities in subtropical forests of China. Appl. Soil Ecol. 2014, 79, 1–9. [Google Scholar] [CrossRef]
- Wang, C.Y.; Guo, P.; Han, G.M.; Feng, X.G.; Zhang, P.; Tian, X.J. Effect of simulated acid rain on the litter decomposition of Quercus acutissima and Pinus massoniana in forest soil microcosms and the relationship with soil enzyme activities. Sci. Total Environ. 2010, 408, 2706–2713. [Google Scholar] [CrossRef]
- Frankenberger, W.T.; Bingham, F.T. Influence of Salinity on Soil Enzyme-Activities. Soil Sci. Soc. Am. J. 1982, 46, 1173–1177. [Google Scholar] [CrossRef]
- Rath, K.M.; Rousk, J. Salt effects on the soil microbial decomposer community and their role in organic carbon cycling: A review. Soil Biol. Biochem. 2015, 81, 108–123. [Google Scholar] [CrossRef]
- Brussaard, L.; Behan-Pelletier, V.M.; Bignell, D.E.; Brown, V.K.; Didden, W.; Folgarait, P.; Fragoso, C.; Freckman, D.W.; Gupta, V.V.S.R.; Hattori, T.; et al. Biodiversity and ecosystem functioning in soil. Ambio 1997, 26, 563–570. [Google Scholar]
- Hinojosa, M.B.; García-Ruíz, R.; Viñegla, B.; Carreira, J.A. Microbiological rates and enzyme activities as indicators of functionality in soils affected by the Aznalcóllar toxic spill. Soil Biol. Biochem. 2004, 36, 1637–1644. [Google Scholar] [CrossRef]
- Dick, W.A.; Cheng, L.; Wang, P. Soil acid and alkaline phosphatase activity as pH adjustment indicators. Soil Biol. Biochem. 2000, 32, 1915–1919. [Google Scholar] [CrossRef]
- Yang, Y.G.; Jin, Z.S.; Bi, X.Y.; Li, F.L.; Sun, L.; Liu, J.; Fu, Z.Y. Atmospheric Deposition-Carried Pb, Zn, and Cd from a Zinc Smelter and Their Effect on Soil Microorganisms. Pedosphere 2009, 19, 422–433. [Google Scholar] [CrossRef]
- Haines, T.A. Acidic Precipitation and Its Consequences for Aquatic Ecosystems—A Review. Trans. Am. Fish. Soc. 1981, 110, 669–707. [Google Scholar] [CrossRef]
- Guo, P.; Wang, C.Y.; Jia, Y.; Wang, Q.A.; Han, G.M.; Tian, X.J. Responses of soil microbial biomass and enzymatic activities to fertilizations of mixed inorganic and organic nitrogen at a subtropical forest in East China. Plant Soil 2011, 338, 355–366. [Google Scholar] [CrossRef]
- Caldwell, B.A. Enzyme activities as a component of soil biodiversity: A review. Pedobiologia 2005, 49, 637–644. [Google Scholar] [CrossRef]
- Meehan, T.D.; Couture, J.J.; Bennett, A.E.; Lindroth, R.L. Herbivore-mediated material fluxes in a northern deciduous forest under elevated carbon dioxide and ozone concentrations. New Phytol. 2014, 204, 397–407. [Google Scholar] [CrossRef] [Green Version]
- A’Bear, A.D.; Jones, T.H.; Boddy, L. Size matters: What have we learnt from microcosm studies of decomposer fungus-invertebrate interactions? Soil Biol. Biochem. 2014, 78, 274–283. [Google Scholar] [CrossRef]
- Martin, M.H.; Duncan, E.M.; Coughtrey, P.J. The distribution of heavy-metals in a contaminated woodland ecosystem. Environ. Pollut. B 1982, 3, 147–157. [Google Scholar] [CrossRef]
- Fanin, N.; Fromin, N.; Bertrand, I. Functional breadth and home-field advantage generate functional differences among soil microbial decomposers. Ecology 2016, 97, 1023–1037. [Google Scholar] [CrossRef]
- Decker, M.B.; Breitburg, D.L.; Marcus, N.H. Geographical differences in behavioral responses to hypoxia: Local adaptation to an anthropogenic stressor? Ecol. Appl. 2003, 13, 1104–1109. [Google Scholar] [CrossRef]
- Zeng, S.; Xie, Z.; Yu, Y.; Liu, Y. Available microelements in soils under different stands in northern subtropics of China. Acta Ecol. Sin. 2002, 22, 2141–2146. [Google Scholar]
- Chen, G. The faunastic characteristics of terrestrial Isopoda of typical zones in China (In Chinese). J. Jishou Univ. 2005, 26, 26–28. [Google Scholar]
- Zimmer, M. Is decomposition of woodland leaf litter influenced by its species richness? Soil Biol. Biochem. 2002, 34, 277–284. [Google Scholar] [CrossRef]
- Paoletti, M.G.; Hassall, M. Woodlice (Isopoda: Oniscidea): Their potential for assessing sustainability and use as bioindicators. Agric. Ecosyst. Environ. 1999, 74, 157–165. [Google Scholar] [CrossRef]
- Jia, Y.Y.; Lv, Y.N.; Kong, X.S.; Jia, X.Q.; Tian, K.; Du, J.J.; Tian, X.J. Insight into the indirect function of isopods in litter decomposition in mixed subtropical forests in China. Appl. Soil. Ecol. 2015, 86, 174–181. [Google Scholar] [CrossRef]
- Osono, T.; Takeda, H. Comparison of litter decomposing ability among diverse fungi in a cool temperate deciduous forest in Japan. Mycologia 2002, 94, 421–427. [Google Scholar] [CrossRef]
- Bailey, V.L.; Peacock, A.D.; Smith, J.L.; Bolton, H. Relationships between soil microbial biomass determined by chloroform fumigation-extraction, substrate-induced respiration, and phospholipid fatty acid analysis. Soil Biol. Biochem. 2002, 34, 1385–1389. [Google Scholar] [CrossRef]
- Olson, J.S. Energy-storage and balance of producers and decomposers in ecological-systems. Ecology 1963, 44, 322–331. [Google Scholar] [CrossRef] [Green Version]
- St, L.; Wold, S. Analysis of variance (ANOVA). Chemometr. Intell. Lab. 1989, 6, 259–272. [Google Scholar]
- Tukey, J.W. Multiple comparisons. J. Am. Stat. Assoc. 1953, 48, 624–625. [Google Scholar]
- El-Tarabily, K.A.; Nassar, A.H.; Sivasithamparam, K. Promotion of growth of bean (Phaseolus vulgaris L.) in a calcareous soil by a phosphate-solubilizing, rhizosphere-competent isolate of Micromonospora endolithica. Appl. Soil Ecol. 2008, 39, 161–171. [Google Scholar] [CrossRef]
- Hines, J.; Megonigal, J.P.; Denno, R.F. Nutrient subsidies to belowground microbes impact aboveground food web interactions. Ecology 2006, 87, 1542–1555. [Google Scholar] [CrossRef] [Green Version]
- Xu, H.Q.; Zhang, J.E.; Ouyang, Y.; Lin, L.; Quan, G.M.; Zhao, B.L.; Yu, J.Y. Effects of simulated acid rain on microbial characteristics in a lateritic red soil. Environ. Sci. Pollut. Res. 2015, 22, 18260–18266. [Google Scholar] [CrossRef] [PubMed]
- Zhang, J.E.; Yu, J.Y.; Ouyang, Y.; Xu, H.Q. Impact of Simulated Acid Rain on Trace Metals and Aluminum Leaching in Latosol from Guangdong Province, China. Soil Sediment Contam. 2014, 23, 725–735. [Google Scholar] [CrossRef]
- Nielsen, U.N.; Ayres, E.; Wall, D.H.; Li, G.; Bardgett, R.D.; Wu, T.H.; Garey, J.R. Global-scale patterns of assemblage structure of soil nematodes in relation to climate and ecosystem properties. Glob. Ecol. Biogeogr. 2014, 23, 968–978. [Google Scholar] [CrossRef]
- Qi, Z.H.; Song, Y.Y.; Ding, Q.Q.; Liao, X.L.; Li, R.J.; Liu, G.G.; Tsang, S.; Cai, Z.W. Water soluble and insoluble components of PM2.5 and their functional cardiotoxicities on neonatal rat cardiomyocytes in vitro. Ecotox. Environ. Saf. 2019, 168, 378–387. [Google Scholar] [CrossRef]
- Zhang, Y.N.; Li, Y.B.; Shi, Z.X.; Wu, J.; Yang, X.Z.; Feng, L.; Ren, L.H.; Duan, J.C.; Sun, Z.W. Metabolic impact induced by total, water soluble and insoluble components of PM2.5 acute exposure in mice. Chemosphere 2018, 207, 337–346. [Google Scholar] [CrossRef]
- Zou, Y.J.; Jin, C.Y.; Su, Y.; Li, J.R.; Zhu, B.S. Water soluble and insoluble components of urban PM2.5 and their cytotoxic effects on epithelial cells (A549) in vitro. Environ. Pollut. 2016, 212, 627–635. [Google Scholar] [CrossRef]
- Sekowska, A.; Kung, H.F.; Danchin, A. Sulfur metabolism in Escherichia coli and related bacteria: Facts and fiction. J. Mol. Microb. Biotech. 2000, 2, 145–177. [Google Scholar]
- Gualtieri, M.; Longhin, E.; Mattioli, M.; Mantecca, P.; Tinaglia, V.; Mangano, E.; Proverbio, M.C.; Bestetti, G.; Camatini, M.; Battaglia, C. Gene expression profiling of A549 cells exposed to Milan PM2.5. Toxicol. Lett. 2012, 209, 136–145. [Google Scholar] [CrossRef]
- Wang, D.B.; Pakbin, P.; Shafer, M.M.; Antkiewicz, D.; Schauer, J.J.; Sioutas, C. Macrophage reactive oxygen species activity of water-soluble and water-insoluble fractions of ambient coarse, PM2.5 and ultrafine particulate matter (PM) in Los Angeles. Atmos. Environ. 2013, 77, 301–310. [Google Scholar] [CrossRef]
- Wang, Q.; Kwak, J.H.; Choi, W.J.; Chang, S.X. Decomposition of trembling aspen leaf litter under long-term nitrogen and sulfur deposition: Effects of litter chemistry and forest floor microbial properties. For. Ecol. Manag. 2018, 412, 53–61. [Google Scholar] [CrossRef]
- Zukswert, J.M.; Prescott, C.E. Relationships among leaf functional traits, litter traits, and mass loss during early phases of leaf litter decomposition in 12 woody plant species. Oecologia 2017, 185, 305–316. [Google Scholar] [CrossRef] [PubMed]
- Schreeg, L.A.; Mack, M.C.; Turner, B.L. Nutrient-specific solubility patterns of leaf litter across 41 lowland tropical woody species. Ecology 2013, 94, 94–105. [Google Scholar] [CrossRef]
- Zhao, Y.L.; Wu, Q.L.; Tang, M.; Wang, D.Y. The in vivo underlying mechanism for recovery response formation in nano-titanium dioxide exposed Caenorhabditis elegans after transfer to the normal condition. Nanomed. Nanotechnol. Biol. Med. 2014, 10, 89–98. [Google Scholar] [CrossRef]
- Crowther, T.W.; Stanton, D.W.G.; Thomas, S.M.; A’Bear, A.D.; Hiscox, J.; Jones, T.H.; Voriskova, J.; Baldrian, P.; Boddy, L. Top-down control of soil fungal community composition by a globally distributed keystone consumer. Ecology 2013, 94, 2518–2528. [Google Scholar] [CrossRef]
- Janouskova, M.; Kohout, P.; Moradi, J.; Doubkova, P.; Frouz, J.; Vosolsobe, S.; Rydlova, J. Microarthropods influence the composition of rhizospheric fungal communities by stimulating specific taxa. Soil Biol. Biochem. 2018, 122, 120–130. [Google Scholar] [CrossRef]
- Schweiger, A.H.; Beierkuhnlein, C. The ecological legacy of 20th century acidification carried on by ecosystem engineers. Appl. Veg. Sci. 2017, 20, 215–224. [Google Scholar] [CrossRef]
- Rusek, J.; Marshall, V.G. Impacts of airborne pollutants on soil fauna. Annu. Rev. Ecol. Syst. 2000, 31, 395–423. [Google Scholar] [CrossRef]
Figure 1.
The mass loss of (a) oak and (b) pine leaf litters under different treatments during the six-month decomposition. Abbreviations: CK—control; PML—low concentration WSII–PM2.5; PMM—medium concentration WSII–PM2.5; PMH—high concentration WSII–PM2.5.
Figure 1.
The mass loss of (a) oak and (b) pine leaf litters under different treatments during the six-month decomposition. Abbreviations: CK—control; PML—low concentration WSII–PM2.5; PMM—medium concentration WSII–PM2.5; PMH—high concentration WSII–PM2.5.
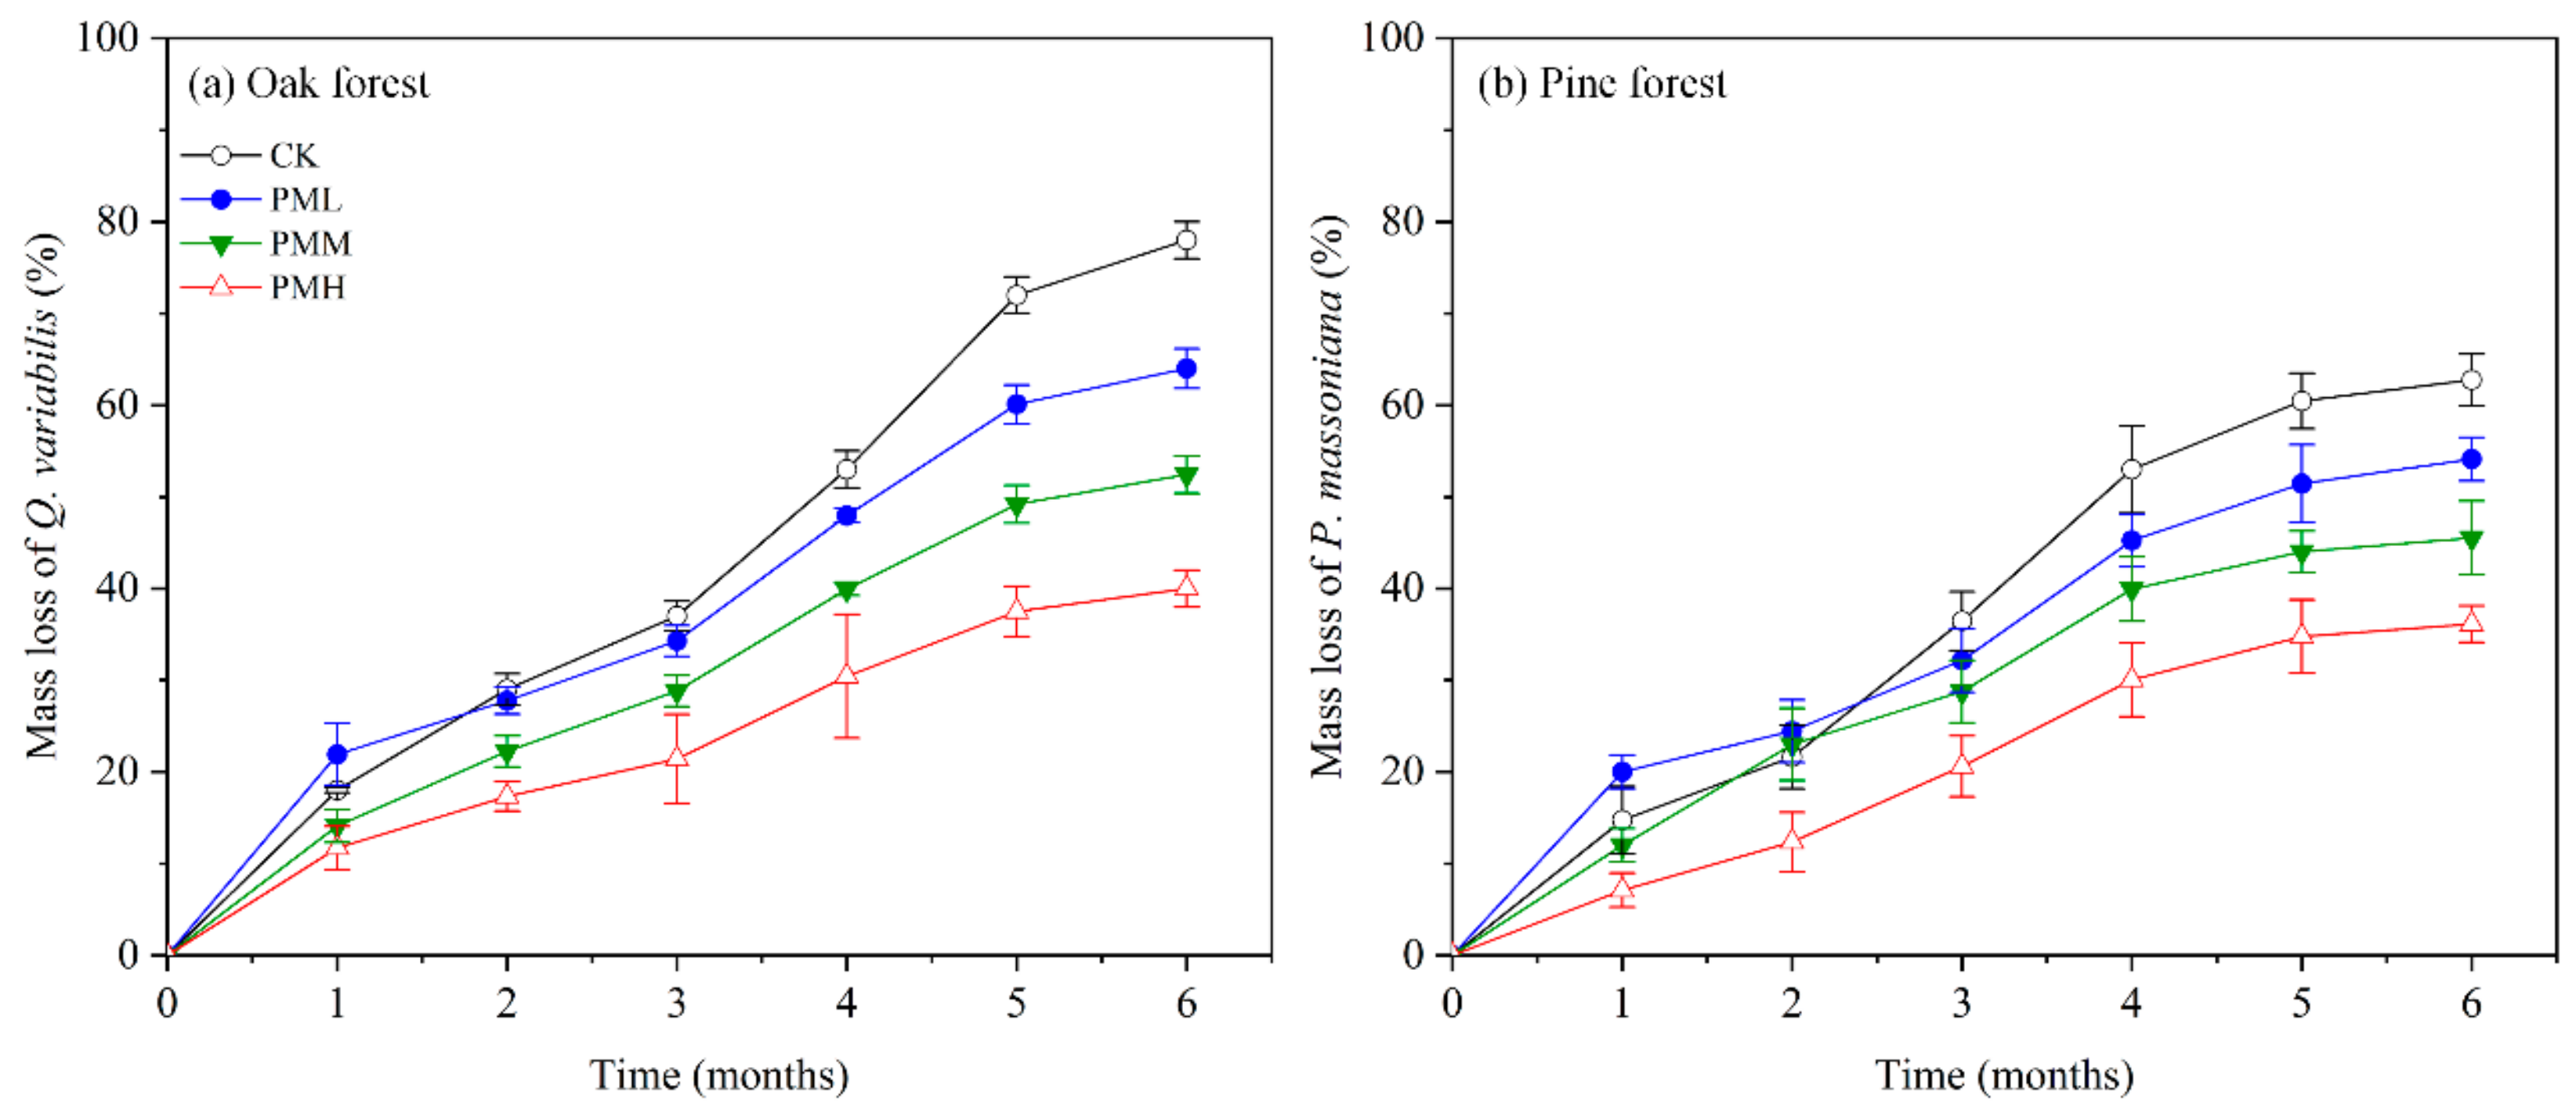
Figure 2.
Effects of WSII–PM2.5 exposure on the decomposition rates of oak and pine leaf litter. (a) Decomposition rates (mean k value, month−1) of the two leaf litters during the six-month decomposition. Different lowercase letters above bars indicate significant differences at p < 0.05. Error bars indicate standard deviation (SD, n = 4). (b) The relative differences of leaf litter decomposition rates (k) between contrasting treatments, which are referred to as the effect size of Δtreatments (EST) on decomposition rate. The ΔCL_OF, ΔCM_OF, and ΔCH_OF are the ESTs of CK relative to PML, PMM, and PMH on the oak forest. Similarly, the ΔCL_PF, ΔCM_PF, and ΔCH_PF are the ESTs of CK relative to PML, PMM, and PMH on the pine forest. The means of EST and the 95% bootstrapping confidence intervals are shown. Positive ESTs indicate that decomposition is promoted by WSII–PM2.5, and negative ESTs indicate that decomposition is inhibited by WSII–PM2.5. The closer the EST is to 0, the smaller the effect of WSII–PM2.5. Intervals non-crossed with the vertical zero dashed line indicate a significant effect.
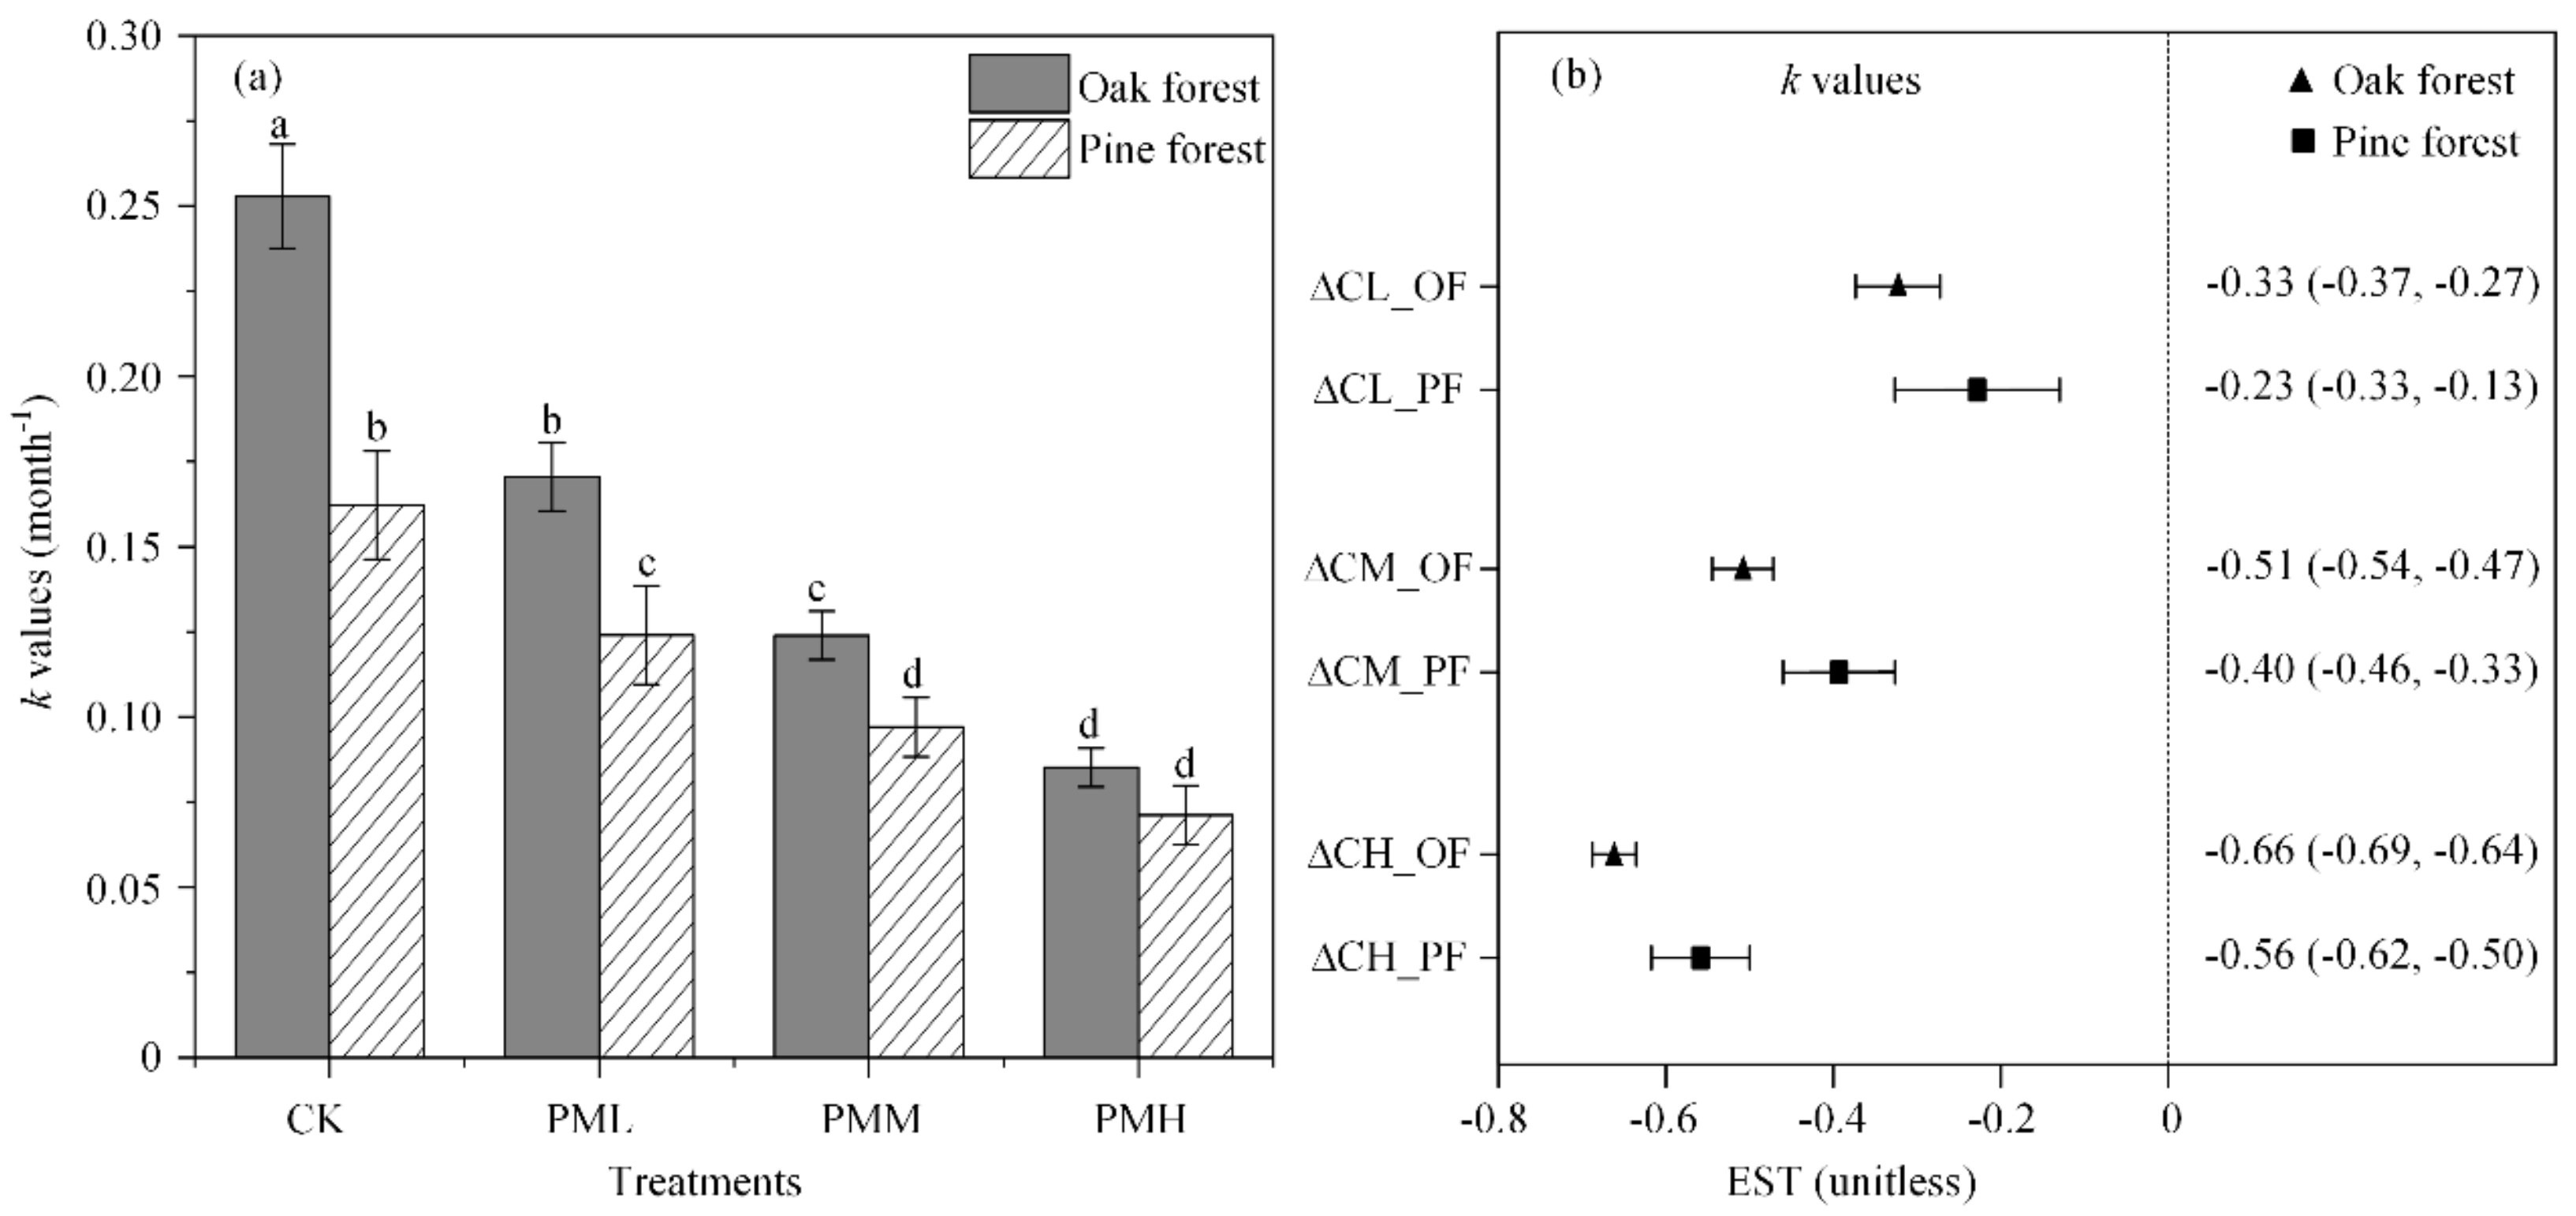
Figure 3.
Leaf litter (a) C loss, (b) N loss, and (c) changes in the C/N ratios (T0–T6) after six-month decomposition (mean ± SD, n = 4). Abbreviations: CK—control; PML—low concentration WSII–PM2.5; PMM—medium concentration WSII–PM2.5; PMH—high concentration WSII–PM2.5. Different uppercase and lowercase letters indicate significant differences (p < 0.05) in oak and pine forests, respectively. Asterisks indicate statistical significance: * p < 0.05; ** p < 0.01; *** p < 0.001; ns, not significant.
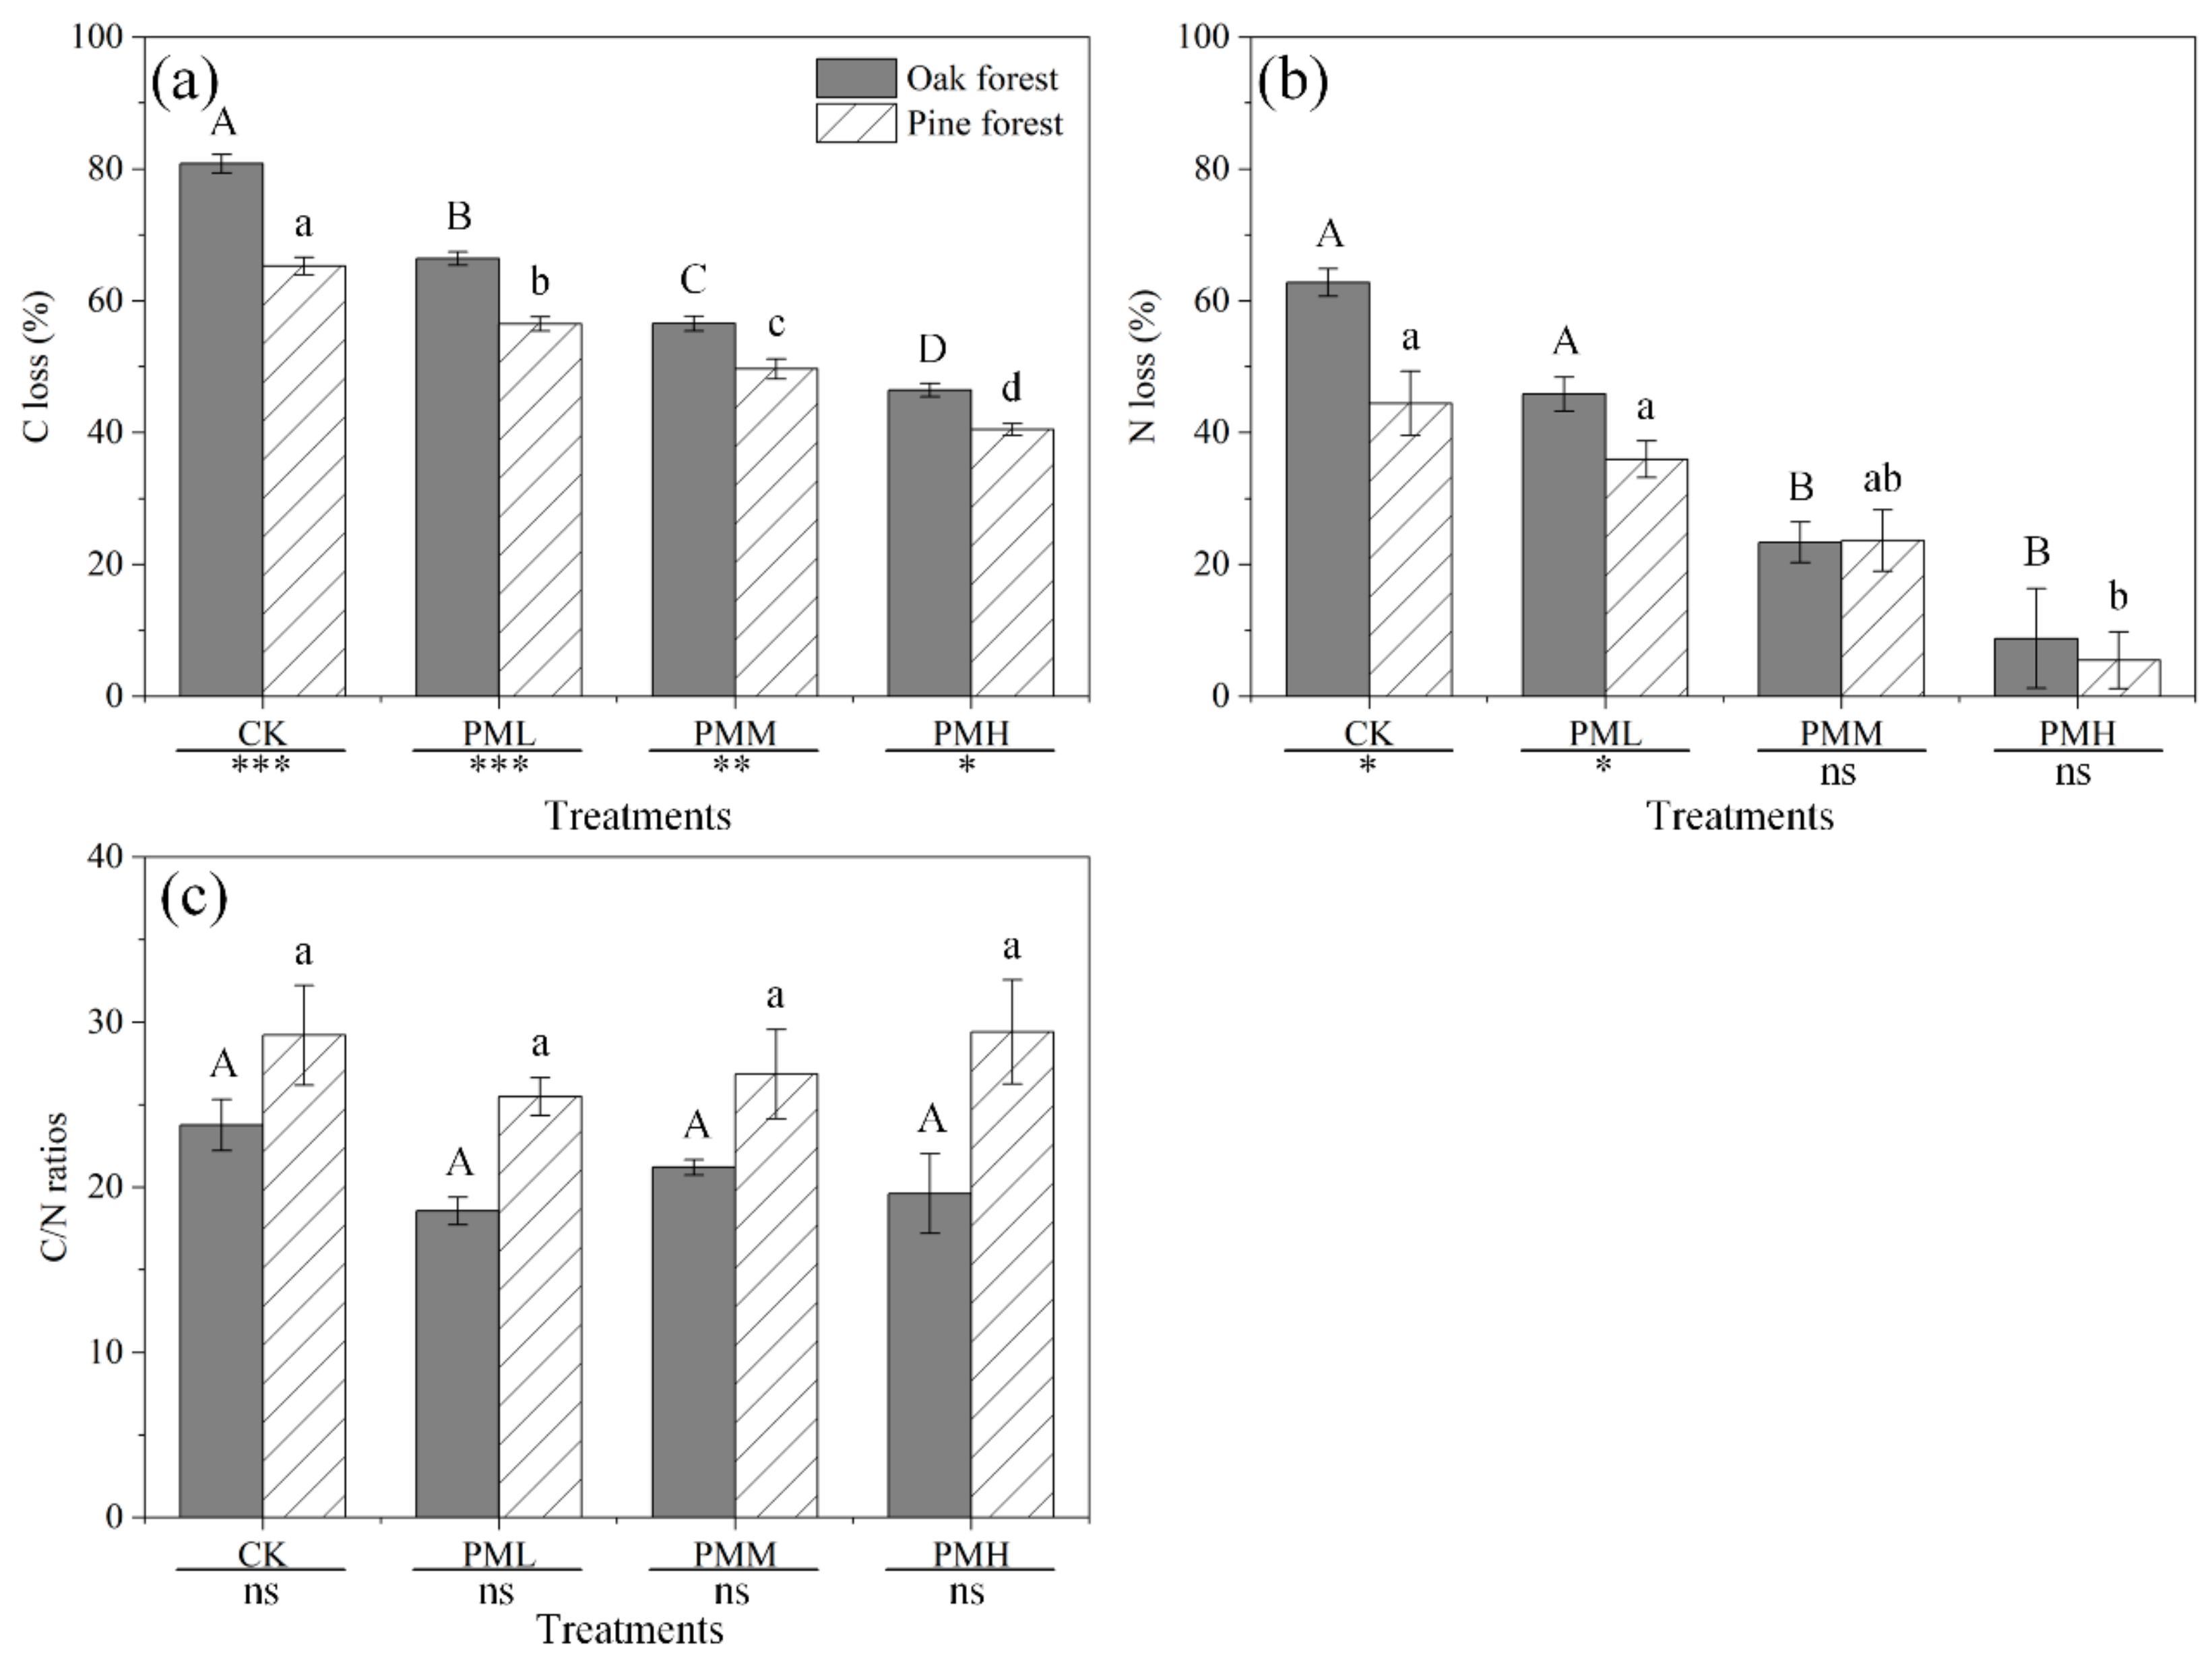
Figure 4.
Effects of WSII–PM2.5 exposure on substrate-induced respiration (SIR) in the (a) oak and (b) pine forests during six-months of leaf litter decomposition. Error bars indicate standard error (n = 4). Bars with different lowercase letters are significantly different at p < 0.05. Abbreviations: CK—control; PML—low concentration WSII–PM2.5; PMM—medium concentration WSII–PM2.5; PMH—high concentration WSII–PM2.5.

Figure 5.
Principal component analysis (PCA) ordination of enzymatic activities (arrows), decomposition coefficient (k), and four treatments in the (a) oak and (b) pine forests. The traits were centered and transformed logarithmically prior to ordination. Variance explained by each principal component (PC) are shown. CBH1: cellobiohydrolase; BG: β-1,4-glucosidase; NR: nitrate reductase; URE: urease; ACP: acid phosphatase; ALP: alkaline phosphatase; PER: peroxidase; PHO: phenol oxidase. Legend: black circles represent CK; purple squares represent PML; green rhombuses represent PMM, and yellow rectangles represent PMH.


Table 1.
Species of chemical substances and their quantities used in every 1 L of simulated WSII–PM2.5 solution.
Table 1.
Species of chemical substances and their quantities used in every 1 L of simulated WSII–PM2.5 solution.
| Species (unit: mg/L) | Treatments | |||
|---|---|---|---|---|
| CK | PML | PMM | PMH | |
| NH4NO3 | 5.12 | 23.82 | 60.83 | 33.44 |
| (NH4)2SO4 | 36.05 | 65.78 | 108.46 | 247.76 |
| KCl | 1.45 | 0.48 | 4.68 | 2.58 |
| KNO3 | 1.58 | 4.61 | 1.74 | 8.70 |
| NaCl | - | - | - | 6.84 |
| Na2SO4 | 2.13 | 2.10 | 2.75 | - |
| Ca (NO3)2 | 10.33 | 3.69 | 6.39 | 64.33 |
| Mg (NO3)2 | 2.81 | 0.42 | 1.11 | 45.63 |
| H2SO4 | - | 16.68 | 37.10 | 57.92 |
Abbreviations: WSII–PM2.5 denotes water-soluble inorganic ions in PM2.5. CK (control); PML (low concentration WSII–PM2.5); PMM (medium concentration WSII–PM2.5); PMH (high concentration WSII–PM2.5). All chemicals used in Table 1 are solid except sulfuric acid (H2SO4), which is liquid. We achieved the mass of sulfuric acid shown in Table 1 by adjusting the volume of 98% concentrated sulfuric acid (ρ: 1.84 g/cm3).
Table 2.
Initial physicochemical properties of the fresh leaf litter (oak and pine) and soil from the oak and pine forests (means ± SD, n = 4).
Table 2.
Initial physicochemical properties of the fresh leaf litter (oak and pine) and soil from the oak and pine forests (means ± SD, n = 4).
| Leaf Litter Traits | Species | |
| Oak | Pine | |
| Total C (%) | 49.12 ± 0.07 b | 50.78 ± 0.10 a |
| Total N (%) | 1.00 ± 0.01 a | 0.64 ± 0.02 b |
| C/N | 49.13 ± 0.53 b | 79.87 ± 2.03 a |
| Lignin (%) | 30.52 ± 0.00 b | 41.20 ± 0.00 a |
| Lignin/N | 30.53 ± 0.35 b | 64.81 ± 1.77 a |
| Soil Characteristics | Species | |
| Oak | Pine | |
| Total C (%) | 3.73 ± 0.17 b | 5.10 ± 0.14 a |
| Total N (%) | 0.28 ± 0.01 b | 0.34 ± 0.00 a |
| C/N | 13.15 ± 0.09 b | 14.84 ± 0.35 a |
| Soil pH | 4.89 ± 0.01 b | 5.27 ± 0.00 a |
| Soil SIR (μL CO2 h−1 g−1 Soil) | 25.25 ± 0.26 b | 35.13 ± 0.83 a |
Data with different superscript lowercase letters in a horizontal row are significantly different (p < 0.05). SIR indicates substrate-induced respiration (SIR rate, μL CO2 h−1 g−1 Soil).
Table 3.
The chemical characteristics (means ± SD, n = 4) of the litters and soils used for the leaf litter decomposition experiment after six months of decomposition.
Table 3.
The chemical characteristics (means ± SD, n = 4) of the litters and soils used for the leaf litter decomposition experiment after six months of decomposition.
| Chemical Characteristics | Oak Forest | Pine Forest | ||||||
|---|---|---|---|---|---|---|---|---|
| CK | PML | PMM | PMH | CK | PML | PMM | PMH | |
| Litter | ||||||||
| Total C (%) | 42.70 ± 0.20 f | 43.85 ± 0.16 e | 44.86 ± 0.27 d | 45.79 ± 0.11 c | 46.96 ± 0.03 b | 47.28 ± 0.18 b | 47.33 ± 0.11 b | 48.12 ± 0.02 a |
| Total N (%) | 1.50 ± 0.01 c | 1.52 ± 0.00 c | 1.61 ± 0.01 b | 1.69 ± 0.01 a | 0.89 ± 0.01 d | 0.89 ± 0.03 d | 0.94 ± 0.01 d | 0.95 ± 0.01 d |
| C/N | 28.42 ± 0.23 b | 28.90 ± 0.06 b | 27.87 ± 0.24 b | 27.06 ± 0.20 b | 52.95 ± 0.78 a | 53.34 ± 2.07 a | 50.38 ± 0.66 a | 50.94 ± 0.64 a |
| Soil | ||||||||
| pH | 4.38 ± 0.01 c | 4.28 ± 0.01 d | 4.22 ± 0.01 e | 4.19 ± 0.00 e | 4.63 ± 0.06 a | 4.60 ± 0.03 a | 4.55 ± 0.05 b | 4.53 ± 0.02 b |
| Total C (%) | 2.83 ± 0.02 f | 3.09 ± 0.02 e | 3.19 ± 0.01 d | 3.42 ± 0.01 c | 3.54 ± 0.01 b | 3.52 ± 0.01 b | 3.66 ± 0.01 a | 3.70 ± 0.05 a |
| Total N (%) | 0.22 ± 0.01 e | 0.24 ± 0.01 d | 0.25 ± 0.00 cd | 0.28 ± 0.01 a | 0.25 ± 0.01 cd | 0.26 ± 0.01 bc | 0.27 ± 0.00 ab | 0.28 ± 0.00 a |
| C/N | 12.88 ± 0.14 bcde | 12.86 ± 0.07 cde | 12.64 ± 0.13 de | 12.45 ± 0.11 e | 14.02 ± 0.29 a | 13.42 ± 0.14 abc | 13.42 ± 0.11 abc | 13.23 ± 0.20 bcd |
| SIR (μL CO2 h-1 g-1 Soil) | 10.15 ± 0.12 b | 7.33 ± 0.41 c | 4.25 ± 0.06 e | 2.43 ± 0.09 f | 12.18 ± 0.4 a | 9.55 ± 0.03 b | 7.50 ± 0.07 c | 5.45 ± 0.3 d |
Data with the different superscript lowercase letters in a transverse row are significantly different (p < 0.05).
Table 4.
Effects (indicated by p-values from repeated-measures ANOVA) of sampling date, habitat (oak forest and pine forest), treatment (control, low concentration WSII–PM2.5, medium concentration WSII–PM2.5, high concentration WSII–PM2.5) and their interactions on SIR, soil pH, and soil extracellular enzyme activity during six months of decomposition.
| Variation | SIR | pH | BG | CBH1 | NR | URE | ACP | ALP | PER | PHO |
|---|---|---|---|---|---|---|---|---|---|---|
| Between subjects | ||||||||||
| Intercept | < 0.001 | < 0.001 | < 0.001 | < 0.001 | < 0.001 | < 0.001 | < 0.001 | < 0.001 | < 0.001 | < 0.001 |
| Habitat | < 0.001 | < 0.001 | 0.247 | 0.003 | 0.458 | < 0.001 | < 0.001 | < 0.001 | 0.054 | 0.067 |
| Treatment | < 0.001 | < 0.001 | < 0.001 | < 0.001 | < 0.001 | < 0.001 | < 0.001 | < 0.001 | 0.427 | 0.054 |
| Treatment × Habitat | < 0.001 | 0.006 | 0.291 | 0.200 | 0.282 | < 0.001 | < 0.001 | < 0.001 | 0.938 | 0.611 |
| Within subjects | ||||||||||
| Date | < 0.001 | < 0.001 | < 0.001 | < 0.001 | < 0.001 | < 0.001 | < 0.001 | < 0.001 | < 0.001 | < 0.001 |
| Date × Habitat | < 0.001 | < 0.001 | < 0.001 | < 0.001 | < 0.001 | < 0.001 | < 0.001 | < 0.001 | < 0.001 | < 0.001 |
| Date × Treatment | < 0.001 | < 0.001 | < 0.001 | < 0.001 | < 0.001 | < 0.001 | < 0.001 | < 0.001 | < 0.001 | < 0.001 |
| Date × Treatment × Habitat | < 0.001 | 0.016 | < 0.001 | 0.001 | < 0.001 | < 0.001 | < 0.001 | < 0.001 | 0.339 | < 0.001 |
Significant p-values are presented in boldface. SIR: soil substrate-induced respiration; CBH1: cellobiohydrolase; BG: β-1,4-glucosidase; NR: nitrate reductase; URE: urease; ACP: acid phosphatase; ALP: alkaline phosphatase; PER: peroxidase; PHO: phenol oxidase
Table 5.
Effects of WSII–PM2.5 on extracellular enzyme activities during six months of decomposition in the two forests.
Table 5.
Effects of WSII–PM2.5 on extracellular enzyme activities during six months of decomposition in the two forests.
| Treatment | BG | CBH1 | NR | URE | ACP | ALP | PER | PHO |
|---|---|---|---|---|---|---|---|---|
| Oak forest | ||||||||
| CK | 1.97 ± 0.03 a | 1.81 ± 0.03 a | 5.69 ± 0.08 a | 3.27 ± 0.10 a | 10.92 ± 0.34 a | 13.63 ± 0.48 a | 0.16 ± 0.04 a | 0.20 ± 0.03 a |
| PML | 1.82 ± 0.03 b | 1.68 ± 0.02 b | 4.10 ± 0.03 ab | 2.79 ± 0.10 b | 10.71 ± 0.43 a | 13.08 ± 0.33 ab | 0.11 ± 0.02 b | 0.17 ± 0.02 b |
| PMM | 1.72 ± 0.03 bc | 1.57 ± 0.02 b | 3.85 ± 0.02 b | 2.68 ± 0.13 b | 10.30 ± 0.36 ab | 12.35 ± 0.26 bc | 0.11 ± 0.02 b | 0.16 ± 0.02 bc |
| PMH | 1.60 ± 0.03 c | 1.30 ± 0.05 c | 3.13 ± 0.01 b | 2.55 ± 0.12 b | 8.89 ± 0.35 b | 10.67 ± 0.26 c | 0.11 ± 0.01 b | 0.14 ± 0.02 c |
| Pine forest | ||||||||
| CK | 1.94 ± 0.03 a | 1.87 ± 0.04 a | 5.49 ± 0.08 a | 3.40 ± 0.08 a | 9.56 ± 0.29 ab | 13.81 ± 0.21 a | 0.21 ± 0.03 a | 0.29 ± 0.05 a |
| PML | 1.82 ± 0.02 b | 1.76 ± 0.04 ab | 4.92 ± 0.08 ab | 3.23 ± 0.07 ab | 10.06 ± 0.20 a | 12.68 ± 0.17 b | 0.20 ± 0.03 a | 0.21 ± 0.03 ab |
| PMM | 1.76 ± 0.03 bc | 1.61 ± 0.05 bc | 4.39 ± 0.03 b | 3.10 ± 0.06 bc | 9.23 ± 0.30 ab | 11.91 ± 0.36 b | 0.17 ± 0.02 ab | 0.16 ± 0.02 b |
| PMH | 1.70 ± 0.02 c | 1.48 ± 0.05 c | 3.12 ± 0.01 b | 2.83 ± 0.06 c | 8.91 ± 0.42 b | 11.47 ± 0.21 c | 0.16 ± 0.02 b | 0.14 ± 0.01 b |
Data represent mean values of 6 months sampling during leaf litter decomposition and standard deviation (n = 4). Different superscript lowercase letters in a vertical row denote, for the two given forests, significant differences among treatments (p < 0.05). CBH1: cellobiohydrolase; BG: β-1,4-glucosidase; NR: nitrate reductase; URE: urease; ACP: acid phosphatase; ALP: alkaline phosphatase; PER: peroxidase; PHO: phenol oxidase. Abbreviations: WSII–PM2.5 denotes water-soluble inorganic ions in PM2.5; CK—control; PML—low concentration WSII–PM2.5; PMM—medium concentration WSII–PM2.5; PMH—high concentration WSII–PM2.5.
© 2020 by the authors. Licensee MDPI, Basel, Switzerland. This article is an open access article distributed under the terms and conditions of the Creative Commons Attribution (CC BY) license (http://creativecommons.org/licenses/by/4.0/).
Share and Cite
MDPI and ACS Style
Ji, Y.; Li, Q.; Ye, R.; Tian, K.; Tian, X. The Impact of Water-Soluble Inorganic Ions in Particulate Matter (PM2.5) on Litter Decomposition in Chinese Subtropical Forests. Forests 2020, 11, 238. https://doi.org/10.3390/f11020238
AMA Style
Ji Y, Li Q, Ye R, Tian K, Tian X. The Impact of Water-Soluble Inorganic Ions in Particulate Matter (PM2.5) on Litter Decomposition in Chinese Subtropical Forests. Forests. 2020; 11(2):238. https://doi.org/10.3390/f11020238
Chicago/Turabian StyleJi, Yanli, Qiang Li, Rumeng Ye, Kai Tian, and Xingjun Tian. 2020. "The Impact of Water-Soluble Inorganic Ions in Particulate Matter (PM2.5) on Litter Decomposition in Chinese Subtropical Forests" Forests 11, no. 2: 238. https://doi.org/10.3390/f11020238
Note that from the first issue of 2016, this journal uses article numbers instead of page numbers. See further details here.