Effects of Graphene on Larix olgensis Seedlings and Soil Properties of Haplic Cambisols in Northeast China


1
Key Laboratory of Sustainable Forest Ecosystem Management-Ministry of Education, School of Forestry, Northeast Forestry University, 26 Hexing Road, Harbin 150040, China
2
Daqing Wanfang Economic Development Corporation, Daqing, Heilongjiang 163411, China
*
Author to whom correspondence should be addressed.
Forests 2020, 11(3), 258; https://doi.org/10.3390/f11030258
Submission received: 14 January 2020
/
Revised: 22 February 2020
/
Accepted: 24 February 2020
/
Published: 27 February 2020
(This article belongs to the Section Forest Ecophysiology and Biology)
Abstract
:We investigated the impacts of graphene application at different concentrations on the growth and physiological characteristics of Changbai larch (Larix olgensis A. Henry) seedlings and the chemical properties and enzyme activities of Haplic Cambisols under these seedlings. The aim is to evaluate the environmental effects of graphene on the afforestation species and the zonal forest soils of Northeast China. Seedlings receiving 0 (CK), 25, 50, 100, 250, or 500 mg L−1 graphene were incubated for 30, 40, or 50 days. Low concentrations (25–50 mg L−1) of graphene increased the dry masses of root, stem, and leaf; however, high concentrations (100–500 mg L−1) inhibited them. Compared with those under 0 mg L−1 graphene, the root length, surface area, volume, and average diameter all increased during the early stages of incubation (i.e., 30 and 40 days) under low concentration of graphene (<50 or 100 mg L−1) and decreased at higher graphene concentration (>100 mg L−1); at 50 days, they were significantly inhibited. At 30 days, graphene decreased superoxide dismutase (SOD) and peroxidase (POD) activities, as well as pigment, soluble protein, and proline contents, and the decline increased with increasing graphene concentration; at 40 and 50 days, the above parameters increased initially and then decreased, reaching a maximum at 50 mg L−1. The changes in relative conductivity and malondialdehyde (MDA), superoxide anion and hydrogen peroxide contents were the opposite of those in the physiological indexes mentioned above. Therefore, graphene caused different degrees of oxidative stress in L. olgensis seedlings. At 30 days, graphene generally increased the organic matter, hydrolytic nitrogen, and available phosphorus and potassium contents of Haplic Cambisols, but these parameters decreased at 40 and 50 days. Graphene generally decreased acid phosphatase, urease, dehydrogenase, and catalase activities. Therefore, when graphene reaches a certain content level in this soil, it may also affect nitrogen and phosphorus cycling.
1. Introduction
Nanomaterials are usually defined as particles with a particle size of 1–100 nm and are also known as ultrafine particles [1]. They have many excellent optical, magnetic, electrical, thermal, chemical and mechanical properties [2]. Graphene is the thinnest and toughest two-dimensional nanomaterial in the world [3,4] and has a thickness of only 0.34 nm, a specific surface area of 2630 m2 g−1, and thermal conductivity of 5000 W m−1 K−1 [5,6,7,8]. These special properties make it appropriate for widespread application in environmental applications [9], electronics [10], information technology, optics [11], energy, materials science [12], and biomedicine [9,13,14,15]. Like other nanomaterials, graphene is stable in the environment and is not easily degraded, which makes it inevitably enter into the atmosphere, water, soil and other environments [16]. Therefore, its use may have some impacts or potential risks to ecosystems [17], especially for the soil and plants.
Regarding the effects of graphene on plant growth, only a few studies have been done, and there is considerable debate about its effects since in some species (wheat and garlic), increases have been observed in root length, root dry mass, leaf length [18,19,20], adventitious root elongation and main root formation [21], while in other species (cabbage, tomato, coriander, wheat, Populus tremula Linn), decreases in seedling height, germination rate, biomass, adventitious root number and leaf area were observed [20,21,22,23]. For the studies of inhibition effects [20,21,22,23], the phytotoxicity of graphene to plants is closely related to the oxidative stress response of plants [22], and reactive oxygen species (ROS) contents in plants increase with increasing graphene concentration [20,21,22,23]. Studies have also shown that appropriate concentration of graphene can promote plant growth, while high concentration significantly inhibits it [21]. Therefore, the effects of graphene on plant growth are closely related to its concentration and treatment time as well as the plant type.
Soil is the basis of agroforestry production, and its biological characteristics, such as enzyme activities, and nutrient cycling, are important and effective indicators to measure the impact of pollutants or foreign substances, such as graphene, on soil biological activity and metabolic capacity [24,25,26]. The response of soil properties to graphene, such as soil chemical properties, enzyme activities, and nutrient cycling, is rarely studied, but the effects of multiwalled carbon nanotubes (MWCNTs), which have similar properties as graphene, on soil enzyme activities have been reported. For example, there was no significant change in glucosidase or phosphatase activity under 1000 mg kg−1 MWCNT treatment for three months [27,28], nor in catalase, phosphatase or glucosidase activity under 1000 mg kg−1 fullerene for six months [29]. Similarly, MWCNTs had no significant effect on urease activity [30] but inhibited acid phosphatase activity [31]. It has been found that graphene in soils can interact with organic matter, which makes graphene less likely to enter into organisms [32], and its contact with enzymes, such as catalase, is limited; thus, graphene may not induce toxic effects on plants in a short period [27]. In addition, active oxygen is the toxic effect response of soil microorganisms to graphene, but graphene entering the soil does not cause an increase in active oxygen [33] that would affect enzyme activities. At present, the focus of the above researches has been on agricultural crops, while researches on forest soil environments and plantation-grown forest tree species are limited.
Haplic Cambisols are zonal forest soils in Northeast China. Larix olgensis A. Henry is one of the most productive commercial forestry species and is a useful tree species for afforestation in this area. In some transition zone of agriculture and forestry, graphene may enter Haplic Cambisols under L. olgensis forests in various ways, thus influencing soil environments and L. olgensis growth. However, how graphene may affect L. olgensis and the properties of Haplic Cambisols is still unknown. Here, we applied different concentrations of graphene to Haplic Cambisols used to grow L. olgensis seedlings and monitored the resulting changes to the growth and physiological characteristics of L. olgensis seedlings, as well as the chemical properties and enzyme activities of the Haplic Cambisols. Our aim is to monitor the responses of L. olgensis seedlings and Haplic Cambisols to graphene to scientifically evaluate the potential toxicity or risk of graphene to the soil ecological environment of Northeast China.
2. Materials and Methods
2.1. Soil Collection and Treatments
The study was conducted in the greenhouse of the Maoershan Forest Research Station of Northeast Forestry University, Harbin, Heilongjiang province, China. The station is located at 127°30′–127°34′ E and 45°21′–45°25′ N with a continental temperate monsoon climate. Here, annual average temperature is 2.4 °C (range: −40 to 34 °C, mean annual precipitation is 700 mm, and the frost-free period is about 125 days with a growing season ranging between 120 and 140 days. The soils used here are the loam A1 horizon of the Typic Bori-Udic Cambisols corresponding to Haplic Cambisols (Grayic, Dystric) [34], the zonal forest soil of Northeast China with high organic matter content and well-developed horizons. The soils were also collected from a L. olgensis forest in May 2019. Fresh soil samples were stored in hop-pockets and taken to the laboratory. Plant residues and other impurities in the soils were removed with tweezers. Then, the samples were powdered, sufficiently mixed, sifted through 2 mm nylon screens, and air-dried for 1 day to sterilize. The properties of the soil samples were shown in Table 1.
Pure graphene was purchased from Suzhou Tanfeng Graphene Technology Co., Ltd. (Suzhou, Jiangsu Province, China). Its specific parameters were as follows: concentration, 2 mg mL−1; thickness, <1 nm; specific surface area, 1000–1217 m2 g−1; sheet diameter, 0.2–10 µm; layer number, 1–2; purity, >99 wt %; color, black.
2.2. Seedling Culture and Graphene Addition
L. olgensis seedlings (1a) were purchased from Maoershan Forest Research Station of Northeast Forestry University, Harbin, Heilongjiang Province, China, at the end of May 2019. The average seedling height was 13 cm, and the average ground diameter was 2.5 mm. These seedlings were planted in pots (volume: 10237.5 cm3) filled with the loam A1 horizon of the Haplic Cambisols free from impurities (3.3 kg per pot, Table 1). Twenty seedlings were planted in each pot, and 180 pots and 3600 seedlings in total.
After preculturing the L. olgensis seedlings for two weeks, the soils in pots were treated with graphene solution at concentrations of 0 (Ck), 25, 50, 100, 250 and 500 mg L−1 (with reverse osmosis (RO) water, pH 5.8)). The addition procedure went as follows: the graphene solution was slowly added until it had evenly mixed with the soil. The amount of graphene added to the soil was estimated based on the concentration of graphene in solution, the amount of solution, and the soil weight in each pot to achieve different graphene contents of 0, 7.6, 15.2, 30.3, 75.8 and 151.5 mg kg−1, respectively. Then, the seedlings and soils were incubated at 25 °C. The soil water content was maintained at 70% of field water capacity by adding high-purity water weekly. The experimental layout is described in Table 2.
Because of the cold climate, the experiment was set up in late May; the tree leaves begin to turn yellow and fall off in late August, precluding an accurate determination of the relevant indicators. At 30, 40, and 50 days after graphene treatments started, the sampling and analysis were conducted. There were three sampling and analysis times (i.e., 30, 40, and 50 days) after graphene treatment. For each sampling time, there were six treatments, with 10 pots employed per treatment and 180 pots in total. The harvests included 10 pots for each treatment at each time.
2.3. Plant Assays
2.3.1. Growth Observation, and Survival Rate and Biomass Measurements
At all graphene treatment times, seedling growth was observed twice a day, i.e., at 8 o’clock in the morning and at 8 o’clock in the evening. At 50 days, dead seedlings in each pot for all the treatments were counted, and survival rate was calculated.
At 30, 40, and 50 days after graphene application, a total of 15 random seedlings per treatment from 10 pots were harvested, washed with running tap water, and divided into leaf, stem, and root. The dry masses of all parts were determined after drying to a constant weight at 80 °C.
2.3.2. Root Morphology
At 30, 40, and 50 days after graphene application, three seedlings were randomly and carefully harvested using a shovel to avoid root damage across the 10 pots within each treatment. The seedlings were washed thoroughly with running tap water, dried with filter paper, and divided into root, stem, and leaf. Root (<2 mm) morphological indicators (length, volume, surface area, and average diameter) were measured using Root System Analyzer (Win-RHI Z0-2004a, Canada).
2.3.3. Physiological Parameter Measurements
Fresh leaf samples from middle needles were randomly collected from each treatment across 10 pots (approximately 2.0 g) for immediate physiological assays. First, leaf samples were fully mixed together, and the relative conductivity was measured using a Shanghai Leici Magnetic DDS-6700 conductivity meter. Then, the other samples were frozen and ground with liquid nitrogen to perform the following physiological assays immediately. Malondialdehyde (MDA) contents that measure lipid peroxidation level were determined as 2-thiobarbituric acid (TBA) reactive metabolites, superoxide anion contents using the pyrogallol method, hydrogen peroxide contents using Ti (Ⅳ)-H2O2 colorimetry, superoxide dismutase (SOD) activity using a nitro blue tetrazolium (NBT) photochemical reduction, peroxidase (POD) activity by a guaiacolassay, proline contents by the acidic ninhydrin reaction, soluble protein contents by coomassie brilliant blue G-250 staining, and chlorophyll and carotenoid contents by 80% acetone extraction-spectrophotometry. All procedures were carried out according to the methods of Li [35]. Each assay was repeated three times.
2.3.4. Determination of Soil Chemical Properties and Enzyme Activities
At 30, 40, and 50 days after graphene treatment, soil samples were randomly collected from each pot (approximately 200 g), air-dried, sifted through 2 mm nylon screens, mixed, and analyzed for their chemical properties and enzyme activities. Organic matter (OM) content was obtained using a TOC (total organic carbon) analyzer; hydrolytic nitrogen (HN) content was obtained via the alkali reduction diffusion method; available phosphorus (AP) content was determined through the Mo-Sb colorimetric method, with a 0.05 mol L−1 HCl−0.025 mol L−1 H2SO4 extraction; and available potassium (AK) content was determined via the photometric method. All procedures for soil chemical properties were carried out according to Chen [36]. Acid phosphatase activity was determined using disodium phenyl phosphate colorimetry [37,38], urease activity was measured by the indophenol-blue colorimetric method [39], dehydrogenase activity was found using TTC (2,3,5-triphenyltetrazolium chloride) colorimetry [37], and catalase activity was obtained using the methods of Johnson and Temple [40]. Each determination was replicated three times.
2.4. Data Analysis
OriginPro 2019 (Originlab, Northampton, MA, USA) and SigmaPlot 10.0 (SYSTAT software, Chicago, IL, USA) were used to make figures. Tukey test was used to test for the treatment effects between different graphene concentrations for the same treatment time) (at p < 0.05) with SPSS 18.0 software (IBM Corporation, Armonk, NY, USA). For soil chemical properties and enzyme activities, Pearson correlations were analyzed in a randomized design with repeated measures using SPSS 18.0, and factor analysis was conducted using OriginPro 2019 software (Originlab, Northampton, MA, USA).
3. Results
3.1. Plant Growth Attributes
3.1.1. Growth and Biomass
Graphene influenced the growth and biomass of L. olgensis seedlings, and the dry masses of leaf, stem and root showed basically the same trends (Figure 1 and Figure 2). During the whole treatment period, root, stem and leaf biomass generally increased at low concentration of graphene (25–100 mg L−1), with the effects of all treatments being not significant. However, these biomass parameters often significantly decreased at high concentration of graphene (250–500 mg L−1), though the effects of few treatments were significant (p < 0.05), indicating that high concentration of graphene inhibited the growth of seedlings. The declines grew with increasing graphene concentration (Figure 2). Survival rates of the seedlings at 50 days were also decreased with increasing graphene concentration (Ck = 98.3%, T1 = 90.3%, T2 = 81.7%, T3 = 76.7%, T4 = 60.0% and T5 = 50.0%). The increase in biomass at low concentration of graphene followed the order of 40 > 30 > 50 days (Figure 2).
3.1.2. Root Morphology
At 30 and 40 days, low concentration of graphene caused an increase in the length, surface area, volume and average diameter of roots compared with those under the control, with a maximum generally at 50 or 100 mg L−1 (Figure 3). At higher concentrations, all the above parameters decreased; most of the treatments showed lower values than the control. At 50 days, the above parameters were inhibited, and the decreases usually grew with increasing graphene concentration (Figure 3).
3.1.3. Physiological Responses
Graphene generally increased the relative conductivity (except for 250 and 500 mg L−1 at 40 days) and MDA contents (except for 25, 50 and 100 mg L−1 at 40 days and 50 mg L−1 at 50 days) of L. olgensis leaves (Figure 4). The increments in the relative conductivity and MDA contents both grew with increasing graphene concentration, indicating that graphene damaged the cell membrane of leaves, and the damage was the most serious at 500 mg L−1. The order of maximum relative conductivity and MDA contents was generally 50 > 40 > 30 days (Figure 4).
At 30 days, the contents of superoxide anion (O2−) and hydrogen peroxide in graphene-treated L. olgensis leaves both increased and generally increased with increasing graphene concentration (Figure 5), though the effects of few treatments being significant (p < 0.05). At 40 and 50 days, superoxide anion and hydrogen peroxide contents decreased initially and then increased, with the effects of some treatments being not significant (p > 0.05). For the three treatment times, 250 or 500 mg L−1 graphene was generally the most toxic to the seedlings, meaning that at this concentration, a large amount of O2·_ and H2O2 were induced in leaves. The toxic effects ranked in the order 30 > 50 > 40 days (Figure 5).
Graphene influenced the POD and SOD activities of L. olgensis leaves, though the effects of some treatments were not significant (p < 0.05), and their change trends were basically the same (Figure 6). At 30 days, POD and SOD activities in the leaves decreased under graphene treatments, and the declines increased with increasing graphene concentration; at 40 days, POD and SOD activities increased first and then decreased; at 50 days, they decreased first, then increased and decreased. Overall, at 40 and 50 days, most of the treatments showed a decreasing in POD and SOD activities, with a minimum at 250 or 500 mg L−1 at all treatment times (Figure 6).
Graphene generally reduced the contents of soluble protein and proline in L. olgensis leaves (except for the soluble protein contents at 25, 50, 100 and 500 mg L−1 for 40 days and 50 mg L−1 for 50 days, and the proline contents at 25, 50 mg L−1 for 40 days and 50 mg L−1 for 50 days), and their change trends were similar (Figure 7). At 30 days, soluble protein and proline contents gradually decreased with increasing graphene concentration; at 40 days, they first increased and then decreased; at 50 days, they first decreased, increased and then decreased, usually being the lowest at 250 or 500 mg L−1, and there were significant differences between some treatments (p < 0.05; Figure 7).
Graphene affected photosynthetic pigment contents with the effects of some treatments being significant (p < 0.05; Figure 8). At 30 days, graphene reduced carotenoid and total chlorophyll contents; however, at high graphene concentration (250–500 mg L−1), their contents increased slightly, but they were still lower than those of the control and were the lowest at 100 mg L−1 (Figure 8). At 40 and 50 days, graphene usually increased their contents, which first increased and then decreased with increasing graphene concentration; the highest carotenoid and total chlorophyll contents were generally found at 50 or 100 mg L−1 (Figure 8).
3.2. Soil Properties
3.2.1. Soil Chemical Properties
Regarding the effects of graphene on soil chemical properties, such as organic matter (OM), hydrolytic nitrogen (HN), available phosphorus (AP) and available potassium (AK) contents, at 30 days, promotion effects were observed (except for AP contents at 25 and 100 mg L−1 and AK contents at 100 mg L−1), often reaching the maximum at 50 or 250 mg L−1; however, at 40 and 50 days, inhibition was often found, and the minimums were observed at 250 mg L−1 (except for AP contents) (Figure 9). At different treatment times, the organic matter, HN, AP and AK contents had different change patterns (Figure 9).
3.2.2. Soil Enzyme Activities
Graphene inhibited soil urease, catalase, dehydrogenase and acid phosphatase activities (except for urease activity at 30 days, catalase activity at 500 mg L−1 for 30 days and 100, 250 and 500 mg L−1 for 40 days, dehydrogenase activity at 25 and 50 mg L−1 for 40 days and 25, 50 and 100 mg L−1 for 50 days), and most of the differences in enzyme activities were significant (p < 0.05; Figure 10). At 30, 40 and 50 days, the activities of different enzymes showed a certain change trend due to graphene concentration (Figure 10).
3.2.3. Correlation Analysis of Soil Properties
Under graphene treatment, different correlations were observed between soil chemical properties and enzyme activities, including notable positive correlations (p < 0.01; such as between OM contents and HN contents and acid phosphatase activity, between AK and HN contents, and between acid phosphatase activity and HN contents) and significant positive correlations (p < 0.05; e.g., between AK contents and acid phosphatase activity, OM and AP contents between HN contents and urease activity, and between AP contents and dehydrogenase activity) (Table 3). The many correlations found, for which some were much stronger than others, suggesting that ecological or environmental information overlapped among them From the factor analysis results (Figure 11), it can be further seen that, under different graphene concentrations and times, the changes in HN, organic matter and AK contents were most significant, followed by the changes in AP content, dehydrogenase and urease activities, and the changes in catalase and acid phosphatase activities were the least significant.
4. Discussion
This study found that graphene influenced the growth of L. olgensis seedlings, especially survival rates of the seedlings at 50 days were decreased, and the declines grew with increasing graphene concentration (Figure 1). The seedling biomass declined at high graphene concentration (the inhibition rose with graphene concentration) but was promoted at low concentration (except for 50 days), and the most positive effects were generally found at 25 or 50 mg L−1 (Figure 2). As a new type of carbon nanomaterials, graphene is widely applied and may enter soil environments in many ways. Thus, it may pose potential impacts to ecosystems, including their soils and plants. Similarly, some other studies also have shown that graphene influences plant growth and biomass accumulation. For example, the growth of pak choi, tomato, and spinach was severely inhibited under 500–2000 mg L−1 graphene treatments for 20 days [41]; graphene quantum dots inhibited the seedling height of coriander [20]; after exposing wheat to graphene for 30 days, its growth was inhibited, the levels of several nutrient elements (N, K, Ca, Mg, Fe, Zn, and Cu) in the plant decreased, and its nutritional balance was broken [23].Therefore, the effects of graphene on plant growth varied with graphene concentration and treatment time.
At present, the impact of graphene on plant roots and leaves is still controversial, with positive, negative or no obvious effects. On the one hand, graphene [19] and iron nanoparticles [18] can elongate root cells of wheat and promote root elongation; under treatment with graphene quantum dots, the average length and dry mass of coriander root and the root dry mass and length and leaf length of garlic all significantly increased, but the number of garlic leaves did not change [20]. On the other hand, the appropriate concentration of graphene promoted adventitious root elongation and main root formation in Populus tremula Linn, increasing its root number and making its root system strong and deeply colored. However, a high concentration of graphene obviously inhibited the growth of Populus tremula Linn; the plants had few fibrous roots, their leaves were small, and the aboveground part was light green and slightly yellow [21]. In this study, at 30 and 40 days, low concentration of graphene thickened and expanded the root system of L. olgensis (Figure 3), which may be because graphene influenced the division and differentiation of root tip cells. However, at higher concentration of graphene (>50 mg L−1), the L. olgensis roots became shorter, and both the root volume and surface area decreased (Figure 3). It is possible that high concentration of graphene can inhibit the cell division and destroy the cell structure; thus, normal root physiology is affected, and root growth is inhibited.
Relative conductivity and MDA are significant indicators of physiological plant stress and can be used to reflect the permeability of plant cell membrane. Their contents are in direct proportion to the damage to plants caused by adverse conditions. Under adverse conditions, the plant cell membrane is damaged, the relative conductivity increases, and a large amount of superoxide anion and hydrogen peroxide (H2O2), which are the main active oxygen radicals, are also produced and accumulated in plant cells [42]. Under the graphene treatment, the contents of ROS and H2O2 in cabbage, tomato, and spinach increased to various degrees, indicating that graphene induced oxidative stress in these plants [41]. In this study, all concentrations of graphene treatments for 30 days and high concentration of graphene (>50 mg L−1) for 40 and 50 days also increased the relative conductivity, MDA, superoxide anion and hydrogen peroxide contents of L. olgensis leaves, and these parameters increased with increasing graphene concentration at 30 days (Figure 4 and Figure 5). Similarly, Liu et al. [43] also found that high concentration of graphene (50–200 mg L−1) significantly increased MDA contents in the root tips of rice seedlings and then the degree of peroxidation increased.
Under adverse conditions, plant cells will produce a certain self-regulatory response to prevent toxicity [44]. POD and SOD can effectively remove excessive free radicals and peroxide in plants and improve the adaptability of plants to adverse conditions. When nanoparticles contact with organisms, a large amount of ROS will be produced in plant cells. SOD and POD were the enzymes to firstly act on ROS, and the increase of SOD and POD activities played a role as an acute detoxification measure [44]. At the same time, the induction of the two enzyme activities also suggested that the plant was in a state of oxidative stress. In this study, after the treatment of L. olgensis seedlings with graphene, especially at 40 and 50 days, the lower concentration of graphene (<100 mg L−1) caused some oxidative stress to these seedlings, and the activities of SOD and POD increased to remove the excess active oxygen produced by graphene. However, under the higher-concentration graphene treatments, SOD and POD activities were reduced, meaning that the active oxygen produced by graphene in the seedlings may have exceeded the scavenging ability of antioxidant systems (SOD and POD). The excessive ROS then caused oxidative damage to the cell membrane, which is also reflected on the increase in relative conductivity and MDA, superoxide anion and hydrogen peroxide contents (Figure 4 and Figure 5). Our results also suggested that the lower concentration of graphene (<100 mg L−1) caused some oxidative stress to L. olgensis seedlings at 40 and 50 days. The toxicity mechanism of graphene to L. olgensis is closely related to oxidative stress, which is consistent with the results of Begum et al. [22]. The short-term toxicity of graphene to L. olgensis seedlings is mainly oxidative stress to roots and root growth inhibition, but after long-term treatment, the antioxidant system in seedlings will be seriously damaged.
It is generally believed that when plants are stressed by pollutants, they begin to show strong osmotic regulation ability, which decreases or loses with the increase in stress level [42]. Proline and soluble proteins are important osmotic regulators in the plant cytoplasm and can maintain the osmotic pressure of plants, improve their resistance to external stress and prevent cell dehydration. At present, changes in proline and soluble protein contents have not been mentioned in studies on the effect of graphene on plants [41,45]. In this study, after graphene treatment, the soluble protein and proline contents of L. olgensis leaves generally decreased with increasing graphene concentration (Figure 7), suggesting that a high concentration of graphene significantly reduced the osmotic adjustment ability of the seedlings.
Chlorophyll directly affects plant photosynthesis and is an important indicator of plant growth and health as well as environmental change. Studies have shown that the chlorophyll content and PSII activity of wheat decreased after being exposed to graphene for 30 days [23], and 500 mg L−1 graphene also significantly reduced the chlorophyll contents of wheat leaves [43]. The same is true in this study (Figure 8), indicating that graphene may affect the photosynthetic process of L. olgensis seedlings.
In addition to plant growth and physiological parameters, changes in soil characteristics, such as enzyme activities and chemical properties, are also closely related to the effects of pollutants or foreign substances on the environment [24,25]. In particular, soil enzyme activity can be used to evaluate the impact of foreign pollutants on soil biological activity [23] and effectively reflect the state of material circulation and energy flow in the soil [46]. Organic matter is an important carrier of soil enzymes and an energy source for microorganisms [47]. Soil urease and catalase are closely associated to organic matter contents and microbial quantity, especially urease, which can promote the hydrolysis of urea to ammonia and carbonic acid [46,48]. Dehydrogenase catalyzes dehydrogenation reactions and acts as an intermediate transmitter of hydrogen. When graphene was in contact with Haplic Cambisols, the activities of acid phosphatase, urease, dehydrogenase, and catalase all decreased (Figure 10), which was consistent with the results of Ahmed [49] and Wang et al. [50]. This result indicates that graphene may inhibit the activity and viability of some microorganisms in this soil [48]. However, with the increase in graphene treatment time, especially at 50 days, the decrease in enzyme activities in Haplic Cambisols was no longer significant (except for acid phosphatase activity) (Figure 10), which indicates that the toxicity of graphene in this soil is limited, as found by Li et al. [25]. In particular, catalase is closely related to the size and activity of the bacterial community and can also reflect the intensity of soil microbial process to a certain extent. In this study, a high concentration of graphene (500 mg L−1 at 30 days and 100–500 mg L−1 at 40 days) often increased catalase activity at 30 and 40 days, though the effects of the treatments were not all significant (p < 0.05) (Figure 10), suggesting that soil microorganisms may produce some oxidative stress in this period, but the change of catalase activity was not significant when the treatment time was prolonged (at 40 and 50 days), which also showed that the toxicity of graphene in this soil was limited. When the treatment time was shorter (30 days), graphene increased the soil HN contents and urease activity, but for a longer time (40 and 50 days), these parameters were inhibited (Figure 9 and Figure 10), which suggested that graphene may also affect the nitrogen cycle in Haplic Cambisols. For urease and dehydrogenase activities, their declines in some graphene treatments at 50 days were higher than those at 40 days, which may be because graphene undergoes dispersion; with the increase of contact time, its toxicity to some microorganisms, such as bacteria, increases.
In addition, graphene usually decreased the HN, AP, and AK contents in Haplic Cambisols (Figure 9), which may influence the absorption of the above nutrients (N, P, and K) by seedlings and lead to changes in their root morphological characteristics. Acid phosphatase is an important index to evaluate soil phosphorus, and all concentrations of graphene significantly inhibited its activity (Figure 10), suggesting that graphene in Haplic Cambisols may affect the phosphorus cycle.
5. Conclusions
This study is the first to provide experimental evidence revealing the interrelations between graphene and L. olgensis seedlings and Haplic Cambisols in Northeast China. After graphene treatments for 30, 40, and 50 days, the dry masses of the seedlings all increased first and then decreased, generally being highest at 25 or 50 mg L−1. At 30 and 40 days, the root morphology increased first and then decreased, reaching maximum at 50 or 100 mg L−1; however, at 50 days, it was inhibited at all concentrations of graphene. As to the relative conductivity, malondialdehyde (MDA), superoxide anion and hydrogen peroxide contents of L. olgensis leaves, they increased at 30 days, but usually decreased first and then increased at 40 and 50 days, generally reaching the minimum at 50 mg L−1. For the peroxidase (POD) and superoxide dismutase (SOD) activities and chlorophyll, soluble protein and proline contents, they decreased at 30 days, and the effects increased with increasing graphene concentration; however, they increased first and then decreased at 40 and 50 days, reaching the maximum at 50 mg L−1. At 30 days, graphene increased the organic matter, hydrolytic nitrogen, available phosphorus, and available potassium contents of Haplic Cambisols, but at 40 and 50 days, they often decreased. Graphene usually had an inhibitory effect on the activities of acid phosphatase, urease, dehydrogenase and catalase. Therefore, graphene caused different degrees of oxidative stress in L. olgensis seedlings, and their antioxidant systems might be seriously damaged by long-term treatments. When graphene concentration reaches a certain level, it may also affect nitrogen and phosphorus cycling in Haplic Cambisols. Although the exact mechanisms of the graphene response are difficult to infer, this study clearly demonstrates the beneficial value or harmful effect of graphene at different concentrations and treatment time on these seedlings in this soil.
Author Contributions
Conceptualization, J.S. and X.C.; investigation, K.C., C.D. and N.L.; data curation, K.C. and C.D.; writing—original draft, J.S. and C.D.; writing—review and editing, J.S., K.C., C.D., N.L. and X.C.; funding acquisition, J.S. All authors have read and agreed to the published version of the manuscript.
Funding
This work was financially supported by the National Natural Science Foundation of China (31370613), the Fundamental Research Funds for the Central Universities (2572019CP15).
Conflicts of Interest
The authors declare no conflict of interest.
References
- Zhang, Z.K.; Cui, Z.L. Nanotechnology and Nanomaterials; National Defense Industry Press: Beijing, China, 2000. (In Chinese) [Google Scholar]
- Shen, X.C.; He, X.W.; Liang, H. The characteristic of nanoparticles and applications in bioanalysis. Chin. J. Anal. Chem. 2003, 31, 880–885. (In Chinese) [Google Scholar]
- Huang, Y.; Chen, Y.S. Functionalization of graphene and their applications. Sci. China Press 2009, 39, 887–896. (In Chinese) [Google Scholar]
- Novoselov, K.S.; Geim, A.K.; Morozov, S.V.; Jiang, D.; Zhang, Y.; Dubonos, S.V.; Grigorieva, I.V.; Firsov, A.A. Electric field effect in atomically thin carbon films. Science 2004, 306, 666–669. [Google Scholar] [CrossRef] [PubMed] [Green Version]
- Robinson, J.T.; Tabakman, S.M.; Liang, Y.Y.; Wang, H.L.; Casalongue, H.S.; Vinh, D.; Dai, H. Ultrasmall reduced graphene oxide with high near-infrared absorbance for photothermal therapy. J. Am. Chem. Soc. 2011, 133, 6825–6831. [Google Scholar] [CrossRef] [PubMed]
- Service, R.F. Carbon sheets an atom thick give rise to graphene dreams. Science 2009, 324, 875–877. [Google Scholar] [CrossRef] [PubMed]
- Lee, C.G.; Wei, X.D.; Kysar, J.W.; Hone, J. Measurement of the elastic properties and intrinsic strength of monolayer graphene. Science 2008, 321, 385–388. [Google Scholar] [CrossRef]
- Novoselov, K.S.; Jiang, Z.; Zhang, Y.; Morozov, S.V.; Stormer, H.L.; Zeitler, U.; Maan, J.C.; Boebinger, G.S.; Kim, P.; Geim, A.K. Room-temperature quantum hall effect in graphene. Science 2007, 315, 1379. [Google Scholar] [CrossRef] [Green Version]
- Zhuang, Y.; Yu, F.; Ma, J.; Chen, J.H. Research Progress of application of graphene on removing heavy metals and antibiotics from water. J. Funct. Mater. 2014, 45, 23001–23009. (In Chinese) [Google Scholar]
- Paek, S.M.; Yoo, E.; Honma, I. Enhanced cyclic performance and lithium storage capacity of SnO2/graphene nanoporous electrodes with three dimensionally delaminated flexible structure. Nano Lett. 2009, 9, 72–75. [Google Scholar] [CrossRef]
- Klaine, S.J.; Alvarez, P.J.; Batley, G.E.; Fernandes, T.F.; Handy, R.D.; Lyon, D.Y.; Mahendra, S.; McLaughlin, M.J.; Lead, J.R. Critical review–nanomaterials in the environment: Behavior, fate, bioavailability, and effects. Environ. Toxicol. Chem. 2008, 27, 1825–1851. [Google Scholar] [CrossRef]
- Zhang, L.M.; Xia, J.G.; Zhao, Q.H.; Liu, L.W.; Zhang, Z.J. Functional graphene oxide as a nanocarrier for controlled loading and targeted delivery of mixed anticancer drugs. Small 2010, 6, 537–544. [Google Scholar] [CrossRef] [PubMed]
- Singh, N.; Srivastava, G.; Talat, M.; Raghubanshi, H.; Srivastava, O.N.; Kayastha, A.M. Cicer alphagalactosidase immobilization onto functionalized graphene nanosheets using response surface method and its applications. Food Chem. 2014, 142, 430–438. [Google Scholar] [CrossRef] [PubMed]
- Stankovich, S.; Dikin, D.A.; Dommett, G.H.; Kohlhaas, K.M.; Zimney, E.J.; Stach, E.A.; Piner, R.D.; Nguyen, S.T.; Ruoff, R.S. Graphene-based composite materials. Nature 2006, 442, 282–286. [Google Scholar] [CrossRef] [PubMed]
- Xu, Y.F.; Liu, Z.B.; Zhang, X.L.; Wang, Y.; Tian, J.G.; Huang, Y.; Ma, Y.F.; Zhang, X.Y.; Chen, Y.S. A graphene hybrid material covalently functionalized with porphyrin: Synthesis and optical limiting property. Adv. Mater. 2009, 21, 1275–1279. [Google Scholar] [CrossRef]
- Pan, Y.; Sahoo, N.G.; Li, L. The application of graphene oxide in drug delivery. Expert Opin. Drug Del. 2012, 9, 1365–1376. [Google Scholar] [CrossRef]
- Dinesh, R.; Anandaraj, M.; Srinivasan, V.; Hamza, S. Engineered nanoparticles in the soil and their potential implications to microbial activity. Geoderma 2012, 173–174, 19–27. [Google Scholar] [CrossRef]
- Kim, J.H.; Lee, Y.; Kim, E.J.; Gu, S.; Sohn, E.J.; Seo, Y.S.; An, H.J.; Chang, Y.S. Exposure of iron nanoparticles to arabidopsis thaliana enhances root elongation by triggering cell wall loosening. Environ. Sci. Technol. 2014, 48, 3477–3485. [Google Scholar] [CrossRef]
- Zhang, P. Mechanisms of graphene toxicity to plants. Ph.D. Thesis, Zhejang Gongshang University, Hangzhou, Zhejiang, China, 2015. (In Chinese). [Google Scholar]
- Chakravarty, D.; Erande, M.B.; Late, D.J. Graphene quantum dots as enhanced plant growth regulators: Effects on coriander and garlic plants. J. Sci. Food Agric. 2015, 95, 2772–2778. [Google Scholar] [CrossRef]
- Yao, J.Z.; Zhang, Z.C.; Xue, B.L.; Zhou, Y.Q.; Hu, X.F.; Xing, B.Y.; Wang, H.Y.; Bai, H.H.; Liu, X.J.; Zhou, J.G. Effect of graphene on adventitious roots’ morphology of tissue culture seedlings of Populus Davidiana. J. Shanxi Datong Univ. (Nat. Sci.) 2018, 34, 6–9. (In Chinese) [Google Scholar]
- Begum, P.; Ikhtiari, R.; Fugetsu, B. Graphene phytotoxicity in the seedling stage of cabbage, tomato, red spinach, and lettuce. Carbon 2011, 49, 3907–3919. [Google Scholar] [CrossRef] [Green Version]
- Zhang, P.; Zhang, R.; Fang, X.; Song, T.; Cai, X.; Liu, H.; Du, S. Toxic effects of graphene on the growth and nutritional levels of wheat (Triticum aestivum L.): Short- and long-term exposure studies. J. Hazard. Mater. 2016, 317, 543–551. [Google Scholar] [CrossRef] [PubMed]
- Badiane, N.N.Y.; Chotte, J.L.; Patea, E.; Masse, D.; Rouland, C. Use of soil enzyme activities to monitor soil quality in natural and improved fallows in semi-arid tropical regions. Appl. Soil Ecol. 2001, 18, 229–238. [Google Scholar] [CrossRef]
- Li, L.N.; Teng, Y.; Ren, W.J.; Li, Z.G.; Luo, Y.M. Effects of graphene on soil enzyme activities and microbial communities. Soils 2016, 48, 102–108. (In Chinese) [Google Scholar]
- Yan, J.; Han, X.Z.; Ji, Z.J.; Li, Y.; Wang, E.T.; Xie, Z.H.; Chen, W.F. Abundance and diversity of sovbean-nodulating rhizobia in black soil are impacted by land use and crop management. Appl. Environ. Microb. 2014, 80, 5394–5402. (In Chinese) [Google Scholar] [CrossRef] [Green Version]
- Shrestha, B.; Martinezb, V.A.; Cox, S.B.; Green, M.J.; Li, S.; Cañas-Carrell, J.E. An evaluation of the impact of multiwalled carbon nanotubes on Soil microbial community structure and functioning. J. Hazard. Mater. 2013, 261, 188–197. [Google Scholar] [CrossRef]
- He, C.; Gao, F.; Lu, X.X.; Hou, Z.; Zhang, S. Ecotoxicological effects of multi-wall carbon nanotube on soil microorganisms. Asian J. Ecotoxicol. 2012, 7, 155–161. (In Chinese) [Google Scholar]
- Teng, Y.; Luo, Y.M.; Li, Z.G. Microbial diversity in polluted soils: An overview. Acta Pedol. Sin. 2006, 43, 1018–1026. (In Chinese) [Google Scholar]
- Tong, Z.; Bischoff, M.; Nies, L.; Applegate, B.; Turco, R.F. Impact of fullerene (C60) on a soil microbial community. Environ. Sci. Technol. 2007, 41, 2985–2991. [Google Scholar] [CrossRef]
- Jin, L. High concentrations of single-walled carbon nanotubes lower soil enzyme activity and microbial biomass. Ecotoxicol. Environ. Saf. 2013, 88, 9–15. [Google Scholar] [CrossRef]
- Lammel, T.; Boisseaux, P.; Fernández-Cruz, M.L.; Navas, J.M. Internalization and cytotoxicity of graphene oxide and carboxyl graphene nanoplatelets in the human hepatocellular carcinoma cell line HepG2. Part. Fibre Toxicol. 2013, 10, 27. [Google Scholar] [CrossRef] [Green Version]
- Lanphere, J.D.; Luth, C.J.; Walker, S.L. Effects of solution chemistry on the transport of graphene oxide in saturated porous media. Environ. Sci. Technol. 2013, 47, 4255–4261. [Google Scholar] [CrossRef] [PubMed]
- IUSS Working Group WRB. World Reference Base for Soil Resources 2006, World Soil Resource Reports 103; FAO: Rome, Italy, 2006; pp. 53–65. [Google Scholar]
- Li, H.S.; Sun, Q.; Zhao, S.J.; Zhang, W.H. Principles and Techniques of Plant Physiological Biochemical Experiment; Higher Education Press: Beijing, China, 2000; pp. 134–263. (In Chinese) [Google Scholar]
- Chen, L.X. Soil Experiment and Practice Course; Northeast Forestry University Press: Harbin, China, 2005; pp. 61–95. (In Chinese) [Google Scholar]
- Häussling, M.; Marschner, H. Organic and inorganic soil phosphates and acid phosphatase activity in the rhizosphere of 80-year-old Norway spruce [Picea abies (L.) Karst.] trees. Biol. Fert. Soils 1989, 8, 128–133. [Google Scholar]
- Baligar, V.C.; Wright, R.J.; Smedley, M.D. Acid phosphatase activity in soils of the appalachian region. Soil Sci. Soc. Am. J. 1988, 52, 1612. [Google Scholar] [CrossRef]
- Hoffmann, G.; Teicher, K. Ein kolorimetrisches verfahren zur bestimmung der ureaseaktivität in Böden. J. Plant Nutr. Soil Sci. 2010, 95, 55–63. [Google Scholar] [CrossRef]
- Johnson, J.L.; Temple, K.L. Some variables affecting the measurement of “catalase activity” in soil. Soil Sci. Soc. Am. J. 1964, 28, 207–209. [Google Scholar] [CrossRef]
- Hu, W.B.; Peng, C.; Luo, W.J.; Lv, M.; Li, X.M.; Li, D.; Huang, Q.; Fan, C.H. Graphene-based antibacterial paper. ACS Nano 2010, 4, 4317–4323. [Google Scholar] [CrossRef]
- Fan, H.L.; Hong, W.; Wu, C.Z.; Chen, C.; Li, J. Effects of water stress on the physiological indexes of carbon and nitrogen metabolization of Liriope muscari (Decne.) Bailey. J. Fujian Agric. For. Univ. (Nat. Sci. Ed.) 2012, 41, 454–458. (In Chinese) [Google Scholar]
- Liu, S.J. The Effects of Grephene on the Germination and Seeding Growth in Rice. Ph.D. Thesis, Yangtze University, Jingzhou, Hubei, China, 2013. (In Chinese). [Google Scholar]
- Liu, H.J.; Zhang, S.X.; Hu, X.N.; Chen, C.D. Phytotoxicity and oxidative stress effect of 1-octyl-3-methylimidazolium chloride ionic liquid on rice seedlings. Environ. Poll. 2013, 181, 242–249. [Google Scholar] [CrossRef]
- Hu, W.B.; Peng, C.; Lv, M.; Li, X.M.; Zhang, Y.J.; Chen, N.; Fan, C.H.; Huang, Q. Protein corona-mediated mitigation of cytotoxicity of graphene oxide. ACS Nano 2011, 5, 3693–3700. [Google Scholar] [CrossRef]
- Fu, L.F.; Li, M.L.; Qin, H.M.; Yin, H.; Mo, C.H. Effects of decabromodiphenyl ether on enzyme activities of two type soils. Soils 2014, 46, 689–696. (In Chinese) [Google Scholar]
- Guan, S.Y. Soil Enzyme and Its Research Methods; Agriculture Press: Beijing, China, 1986. (In Chinese) [Google Scholar]
- Zhang, C.; Chen, X.F.; Zhou, B.; Zhang, C.L.; Li, J.J.; Zhang, J.; Dai, J. Effects of vermicompost on microbial characteristics and enzyme activities in soil. Soils 2014, 46, 70–75. (In Chinese) [Google Scholar]
- Ahmed, F.; Rodrigues, D.F. Investigation of acute effects of graphene oxide on wastewater microbial community: A case study. J. Hazard. Mater. 2013, 256, 33–39. [Google Scholar] [CrossRef] [PubMed]
- Wang, Q.S.; Qi, X.C.; Shen, T.L.; Li, C.L. Effect of silver nanoparticles and graphene on soil microorganisms and enzyme activities. Acta Sci. Circum. 2017, 37, 3149–3157. (In Chinese) [Google Scholar]
Figure 1.
Growth vigor of L. olgensis seedlings at different concentrations of graphene for 30 (a) and 50 (b) days (from left to right, treated with 0 (Ck), 25, 50, 100, 250, and 500 mg L−1, respectively; dead seedlings in (b) were removed).
Figure 1.
Growth vigor of L. olgensis seedlings at different concentrations of graphene for 30 (a) and 50 (b) days (from left to right, treated with 0 (Ck), 25, 50, 100, 250, and 500 mg L−1, respectively; dead seedlings in (b) were removed).

Figure 2.
Dry masses of leaf (a), stem (b) and root (c) of L. olgensis seedlings at different concentrations of graphene. Values followed by the same letter for the same days are not significantly different at p < 0.05. Ck, T1, T2, T3, T4, and T5 represent 0, 25, 50, 100, 250, and 500 mg L−1 graphene treatments, respectively.

Figure 3.
Root morphology of L. olgensis fine roots with different concentrations of graphene (mean ± 1 S.D., n = 3). (a): length; (b) surface area;(c): volume; and (d): average diameter.
Figure 3.
Root morphology of L. olgensis fine roots with different concentrations of graphene (mean ± 1 S.D., n = 3). (a): length; (b) surface area;(c): volume; and (d): average diameter.

Figure 4.
Relative conductivity (a) and malondialdehyde (MDA) contents (b) of L. olgensis leaves treated with different concentrations of graphene (mean ± 1 S.D., n = 3). Values followed by the same letter for the same days are not significantly different at p < 0.05. Ck, T1, T2, T3, T4 and T5 represent 0, 25, 50, 100, 250, and 500 mg L−1 graphene treatments, respectively.

Figure 5.
Superoxide anion (a) and hydrogen peroxide (b) contents of L. olgensis leaves treated with different concentrations of graphene. Values followed by the same letter for the same days are not significantly different at p < 0.05. Ck, T1, T2, T3, T4, and T5 represent 0, 25, 50, 100, 250, and 500 mg L−1 graphene treatments, respectively.

Figure 6.
Peroxide (POD, a) and superoxide dismutase (SOD, b) activities of L. olgensis leaves treated with different concentrations of graphene at three sampling times (mean ± 1 S.D., n = 3). FW = fresh mass. Values followed by the same letter for the same days are not significantly different at p < 0.05. Ck, T1, T2, T3, T4 and T5 represent 0, 25, 50, 100, 250, and 500 mg L−1 graphene treatments, respectively.

Figure 7.
Soluble protein (a) and proline (b) contents of L. olgensis leaves with different graphene treatments (mean ± 1 S.D., n = 3). FW = fresh mass. Values followed by the same letter for the same days are not significantly different at p < 0.05. Ck, T1, T2, T3, T4, and T5 represent 0, 25, 50, 100, 250, and 500 mg L−1 graphene treatments, respectively.
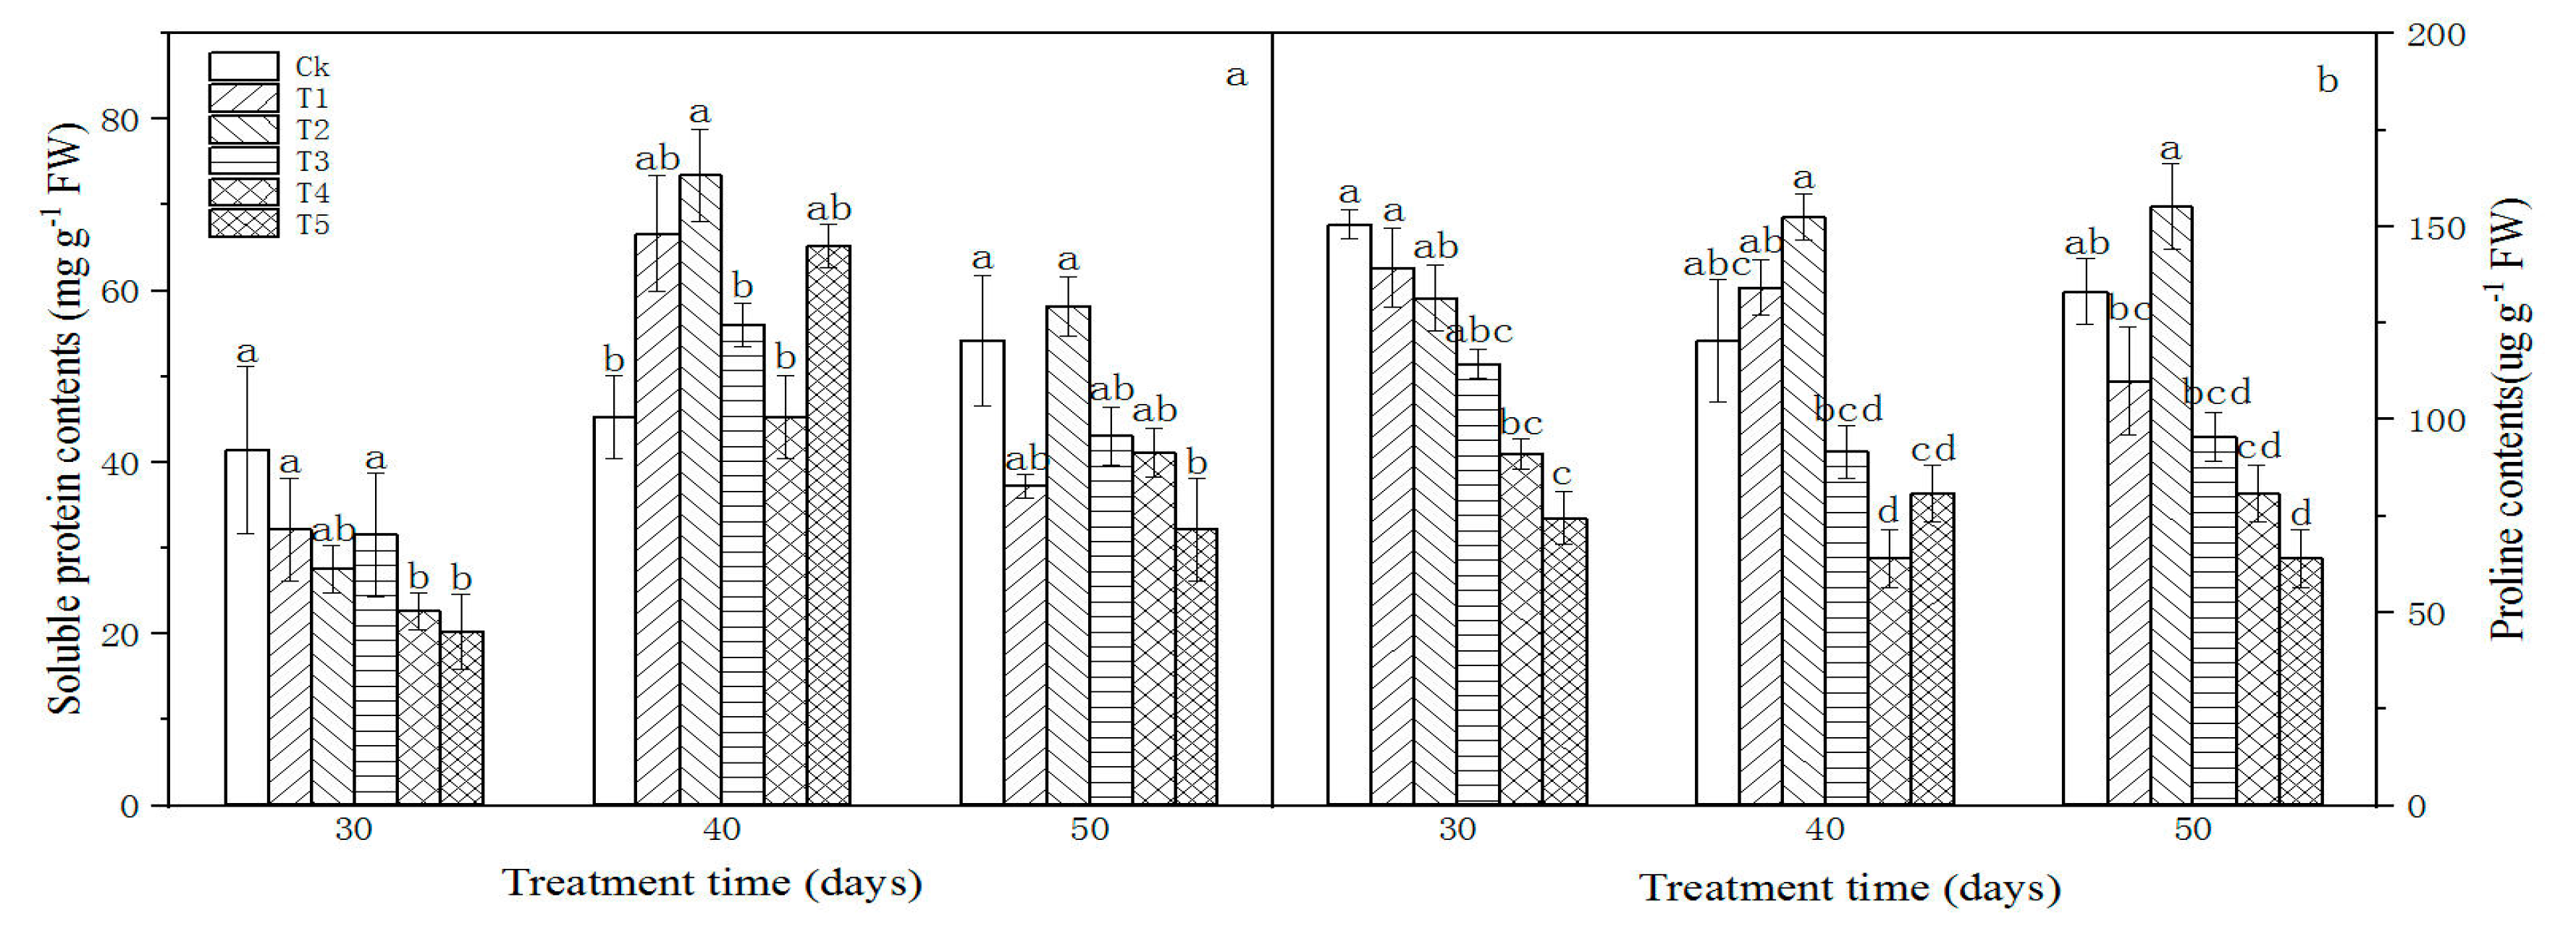
Figure 8.
Pigment contents of L. olgensis leaves with different graphene treatments (mean ± 1 S.D., n = 3). FW = fresh mass. Values followed by the same letter for the same days are not significantly different at p < 0.05. Ck, T1, T2, T3, T4, and T5 represent 0, 25, 50, 100, 250, and 500 mg L−1 graphene treatments, respectively. (a): carotenoid contents; (b): total chlorophyll contents.

Figure 9.
Soil chemical properties with different graphene treatments (mean ± 1 S.D., n = 3). Values followed by the same letter for the same days are not significantly different at p < 0.05. Ck, T1, T2, T3, T4, and T5 represent 0, 25, 50, 100, 250, and 500 mg L−1 graphene treatments, respectively. (a): organic matter contents; (b): hydrolytic nitrogen contents; (c): available phosphorus contents; and (d): available potassium contents.

Figure 10.
Soil enzyme activities with different graphene treatments (mean ± 1 S.D., n = 3). Values followed by the same letter for the same days are not significantly different at p < 0.05. Ck, T1, T2, T3, T4, and T5 represent 0, 25, 50, 100, 250, and 500 mg L−1 graphene treatments, respectively. (a): acid phosphatase activities; (b): urease activities; (c): dehydrogenase activities; and (d): catalase activities.
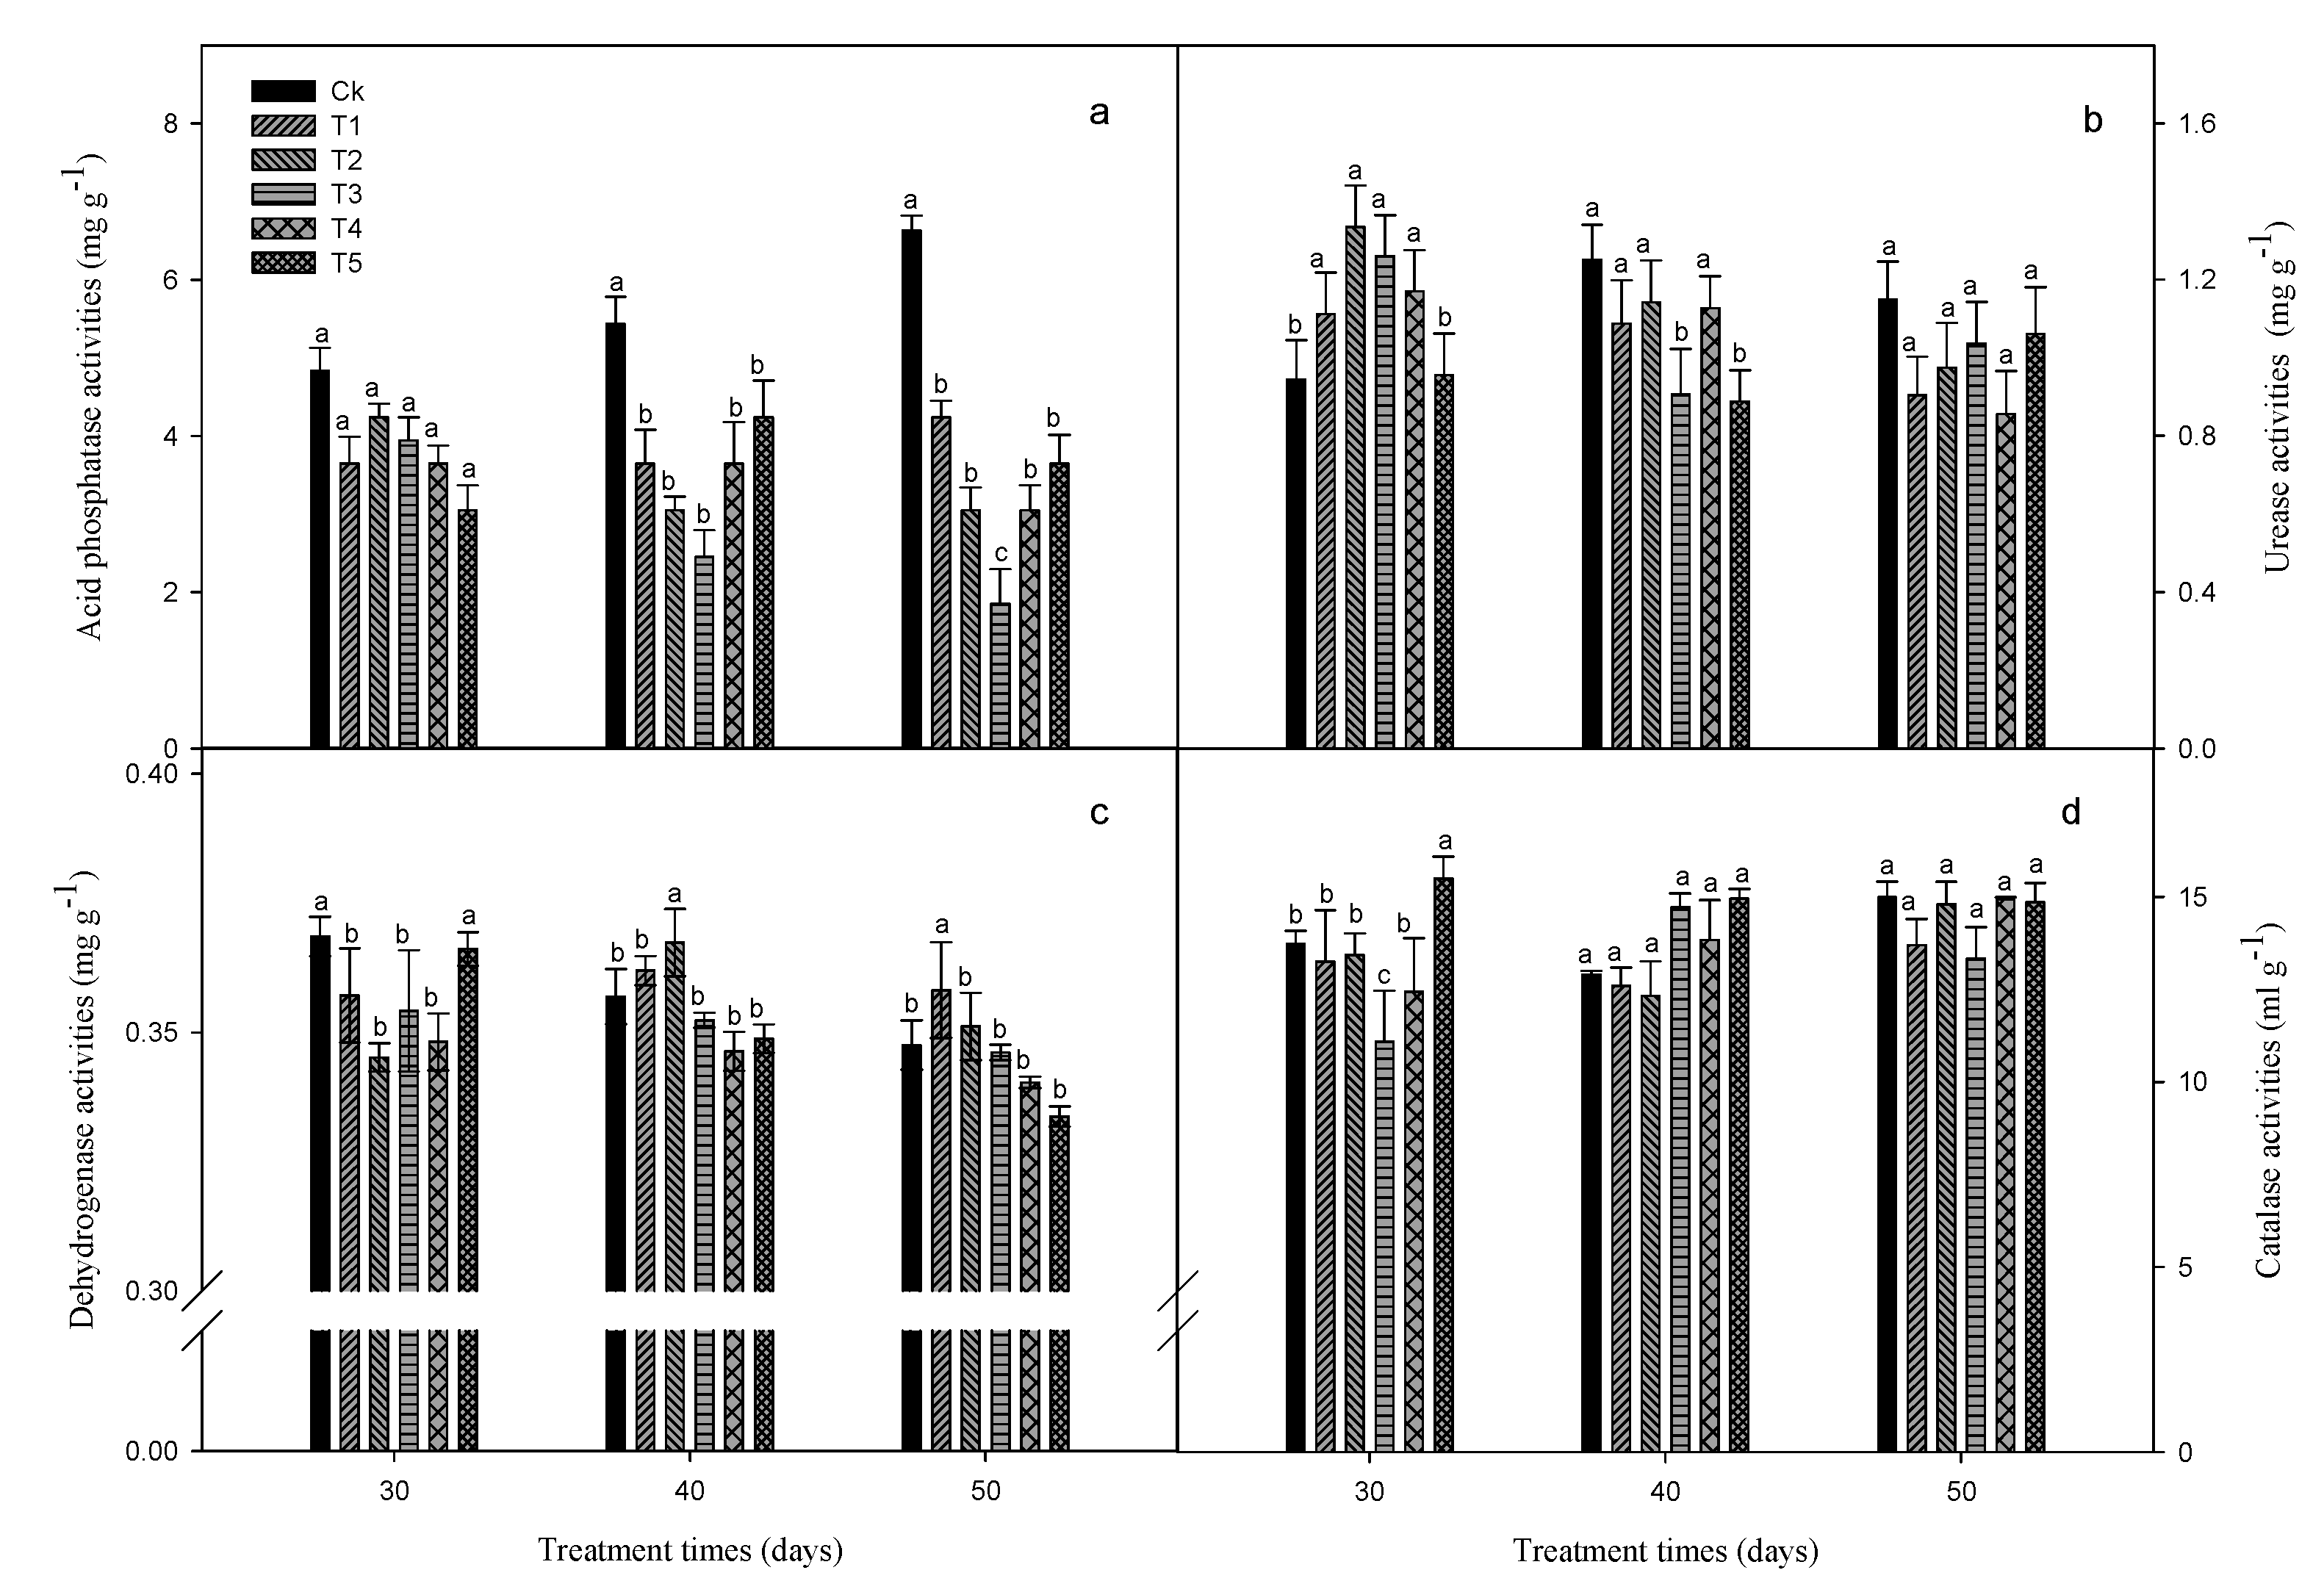
Figure 11.
Factor analyses of soil chemical properties and enzyme activities with different graphene treatments.
Figure 11.
Factor analyses of soil chemical properties and enzyme activities with different graphene treatments.


Table 1.
Selected properties of the A1 horizon of Haplic Cambisols used in the experiment (mean, n c = 3).
Table 1.
Selected properties of the A1 horizon of Haplic Cambisols used in the experiment (mean, n c = 3).
| Soil Horizon | pH (H2O) | CEC a (cmol kg−1)b | Organic Matter (g kg−1) | Hydrolytic N (mg kg−1) | Available P c (mg kg−1) | Available K (mg kg−1) | Soil Texture |
|---|---|---|---|---|---|---|---|
| A1 | 5.32 | 40.20 | 87.94 | 462.45 | 45.92 | 145.31 | loam |
a Cation exchange capacity; b Centimoles of cation charge per kg soil; c Extracted with 0.05 mol L−1 HCl–0.025 mol L−1 H2SO4; d According to United States Department of Agriculture Soil Classification.
Table 2.
The experimental layout. Each of the treatments below was determined after 30, 40, or 50 days.
Table 2.
The experimental layout. Each of the treatments below was determined after 30, 40, or 50 days.
| Treatment | Ck | T1 | T2 | T3 | T4 | T5 |
|---|---|---|---|---|---|---|
| Graphene concentration (mg·L−1) | 0 | 25 | 50 | 100 | 250 | 500 |
Table 3.
Pearson correlations of soil chemical properties with different graphene treatments. Organic matter content (OM), hydrolytic nitrogen content (HN), available phosphorus content (AP), available potassium content (AK), dehydrogenase activity (Dehy), catalase activity (Cata), urease activity (Urea), and acid phosphatase activity (Phos).
| OM | HN | AP | AK | Urea | Dehy | Cata | |
|---|---|---|---|---|---|---|---|
| HN | 0.651 ** | ||||||
| AP | 0.138 | 0.243 | |||||
| AK | 0.320 * | 0.355 ** | 0.377 * | ||||
| Urea | 0.115 | 0.216 * | −0.023 | −0.036 | |||
| Dehy | 0.122 | 0.212 | 0.307 * | 0.152 | −0.035 | ||
| Cata | −0.197 | −0.193 | −0.255 | −0.207 | 0.021 | −0.118 | |
| Phos | 0.563 ** | 0.550 ** | 0.181 | 0.347 * | 0.112 | 0.100 | −0.107 |
* p < 0.05; ** p < 0.01.
© 2020 by the authors. Licensee MDPI, Basel, Switzerland. This article is an open access article distributed under the terms and conditions of the Creative Commons Attribution (CC BY) license (http://creativecommons.org/licenses/by/4.0/).
Share and Cite
MDPI and ACS Style
Song, J.; Cao, K.; Duan, C.; Luo, N.; Cui, X. Effects of Graphene on Larix olgensis Seedlings and Soil Properties of Haplic Cambisols in Northeast China. Forests 2020, 11, 258. https://doi.org/10.3390/f11030258
AMA Style
Song J, Cao K, Duan C, Luo N, Cui X. Effects of Graphene on Larix olgensis Seedlings and Soil Properties of Haplic Cambisols in Northeast China. Forests. 2020; 11(3):258. https://doi.org/10.3390/f11030258
Chicago/Turabian StyleSong, Jinfeng, Kai Cao, Chengwei Duan, Na Luo, and Xiaoyang Cui. 2020. "Effects of Graphene on Larix olgensis Seedlings and Soil Properties of Haplic Cambisols in Northeast China" Forests 11, no. 3: 258. https://doi.org/10.3390/f11030258
Note that from the first issue of 2016, this journal uses article numbers instead of page numbers. See further details here.