Article

Aggregated Biomass Model Systems and Carbon Concentration Variations for Tree Carbon Quantification of Natural Mongolian Oak in Northeast China

1
Key Laboratory of Sustainable Forest Ecosystem Management-Ministry of Education, School of Forestry, Northeast Forestry University, Harbin 150040, Heilongjiang, China
2
Department of Sustainable Resources Management, State University of New York, College of Environmental Science and Forestry (SUNY-ESF), One Forestry Drive, Syracuse, NY 13210, USA
*
Author to whom correspondence should be addressed.
Forests 2020, 11(4), 397; https://doi.org/10.3390/f11040397
Submission received: 27 February 2020 / Revised: 23 March 2020 / Accepted: 31 March 2020 / Published: 2 April 2020
(This article belongs to the Section Forest Inventory, Modeling and Remote Sensing)

Abstract

:
Three systems of additive biomass models were developed and the effects of tree components, tree sizes, and tree growing regions on the carbon concentration were analyzed for Mongolian oak (Quercus mongolica Fisch. ex Ledeb.) in the natural forests of Northeastern China. The nonlinear seemingly unrelated regression (NSUR) method was used to fit each of the three systems simultaneously; namely, aggregated model systems with no parameter restriction (AMS0), aggregated model systems with one parameter restriction (AMS1), and aggregated model systems with three parameter restrictions (AMS3). A unique weighting function for each biomass model was applied to address the heteroscedasticity issue. The systems assertively guarantee the additivity property, in which, the summation of the respective predicted tree components (i.e., root, stem, branch, and foliage) will match the prediction of subtotals (i.e., crown and aboveground) and total biomass. Using one-, two-, and three-predictor combinations (i.e., D (diameter at breast height), D and H (total height), and D, H, and CL (crown length)) as the general model underlying formats, three systems of additive biomass model were developed. Our results indicate that (1) all of the aggregated model systems performed well and the differences between the systems were relatively small; (2) the rank order of the three systems based on an array of statistics are as follows: AMS0 > AMS1 > AMS3; (3) the carbon concentration significantly varied depending on the types of tree tissues and growing regions; (4) the regional respective component carbon concentration and regional weighted mean carbon concentration multiplied by observed biomass value appeared to be the best approach to calculate carbon stock.

1. Introduction

On a global scale, forests are known as one of the most dominant terrestrial ecosystems, covering 13 billion hectares or approximately 30.6% of the Earth’s total land area [1]. Forests contribute in the storage of a large amount of biomass and play an important role in maintaining atmospheric carbon balance on Earth [2]. Researchers have been facing a challenge for decades to enhance the accuracy of tree biomass and carbon estimations, which are crucial for understanding climate change, nutrient cycling, forest productivity, forest health, etc. [3,4,5]. Measuring the actual weight of each tree component is unquestionably known as the most precise approach for estimating tree biomass. However, it is time-consuming, costly, and destructive. Thus, developing allometric biomass equations is acknowledged as a greater alternative means to estimate forest biomass [6,7,8]. To date, a large number of allometric biomass models have been established for more than several hundreds of tree species in different ecological and geographical regions worldwide [9,10,11,12,13].
When developing biomass equations to estimate components, subtotals, and total biomass of an individual tree, there are two common traits as a result of applying the different approach in fitting the biomass data, which are well-known as non-additive and additive. The former model separately fit the component, subtotal, and total biomass data disregarding the intrinsic correlations between components from the same individuals [6,14,15]. Contrarily, the latter models simultaneously fit the component, subtotal, and total biomass data reflecting the intrinsic correlations between tree components of the same individuals. As a result, the subtotal or total biomass predictions will be equivalent to the summation of biomass component estimations [8,15,16]. Several parameter estimation techniques have been proposed by researchers to address the compatibility property for a system of biomass equations [6,17,18,19,20]. Among these methods, seemingly unrelated regression (SUR) and nonlinear seemingly unrelated regression (NSUR) appear to be more popular than others since they are more general and flexible in application [17,19,21,22,23,24].
To date, several model configurations have been developed in order to attain the additivity property between the component and subtotal or total biomass equations. Affleck and Diéguez-Aranda [25] introduced an aggregated model system (denoted as AMS0), in which a number of N tree component nonlinear biomass equations are fitted jointly without using any parameter restriction (i.e., aboveground or total biomass). This model structure appeared as an alternative to the previous approach proposed by Parresol [17]. Parresol’s approach also specifies a nonlinear biomass model for N tree components, and then aboveground or total biomass summation is defined as a parameter restriction in the aggregated model system (denoted as AMS1). Dong et al. [19] implemented another model structure that was mentioned and recommended by Parresol [17], in which the usage of parameter restriction is also necessary to ensure the additivity property between tree components. However, instead of using one parameter restriction, this aggregated model system (denoted as AMS3) employed three parameter restrictions defining the crown, aboveground, and total biomass as the summation of tree components. For the sake of comparison, here, these aggregated model systems are calculated by jointly fitting all N, N+1, and N+3 equations using weighted NSUR for AMS0, AMS1, and AMS3, respectively.
There are direct and indirect methods for determining the carbon stock of an individual tree. The direct method requires the carbon concentration to be measured initially by using the carbon analyzer to burn the tree samples [26,27]. Then, the obtained carbon concentration value can be utilized as the conversion factor to be multiplied by the actual dry biomass. On the contrary, the indirect method employs a generic carbon conversion factor multiplied by dry biomass value [28]. There are several generic carbon conversion factor values that have been accepted globally: (1) the general carbon concentration value of 0.50 and (2) 0.45 for both non-woody and woody components [29,30]. However, recent studies revealed that the carbon concentration varies within a range of 0.44–0.56 depending upon the biomass components and the tree species. Thus, approximately 10% bias would be generated if one is relying on 0.50 as a generic carbon conversion factor to estimate carbon stock [31,32,33]. Clearly, species-, component-, and even region-specific carbon concentration measurements are absolutely needed in order to decrease the inaccuracy of carbon stock quantification [34].
Mongolian oak (Quercus mongolica Fisch. ex Ledeb.) is a medium- to large-sized deciduous broadleaf tree species that is native to forested areas in eastern Asia and easternmost Russia. In China, it occupies the largest natural secondary forest regions, which is extensively distributed in the mountainous regions of Daxing’an, Xiaoxing’an, Zhangguangcai, and the northernmost end of the Changbai mountain area [35]. Wang [36] has developed the allometric equations of tree components, aboveground, and total biomass, and Zhang et al. [37] have examined the variations of carbon concentration in biomass tissues for Mongolian oak in northeast China. However, both of these studies used a relatively small sample size, and particularly the biomass models developed by Wang [36] were not additive. Therefore, the aims of this research were: (1) to construct three aggregated biomass model systems (i.e., AMS0, AMS2, and AMS3) with weighted NSUR based on different combinations of independent variables for Mongolian oak in northeast China; (2) to verify the predictive performance of the three systems using jackknifing techniques; (3) to evaluate six procedures of quantifying carbon stock of an individual tree; and (4) to compare the aggregated model systems developed in this study against the previously developed biomass equations.

2. Data and Methods

2.1. Data Collection

This research was undertaken in natural secondary forests located in Heilongjiang Province (from 121°11′ E to 135°05′ E and from 43°25′ N to 53°33′ N) and Jilin Province (from 121°38′ E to 131°19′ E and from 40°50′ N to 46°19′ N), the two largest provinces in Northeast China (Figure 1). This area encompasses five regions investigated in this study; namely, the Northern slope of Xiaoxing’an Mountain (XXMN), the Southern slope of Xiaoxing’an Mountain (XXMS), the Eastern slope of Zhangguangcai Mountain (ZGCME), the Western slope of Zhangguangcai Mountain (ZGCMW), and the Changbai Mountain regions (CBM). These regions are characterized as having a continental monsoon climate within the Dwa, Dwb, and Dwc categories of the Köppen-Geiger climate classification system, having dry winters along with hot, warm, and cold summers, respectively [38]. The soils are mostly either Eutroboralfs or Haplumbrepts across the five regions. The elevation, mean annual precipitation, and mean annual temperature varies from 300 to 1500 m above sea level, between 500 and 800 mm, and from −4 to +6 °C, respectively.
A total of 72 trees from natural secondary forests were destructively sampled to measure the following parameters: (1) tree basic variables such as four directional crown width (CW), diameter at breast height (D), the length of the live crown (CL) and the total tree height (H); (2) the actual fresh weight of the roots, stems, branches, and foliage; and (3) the moisture content and carbon concentration of the sampled roots, stems, branches, and foliage. Note that this study did not separately measure tree bark; thus, all of the stem weights and measurements were of trees not debarked. A detailed explanation of the determination of biomass and carbon concentration, including field and laboratory measurements, can be found in Dong et al. [7,39]. The summary statistics of all sampled trees are listed in Table 1.

2.2. Additive Biomass Models

2.2.1. Base Model

The allometry relationship between tree biomass components and several available predictors were primarily screened through visual inspection to ascertain whether or not each component biomass model could appropriately be developed as multivariate allometric equations (Figure 2).
In addition, the regional effect on biomass data for each tree component was tested by using a dummy variable method, and the difference was found to be insignificant. Thus, the effect of different tree growing regions was not considered. Nonlinear regression with an additive error term was determined as the general biomass equation defined as follows:
W i = e β i 0 X 1 β i 1 X 2 β i 2 X k β i k + ε i
where W i represent each biomass components in kg ( i = r for roots, s for stems, b for branches, and f for foliage); X j are several available predictors (j = 1, …, k), such as D , H , C W , and C L ; β i j are the model coefficients; ε i is the error term. Each of the tree component biomass equations were fitted using various candidate combinations of available predictor (i.e., D, H, CW, and CL). Then, three model fitting statistics were used to determine the “best model” based on different predictors for each component biomass equation: (i) Akaike information criterion (AIC), (ii) root mean squared error (RMSE), (iii) coefficient of determination ( R 2 ), and (iv) significance of model parameters. The model fitting statistics showed that the component biomass equations have different combinations of independent variable. Finally, we selected one-, two-, and three-independent variables as the underlying formats to develop three systems of additive biomass model.

2.2.2. Aggregated Model Systems

The component biomass data were required to be simultaneously fitted in order to elucidate the intrinsic correlations among component biomass of the same individuals. In this study, we proposed three different structural arrangements for the aggregated model systems, i.e., those with no parameter restriction (AMS0), those with one parameter restriction (AMS1), and those with three parameter restrictions (AMS3), as specified below:
  • Aggregated model systems with no parameter restriction
Referring to the model structure detailed in Affleck and Diéguez-Aranda [25], the structural system of AMS0 are as follows:
W r = e β r 0 X 1 β r 1 X 2 β r 2 X k β r k + ε r W s = e β s 0 X 1 β s 1 X 2 β s 2 X k β s k + ε s W b = e β b 0 X 1 β b 1 X 2 β b 2 X k β b k + ε b W f = e β f 0 X 1 β f 1 X 2 β f 2 X k β f k + ε f
where W r represents roots, W s refers to stems, W b refers to branches, and W f refers to foliage biomass. The other abbreviations were the same as in Equation (1).
  • Aggregated model systems with one parameter restriction
Referring to the model structure detailed in Parresol [17], the AMS1 ensures the additivity between tree component, subtotal, and total biomass with one parameter restriction, i.e., tree total biomass equals the summation of the whole tree component biomass. The structural system of AMS1 are given as follows:
W r = e β r 0 X 1 β r 1 X 2 β r 2 X k β r k + ε r W s = e β s 0 X 1 β s 1 X 2 β s 2 X k β s k + ε s W b = e β b 0 X 1 β b 1 X 2 β b 2 X k β b k + ε b W f = e β f 0 X 1 β f 1 X 2 β f 2 X k β f k + ε f W t = W r + W s + W b + W f + ε t
where W t represents total biomass. The other abbreviations were the same as in Equations (1) and (2).
  • Aggregated model systems with three parameter restrictions
Referring to another of Parresol’s [17] model structure, which has been applied in Dong et al. [19], the AMS3 ensures the additivity between the tree component and total biomass with three parameter restrictions, i.e., (1) tree crown biomass is equivalent to the summation of the branch and foliage biomass; (2) tree aboveground biomass is equivalent to the summation of the stem, branch, and foliage biomass; (3) tree total biomass is equivalent to the sum of the whole tree components biomass. The structural system of AMS3 are given as follows:
W r = e β r 0 X 1 β r 1 X 2 β r 2 X k β r k + ε r W s = e β s 0 X 1 β s 1 X 2 β s 2 X k β s k + ε s W b = e β b 0 X 1 β b 1 X 2 β b 2 X k β b k + ε b W f = e β f 0 X 1 β f 1 X 2 β f 2 X k β f k + ε f W c = W b + W f + ε c W a = W s + W b + W f + ε a W t = W r + W s + W b + W f + ε t
where W c and W a represent the crown and aboveground, respectively. The other abbreviations were the same as in Equations (1)–(3).

2.3. Weighting Function for Heteroscedasticity

Tree biomass data frequently exhibit heteroscedasticity in the model’s error variance. Hence, in the context of nonlinear regression, a weighting function must be specified for each biomass model in order to counter the problem. It is well known that the model residuals of the i th observation have a functional correlation with one or several combinations of predictors. Thus, a power function of σ i 2 = ( x i ) p was determined for the independent variables, where the power coefficient p can be obtained by iteratively using the error variance model of e i 2 = ( x i ) p , in which, e i is the unweighted (OLS) model residual. Two different formats of weight functions (i.e., x = D and x = D · H ) were compared, but the difference was not significant between them. Hence, p was determined for each biomass equation and 1 / D p was chosen to be the weighting function. The programming code of resid .   W i =   resid . W i / D p was specified by utilizing the PROC MODEL procedure [40] in order to homogenizes the residuals and improve the model fitting, as noted by Balboa-Murias et al. [41] and Dong et al. [19].

2.4. Model Assessment and Validation

As described above, the three candidate aggregated model systems based on different predictor variables were evaluated in this study. The biomass dataset (sample size n) was used in its entirely to establish the biomass equations. Meanwhile, the jackknifing technique was utilized to validate the model, in which the sample size of all-except-one observation (n – 1) was used to build the biomass models. Further, the fitted model was utilized to estimate the biomass value for the held-out observation. Five validation statistics of jackknifing were employed to calculate and compare the model performance: coefficient of determination ( R 2 ), root mean square error ( RMSE ), mean prediction error ( MPE ), mean absolute error ( MAE ) and mean absolute percent error ( MAPE ). These statistical analyses are summarized as
R 2 = 1 i = 1 n ( W i k W ^ i k ) 2 i = 1 n ( W i k W ¯ k ) 2
RMSE = i = 1 n ( W i k W ^ i k ) 2 n
MPE = i = 1 n ( W i k W ^ i k , i ) n
MAE = i = 1 n | W i k W ^ i k , i | n
MAPE = i = 1 n | ( W i k W ^ i k , i ) / W i k | n × 100
where W i k , W ^ i k , and W ¯ are the observed, predicted, and average biomass, respectively, of the i th sample tree from the k components (k = r for roots, s for stems, b for branches, and f for foliage), which were fitted by using all of the n observations; W ^ i k , i is the predicted value of the model which was fitted by using n – 1 observations.

2.5. Effects of Tree Size, Region, and Component

To investigate the effect of tree sizes (D), growing regions, and tree components on the variation of carbon concentration, multi-factor analysis of variance (ANOVA) through a general linear model was utilized. The model form can be written as follows:
y i j k = μ + α i + β j + γ k + ( α β ) i j + ( α γ ) i k + ( β γ ) j k + ( α β γ ) i j k + ε i j k
where y i j k represents the value of observed carbon concentration, μis the average value, α i is the effect of the i th tree D on y i j k , β j is the effect of the j th region on y i j k , γ k is the effect of the k th tree component on y i j k , ( α β ) i j and ( α γ ) i k represent the interaction effect between tree D with growing region and tree component, respectively, ( β γ ) j k is the interaction effect between region and components, ( α β γ ) i j k presents the interaction effect among the three variables, and ε i j k is the expression of error. The statistical analysis system (SAS) software [40] was used for analyses, utilizing the PROC GLM procedure to investigate the variation in carbon concentration.

2.6. Tree Carbon Quantifications

Six alternative procedures to quantify respective components, subtotals, and total carbon stock values were evaluated. Since each individual tree component has a different carbon concentration, it is undoubtedly very complex to always define the value of carbon stock by only relying on it. Once the carbon stock quantification for each tree component was obtained, they were aggregated to produce the subtotal and total carbon stock for a particular individual tree.
  • Regional respective component carbon concentration (RRCCc): This procedure multiplied the observed biomass value ( W i ) of each component by the respective component carbon concentration for each region. Further, the carbon stock of an individual tree was obtained by summing the component estimates.
  • Regional weighted mean carbon concentration (RWMCc): In this procedure, each of the observed component biomass values ( W i ) were multiplied by the weighted mean carbon concentration for each region. The weighted mean carbon concentration was measured as follows:
    W C j = i = 1 4 C i j × B i j
    where WC is the weighted mean carbon concentration for the jth region, and C i j and B i j are the measured carbon concentration and the relative proportion to total biomass partitioning for the i th component within the j th region, respectively.
  • Respective component mean carbon concentration (RCMCc): This procedure multiplied the observed biomass value ( W i ) of each component by the respective component mean carbon concentration regardless of the region for all sampled trees and subtotaling and totaling carbon stocks by summing respective components.
  • Total weighted mean carbon concentration (TWMCc): This procedure multiplied each component observed biomass value ( W i ) by the total weighted mean carbon concentration of all sample data. The weighted calculation was similar with the RWMCc procedure but disregarded region. Hence, the carbon stock of the subtotal and total individual tree was acquired by the summation of each component’s carbon stock.
  • Generic carbon concentration conversion factor 1 (GCCCf-1): This procedure multiplied the observed biomass value ( W i ) of each component by a generic carbon concentration conversion factor of 0.45.
  • Generic carbon concentration conversion factor 2 (GCCCf-2): This procedure resembles GCCCf-1 instead employing the generic carbon concentration conversion factor of 0.50 for tree components to quantify the carbon stock of an individual tree.
In order to identify the best and most reliable carbon stock quantification method, we conducted a comparison between the six procedures. The absolute relative error (RE) measured respective biases of carbon stock quantification procedures, computed as
R E ( % ) = = 1 N O c i Q c i O c i × 100 % N
where O c i and   Q c i are the i th observed value of carbon stock calculated by multiplying the specific component biomass with its respective carbon concentration and the value of carbon stock quantified by six different procedures for the i th sampled tree, respectively; N represents the total sample size of carbon stock quantification data (i.e., N = 64).

3. Results

3.1. Variation of Carbon Concentration

The average, minimum, maximum, and standard deviation of the carbon concentration values for each sampled tree components and RWMCC values from five different regions are given in Table 2. The carbon concentrations found in Mongolian oak were highly varied; values per tree ranged from 0.3949 to 0.5207 across whole components and regions. The highest carbon concentration of tree components for all regions was found in foliage (varying from 0.4293 to 0.5207), whereas the lowest carbon concentration was varied between roots (regions XXMN and XXMS) and branch (regions ZGCME, ZGCMW and CBM). In total, carbon concentration in each component can be ranked as follows: foliage > stem > branch > root. XXMS had the highest RWMCC with the amount of 0.4747 ± 0.0102 (mean ± standard deviation), while ZGCME had the lowest RWMCC with the amount of 0.4349 ± 0.0095. The types of tree components and growing regions were proven to significantly affect the carbon concentration at the 5% threshold, while tree sizes (D) had no such significant effect (Table 3). This result indicates, at least in our sampled data, that tree diameter at breast height does not significantly affect tree carbon concentration. Moreover, our findings were strengthened by the multiple comparison tests (employing Tukey–Kramer adjustment method), demonstrated by diffograms (Figure 3).

3.2. Aggregated Model Systems and Validation of Models

The estimated parameters and jackknifing validations for the AMS0, AMS1, and AMS3 based on D only, combination of D and H, and combination of D, H, and CL are shown in Table 4, Table 5 and Table 6, respectively. CW was found to give insignificant improvement as a predictor in all tree component equations; thus, it was excluded from our models. Preliminary inspection showed that adding H into the root and branch equations, along with the insertion of CL into the stem equation would not significantly improve the model fitting. Hence, D was used as the sole predictor for root and branch biomass models (Table 4, Table 5 and Table 6), the combination of D and H were used as predictors for the stem (Table 5 and Table 6) and foliage biomass models (Table 5), and the complete set of predictors (D, H, and CL) were used in the foliage biomass models (Table 6).
D was unquestionably a major predictor of biomass for the three aggregative model systems. The regular D model itself accounted for ≥93%, ≥95%, ≥96%, and ≥98% of variation in foliage, root, stem, and all (branch, crown, aboveground, and total) biomass, respectively (Table 4). The insertion of H into both of the stem and foliage biomass models enhanced the model fitting performance quality of the stem, aboveground, and total models as a consequence of smaller RMSE, MPE, MAE, and MAPE (Table 5, Figure 4A,B), while the inclusion of CL into the foliage biomass models only gave a slight improvement for the model fitting of the foliage and crown biomass models (Table 6 and Figure 4C).
The parameter estimations of D ( β i 1 ) were positive in all biomass component equations, whereas the parameter estimations of H ( β i 2 ) were found to be positive in all except for the foliage component (Table 5 and Table 6). The positive value of parameter estimations of D and H in stem biomass models implicated their positive relationship, in which, for the same amount of D, tree stem biomass increased with increasing tree height. The positive parameter estimations of D but negative parameter estimations of H in the foliage component indicated that an increase in D would increase foliage biomass. In contrast, increasing tree height would decrease foliage biomass for the same value of D.
In the present study, three systems of aggregative biomass models have been developed for Mongolian oak in natural forests in Northeast China. Each biomass component equation was jointly fitted by weighted NSUR, and the weighting functions were D3.4640, D2.6952, D3.6937, D2.2455, D4.7602, D3.1438, and D2.8621 for root, stem, branch, foliage, crown, aboveground, and total biomass, respectively. Slight differences occurred among the parameter estimation values of AMS0, AMS1, and AMS3, and the majority of the SEs for AMS3 were lower than either AMS1 or AMS0 (Table 4, Table 5 and Table 6). The validation statistics suggested that AMS0, AMS1 and AMS3 had very close values of R2, RMSE, MAE and MAPE for predicting component, subtotal, and total biomass. However, the AMS0 yielded smaller MPE than the other two aggregative biomass modeling approaches. Hence, the MPE, MAE, and MAPE across diameter classes were visualized in order to enhance the quality of validating tree biomass models (Figure 4). Results show that the three aggregative systems based on D, D and H, and D, H, and CL fitted well for the subtotals and total biomass for Mongolian oak. Further, AMS0 performed slightly better than AMS1 and AMS3 for most diameter classes, except for the largest diameter classes (D > 30 cm) in which AMS3 appears to give better predictions.

3.3. Comparison of Biomass Models

In the present study, we compared our locally developed equations both based on (1) D, and (2) D and H with the previously developed allometry formulas for Mongolian oak from China State Forestry Administration (SFA [42]) and Wang [36] (Figure 5). The relationship between observed and predicted biomass was analyzed for all categories (i.e., root, stem, branch, foliage, crown, aboveground, and total biomass). Both of the SFA [42] and Wang [36] biomass models were correlated with higher prediction errors compared with the models developed in the present study, verified by quantified measures of relative error (RE) and root mean square error (RMSE). The SFA’s equations hugely overestimated branch, foliage, and crown equations by as much as 73.13%, 36.37%, and 58.91% for the D models, and 65.73%, 28.35%, and 51.97% for the D and H models, respectively, while Wang’s [36] equations gave a notable underestimation on the root, branch, and crown biomass—as much as 7.14%, 12.50%, and 12.84% (Figure 5), respectively. More importantly, the present study yielded smaller RMSE values in most categories for both D and D and H biomass equations than did the other two previous studies. Finally, some notably large RMSE values occurred in four categories for the D models of the earlier studies: namely RMSE for SFA [42] equations were as much as 14.45, 14.52, 31.15 and 33.40 for branch, crown, aboveground, and total biomass, respectively, and respectively, 19.37, 19.94, 26.24, and 35.32 for the Wang [36] equations, while the present study equations yielded just 6.74, 7.50, 22.56, and 24.63, respectively (all units written in kg).

3.4. Comparison of Tree Carbon Quantification Methods

The RE was computed for comparing the quantification of tree components, subtotals, and total carbon stocks using the six different procedures (Figure 6). Apart from foliage, the result indicates that there were three distinct strata of RE formed in each category (component, subtotal and total). RRCCc and RWMCc appeared to be the best methods with the smallest error and deserved to be called as the first stratum. Subsequently, three methods followed as the second stratum, namely, RCMCc, TWMCc, and GCCCf-1. GCCCf-2 was found as the third stratum for having the biggest error and undeniably appearing as the worst method. The average RE of all categories combined for the first, second, and third stratum was 3.01 ± 0.18%, 4.08 ± 0.09%, and 10.57%, respectively. Overall, the six approaches for quantifying carbon stock can be ranked based on the relative error value as follows: RRCCc < RWMCc < RCMCc < TWMCc < GCCCf-1 < GCCCf-2.

4. Discussion

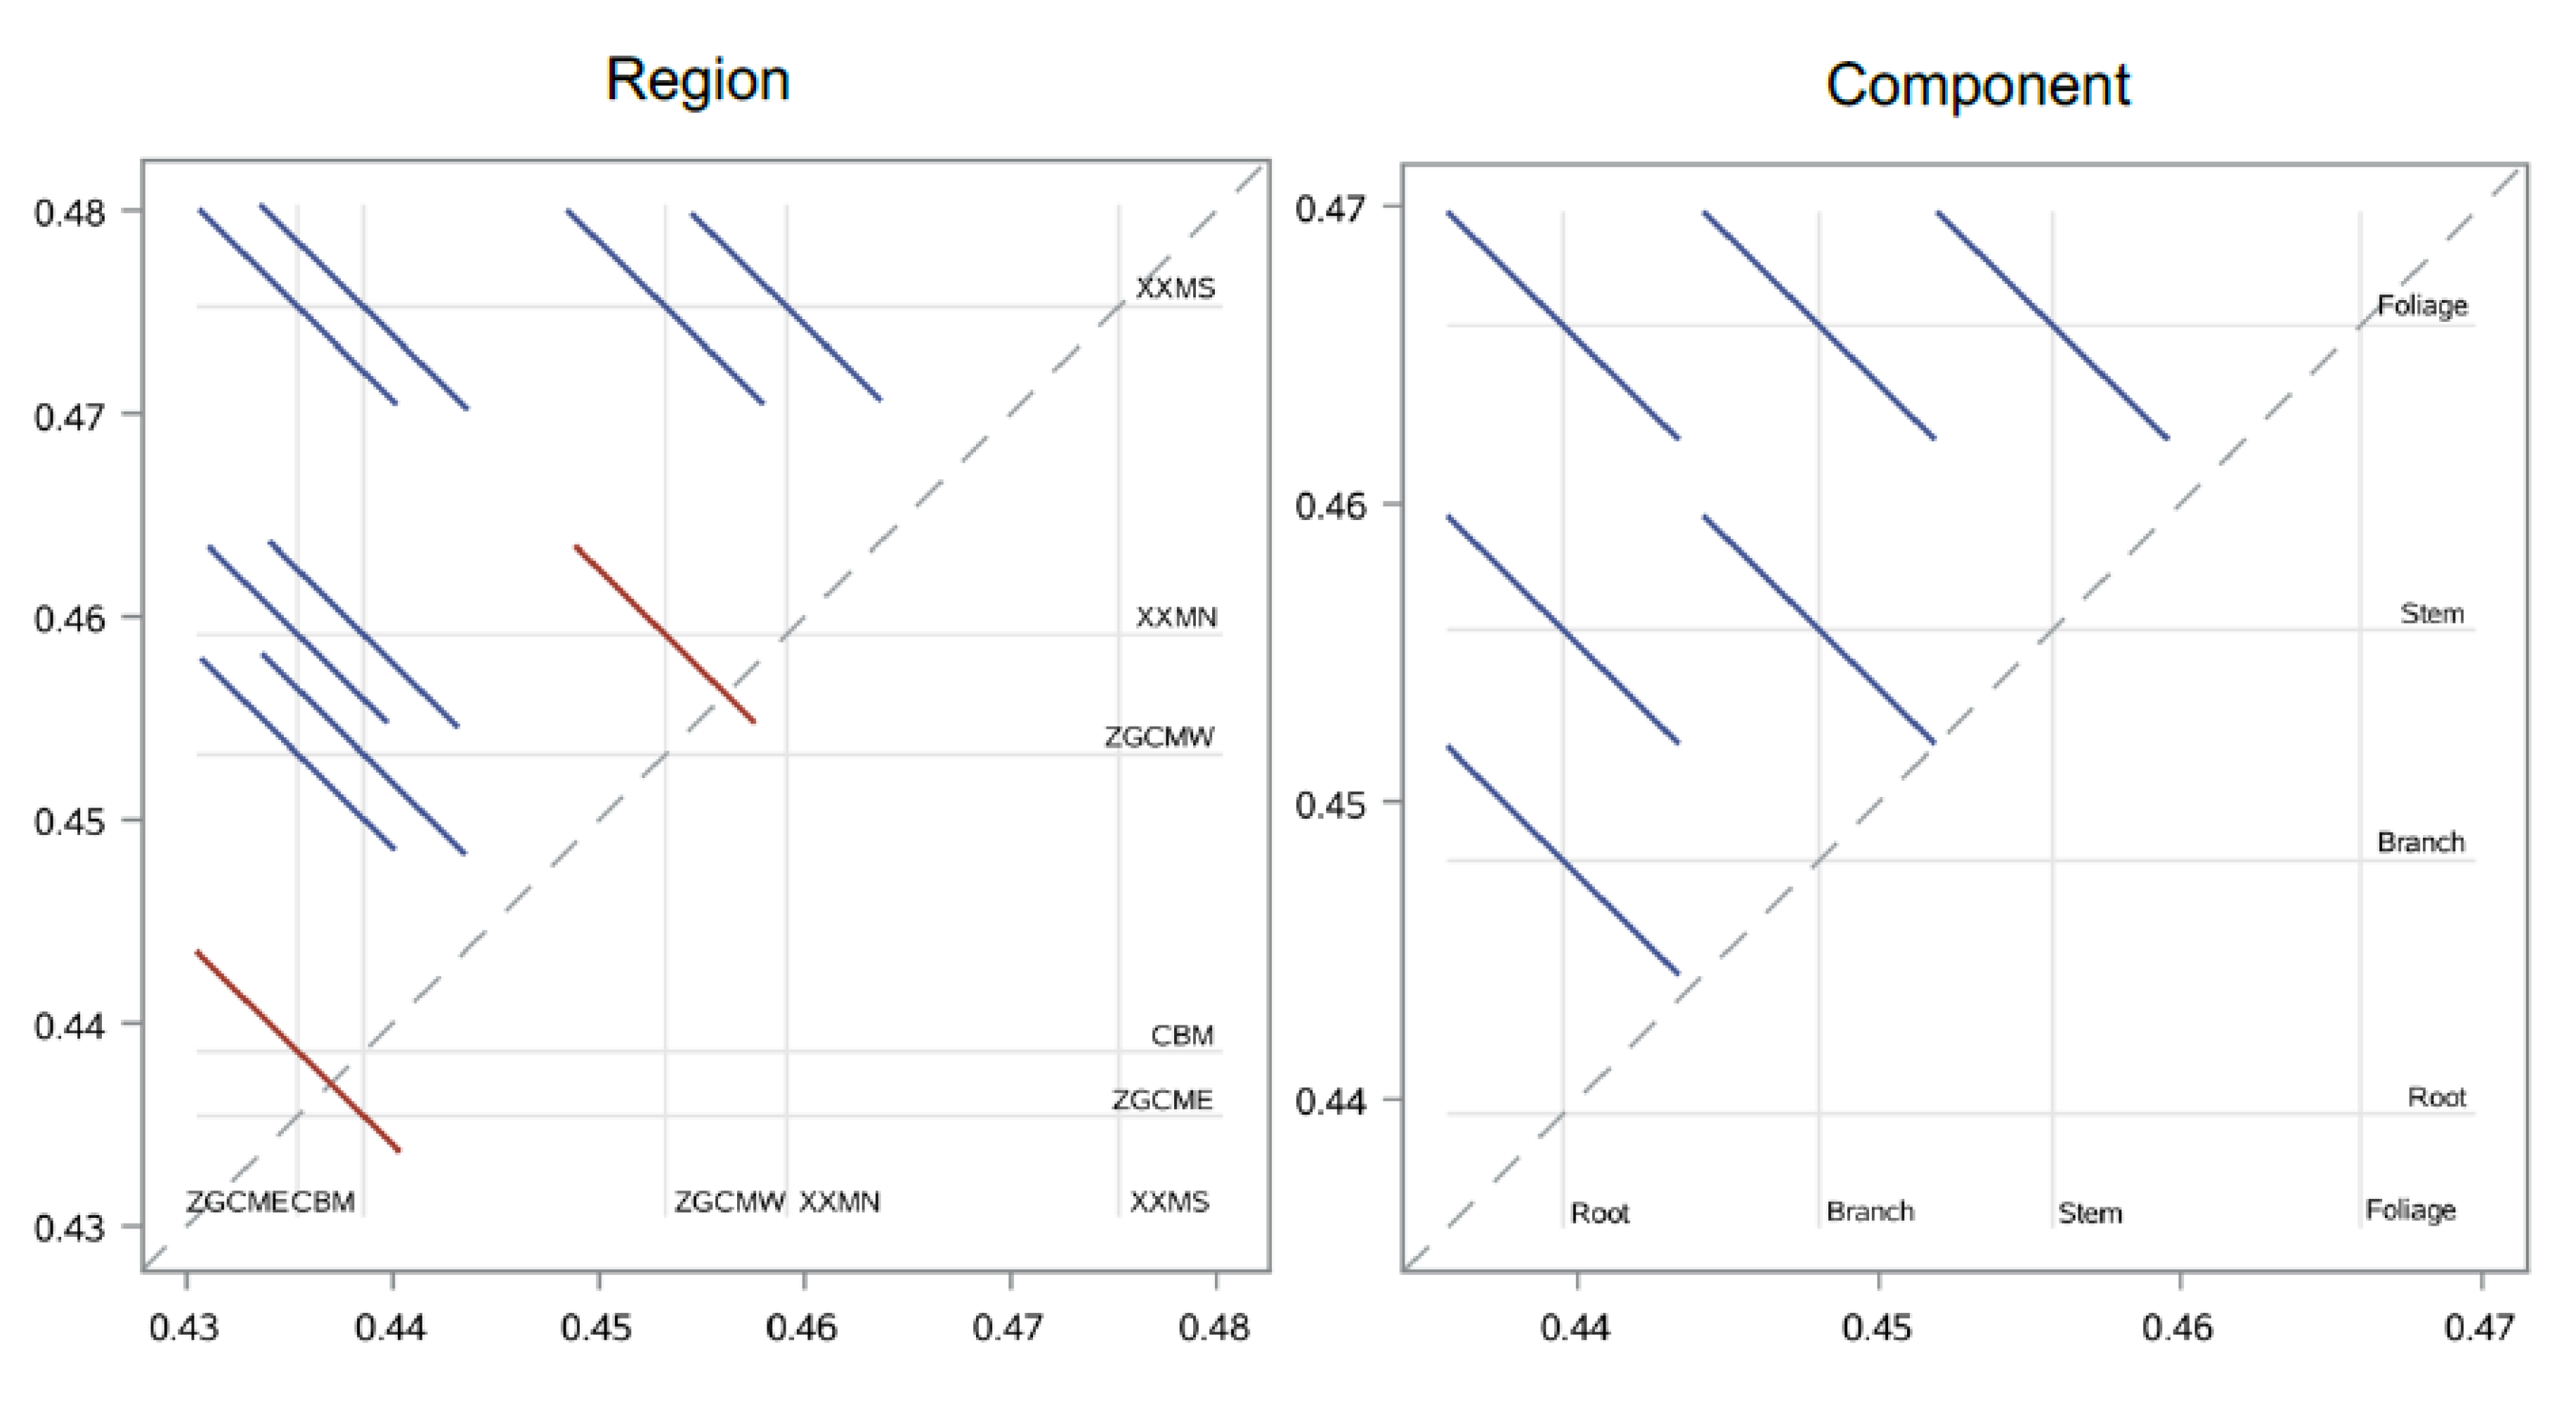
In the present study, the development of biomass allometric models and the analysis of carbon concentrations were based on a set of data having a broad range of tree diameters and a wide geographic coverage, allowing estimations to be more precise. Specifically, this comprehensive sampling strategy enabled the effects of various tree components on carbon concentrations of Q. mongolica in five different growing regions, along with their variation within tree sizes, to be thoroughly and duly scrutinized. Carbon concentrations were found to be significantly different within tree components and tree-growing regions, ranging from 0.4194 ± 0.0171 in the root of ZGCME region to 0.4858 ± 0.0177 in the foliage of XXMS region. This finding is in accordance with those that have been reported elsewhere in the literature, which show significant differences in carbon concentration in components of the balsam fir in Canada [43], 10 Chinese temperate tree species in northeast China [37], and eight subtropical tree species in southern China [44]. Moreover, Rodríguez-Soalleiro et al. [34] confirmed the importance of biomass components and tree species as the source of variation in carbon concentration of several broadleaved species, which were found to explain about 52% and 17% of the variance, respectively. Overall, carbon concentration was found highest in foliage (0.4670), lowest in root (0.4406), and slightly lower in branches (0.4491) than stem (0.4568). Thomas and Malczewski [26] and Zhang et al. [37] studied the carbon content of the same specific species in northeast China. Thomas and Malczewski [26] focused on analyzing the stem wood carbon content, while Zhang et al. [37] reported the carbon content in all tree components. By comparison, the total range of carbon concentration across whole components in this study was figured to be more stable and narrower than reported by Zhang et al. [37] (0.4620–0.5140), and the stem carbon concentration in this study was about 4% smaller than Thomas and Malczewski [26].
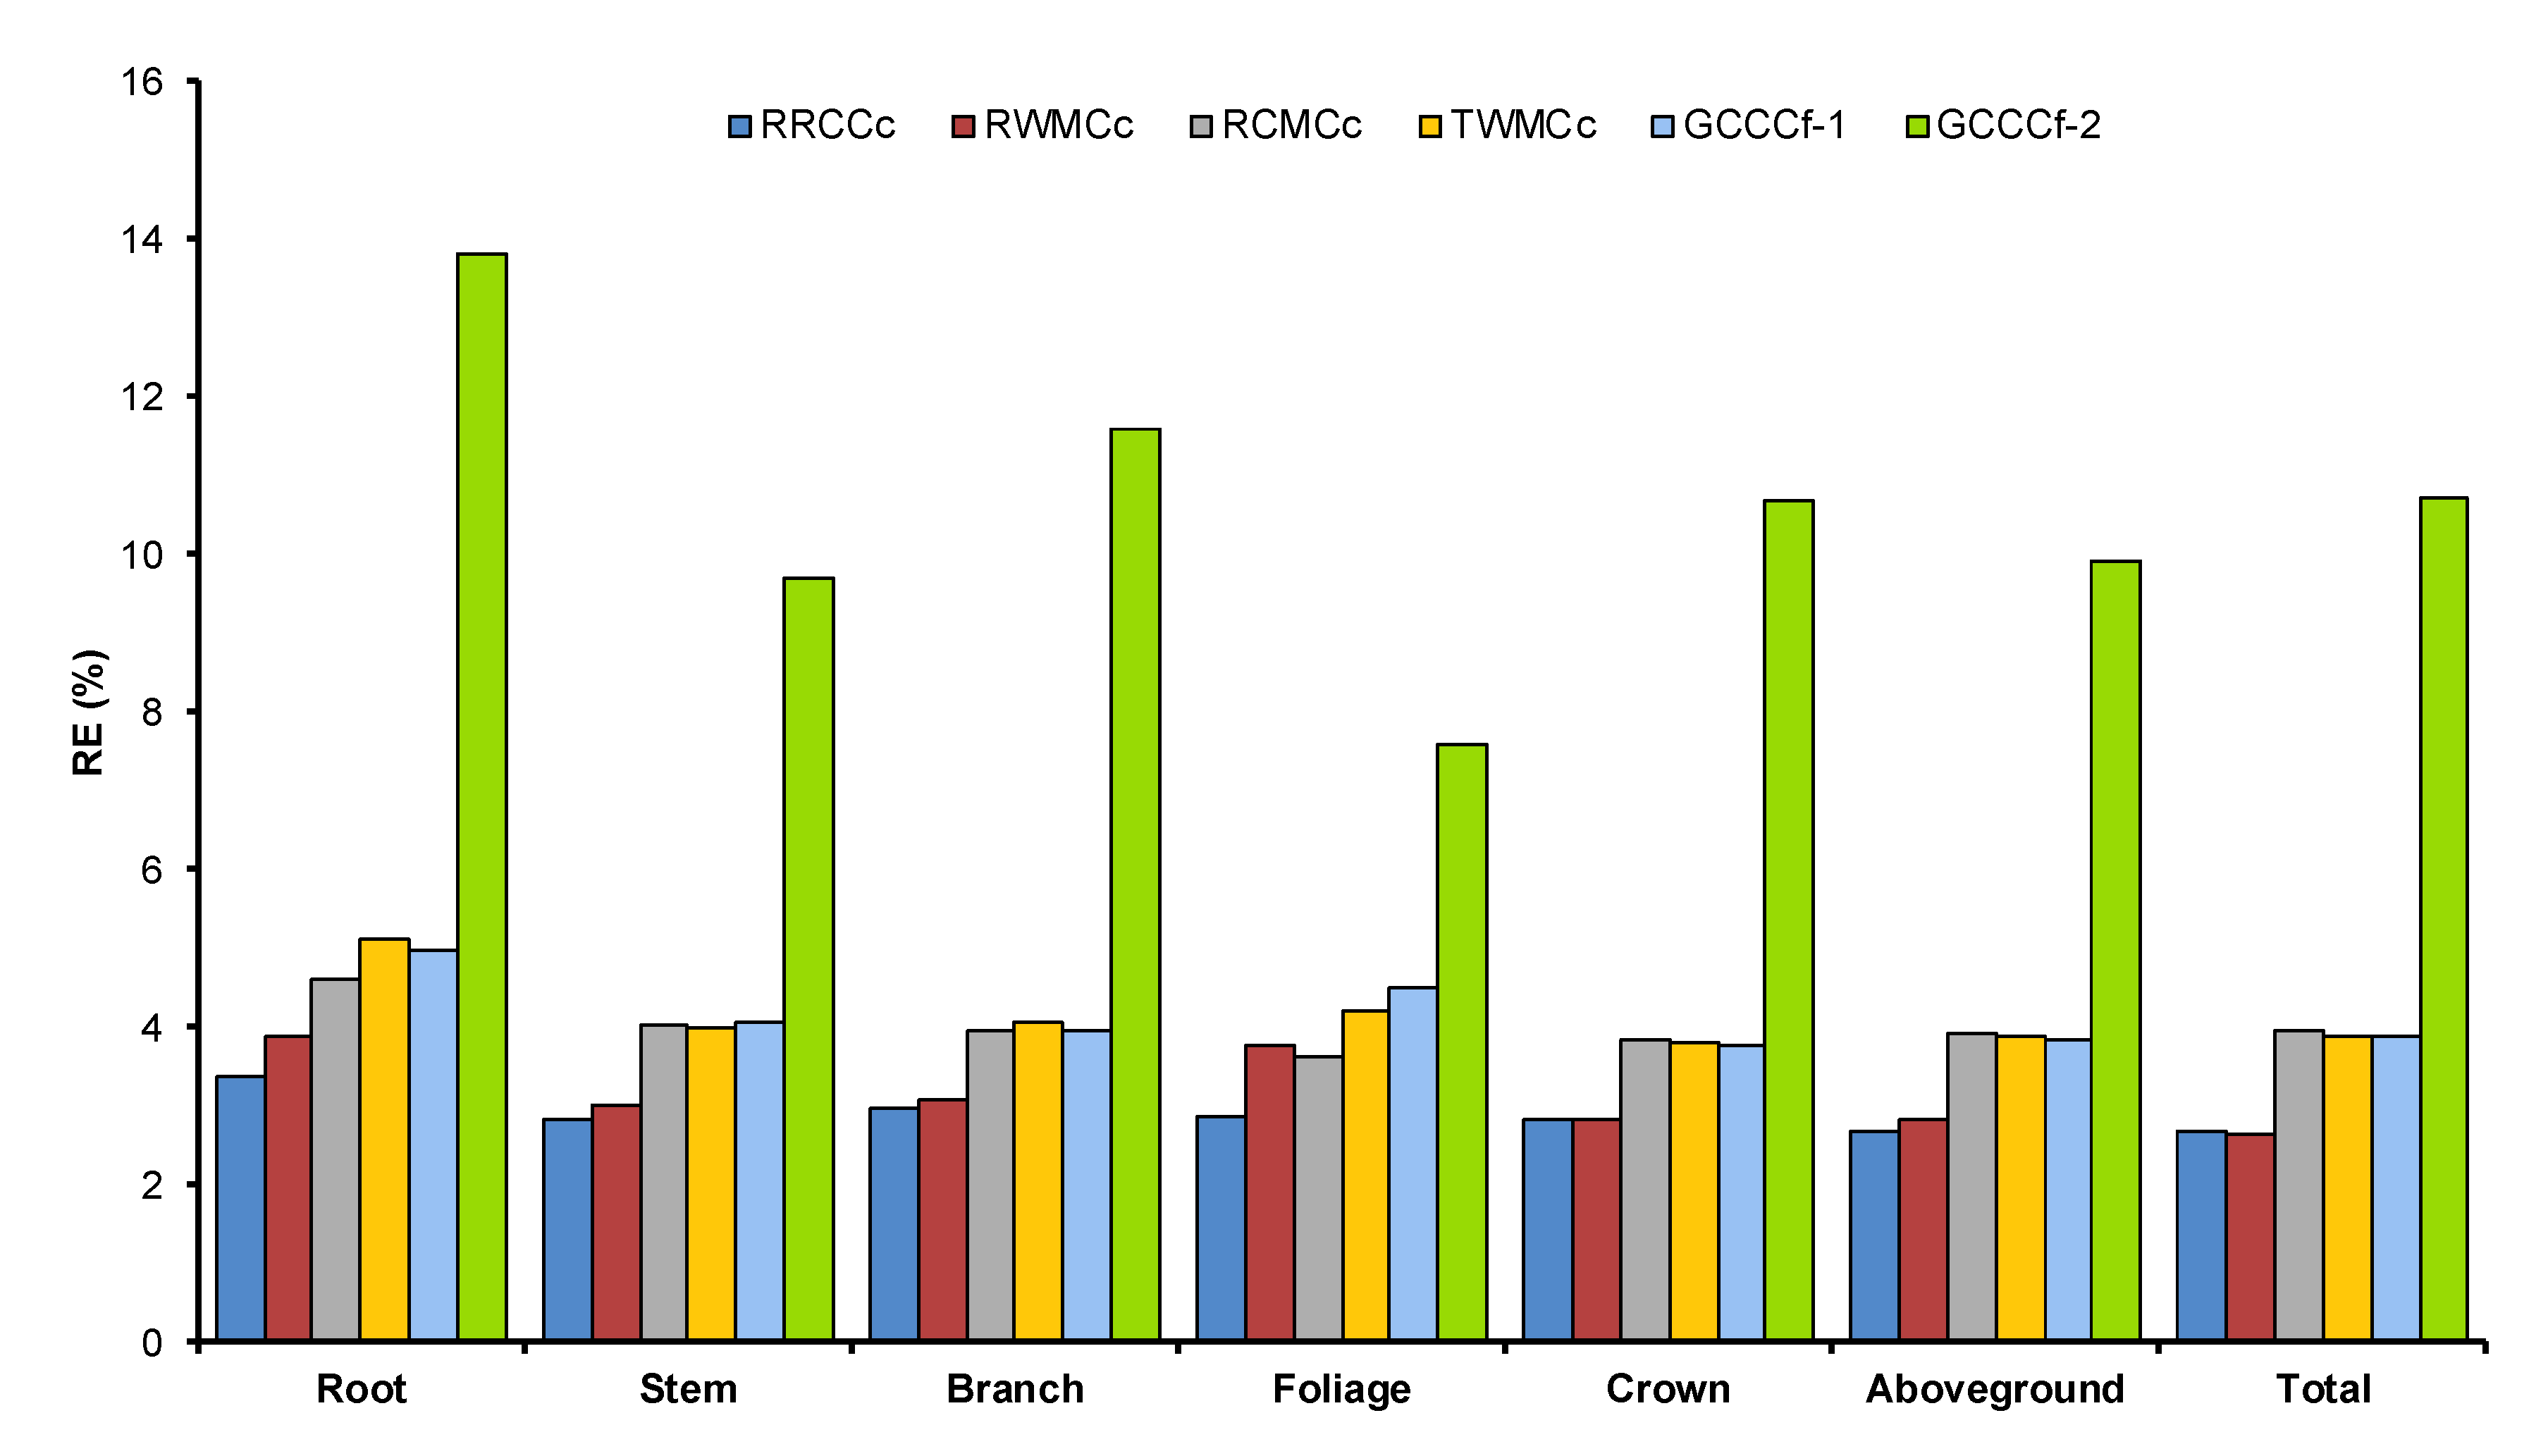
To date, there are two completely opposing ways to calculate carbon stocks. Some researchers have used a constant generic 0.50 carbon concentration value to be multiplied by a biomass value [45,46,47], in line with the recommendation of Roy et al. [48] and Wenzl [49]. On the contrary, some authors prefer to multiply the biomass value with the total weighted mean carbon concentration (TWMCc) of an individual tree [50,51], while others prefer to used respective mean component carbon concentration (RMCCc) as a multiplying factor to obtain carbon stock estimates [52]. These second forms of approaches are considered a better approach since many studies have reported that carbon concentration varies greatly depending upon the type of tree species and tissues [37,53]. Accordingly, using a generic carbon concentration conversion factor (0.50) may cause serious errors in estimating carbon stock. In the current study, six different alternative procedures of quantifying carbon stock were tested for Mongolian oak. The regional respective component carbon concentration (RRCCc) was the best procedure to estimate the carbon stock of an individual tree though implementing the RRCCc requires the comprehensive data of carbon concentration according to the tissue types and specific growing region. Hence, we propose the usage of a regional weighted mean carbon concentration (RWMCc) procedure as an appropriate alternative approach to quantify carbon stock, which performed equally as well as RRCCc. Our result evidence that employing RWMCc will only give 0.25% higher relative error compared with RRCCc. Our data and analyses firmly recommend against utilizing the generic carbon concentration proportion of 0.50 for Mongolian oak as it will likely lead to significant biases in yielding carbon stock estimation, just as it has been reported in other studies for other tree species [28,32,39].
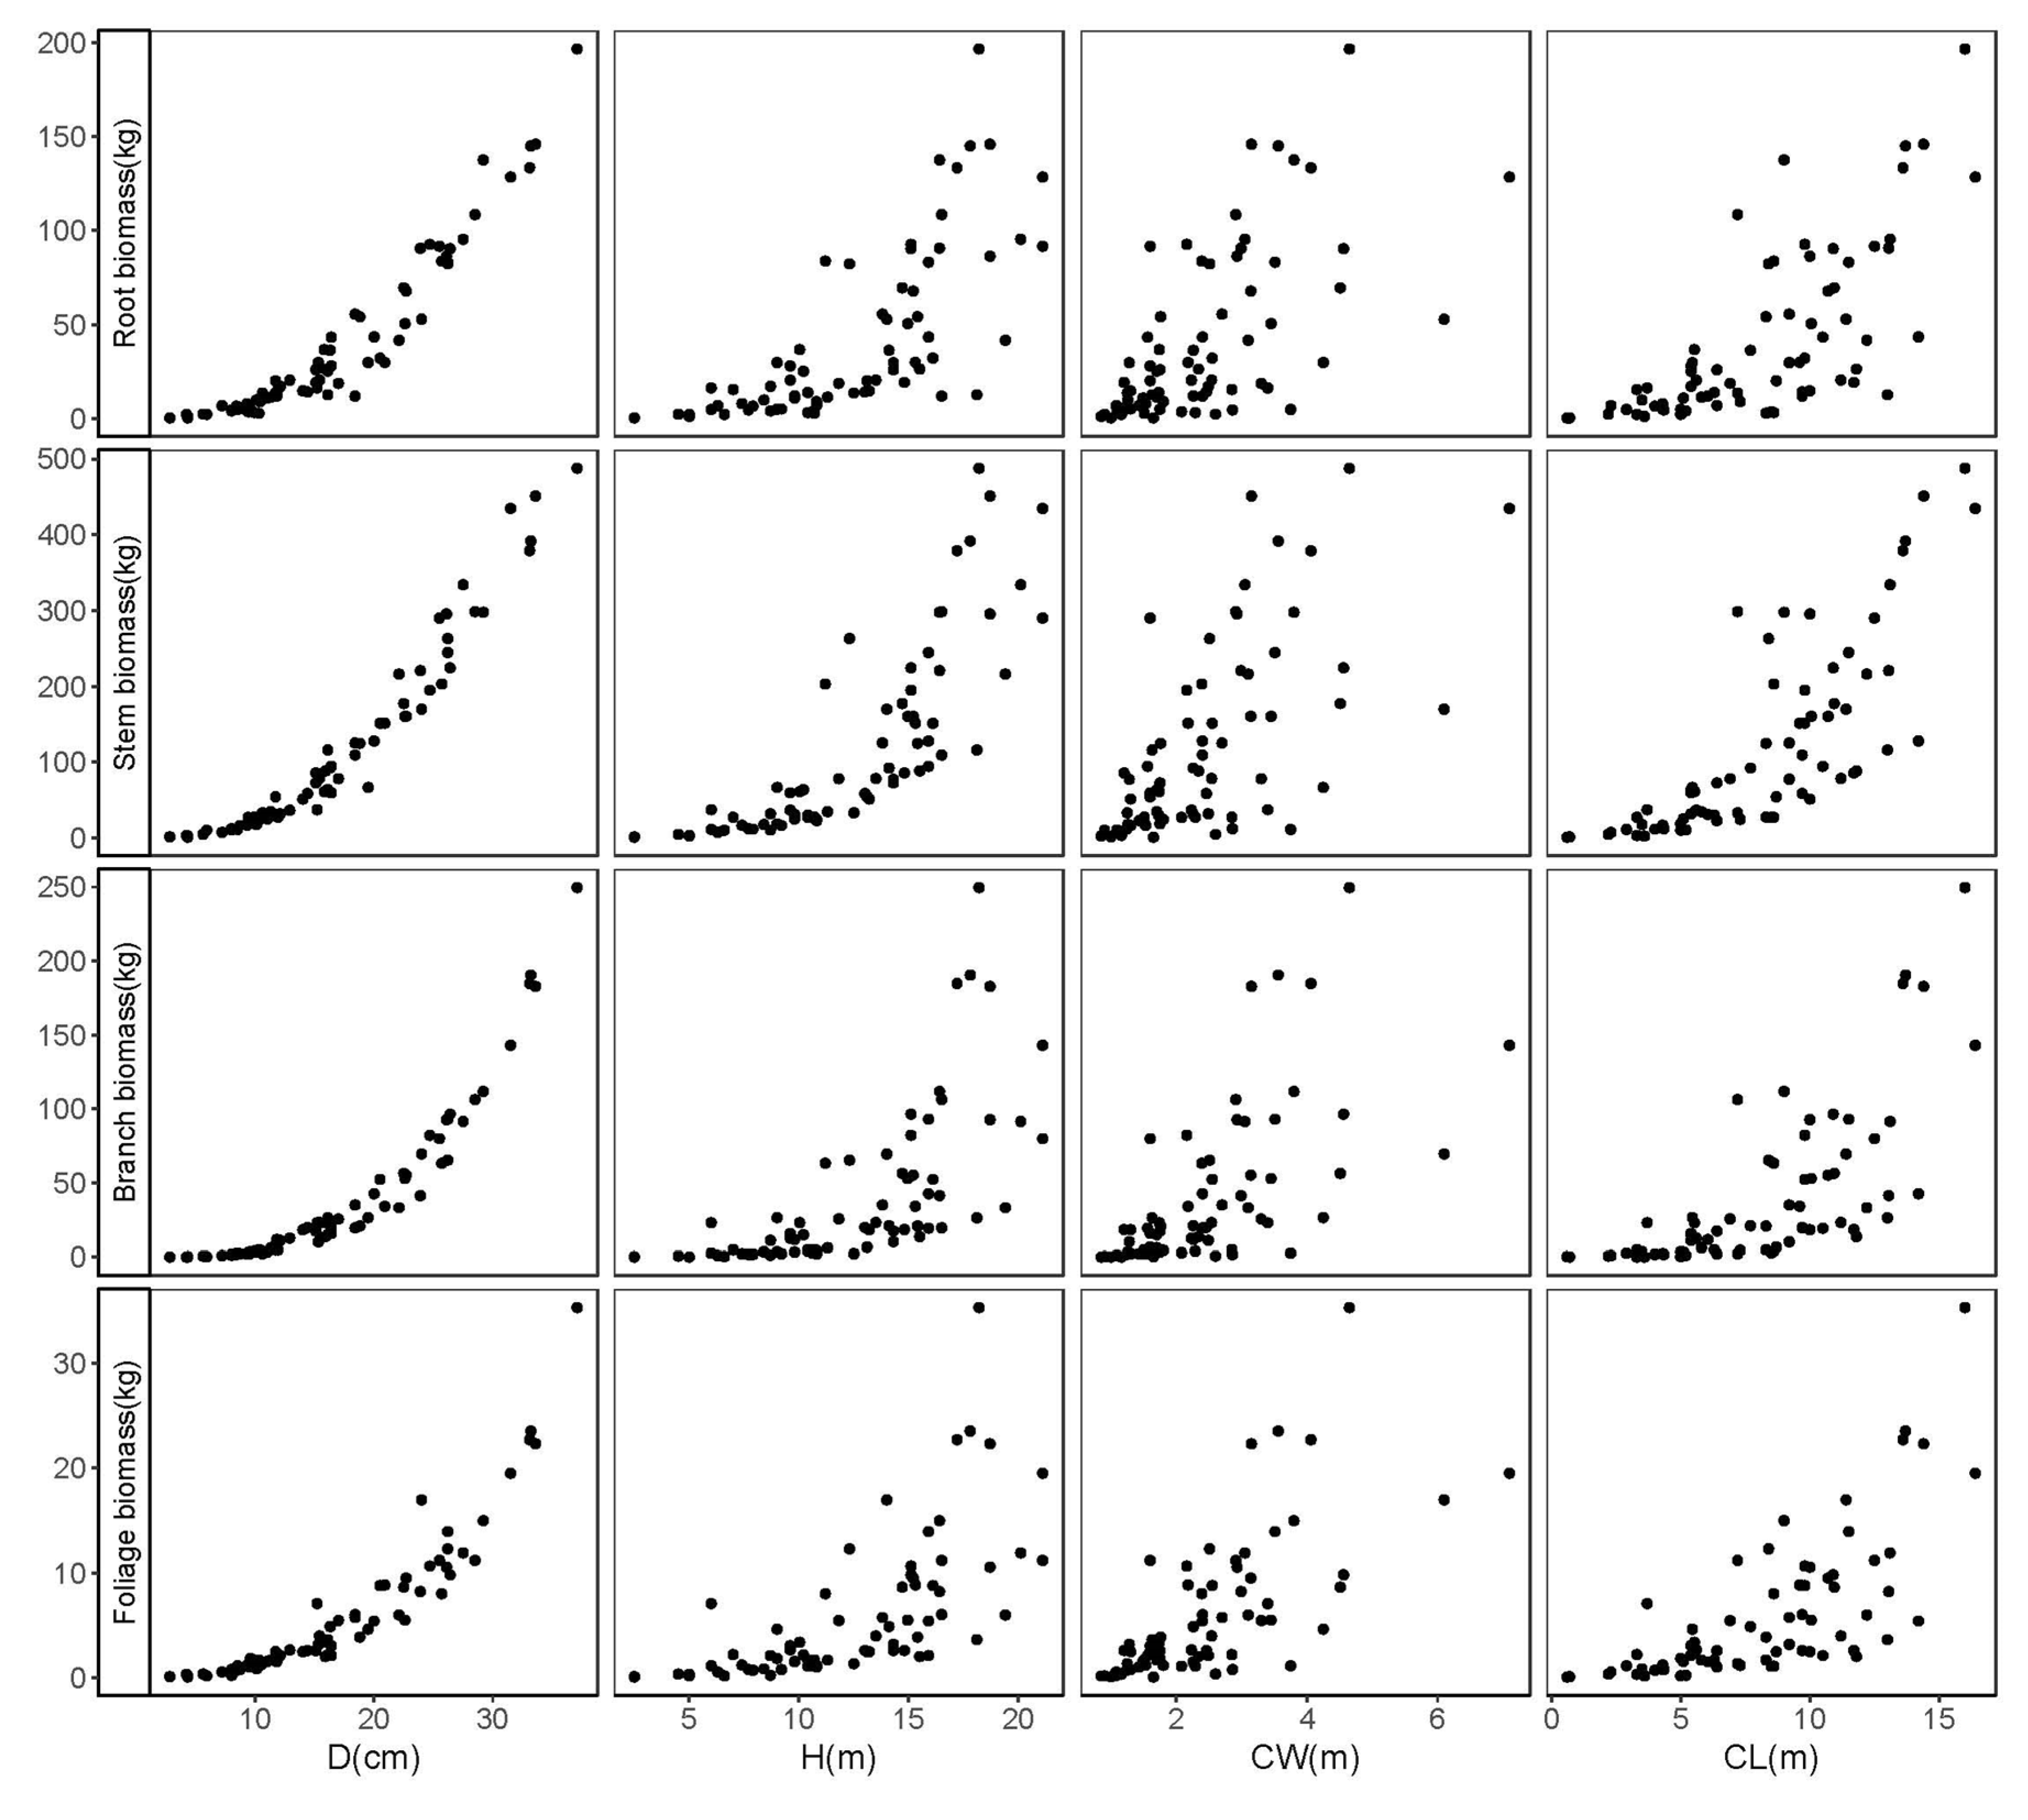
Tree diameter at breast height (D) is an indispensable predictor in biomass modeling and indubitably appears as among the most fundamental elements in forest inventory practice [54,55]. As a sole predictor in estimating tree biomass, D has always been providing an accurate model prediction for many species across numerous regions and delivering a simple model structure that is acquainted with being easy-to-use for forest practitioners [56,57]. The insertion of tree height (H) and crown characteristics (i.e., crown length [CL] and crown width [CW]) into biomass allometric models has been shown to generate a significant improvement in the model fitting and performance. In the current study, D, D and H, and D, H, and CL were used as a predictor(s) to develop each of the three systems of additive biomass model (Equations (1)–(4)). One of our available crown attribute predictors, CW, was intentionally eliminated in the model development since it was not significantly improving the model fitting performance for all tree component biomass equations. Our results noted that the inclusion of H and H and CL in the stem and foliage biomass equations, respectively, could improve the overall model fitting performance. This finding is in accordance with previous literature [6,15,58,59].
In this study, the aboveground (stem, branch, and foliage) and belowground (root) biomass data were obtained across a range of diameter (1.70–31.90 cm) and height (2.40–27.00 m). Previous research revealed that Mongolian oak might grow to exceed the diameter and height range investigated in this study [60]. However, the existences of those large sizes of Mongolian oak are extremely rare in practice, especially in natural secondary forest. Moreover, the Chinese Government has strictly forbidden to cut the large size trees (D > 50 cm) for any kind of purposes. Thus, our newly developed aggregated biomass model systems are inappropriate for estimating the tree components, subtotals, and total biomass exceeding the diameter and height range provided in the present study.
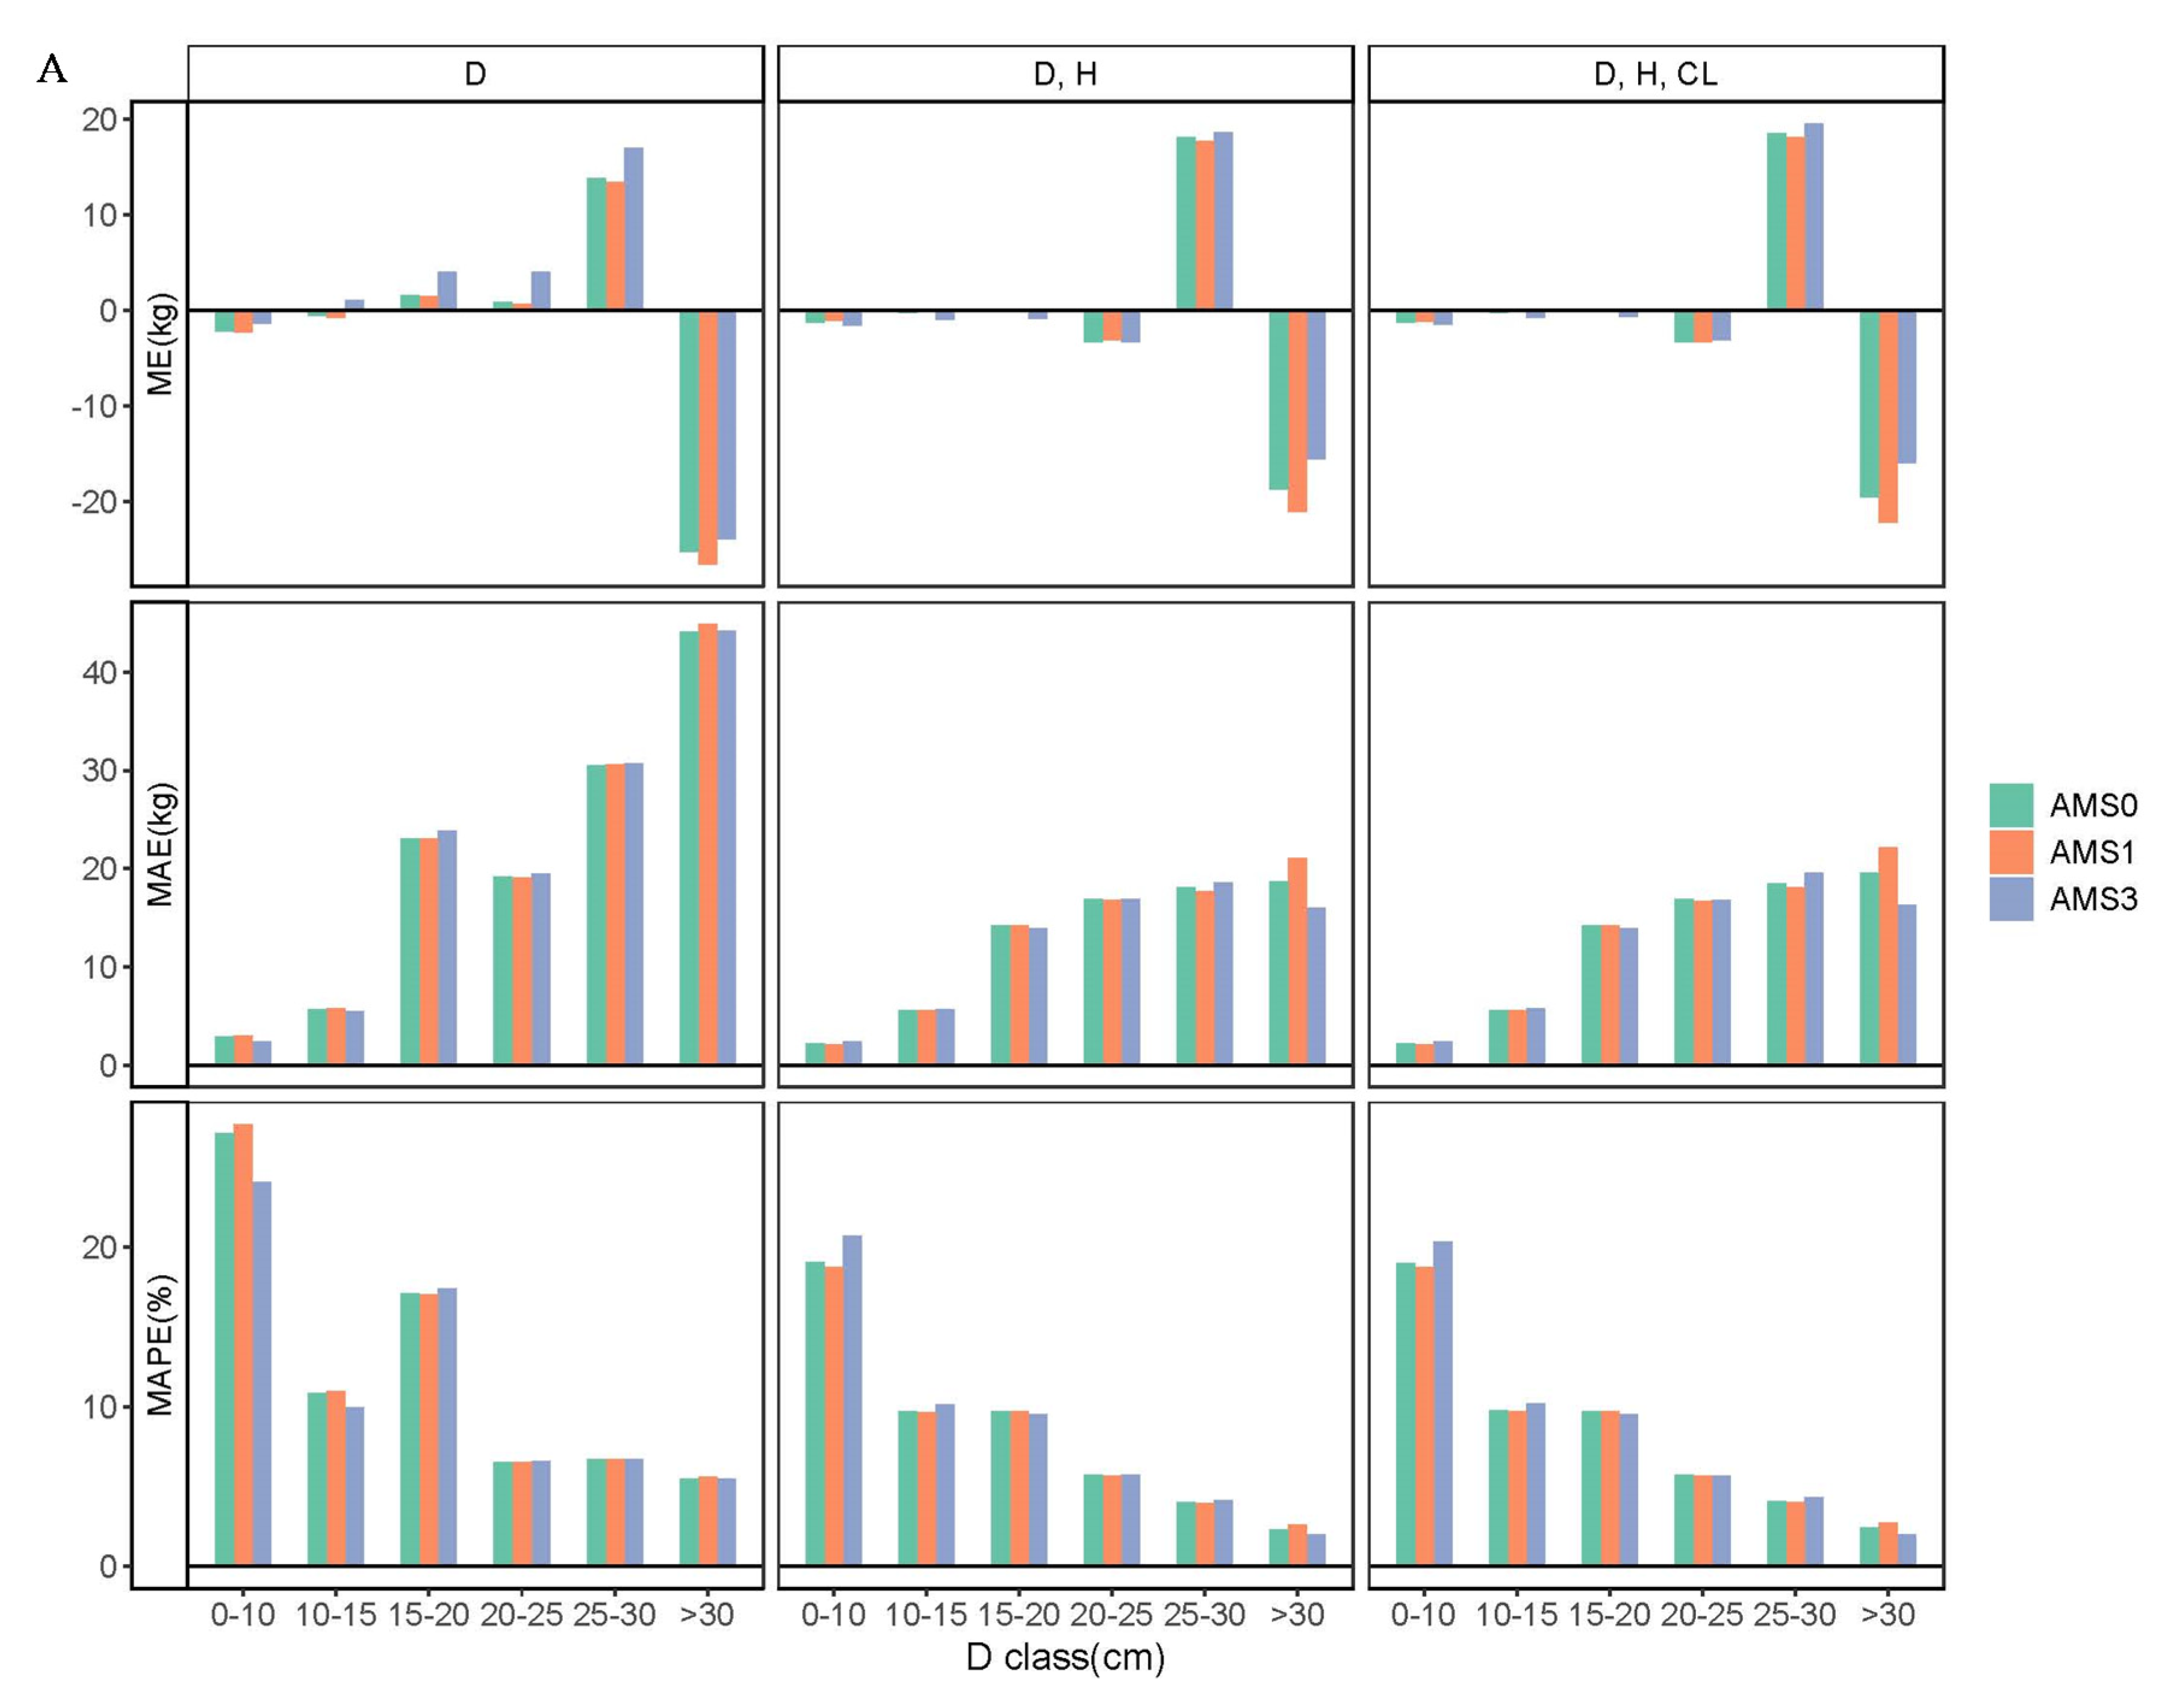
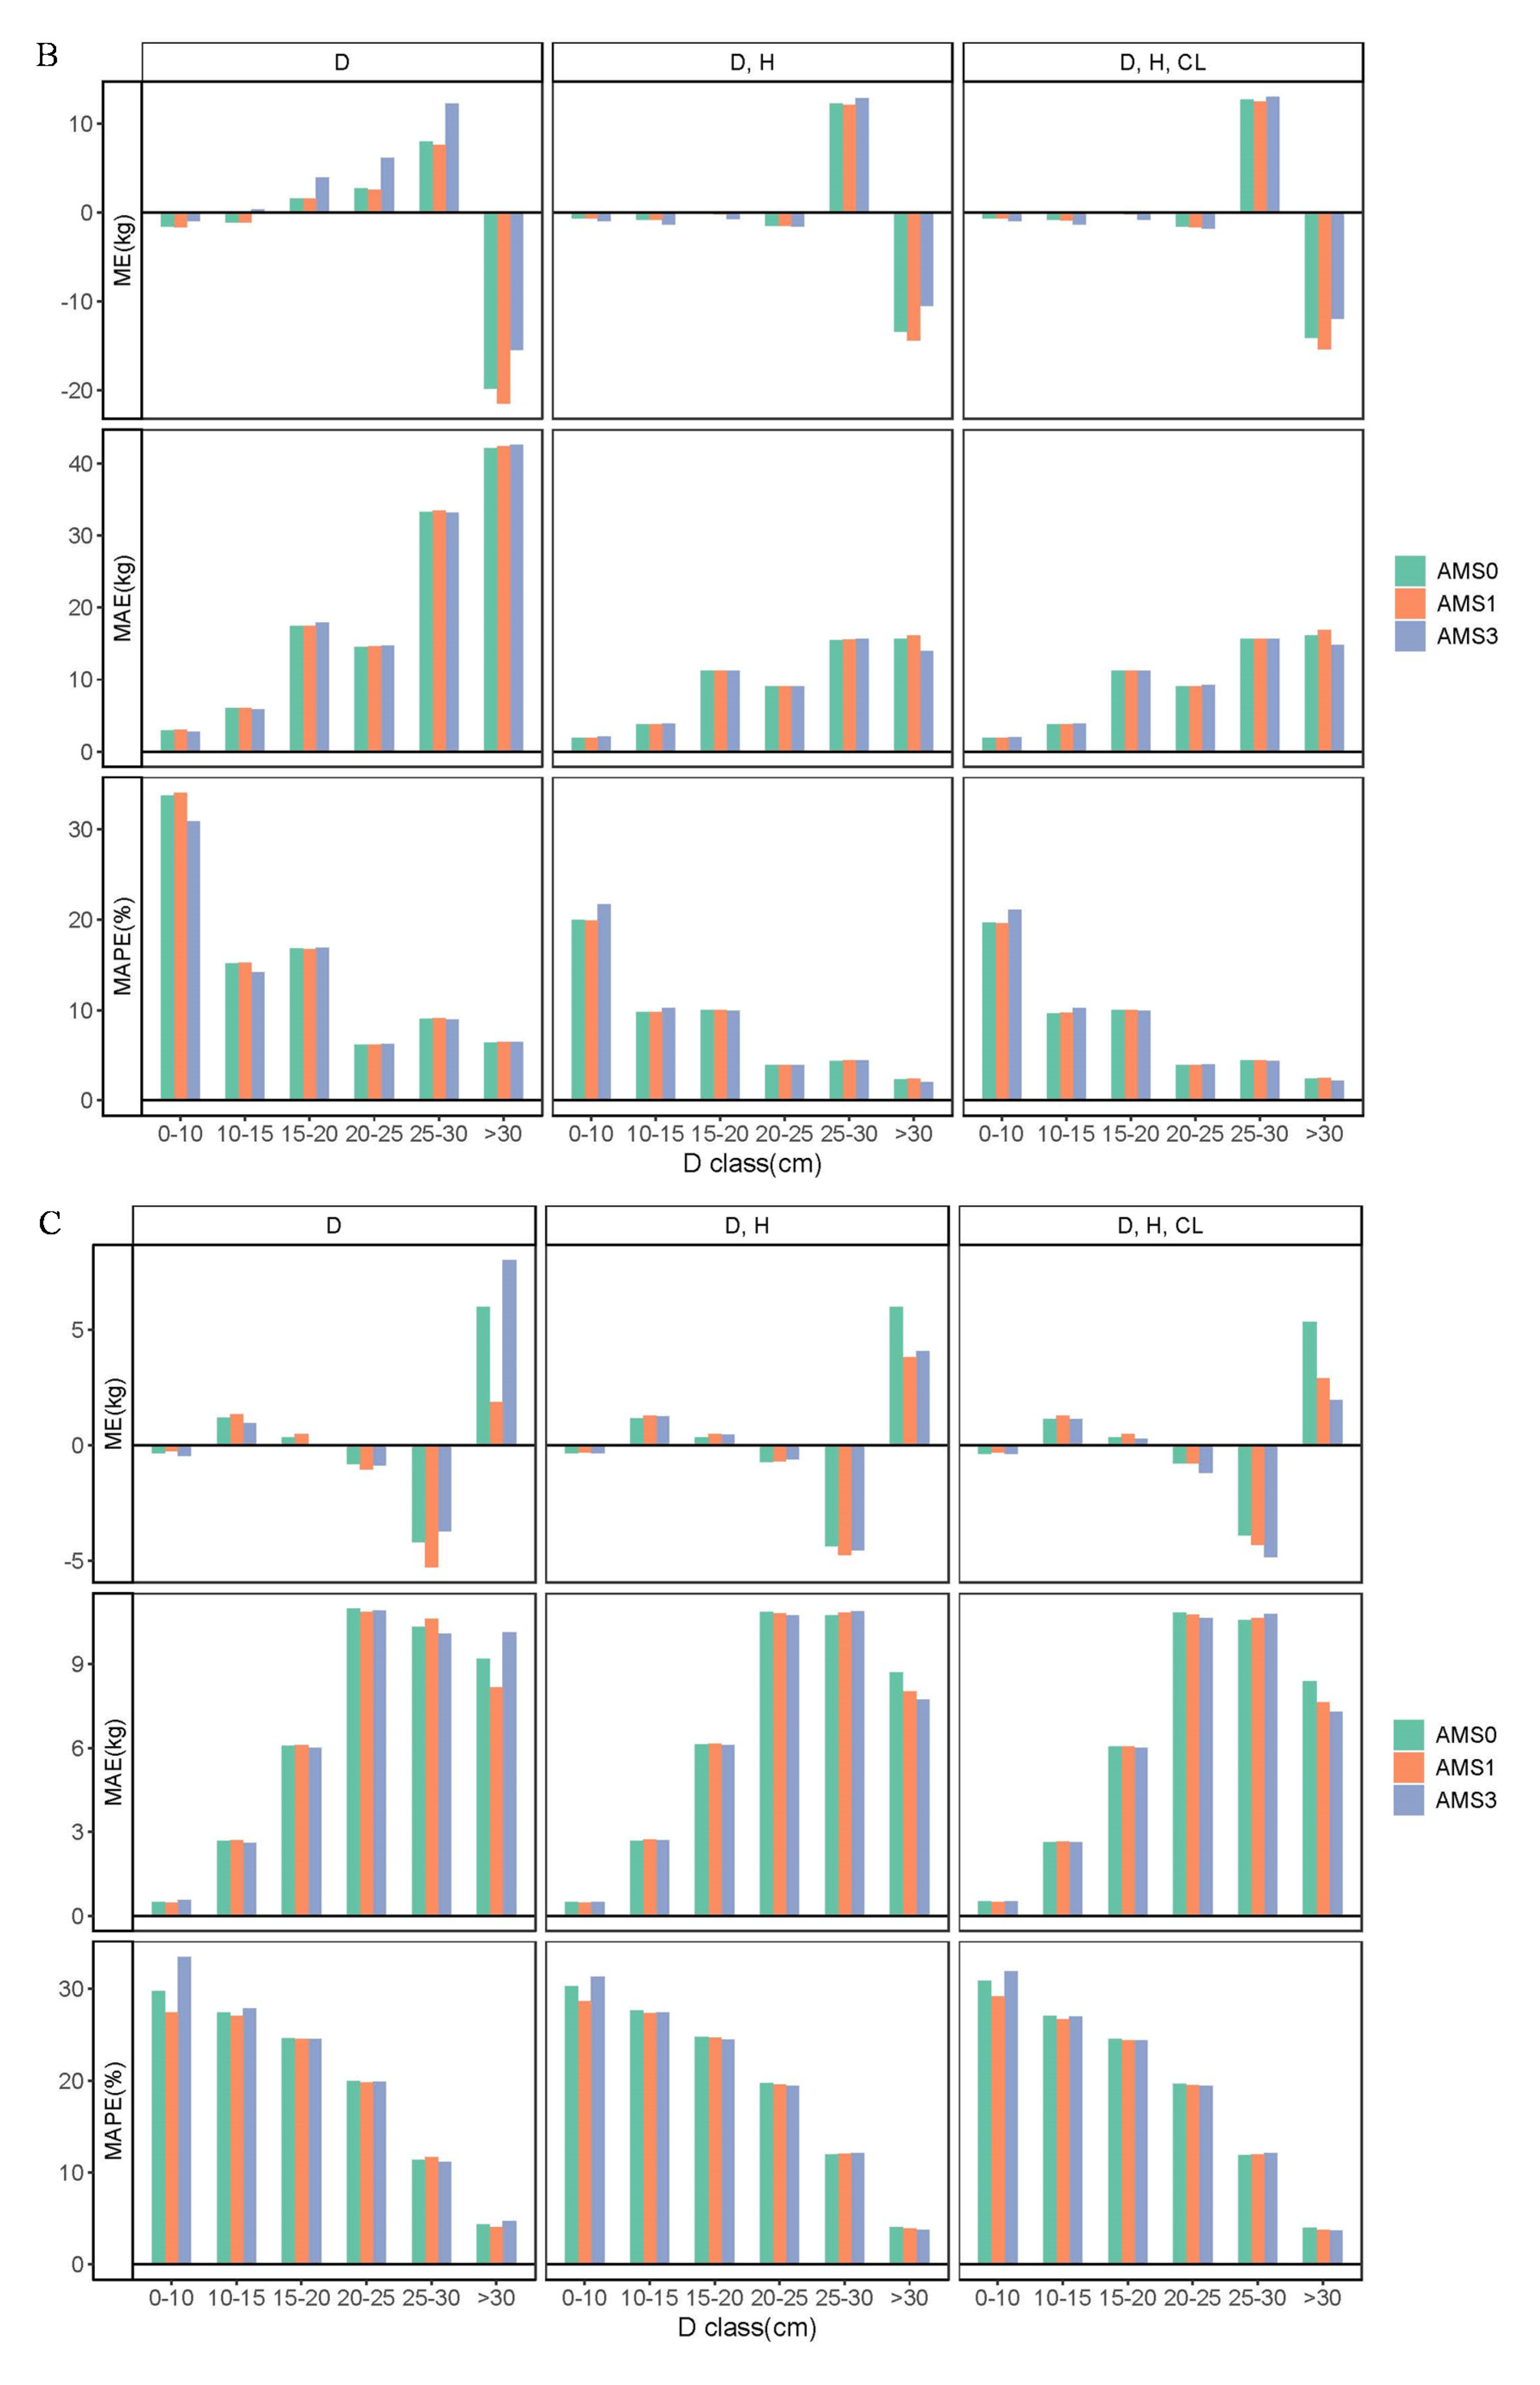
The three aggregative modeling approaches were constructed to develop biomass models. The AMS0 contains no parameter restriction, while the AMS1 and AMS3 contain one and three parameter restrictions, respectively, which guarantees that the sum of the component estimations will be exactly the same as the direct estimation of subtotals and total biomass. In this study, the focus was on demonstrating the differences between AMS0, AMS1, and AMS3 due to the parameter restrictions imposed on the model systems. Our results indicate that all the three aggregative modeling approaches performed well in the context of average prediction errors for components, subtotals, and total biomass estimations. Compared with AMS1 and AMS3, AMS0 was actually better to predict the component, crown, aboveground, and total biomass, although AMS1 only utilizes the total biomass model as a dependent equation, while AMS3 specifies all of the crown, aboveground, and total biomass. These results conform with the previous findings reported by Zhao et al. [21] and Dong et al. [24], which specifically stated that AMS0 is the most suitable approach to construct aggregated systems of biomass models.
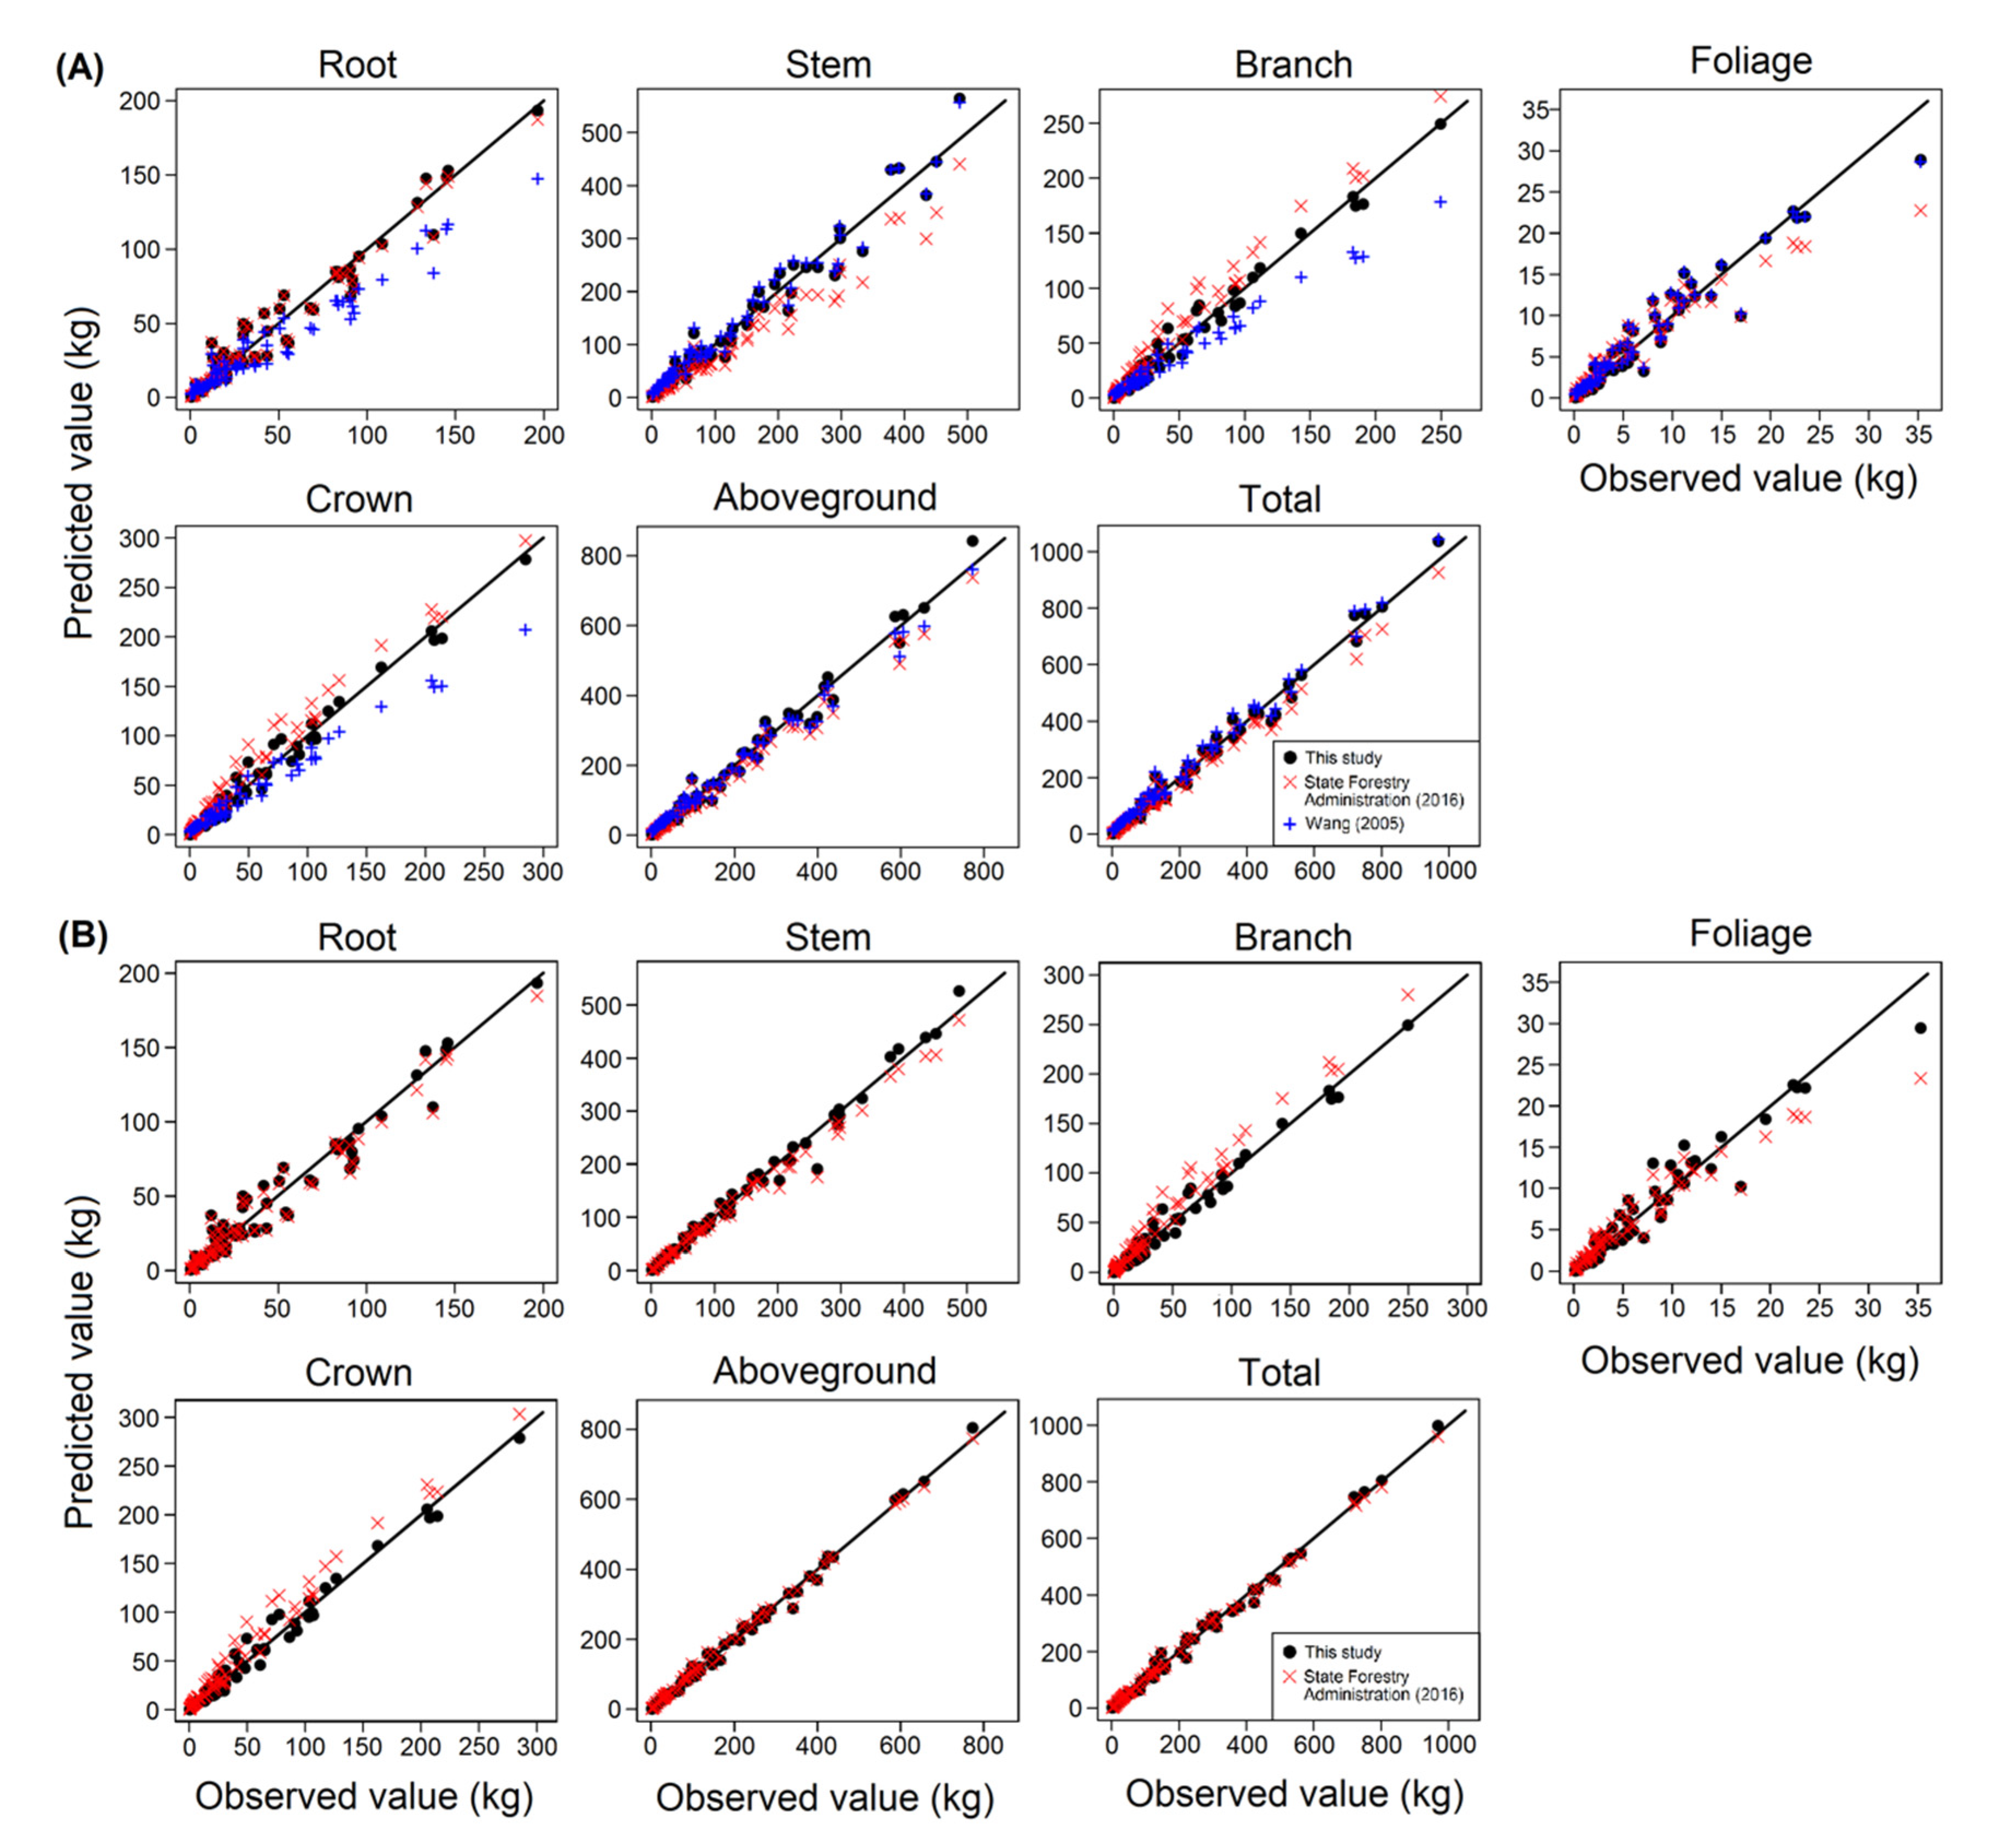
It was realized that a limited number of individual tree biomass equations exist for the particular tree species, especially in Northeast China. Wang [36] developed biomass models for this species from the Maoershan Ecosystem Research Station in Heilongjiang Province, Northeastern China. The biomass models were also fitted by using a range of tree sizes, but unfortunately, the equations were lacking an additivity property for component, subtotal, and total biomass. Compared with the present research, Wang’s [36] study produced similar predictions in estimating stem, aboveground, and total biomass for Mongolian oak, while there were some notable differences in estimating root, branch, and crown biomass. Moreover, the present study was compared with the previous equations developed by China State Forestry Administration [42]. The State’s equations tend to give a distinguished underestimate of stem biomass and produce a remarkable overestimate prediction on branch and crown equations, chiefly for large-sized trees, whereas delivered similar estimations in estimating root, aboveground, and total biomass. The potential explanations of these discrepancies may be due to the differences in sampling sizes, sites, and the characteristic of stands where the trees were sampled. These issues may inevitably relate to the disparities in terms of climate variations, altitude, slope, and soil conditions as external factors; along with stand density, competition from the neighboring trees, and the morphological traits of tree roots as internal factors [6,61,62].

5. Conclusions

We developed three aggregative systems of biomass equation for Mongolian oak occupying five mountainous regions in Northeast China: one based on D only, one on the combination of D and H, and one on the combination of D, H, and CL. We found that the inclusion of H into the aggregative systems improved the performances and model fit significantly for the stem, aboveground, and total biomass models, while adding CL into the aggregative model system only gave a slight improvement for the model fitting of the foliage and crown biomass models. All of the new systems developed here guarantee the additivity property between the components, subtotals, and total biomass, and provide more accurate estimations than previous research works. There was not available any single function or structural system that was perfect for estimating biomass for all of the tree components, crown, aboveground, or total biomass. Based on numerous fit statistics, the overall performances of the three aggregative model systems can be ranked in the following order: AMS0 > AMS1 > AMS3.
The carbon concentrations were found to be significantly different among tree components and growing regions in our natural secondary forest sites. Different procedures for quantifying the carbon stocks of Mongolian oak individual trees were evaluated. The results indicate that considering carbon concentration differences among tree tissues and growing regions appeared to be the best approach. Contrarily, the usage of a 0.50 generic carbon concentration value will give a relatively high bias in quantifying carbon stocks and evidently appeared as the worst method. The tree species used in this research is widespread in northeastern China. The aggregative biomass models and the carbon concentration analyses presented in this study might become an essential reference for researchers, forest practitioners, and governments, particularly for the Chinese National Forest Inventory. However, the newly developed model systems are not recommended to be used in estimating the biomass of trees outside the scope of the data, both geographically and in terms of tree size.

Author Contributions

F.R.A.W. contributed in analyzing the data and writing the original draft; F.L. contributed in carrying out the field work, analyzing the data, and writing the paper; L.Z. helped in analyzing the data and writing the paper; L.D. contributed in supervising and coordinating the research project, designed and installed the experiment, took some measurements, and contributed to writing the paper. All authors have read and agree to the published version of the manuscript.

Funding

This research was supported by the Natural Science Foundation of China [grant number 31971649], Provincial Funding for the National Key R&D Program of China in Heilongjiang Province [grant number GX18B041], the National Key R&D Program of China [grant number 2017YFD0600402], Fundamental Research Funds for the Central Universities [grant number 2572019CP08] and the Heilongjiang Touyan Innovation Team Program (Technology Development Team for High-efficient Silviculture of Forest Resources).

Acknowledgments

We would like to express our deep gratitude to the faculty and students of the Department of Forest Management, Northeast Forestry University (NEFU), China, who provided and collected the data for this study. We appreciate the help of Nathan J. Roberts (NEFU) for final polishing of the English text. Also, we would like to thank the two anonymous reviewers who provided relevant suggestions on a previous version of the manuscript.

Conflicts of Interest

The authors declare no conflict of interest.

References

  1. FAO (Food and Agriculture Organization of United Nations). Global Forest Resources Assessment 2015; FAO: Rome, Italy, 2016; ISBN 9789251088265. [Google Scholar]
  2. Wang, X.; Fang, J.; Zhu, B. Forest biomass and root-shoot allocation in northeast China. For. Ecol. Manag. 2008, 255, 4007–4020. [Google Scholar] [CrossRef]
  3. González-García, M.; Hevia, A.; Majada, J.; Barrio-Anta, M. Above-ground biomass estimation at tree and stand level forshort rotation plantations of Eucalyptus nitens (Deane & Maiden) Maiden in Northwest Spain. Biomass Bioenergy 2013, 54, 147–157. [Google Scholar]
  4. Clark, D.A.; Brown, S.; Kicklighter, D.W.; Chambers, J.Q.; Thomlinson, J.R.; Ni, J. Measuring net primary production in forests: Concepts and field methods. Ecol. Appl. 2001, 11, 356–370. [Google Scholar] [CrossRef]
  5. Zeng, W.S.; Duo, H.R.; Lei, X.D.; Chen, X.Y.; Wang, X.J.; Pu, Y.; Zou, W.T. Individual tree biomass equations and growth models sensitive to climate variables for Larix spp. in China. Eur. J. For. Res. 2017, 136, 233–249. [Google Scholar] [CrossRef]
  6. Bi, H.; Turner, J.; Lambert, M.J. Additive biomass equations for native eucalypt forest tress of temperate Australia. Trees 2004, 18, 467–479. [Google Scholar] [CrossRef]
  7. Dong, L.; Zhang, L.; Li, F. Developing additive systems of biomass equations for nine hardwood species in Northeast China. Trees 2015, 29, 1149–1163. [Google Scholar] [CrossRef]
  8. Dong, L.; Zhang, L.; Li, F. A compatible system of biomass equations for three conifer species in Northeast, China. For. Ecol. Manag. 2014, 329, 306–317. [Google Scholar] [CrossRef]
  9. Fayolle, A.; Doucet, J.L.; Gillet, J.F.; Bourland, N.; Lejeune, P. Tree allometry in Central Africa: Testing the validity of pantropical multi-species allometric equations for estimating biomass and carbon stocks. For. Ecol. Manag. 2013, 305, 29–37. [Google Scholar] [CrossRef]
  10. Sileshi, G.W. A critical review of forest biomass estimation models, common mistakes and corrective measures. For. Ecol. Manag. 2014, 329, 237–254. [Google Scholar] [CrossRef]
  11. Zeng, W.S. Using nonlinear mixed model and dummy variable model approaches to develop origin-based individual tree biomass equations. Trees Struct. Funct. 2015, 29, 275–283. [Google Scholar] [CrossRef]
  12. Radtke, P.; Walker, D.; Frank, J.; Weiskittel, A.; DeYoung, C.; MacFarlane, D.; Domke, G.; Woodall, C.; Coulston, J.; Westfall, J. Improved accuracy of aboveground biomass and carbon estimates for live trees in forests of the eastern United States. For. Int. J. For. Res. 2017, 90, 32–46. [Google Scholar] [CrossRef] [Green Version]
  13. Luo, Y.; Wang, X.; Ouyang, Z.; Lu, F.; Feng, L.; Tao, J. A review of biomass equations for China’s tree species. Earth Syst. Sci. Data 2020, 12, 21–40. [Google Scholar] [CrossRef] [Green Version]
  14. Dong, L.; Zhang, L.; Li, F. Developing two additive biomass equations for three coniferous plantation species in northeast China. Forests 2016, 7, 136. [Google Scholar] [CrossRef] [Green Version]
  15. Zhao, D.; Kane, M.; Markewitz, D.; Teskey, R.; Clutter, M. Additive tree biomass equations for midrotation loblolly pine plantations. For. Sci. 2015, 61, 613–623. [Google Scholar] [CrossRef] [Green Version]
  16. Wang, X.; Zhao, D.; Liu, G.; Yang, C.; Teskey, R.O. Additive tree biomass equations for Betula platyphylla Suk. plantations in Northeast China. Ann. For. Sci. 2018, 75. [Google Scholar] [CrossRef] [Green Version]
  17. Parresol, B.R. Additivity of nonlinear biomass equations. Can. J. For. Res. 2001, 31, 865–878. [Google Scholar] [CrossRef]
  18. Tang, S.; Wang, Y. A parameter estimation program for the error-in-variable model. Ecol. Modell. 2002, 156, 225–236. [Google Scholar] [CrossRef]
  19. Dong, L.; Zhang, L.; Li, F. A three-step proportional weighting system of nonlinear biomass equations. For. Sci. 2015, 61, 35–45. [Google Scholar] [CrossRef]
  20. Reed, D.D.; Green, E.J. A method of forcing additivity of biomass tables when using nonlinear models. Can. J. For. Res. 1985, 15, 1184–1187. [Google Scholar] [CrossRef]
  21. Zhao, D.; Westfall, J.; Coulston, J.W.; Lynch, T.B.; Bullock, B.P.; Montes, C.R. Additive biomass equations for slash pine trees: Comparing three modeling approaches. Can. J. For. Res. 2019, 49, 27–40. [Google Scholar] [CrossRef]
  22. Russell, M.B.; Burkhart, H.E.; Amateis, R.L. Biomass partitioning in a miniature-scale loblolly pine spacing trial. Can. J. For. Res. 2009, 39, 320–329. [Google Scholar] [CrossRef]
  23. Menéndez-Miguélez, M.; Canga, E.; Barrio-Anta, M.; Majada, J.; Álvarez-Álvarez, P. A three level system for estimating the biomass of Castanea sativa Mill. coppice stands in north-west Spain. For. Ecol. Manag. 2013, 291, 417–426. [Google Scholar] [CrossRef]
  24. Dong, L.; Zhang, Y.; Zhang, Z.; Xie, L.; Li, F. Comparison of Tree Biomass Modeling Approaches for Larch (Larix olgensis Henry) Trees in Northeast China. Forests 2020, 11, 202. [Google Scholar] [CrossRef] [Green Version]
  25. Affleck, D.L.R.; Diéguez-Aranda, U. Additive nonlinear biomass equations: A likelihood-based approach. For. Sci. 2016, 62, 129–140. [Google Scholar] [CrossRef]
  26. Thomas, S.C.; Malczewski, G. Wood carbon content of tree species in Eastern China: Interspecific variability and the importance of the volatile fraction. J. Environ. Manag. 2007, 85, 659–662. [Google Scholar] [CrossRef] [PubMed]
  27. Tashi, S.; Keitel, C.; Singh, B.; Adams, M. Allometric equations for biomass and carbon stocks of forests along an altitudinal gradient in the eastern Himalayas. For. Int. J. For. Res. 2017, 90, 445–454. [Google Scholar] [CrossRef]
  28. Losi, C.J.; Siccama, T.G.; Condit, R.; Morales, J.E. Analysis of alternative methods for estimating carbon stock in young tropical plantations. For. Ecol. Manag. 2003, 184, 355–368. [Google Scholar] [CrossRef]
  29. Houghton, R.A. Converting Terrestrial Ecosystems from Sources to Sinks of Carbon. Ambio 1996, 25, 267–272. [Google Scholar]
  30. Kraenzel, M.; Castillo, A.; Moore, T.; Potvin, C. Carbon storage of harvest-age teak (Tectona grandis) plantations, Panama. For. Ecol. Manag. 2003, 173, 213–225. [Google Scholar] [CrossRef]
  31. Laiho, R.; Laine, J. Tree stand biomass and carbon content in an age sequence of drained pine mires in southern Finland. For. Ecol. Manag. 1997, 93, 161–169. [Google Scholar] [CrossRef]
  32. Lamlom, S.H.; Savidge, R.A. A reassessment of carbon content in wood: Variation within and between 41 North American species. Biomass Bioenergy 2003, 25, 381–388. [Google Scholar] [CrossRef]
  33. Bert, D.; Danjon, F. Carbon concentration variations in the roots, stem and crown of mature Pinus pinaster (Ait.). For. Ecol. Manag. 2006, 222, 279–295. [Google Scholar] [CrossRef]
  34. Rodríguez-Soalleiro, R.; Eimil-Fraga, C.; Gómez-García, E.; García-Villabrille, J.D.; Rojo-Alboreca, A.; Muñoz, F.; Oliveira, N.; Sixto, H.; Pérez-Cruzado, C. Exploring the factors affecting carbon and nutrient concentrations in tree biomass components in natural forests, forest plantations and short rotation forestry. For. Ecosyst. 2018, 5, 35. [Google Scholar]
  35. Wang, C.; Sang, Y. STUDIES ON STRUCTURE AND FUNCTIONS OF MONGOLIAN OAK FORESTS. J. Northeast Univ. 1995, 6, 65–70. [Google Scholar]
  36. Wang, C. Biomass allometric equations for 10 co-occurring tree species in Chinese temperate forests. For. Ecol. Manag. 2006, 222, 9–16. [Google Scholar] [CrossRef]
  37. Zhang, Q.; Wang, C.; Wang, X.; Quan, X. Carbon concentration variability of 10 Chinese temperate tree species. For. Ecol. Manag. 2009, 258, 722–727. [Google Scholar] [CrossRef]
  38. Beck, H.E.; Zimmermann, N.E.; McVicar, T.R.; Vergopolan, N.; Berg, A.; Wood, E.F. Present and future köppen-geiger climate classification maps at 1-km resolution. Sci. Data 2018, 5, 1–12. [Google Scholar] [CrossRef] [Green Version]
  39. Dong, L.; Zhang, L.; Li, F. Allometry and partitioning of individual tree biomass and carbon of Abies nephrolepis Maxim in northeast China. Scand. J. For. Res. 2016, 31, 399–411. [Google Scholar] [CrossRef]
  40. SAS Institute Inc. SAS/ETS 9.3 User’s Guide; SAS Institute Inc.: Cary, NC, USA, 2011. [Google Scholar]
  41. Balboa-Murias, M.Á.; Rodríguez-Soalleiro, R.; Merino, A.; Álvarez-González, J.G. Temporal variations and distribution of carbon stocks in aboveground biomass of radiata pine and maritime pine pure stands under different silvicultural alternatives. For. Ecol. Manag. 2006, 237, 29–38. [Google Scholar] [CrossRef]
  42. State Forestry Administration. Tree Biomas Models and Related Parameters to Carbon Accounting for Quercus; China Forestry Press: Beijing, China, 2016.
  43. Xing, Z.; Bourque, C.P.A.; Swift, D.E.; Clowater, C.W.; Krasowski, M.; Meng, F.R. Carbon and biomass partitioning in balsam fir (Abies balsamea). Tree Physiol. 2005, 25, 1207–1217. [Google Scholar] [CrossRef] [Green Version]
  44. Wu, H.; Xiang, W.; Fang, X.; Lei, P.; Ouyang, S.; Deng, X. Tree functional types simplify forest carbon stock estimates induced by carbon concentration variations among species in a subtropical area. Sci. Rep. 2017, 7, 1–11. [Google Scholar] [CrossRef] [PubMed] [Green Version]
  45. Ngo, K.M.; Turner, B.L.; Muller-Landau, H.C.; Davies, S.J.; Larjavaara, M.; bin Nik Hassan, N.F.; Lum, S. Carbon stocks in primary and secondary tropical forests in Singapore. For. Ecol. Manag. 2013, 296, 81–89. [Google Scholar] [CrossRef]
  46. Singh, V.; Tewari, A.; Kushwaha, S.P.S.; Dadhwal, V.K. Formulating allometric equations for estimating biomass and carbon stock in small diameter trees. For. Ecol. Manag. 2011, 261, 1945–1949. [Google Scholar] [CrossRef]
  47. Arif, M.; Shahzad, M.K.; Elzaki, E.E.A.; Hussain, A.; Zhang, B.; Yukun, C. Biomass and carbon stocks estimation in Chichawatni irrigated plantation in Pakistan. Int. J. Agric. Biol. 2017, 19, 1339–1349. [Google Scholar]
  48. Roy, J.; Saugier, B.; Mooney, H.A. Terrestrial Primary Productivity: Definitions and Milestones; Academic Press: New York, NY, USA, 2001; ISBN 0125052901. [Google Scholar]
  49. Wenzl, H.F.J. The Chemical Technology of Wood; Academic Press: New York, NY, USA, 1970; ISBN 8645182191751. [Google Scholar]
  50. de Mello, A.A.; Nutto, L.; Weber, K.S.; Sanquetta, C.E.; Monteiro de Matos, J.L.; Becker, G. Individual biomass and carbon equations for Mimosa scabrella Benth. (Bracatinga) in Southern Brazil. Silva Fenn. 2012, 46, 333–343. [Google Scholar] [CrossRef] [Green Version]
  51. Van Vinh, T.; Marchand, C.; Linh, T.V.K.; Vinh, D.D.; Allenbach, M. Allometric models to estimate above-ground biomass and carbon stocks in Rhizophora apiculata tropical managed mangrove forests (Southern Viet Nam). For. Ecol. Manag. 2019, 434, 131–141. [Google Scholar] [CrossRef]
  52. Chauhan, S.K.; Singh, S.; Sharma, S.; Sharma, R.; Saralch, H.S. Tree biomass and carbon sequestration in four short rotation tree plantations. Range Manag. Agrofor. 2019, 40, 77–82. [Google Scholar]
  53. Dong, L.; Liu, Y.; Zhang, L.; Xie, L.; Li, F. Variation in carbon concentration and allometric equations for estimating tree carbon contents of 10 broadleaf species in natural forests in Northeast China. Forests 2019, 10, 928. [Google Scholar] [CrossRef] [Green Version]
  54. Gschwantner, T.; Schadauer, K.; Vidal, C.; Lanz, A.; Tomppo, E.; Di Cosmo, L.; Robert, N.; Duursma, D.E.; Lawrence, M. Common tree definitions for national forest inventories in Europe. Silva Fenn. 2009, 43, 303–321. [Google Scholar] [CrossRef] [Green Version]
  55. Zianis, D.; Muukkonen, P.; Mäkipää, R.; Mencuccini, M. Biomass and stem volume equations for tree species in Europe. Silva Fenn. Monogr. 2005, 4, 1–63. [Google Scholar]
  56. Basuki, T.M.; van Laake, P.E.; Skidmore, A.K.; Hussin, Y.A. Allometric equations for estimating the above-ground biomass in tropical lowland Dipterocarp forests. For. Ecol. Manag. 2009, 257, 1684–1694. [Google Scholar] [CrossRef]
  57. Jenkins, J.C.; Chojnacky, D.C.; Heath, L.S.; Birdsey, R.A. National-scale biomass estimators for United States tree species. For. Sci. 2003, 49, 12–35. [Google Scholar]
  58. Zou, W.T.; Zeng, W.S.; Zhang, L.J.; Zeng, M. Modeling crown biomass for four pine species in China. Forests 2015, 6, 433–449. [Google Scholar] [CrossRef] [Green Version]
  59. Dong, L.; Zhang, L.; Li, F. Additive biomass equations based on different dendrometric variables for two dominant species (Larix gmelini Rupr. and Betula platyphylla Suk.) in natural forests in the Eastern Daxing’an Mountains, Northeast China. Forests 2018, 9, 261. [Google Scholar] [CrossRef] [Green Version]
  60. Ma, W.; Lei, X. Nonlinear Simultaneous Equations for Individual-Tree Diameter Growth and Mortality Model of Natural Mongolian Oak Forests in Northeast China. Forests 2015, 6, 2261–2280. [Google Scholar] [CrossRef] [Green Version]
  61. Nicoll, B.C.; Ray, D. Adaptive growth of tree root systems in response to wind action and site conditions. Tree Physiol. 1996, 16, 891–898. [Google Scholar] [CrossRef] [Green Version]
  62. Satoo, T.; Madgwick, H.A.I. Forest Biomass; DR W. Junk Publishers: The Hague, The Netherlands, 1982; ISBN 9781510817173. [Google Scholar]
Figure 1. The location of the study area and the distribution of sample plots in Northeast China.
Forests 11 00397 g001
Figure 2. Relationships between diameter at breast height (D), tree height (H), crown width (CW) and crown length (CL), and tree component biomass measures.
Forests 11 00397 g002
Figure 3. The diffograms (mean-mean scatter diagrams) of multiple comparisons of adjusted least squares means for the Mongolian oak tree components and growing regions. The diagonal reference line in each diffogram represents the line of unity for all pairs with equal least square means. The line segment that is forming a 90-degree angle to the line of unity represents a different series of treatment as indicated by grid labels, each centered by the pair’s least square means and its length proportional to the pairwise difference range of values. The line segment colors indicate the significant/insignificant difference between pairs: blue (p ≤ 0.05); red (not significant).
Forests 11 00397 g003
Figure 4. Comparison of model performances for the AMS0, AMS1 and AMS3 based on D, combination of D and H, and combination of D, H, and CL across diameter classes in total biomass (A), aboveground biomass (B) and crown biomass (C).
Forests 11 00397 g004aForests 11 00397 g004b
Figure 5. Total, subtotal, and component biomass models from present study compared to equations from previous studies based on different predictors for Mongolian oak: (A) D only and (B) D and H.
Forests 11 00397 g005
Figure 6. The relative error (RE) of individual tree biomass carbon stock quantified by six different procedures. Regional Respective Component Carbon concentration (RRCCc), Regional Weighted Mean Carbon concentration (RWMCc), Respective Component Mean Carbon concentration (RCMCc), Total Weighted Mean Carbon concentration (TWMCc), Generic Carbon Concentration Conversion factor–1 (GCCCf-1), and Generic Carbon Concentration Conversion factor–2 (GCCCf-2).
Forests 11 00397 g006
Table 1. Descriptive statistics of tree variables.
StatisticsNMeanMinMaxSD
D (cm)7216.72.837.18.2
H (m)7212.32.521.14.5
CW (m)722.40.97.11.2
CL (m)728.10.616.43.7
Total biomass (kg)72202.141.74969.13222.94
Root biomass (kg)7240.670.48196.5044.06
Stem biomass (kg)72117.210.87487.70123.23
Branch biomass (kg)7238.410.13249.6452.01
Foliage biomass (kg)725.840.0935.296.73
Table 2. Carbon concentration statistics for Mongolian oak by region, component, and weighted mean carbon concentration (WMCC).
RegionSitesComponentsNMeanMinMaxSD
XXMNHeihe, Luobei and SunwuRoot180.44610.41370.47440.0202
Stem 0.46380.43720.49170.0156
Branch 0.45060.40820.47350.0159
Foliage 0.47550.43920.50850.0201
RWMCC 0.45780.43130.48420.0147
XXMSQinganRoot120.46620.44630.48630.0127
Stem 0.47860.46400.49620.0113
Branch 0.47100.44260.50430.0165
Foliage 0.48580.46390.52070.0177
RWMCC 0.47470.46070.48850.0102
ZGCMEHulin and NinganRoot120.41940.39490.44230.0171
Stem 0.43960.42000.45380.0109
Branch 0.43240.41660.44650.0097
Foliage 0.45020.43050.47660.0133
RWMCC 0.43490.41430.44300.0095
ZGCMWAcheng and WuchangRoot120.44080.40290.47730.0220
Stem 0.45710.42300.48350.0228
Branch 0.45270.42560.48590.0233
Foliage 0.46240.42930.48460.0161
RWMCC 0.45370.42250.48060.0215
CBMFusong and BaishanRoot100.42500.40490.44750.0133
Stem 0.43850.41100.46230.0166
Branch 0.43560.41390.46130.0162
Foliage 0.45510.43790.48580.0168
RWMCC 0.43610.41100.45950.0148
TotalAll sitesRoot640.44060.39490.48630.0234
Stem 0.45680.41100.49620.0211
Branch 0.44910.40820.50430.0208
Foliage 0.46700.42930.52070.0210
TWMCC 0.45250.41100.48850.0201
XXMN: North slope of Xiaoxing’an Mountains; XXMS: South slope of Xiaoxing’an Mountains; ZGCME: Eastern slope of Zhangguangcai mountains; ZGCMW: Western slope of Zhangguangcai mountains; CBM: Changbai mountains.
Table 3. The effects of tree size (D), region, and tree component on carbon concentrations of Mongolian oak. Degrees of freedom (DF) and type III sum of squares (SS) are shown.
SourceDFType III SSMean SquareF-Valuesp-Values
Tree size (D)10.000014070.000014070.050.8326
Region40.048532930.0121332342.93<0.0001
Component30.024374210.0081247428.75<0.0001
Table 4. Parameter estimates, standard errors (SE), model fitting statistics, weighting functions, and jackknifing validation for AMS0, AMS1, and AMS3 based on D only.
Model TypeBiomass Componentβi0βi1Weight FunctionR2RMSEMPEMAEMAPE
EstimateSEEstimateSE
AMS0Root−3.2950.2172.3690.072D3.46400.9569.130.086.3930.82
Stem−2.3030.1732.3910.055D2.69520.96423.33−0.2616.1122.89
Branch−5.7250.2143.1120.067D3.69370.9836.740.014.7728.23
Foliage−5.4920.2742.4510.085D2.24550.9371.670.021.0324.78
Crown 0.9837.500.035.4622.75
Aboveground 0.98422.56−0.2315.1517.47
Total 0.98824.63−0.1616.8314.82
AMS1Root−3.2600.1692.3580.056D3.46400.9569.130.026.3831.07
Stem−2.2720.1622.3800.051D2.69520.96423.16−0.1116.0323.10
Branch−5.8430.2063.1510.064D3.69370.9836.77−0.354.8527.26
Foliage−5.5290.2732.4630.085D2.24550.9381.670.011.0324.70
Crown 0.9847.47−0.345.4122.12
Aboveground 0.98422.71−0.4415.1917.55
Total D2.86210.98824.73−0.4316.9014.97
AMS3Root−3.3970.1742.4030.057D3.46400.9569.17−0.216.4430.43
Stem−2.4410.1172.4280.037D2.69520.96323.631.9716.2721.53
Branch−5.6410.1873.0840.057D3.69370.9836.820.164.8029.05
Foliage−5.2680.1392.3850.044D2.24550.9351.71−0.091.0626.32
Crown D4.76020.9837.620.075.4723.68
Aboveground D3.14380.98422.652.0415.2016.63
Total D2.86210.98724.881.8316.9414.01
Table 5. Parameter estimates, standard errors (SE), model fitting statistics, weighting functions, and jackknifing validation for AMS0, AMS1, and AMS3 based on a combination of D and H.
Model TypeBiomass Componentβi0βi1βi2Weight FunctionR2RMSEMPEMAEMAPE
EstimateSEEstimateSEEstimateSE
AMS0Root−3.29010.21682.36710.0718D3.46400.9569.140.096.3930.83
Stem−3.25100.12891.91830.04540.89070.0688D2.69520.98813.170.067.9610.79
Branch−5.72380.21363.11110.0669D3.69370.9836.740.004.7728.25
Foliage−5.18350.30172.60800.1172−0.29580.1482D2.24550.9381.660.011.0725.50
Crown0.9837.520.015.4822.97
Aboveground0.99611.770.088.1610.32
Total0.99515.400.1710.8210.22
AMS1Root−3.37450.15652.39350.0518D3.46400.9569.140.136.3830.39
Stem−3.23970.12501.90910.04380.89710.0663D2.69520.98913.100.077.9410.91
Branch−5.80510.18673.13700.0580D3.69370.9836.73−0.124.8027.50
Foliage−5.18010.29582.60910.1159−0.29800.1469D2.24550.9381.660.011.0725.42
Crown0.9837.48−0.115.4422.49
Aboveground0.99611.86−0.048.2110.33
TotalD2.86210.99515.560.0910.8910.13
AMS3Root−3.26920.11152.36090.0356D3.46400.9569.130.046.3730.96
Stem−3.17040.08871.89280.03580.89050.0546D2.69520.98912.910.107.8311.44
Branch−5.82470.13383.14260.0409D3.69370.9836.72−0.064.8027.22
Foliage−4.86580.16062.61400.0901−0.41800.1158D2.24550.9351.71−0.021.0827.04
CrownD4.76020.9837.49−0.085.4023.06
AbovegroundD3.14380.99611.630.028.1010.81
TotalD2.86210.99515.300.0610.7210.63
Table 6. Parameter estimates, standard errors (SE), model fitting statistics, weighting functions, and jackknifing validation for AMS0, AMS1, and AMS3 based on a combination of D, H, and CL.
Model TypeBiomass Componentβi0βi1βi2βi3Weight FunctionR2RMSEMPEMAEMAPE
EstimateSEEstimateSEEstimateSEEstimateSE
AMS0Root−3.29680.21732.36930.0719 D3.46400.9569.130.086.3930.80
Stem−3.25230.12891.91820.04540.89120.0688 D2.69520.98813.170.067.9610.78
Branch−5.72530.21373.11160.0669 D3.69370.9836.74−0.004.7728.23
Foliage−4.81270.34442.53640.1179−0.63520.21940.33330.1634D2.24550.9491.510.001.0125.02
Crown 0.9847.450.005.4122.91
Aboveground 0.99611.860.078.1910.24
Total 0.99515.530.1510.9410.21
AMS1Root−3.37490.15602.39390.0517 D3.46400.9569.140.116.3830.41
Stem−3.23930.12491.90960.04370.89650.0662 D2.69520.98913.100.067.9510.91
Branch−5.81170.18663.13920.0580 D3.69370.9836.73−0.144.8027.44
Foliage−4.78370.33822.53260.1161−0.66340.21620.35930.1607D2.24550.9491.510.001.0024.92
Crown 0.9847.41−0.145.3522.40
Aboveground 0.99611.96−0.088.2410.24
Total D2.86210.99515.710.0311.0210.14
AMS3Root−3.28550.12252.36340.0397 D3.46400.9569.160.386.3630.68
Stem−3.19050.09031.88520.03680.90590.0562 D2.69520.98912.930.307.7911.32
Branch−5.81560.16263.14190.0502 D3.69370.9836.76−0.314.8227.46
Foliage−4.53760.18032.52880.0741−0.73360.15800.34840.1029D2.24550.9471.54−0.101.0026.45
Crown D4.76020.9847.45−0.415.3223.10
Aboveground D3.14380.99611.75−0.128.1610.66
Total D2.86210.99515.450.2710.8510.56

