Abstract
Exploring carbon allocation pattern and its influencing factors is of great significance for estimating the carbon sequestration rate and potential of forest ecosystems. Here, we investigate all carbon pool components (including above and belowground biomass of tree, shrub and herb layers, and dead biomass and soil carbon pools) in four successional stages of broad-leaved and Korean pine (Pinus koraiensis Siebold & Zucc.) mixed forests in Northeast China. We explore the change of allocation among carbon pools with succession and examine the relative importance of succession, stand age, and stand factors on carbon allocation pattern. Our results illustrate that above- and belowground vegetation carbon increase as maximum tree height increases. Below- to aboveground vegetation carbon ratio (R/S ratio) decreases significantly with succession and increases significantly as mean diameter at breast height (DBH) increases, but does not significantly correlate with stand age. With succession and increasing stand age, understory (shrub, herb) to tree carbon ratio (understory/tree ratio) and soil to vegetation carbon ratio (soil/vegetation ratio) decrease significantly. The joint effect of succession, stand age, and stand factors have the largest contribution on above- and belowground vegetation carbon and understory/tree ratio (26.83%, 27.93%, and 49.48% of variations explained, respectively). As for the pure effects, stand factors explain the largest proportion of variations in vegetation aboveground carbon (11.25%) and soil carbon (20.18%). Meanwhile, succession is the variable with the largest contribution to vegetation belowground carbon (12.64%), R/S ratio (21.83%), understory/tree ratio (25.84%), and soil/vegetation ratio (6.68%). Overall, these results suggest that species composition change during forest succession, instead of stand factors and stand age, is the main driver of forest vegetation carbon allocation. In contrast, stand factors play a major role in soil carbon allocation. Our findings suggest more studies to better understand the role of species composition (in addition to stand factors and age) on biomass allocation, and the influence of stand factors and litterfalls on soil carbon sequestration, which are critical to improve forest management strategies (e.g., adjustment of species composition and forest structure) to increase the future ability of forest carbon sequestration.
1. Introduction
The current carbon stock in the world’s forests is estimated to be 861 Pg C (1 Pg = 1015 g), and grows at a rate of 2.4 Pg C per year, which plays an important role in alleviating the increase of atmospheric CO2 concentration [1]. Forest is the largest carbon stocks of terrestrial ecosystems, especially in the middle and high latitudes of the Northern Hemisphere, with high carbon uptake potential [2,3,4]. Thus, there is a need for accurate information concerning carbon storage and allocation pattern in forest ecosystems to improve our understanding in processes and mechanisms of the global carbon cycle [5]. Understanding the determinants of biomass allocation patterns is not only important for forest management to increase forest carbon sequestration, but also crucial for predicting forest carbon budgets in response to climate change, land use, and forest management [6,7].
Many studies have explored variation in forest carbon storage and allocation with successional stages, including studies from local, reginal to global scales [8,9,10]. However, few studies have explored all carbon pool components (vegetation, dead biomass, soil) and their allocation patterns in forest ecosystems. Wei et al. [11] explored the variation of carbon stocks (vegetation, litterfall, soil) with succession for five forest types in Northeast China. Chen et al. [12] examined the above- and belowground carbon allocation (vegetation, litterfall) change with species and forest age in four tropical plantations and naturally restored shrub lands.
Forest carbon pools are affected by many various factors such as successional stages [13], stand age [10,14], stand factors [15], forest type [16], species richness [17], and forest management and disturbances [18]. With forest succession, species composition changes markedly among successional stages, which differ markedly in abilities for carbon absorption [19]. Stand age is also an important modulator of forest biomass and carbon storage. Studies have reported a strong effect of stand age on the storage of different carbon pool in forest ecosystems [10,13,20], probably because stand age can enhance biomass and productivity via the increase in tree size [21] and size variation [22].
In addition, stand factors (such as density, tree size) also affect forest biomass or productivity significantly [22,23]. For instance, higher stand density increases forest C storage and wood production through higher canopy packing, which could capture more light resources [24,25]. Studies have widely found biomass is closely related to forest height [26,27]. The large trees have been used as a predictor of aboveground biomass variation across the pan-tropics [28] or world-wide [29]. The variation in stem diameter, also referred to as size inequality, can also reduce or increase biomass and productivity [22].
Till now, most studies have not explored all the components of forest ecosystem carbon pool [11,12], or have not distinguished between the different roles of stand age and succession [9,13] when examining the drivers of carbon storage allocation. Meanwhile, the influence of stand structure is also rarely considered simultaneously [11,12,13]. Ouyang et al. [14] studied the effect of forest age on the productivity of subtropical forests in China. They reported that stand age may affect biomass and productivity via changes in stand structure as forests develop. Succession, stand age, and stand factors affect forest carbon storage and allocation together, however, their relative importance is still controversial and poorly understood.
Broad-leaved and Korean pine mixed forests (BKFs) are the climax forests in the temperature zone of Northeastern China, which are characterized by complex community structure, high biomass and productivity, and play an important role in forest carbon sequestration. Compared with other forests of the world at the same latitude, it is famous for its unique species and rich species diversity. However, BKFs have widely experienced different degree of human disturbance, resulting in large area of secondary forests at different successional stages.
In this study, we examined four successional stages of BKFs, and estimated carbon storage of all components for vegetation, soil, and dead biomass in the plots. We aimed to answer two scientific questions: (1) How dose carbon storage allocation change with forest succession? (2) What is the relative importance of successional stage, stand age, and stand structure in affecting carbon storage and allocation?
2. Materials and Methods
2.1. Study Area and Experimental Design
This study was conducted in the Shenshan Nature Reserve of Heilongjiang Province, China (126.42°–127.03° E, 49.42°–49.67° N) (Figure 1). The study area belongs to temperate continental monsoon climate. The mean annual temperature is –2.5 °C, with mean temperature for the coldest (January) and warmest month (July) of –25.5 °C and 18.5 °C, respectively. The mean annual precipitation ranges between 500 and 600 mm, occurring mainly in summer. The zonal soil type is dark brown forest soil.
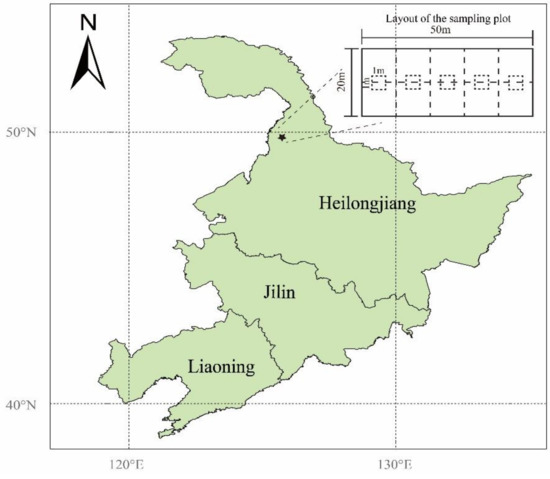
Figure 1.
Location of the study site in China, and the layout of the sampling plot.
We selected forests with similar site conditions such as climate, soil and topography in four successional stages. Three typical 20 × 50 m plots were set in each successional stage, and each plot consisted of ten subplots (10 × 10 m). The successional stages were determined based on species compositions, stand basal area, and disturbance history of the stands (Table 1). The early to late successional stages in our study are: Betula platyohylla Sukaczev forest, mix forest of Quercus mongolica Fisch. ex Ledeb. and Betula dahurica Pallas, pre-matue Pinus koraiensis Siebold & Zucc. forest and Pinus koraiensis Siebold & Zucc. mature forest [30]. As shown in Table 1, the species composition of the four stages are generally in consistence with the well-established knowledge of successional serious of BKFs [31]. Further, the mean stock volume in our late-successional stage is as high as 413 m3/ha, which is comparable to typical primary Pinus koraiensis Siebold & Zucc. forests in northeast China [31,32]. Meanwhile, our Betula plots had a stock volume (102 m3/ha) that is only 1/4 of the primary forests, and mid-late successional plots had a volume (273 m3/ha) markedly lower than the late successional stage. Stock volume and species composition are critical indicators of successional stages, and the above-mentioned facts suggest that our plots are good samples across the secondary successional series of Pinus koraiensis Siebold & Zucc. forests.

Table 1.
Characteristics of the twelve stands of four successional stages at the Shengshan Reserve in Heilongjiang province, China (mean ± within SD).
In the field survey, we recorded basic information such as latitude, longitude, elevation and slope of each plot, and vegetation (tree, shrub, herb), litterfall, dead wood, and soil carbon storage were investigated and estimated for the plot.
2.2. Vegetation Carbon Storage
We measured the DBH and tree height of all standing trees with a DBH > 3 cm in the plot and recorded the species name [33]. Individual tree biomass (above- and belowground) was calculated using species-specific allometric equations (Table A1). For a few tree species where no species-specific allometric equations were available, we used equations for similar species. Given that such trees were seldom encountered, the influence of surrogate equations was considered to be insignificant.
For each commonly observed shrub species in the plots, 15 individuals with different basal diameters were selected, and basal diameter, height, fresh weight of each organ (leaf, stem and root) were determined in the field. Some samples were taken to the laboratory and oven-dried at 65 °C to constant weight to obtain the water content for each organ. The dry weight for each organ was then calculated based on total fresh weight and corresponding water content. Using the measured dry mass of the 15 individuals, the allometric relationship of biomass with DBH were established for each organ by each species (Table A2). In a final step, the shrub layer biomass of each plots was calculated from the DBH and height of each shrub individual investigated in the plot.
Five quadrats of 1 × 1 m were evenly set in each plot. All the herbs in the quadrat were harvested and the fresh weight was measured. The sample was taken back to the laboratory and dried at 65 °C to constant weight. The water content was measured and the aboveground and underground biomass were calculated.
2.3. Dead Biomass Carbon Storage
Meanwhile, forest floor materials including fine wood debris (<2.5 cm in diameter), litterfall, and dead moss were collected and weighted from five quadrats (1 m × 1 m) in each plot. Samples were oven-dried at 65 °C to constant mass, and we measured the moisture content and converted it to dry weight. The DBH and height of all standing dead in the plot were measured, the biomass was calculated based on the tree biomass equation.
2.4. Soil Carbon Storage
Two soil profiles with 1-m depth were randomly selected within each 20 × 50 m plot, and the soil organic carbon density of the plot calculated as the average of the two soil profiles. Each soil profile was divided into the following vertical layers of 0–20, 20–40, 40–60, 60–80, and 80–100 cm depth by using a stainless cylinder with 100 cm3. Bulk density was determined by drying for 12 h at 105 °C. The samples obtained were placed into plastic bags and air-dried after they were transported to the laboratory. Then each soil sample was hand-sieved through a 2 mm screen to remove root, sand, and other debris, and soil organic carbon content was measured using the K2Cr2O7-oxidation method.
We used the following equation to calculate the SCOD of each soil profile:
where the SCOD is the soil organic carbon density (kg C/m2). E1 and E2 are the upper and lower depths of each soil layer of (cm), respectively. f(E) denotes a function of organic carbon bulk density (g/cm3) with soil depth (cm), and 10 was the conversion factor between different units (1g C/m3 = 10 kg C/m2).
2.5. Stand Age
In each plot, we selected 10 individuals ranging from small to large trees, and two tree-ring cores breast height were extracted from two vertical directions. We bought the tree cores back to laboratory, pasted and polished, and determined the age of 10 trees by performing a tree-ring analysis. For each successional stage, we developed the relationship between tree age and DBH based on these tree ring samples. In final step, the average stand age fir each plot was calculated as the age of the standard tree (with mean DBH in a plot), estimated from the age-DBH relationship [34,35]. This is a commonly used method to estimate average stand age in forest ecology [36].
2.6. Stand Structure Variables
In order to explore the effects of stand factors on carbon allocation pattern, we selected four indicators, namely stand density, mean DBH, maximum DBH (DBHmax), mean height, and maximum height (Heightmax). Stand density can affect the light capture of the community. Higher stand density can capture more light energy through large canopy packing, resulting in enhanced forest carbon storage capacity [12,25]. In addition, studies have shown that community biomass is related to the size of individual trees, and that community biomass is mainly occupied by large trees [29]. Consequently, we also used maximum DBH and height as predictors, in addition to mean DBH and height which were commonly used in literatures.
2.7. Data Analysis
Plant biomass was converted into carbon storage using a commonly used carbon content of 50% [37]. We used one-way analysis of variance (ANOVA) (Turkey’s HSD test) to test the statistical differences among successional stages, for the carbon storage and proportion of each forest ecosystem component (see Table 2). A general linear model was used to explore the relationship of carbon storage (above- and belowground biomass C, soil C) and carbon pool ratio (root/shoot ratio, understory/tree ratio, soil/vegetation ratio) with stand age, stand factors (mean DBH, mean Height, DBHmax, Heightmax, stand density) and successional stages (a categorical variable including the early, middle, mid-late and late successional stages). Before the data analysis, the normality test and the homogeneity test of variance were performed.
Table 2.
Carbon storage (t C/hm2) and allocation pattern in different successional stages of BKFs ecosystem (mean ± within SD).
To examine how carbon storage and ratios were affected by successional stage, stand age and stand factors jointly and independently, we used variation partitioning analysis to decompose the total variation into the following components: (1) pure effect of the three factors (a, b, c), (2) shared effects between two factors (d, e, f), and (3) shared effects among three factors (g); (4) unexplained variations. For the calculation of each component, see Heikkinen et al. [38]. To avoid collinearity among stand factors (mean and maximum DBH and height, and density), the five variables were first filtered by stepwise regression, and the variables retained in regression model were used in variation partitioning analysis.
3. Results
3.1. Carbon Storage and Allocation Pattern across Successional Stages
The carbon storage and allocation pattern were estimated for the four successional stages of BKFs ecosystems (Table 2). With forest succession, the variation in total carbon and soil carbon was not significant, while vegetation carbon increased significantly. In the early successional stage, soil carbon was about four times that of vegetation carbon, while soil carbon was almost the same as vegetation carbon in the late succession stands. In total ecosystem carbon, the proportion of vegetation carbon increased significantly with forest succession; while the proportion of soil carbon decreased significantly, from 76% in early stage to 48% in late successional stage. The proportion of dead biomass is very low and did not change significantly.
The above- and belowground vegetation carbon increased significantly with forest succession, while herb carbon decreased significantly, and shrub carbon storage did not change significantly (Table 2). In the dead biomass carbon pool, the litterfall carbon was the highest in mid–late successional stage, while standing dead carbon storage did not change significantly with forest succession. In the vegetation carbon pool, the proportion of tree carbon increased significantly with forest succession, while the proportion of herb carbon decreased significantly. There were no differences in the proportion of shrub carbon among successional stages.
3.2. The Variation of Carbon Storage and Allocation with Stand Age and Stand Factors
The above- and belowground vegetation carbon storage had significant positive correlation with stand age (R2 = 0.33, p < 0.05; R2 = 0.34, p < 0.05), while soil carbon storage was negatively correlated with stand age (R2 = 0.34, p < 0.05; Table 3, Figure 2a). Understory/tree ratio and soil/vegetation ratio showed significant negative correlation with stand age (R2 = 0.45, p < 0.05; R2 = 0.60, p < 0.01), while there was no significant correction between R/S ratio and stand age (Table 3, Figure 2b).
Table 3.
The R2 of each variable in explaining carbon storage and allocation pattern, “−” for negative relationships while others were positive ones (* p < 0.05; ** p < 0.01).
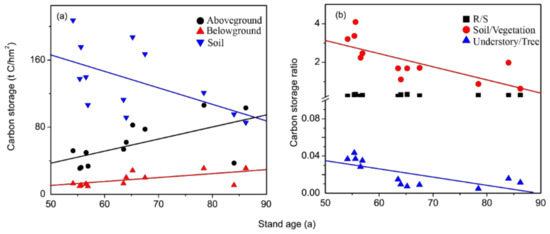
Figure 2.
Relationship of carbon storage and allocation with stand age. (a) Carbon storage, (b) Carbon storage ratio.
The vegetation aboveground carbon storage increased with Heightmax and stand density (R2 = 0.38, p < 0.05; R2 = 0.41, p < 0.05; Table 3, Figure 3a,c). The vegetation belowground carbon was significantly and positively correlated with Heightmax (R2 = 0.42, p < 0.05; Table 3, Figure 3b) while soil C had no significant correlation with stand factors (Table 3). There was a significant positive correlation between R/S ratio and mean DBH (R2 = 0.44, p < 0.05; Table 3, Figure 3d), while understory/tree ratio decreased significantly with increasing DBHmax and Heightmax (R2 = 0.44, p < 0.05; R2 = 0.55, p < 0.01; Table 3, Figure 3e,f).
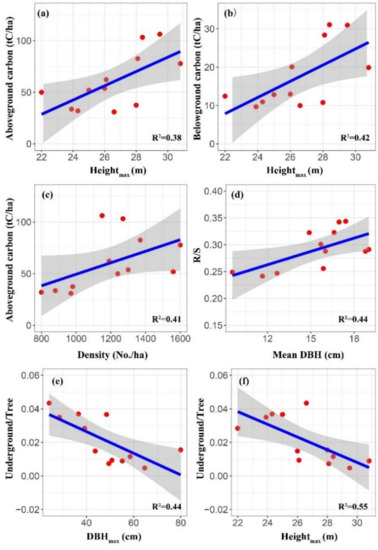
Figure 3.
Relationship of carbon storage and allocation pattern with stand factors. (a,c) aboveground carbon; (b) belowground carbon; (d) R/S ratio; and (e,f) Understory/Tree ratio.
3.3. Effects of Succession, Stand Age and Stand Factors on Carbon Storage Allocation
The variation partitioning analysis revealed the relative importance of three groups of factors, i.e., succession, stand age and stand factors, on the carbon storage and allocation (Figure 4). The joint effect of succession, stand age, and stand factors had strongest effect on above- and belowground vegetation carbon storage (26.83%, 27.93%; Figure 4a,b). In the pure effect, stand factors and succession explained the most variation in above- and belowground vegetation carbon storage, respectively (11.25%, 12.64%; Figure 4a,b). Stand factors had the highest pure effect on soil carbon storage (20.18%; Figure 4c). The joint effect of succession and stand factors explained 41.25% of variations in R/S ratio (Figure 4d). The joint effect of succession, stand age and stand factors had the largest contribution on understory/tree ratio (49.48%; Figure 4e). The joint effect of succession and stand age explained the most variation on soil/vegetation ratio (49.52%; Figure 4f). In terms of pure effect, succession had the largest contribution on R/S ratio, understory/tree ratio and soil/vegetation ratio, 21.83%, 25.84%, and 6.68%, respectively (Figure 4d–f). Meanwhile, soil/vegetation ratio was also affected by the combination of succession and stand factors (12.61%; Figure 4f).
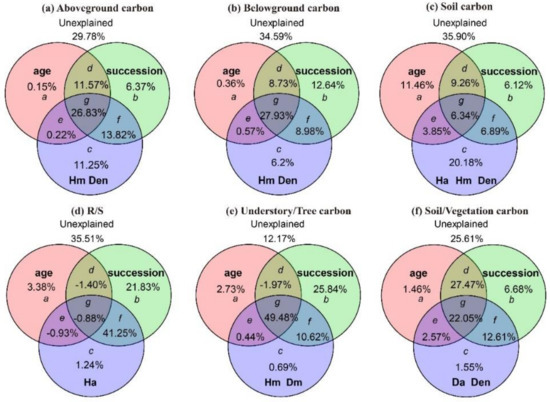
Figure 4.
Variation partitioning analysis for the effects of successional stage, stand age and stand factors on carbon storage (t C/hm2) and allocation patterns. In the figure, a, b and c are the pure effects of stand age, successional stages, and stand factors, respectively, while d, e, f and g are their shared effects. Abbreviations for stand factors: Da, average DBH, Dm, maximum DBH; Ha, average height; Hm, maximum height, Den, density.
4. Discussion
4.1. Differences in Carbon Storage and Allocation with Succession
In this study, the average carbon density of BKFs is 227.56 t/hm2 slightly lower than that of BKFs across northeast China (262.63 t/hm2) [39]. The average soil carbon density measured in this study (13.6 kg/m2) is also consistent with previous estimate (above 12 kg/m2) in northeast China [40,41,42]. Soil carbon storage generally increased during forest succession [9,10,43]. However, our study found that soil carbon decreased with forest succession. Forest litterfalls are a main input of soil carbon pool, and thus have a significant positive effect on soil carbon sequestration [44,45]. Studies have showed that litterfall quality and decomposition rate are important for soil carbon storage [46]. Litterfall decomposition rate is generally higher in softwood broad-leaved forests, medium in hardwood broad-leaved forests, and the lowest in coniferous forests [47]. This is because litterfalls of the coniferous species (i.e., Korean pine) are compact and dense, and thus difficult to be decomposed by soil animals and microorganisms. On the other hand, broadleaf species litterfalls are thinner and looser in texture, which is more conductive to decomposition reaction. Thus, the decreasing soil carbon storage towards latter successional stages, as observed in our study, maybe caused by the different decomposition rate as result of litter quality [48]. In late-successional stands, the coniferous litterfalls decomposed much slower than the broadleaf litters in secondary forests [49], which may lead to less carbon input in to soil and thus lower soil carbon storage in late-successional stages. Soil carbon storage is approximately three times that of vegetation carbon in early stage. Studies have found that the average soil carbon pool of global forest ecosystem is 2.19 times that of the vegetation carbon pool, and can reach 5.35 times in high latitude region (50–70° N) [50]. This is mainly due to the high latitude, low temperature and thick litterfall on the surface, so soil organic matter is slowly decomposed and soil carbon storage is high.
4.2. The Effect of Stand Age and Stand Factors on Carbon Allocation
R/S ratio is a key indicator of vegetation carbon allocation. It has been widely used in carbon storage estimation, and is also a critical parameter in terrestrial ecosystem C modeling [51,52]. Some studies have reported no significant correlation between R/S ratio and stand age [53,54], and our findings were similar. However, other studies have found significant correlation between R/S ratio and stand age [55,56]. Guo et al. [15] showed that stand age and R/S ratio were positively correlated in coniferous forests across China, but no significant correlation was observed in broad-leaved forests. These finding suggest that the direct effect of stand age on R/S ratio may be weak, and that stand age may affect R/S ratio via other abiotic and biotic factors [15]. Consequently, the correlation between R/S ratio and stand age was frequently reported to be different among studies.
Many studies have found that R/S ratio decreases with increased mean DBH [15,32]. This trend is a natural consequence of plant ontogeny, caused by the accumulation of aboveground biomass in woody tissues as a stand develops [57,58]. However, our results showed that R/S ratio was positively correlated with mean DBH. This contrasting pattern from previous studies actually reflects the strong effect of species composition changes during forest succession. The above- and belowground biomass allocation differed markedly among functional groups and tree species [59]. In our case, mean DBH was lower in early successional stages. These stands were composed of pioneer species with lower needs for water, and thus allocated less carbon resources to root. On the other hand, the dominant species (e.g., Korean pine) at latter successional stage (with higher mean DBH) are far more water-demanding, which lead to higher ratio of carbon allocation to root system.
Previous studies have found that forest biomass is closely related to forest height [26,27]. Our results also illustrated that there was a significant positive correlation between above- and belowground vegetation carbon storage and Heightmax, and thus again supported the effort to map forest biomass with forest height. Our results also showed that understory/tree ratio was negatively related with DBHmax and Heightmax. Understory plants are clearly influenced by canopy layer. Allometric theory predicts that large (all) trees have large canopies with greater leaf biomass, which greatly reduced the light resources available for understory growth [29,60]. This explains why understory/tree ratio was more related to DBHmax and Heightmax instead of other stand factors.
4.3. Effects of Succession, Stand Age and Stand Factors on Carbon Storage Allocation
Our results illustrate that the joint effect of succession, stand age and stand factors (Hm, Den) have the largest contribution on above- and belowground vegetation carbon storage. During forest succession, species composition, stand age and stand factors changed simultaneously, and thus these factors work together affecting vegetation carbon storage. The vegetation aboveground carbon was also affected by the joint effect between succession and stand factors, but little affected by the pure effect of stand age, suggesting that stand age affects aboveground biomass mainly via species composition and stand factors. Species composition showed a high contribution to vegetation belowground carbon. Species-rich stands can make full use of space to obtain resources [61,62], which may promote root biomass and productivity by increased filling of soil volume, reduce competition and/or alter morphological and physiological plasticity [62,63,64].
The joint effect of succession and stand factors explained 41.25% of variation in R/S ratio. Plants allocate their biomass in order to maximize the capture of limited resources in accordance with optimal partitioning theory, which is an inherent survival strategy adapted to environmental conditions [65]. The change of species composition with the succession also explained 21.83% of the variation in R/S ratio, which again support our hypothesis that the positive correlation between R/S ratio and mean DBH is actually caused by species replacement with the succession. Our results showed that understory/tree ratio was mainly affected by the combination of succession, stand age, and stand factors. In the process of stand development, canopy density of the tree layer is increased, which limited the utilization of light resources and the development of understory vegetation, reaching mature stand, understory species capable to persist survive under reduced light availability, mainly by traits and resource strategies that should be shared across species to promote persistence under closed canopy conditions [66,67,68]. We also showed that the pure effect of succession explained 25.84% of variation in understory/tree ratio. This suggest that the tree species change during forest succession strongly affect the light available for understory plants growth, which in turn determine understory carbon storage.
In contrast to vegetation carbon, stand factors showed the strongest effect on soil carbon storage. Production and input of litterfall and fine roots are key process linking soil carbon inputs in the terrestrial ecosystem [45]. Some studies showed that litterfalls decomposition period and coefficient change with changing stand density. In a certain range, decreased stand density can promote nutrients release, and reasonable improvement of stand density contributes to nutrient flow [69]. Forest height can also reflect canopy structure and site conditions, and indirectly affect the litterfall decomposition. Most of the variation was explained between succession and stand age on Soil/Vegetation ratio. Soil not only affects the occurrence, development, and succession rate of vegetation communities in a certain period of time, but also determines succession direction in the similar climate zones. Forest types with different species composition and community structure can affect soil microbes or soil animals by the rational utilization of light, redistribution of precipitation, and soil temperature [70], and indirectly affect soil organic carbon [71,72]. With stand age increasing, the accumulation of vegetation biomass and carbon allocation also changed, which affected soil carbon pool and carbon sequestration potential in forest ecosystem [73,74].
5. Conclusions
This study reveals the relative importance of successional stages, stand age and stand structure on carbon storages and allocation pattern in a temperate forest ecosystem. We showed that the replacement of species composition during forest succession is critical for biomass allocation. However, the role of species composition has not yet received enough attention in previous studies, compared with stand age and stand factors. Our results suggest that it is critical to adopt a forest management strategy to promote forest succession to increase the carbon storage. We also demonstrated that soil carbon storage is closely correlated with stand structure, and that litterfalls may act as a main input source of soil carbon. Our results suggest that more attention should be paid to examine the influence of stand factor and litterfalls on soil carbon sequestration, for a better understanding of soil carbon sequestration. We studied the difference between natural forests and secondary forests, but the difference between planted forests will need further study in order to increase forest carbon storage and contribute to the maximization of the global carbon budget.
Author Contributions
X.W. (Xiangping Wang) and X.W. (Xuemei Wang) designed the experiments. X.W. (Xuemei Wang) analyzed the dada; X.G., X.W. (Xuemei Wang), and others conducted field investigation; X.W. (Xuemei Wang) wrote the main manuscript. X.W. (Xiangping Wang) and Z.G. revised the manuscript. All authors have read and agreed to the published version of the manuscript.
Funding
This research was supported by the National Natural Science Foundation of China (#31870430), the National Key Research and Development Program of China (#2017YFC0503901) and the National Special Water Programs of China (2017ZX07101002).
Conflicts of Interest
The authors declare no conflict of interest.
Appendix A
Table A1.
Equations for calculating Stem, Branch, Leaf and Roots biomass of dominant tree species used in this study. D and H are diameter at breast height (cm), and height (m) of a tree, respectively. W is the biomass of the respective tree component (kg).
Table A1.
Equations for calculating Stem, Branch, Leaf and Roots biomass of dominant tree species used in this study. D and H are diameter at breast height (cm), and height (m) of a tree, respectively. W is the biomass of the respective tree component (kg).
| Tree Species | Components | Equations | R2 | N | References |
|---|---|---|---|---|---|
| Betula platyohylla | Stem | W = 0.01175 × (D2H)1.10252 | 0.970 | 30 | [75] |
| Branch | W = 0.01024 × (D2H)0.80547 | 0.970 | 30 | ||
| Leaf | W = 0.01347 × (D2H)0.64947 | 0.900 | 30 | ||
| Roots | W = 0.04887 × (D2H)0.63246 | 0.960 | 30 | ||
| Larix gmelinii | Stem | W = 0.01302 × (D2H)1.02154 | 0.990 | 30 | [75] |
| Branch | W = 0.00129 × (D2H)1.03998 | 0.920 | 30 | ||
| Leaf | W = 0.01112 × (D2H)0.63745 | 0.950 | 30 | ||
| Roots | W = 0.04125 × (D2H)0.68451 | 0.960 | 30 | ||
| Pinus koraiensis | Stem | W = 0.04665 × (D2H)0.90237 | 0.970 | 30 | [75] |
| Branch | W = 0.03123 × (D2H)0.61248 | 0.990 | 30 | ||
| Leaf | W = 0.01235 × (D2H)0.64347 | 0.950 | 30 | ||
| Roots | W = 0.00925 × (D2H)0.73965 | 0.960 | 30 | ||
| Populous davidiana | Stem | W = 0.23514 × (D2H)0.85324 | 0.930 | 30 | [75] |
| Branch | W = 0.02154 × (D2H)0.86215 | 0.980 | 30 | ||
| Leaf | W =0.00979 × (D2H)0.85614 | 0.960 | 30 | ||
| Roots | W =0.12587 × (D2H)0.55874 | 0.980 | 30 | ||
| Quercus mongolica | Stem | W = 0.01197 × (D2H)1.09248 | 0.910 | 30 | [75] |
| Branch | W = 0.00845 × (D2H)0.89418 | 0.920 | 30 | ||
| Leaf | W = 0.00979 × (D2H)0.85614 | 0.960 | 30 | ||
| Roots | W = 0.12587 × (D2H)0.55874 | 0.980 | 30 | ||
| Picea koraiensis | Stem | W = 0.32291 × (D2H)0.67919 | 0.970 | 30 | [75] |
| Branch | W = 0.02257 × (D2H)0.63564 | 0.900 | 30 | ||
| Leaf | W = 0.00418 × (D2H)0.82135 | 0.920 | 30 | ||
| Roots | W = 0.01154 × (D2H)0.81234 | 0.940 | 30 | ||
| Tilia amurensis | Stem | W = 0.03097 × D2.686 | 0.988 | - | [75] |
| Branch | W = 0.00366 × D2.847 | 0.908 | - | ||
| Leaf | W = 0.00169 × D2.507 | 0.897 | - | ||
| Roots | W = 0.01507 × D2.507 | 0.966 | - | ||
| Phellodendron amurense | Stem | W = 0.10375 × D2.168 | 0.973 | - | [76] |
| Branch | W = 0.00285 × D2.873 | 0.952 | - | ||
| Leaf | W = 0.00195 × D2.479 | 0.985 | - | ||
| Roots | W = 0.01000 × D2.617 | 0.984 | - |
Appendix B
Table A2.
Equations for calculating Stem, Leaf and Roots biomass (kg) of dominant shrub species used in this study (N = 15). Equations follow the form W= a × (D02·H)b, where a and b are the equation parameters, D0 and H are basal diameter (cm), and height (m) of a shrub, respectively, W is the biomass of the respective tree component (kg).
| Species | Components | a | b | R2 |
|---|---|---|---|---|
| Corylus heterophylla | Stem | 0.0247 | 1.1696 | 0.9882 |
| Leaf | 0.0078 | 1.003 | 0.9009 | |
| Roots | 0.0276 | 0.4226 | 0.8003 | |
| Spiraea Salicifolia | Stem | 0.0362 | 0.9187 | 0.8415 |
| Leaf | 0.0061 | 0.6925 | 0.7003 | |
| Roots | 0.015 | 0.8322 | 0.7319 | |
| Lespedeza bicolor | Stem | 0.0289 | 1.1759 | 0.8164 |
| Leaf | 0.0078 | 0.9374 | 0.6038 | |
| Roots | 0.0344 | 1.0607 | 0.7378 | |
| Sorbaria sorbifolia | Stem | 0.0253 | 1.3239 | 0.8827 |
| Leaf | 0.0125 | 1.3635 | 0.8197 | |
| Roots | 0.0082 | 0.7442 | 0.8284 | |
| Rhododendron dauricum | Stem | 0.0205 | 1.0583 | 0.9147 |
| Leaf | 0.0024 | 0.6501 | 0.7212 | |
| Roots | 0.0095 | 1.1302 | 0.7969 |
Appendix C

Figure A1.
The diagnostics plots of multiple regression model.
References
- Pan, Y.; Birdsey, R.A.; Fang, J.; Houghton, R.; Kauppi, P.E.; Kurz, W.A.; Phillips, O.L.; Shvidenko, A.; Lewis, S.L.; Canadell, J.G. A large and persistent carbon sink in the world’s forests. Science 2011, 333, 988–993. [Google Scholar] [CrossRef] [PubMed]
- White, A.; Cannell, M.; Friend, A. The high-latitude terrestrial carbon sink: A model analysis. Glob. Chang. Biol. 2000, 6, 227–245. [Google Scholar] [CrossRef]
- Fang, J.; Piao, S.; Zhao, S. The carbon sink: The role of the middle and high latitudes terrestrial ecosystems in the northern hemisphere. Acta Phytoecol. Sin. 2001, 25, 594–602. [Google Scholar]
- Goodale, C.L.; Apps, M.J.; Birdsey, R.A.; Field, C.B.; Heath, L.S.; Houghton, R.A.; Jenkins, J.C.; Kohlmaier, G.H.; Kurz, W.; Liu, S. Forest carbon sinks in the Northern Hemisphere. Ecol. Appl. 2002, 12, 891–899. [Google Scholar] [CrossRef]
- Zhao, J.; Kang, F.; Wang, L.; Yu, X.; Zhao, W.; Song, X.; Zhang, Y.; Chen, F.; Sun, Y.; He, T. Patterns of biomass and carbon distribution across a chronosequence of Chinese pine (Pinus tabulaeformis) forests. PLoS ONE 2014, 9, e94966. [Google Scholar] [CrossRef]
- Houghton, R. Aboveground forest biomass and the global carbon balance. Glob. Chang. Biol. 2005, 11, 945–958. [Google Scholar] [CrossRef]
- Liu, W.W.; Wang, X.K.; Fei, L.U.; Ouyang, Z.Y. Regional and global estimates of carbon stocks and carbon sequestration capacity in forest ecosystems: A review. Chin. J. Appl. Ecol. 2015, 26, 2881–2890. [Google Scholar]
- Ming, A.; Jia, H.; Tian, Z.; Tao, Y.; Lu, L.; Cai, D.; Shi, Z.; Wang, W. Characteristics of carbon storage and its allocation in Erythrophleum fordii plantations with different ages. Chin. J. Appl. Ecol. 2014, 25, 940. [Google Scholar]
- Zhu, J.; Zhou, X.; Fang, W.; Xiong, X.; Zhu, B.; Ji, C.; Fang, J. Plant Debris and Its Contribution to Ecosystem Carbon Storage in Successional Larix gmelinii Forests in Northeastern China. Forests 2017, 8, 191. [Google Scholar] [CrossRef]
- Pregitzer, K.S.; Euskirchen, E.S. Carbon cycling and storage in world forests: Biome patterns related to forest age. Glob. Chang. Biol. 2004, 10, 2052–2077. [Google Scholar] [CrossRef]
- Wei, Y.; Li, M.; Chen, H.; Lewis, B.J.; Yu, D.; Zhou, L.; Zhou, W.; Fang, X.; Zhao, W.; Dai, L. Variation in Carbon Storage and Its Distribution by Stand Age and Forest Type in Boreal and Temperate Forests in Northeastern China. PLoS ONE 2013, 8, e72201. [Google Scholar] [CrossRef]
- Chen, Y.; Liu, Z.; Rao, X.; Wang, X.; Liang, C.; Lin, Y.; Zhou, L.; Cai, X.-A.; Fu, S. Carbon storage and allocation pattern in plant biomass among different forest plantation stands in Guangdong, China. Forests 2015, 6, 794–808. [Google Scholar] [CrossRef]
- Zhou, X.; Cai, Q.; Xiong, X.; Fang, W.; Zhu, J.; Zhu, J.; Ji, C. Ecosystem carbon stock and within-system distribution in successional Fagus lucida forests in Mt. Yueliang, Guizhou, China. Chin. J. Plant Ecol. 2018, 42, 703–712. [Google Scholar]
- Ouyang, S.; Xiang, W.; Wang, X.; Xiao, W.; Chen, L.; Li, S.; Sun, H.; Deng, X.; Forrester, D.I.; Zeng, L.; et al. Effects of stand age, richness and density on productivity in subtropical forests in China. J. Ecol. 2019, 107, 2266–2277. [Google Scholar] [CrossRef]
- Guo, B.; Zhong, Q.; Ma, Y.; Lu, H.; Jin, B.; Li, M.; Zheng, Y.; Cheng, D. The effect of stand and climatic factors on the root–shoot allocation in Chinese natural forest. Chin. J. Appl. Environ. Biol. 2016, 22, 326–331. [Google Scholar]
- Zhang, Q.; Wang, C. Carbon density and distribution of six Chinese temperate forests. Sci. China Life Sci. 2010, 53, 831–840. [Google Scholar] [CrossRef] [PubMed]
- Liu, X.; Trogisch, S.; He, J.-S.; Niklaus Pascal, A.; Bruelheide, H.; Tang, Z.; Erfmeier, A.; Scherer-Lorenzen, M.; Pietsch Katherina, A.; Yang, B.; et al. Tree species richness increases ecosystem carbon storage in subtropical forests. Proc. R. Soc. B Biol. Sci. 2018, 285, 20181240. [Google Scholar] [CrossRef] [PubMed]
- He, Y.; Qin, L.; Li, Z.; Liang, X.; Shao, M.; Tan, L. Carbon storage capacity of monoculture and mixed-species plantations in subtropical China. For. Ecol. Manag. 2013, 295, 193–198. [Google Scholar] [CrossRef]
- Yang, T. Study on the Characteristics of Carbon Storage and Pattern in the Secondary Succession of Forest Communities in Karst Area; Southwest University: Chongqing, China, 2016. [Google Scholar]
- Zhu, J.; Hu, H.; Tao, S.; Chi, X.; Li, P.; Jiang, L.; Ji, C.; Zhu, J.; Tang, Z.; Pan, Y. Carbon stocks and changes of dead organic matter in China’s forests. Nat. Commun. 2017, 8, 151. [Google Scholar] [CrossRef] [PubMed]
- Barry, K.E.; Mommer, L.; van Ruijven, J.; Wirth, C.; Wright, A.J.; Bai, Y.; Connolly, J.; De Deyn, G.B.; de Kroon, H.; Isbell, F. The future of complementarity: Disentangling causes from consequences. Trends Ecol. Evol. 2018, 34, 167–180. [Google Scholar] [CrossRef] [PubMed]
- Zhang, Y.; Chen, H.Y. Individual size inequality links forest diversity and above-ground biomass. J. Ecol. 2015, 103, 1245–1252. [Google Scholar] [CrossRef]
- Forrester, D.I.; Bauhus, J. A review of processes behind diversity—Productivity relationships in forests. Curr. For. Rep. 2016, 2, 45–61. [Google Scholar] [CrossRef]
- Morin, X. Species richness promotes canopy packing: A promising step towards a better understanding of the mechanisms driving the diversity effects on forest functioning. Funct. Ecol. 2015, 29, 993–994. [Google Scholar] [CrossRef]
- Forrester, D.I.; Ammer, C.; Annighöfer, P.J.; Barbeito, I.; Bielak, K.; Bravo-Oviedo, A.; Coll, L.; del Río, M.; Drössler, L.; Heym, M. Effects of crown architecture and stand structure on light absorption in mixed and monospecific Fagus sylvatica and Pinus sylvestris forests along a productivity and climate gradient through Europe. J. Ecol. 2018, 106, 746–760. [Google Scholar] [CrossRef]
- Wang, X.; Ouyang, S.; Sun, O.J.; Fang, J. Forest biomass patterns across northeast China are strongly shaped by forest height. For. Ecol. Manag. 2013, 293, 149–160. [Google Scholar] [CrossRef]
- Wu, X.; Wang, X.; Wu, Y.; Xia, X.; Fang, J. Forest biomass is strongly shaped by forest height across boreal to tropical forests in China. J. Plant Ecol. 2015, 8, 559–567. [Google Scholar] [CrossRef]
- Bastin, J.F.; Rutishauser, E.; Kellner, J.R.; Saatchi, S.; Pélissier, R.; Hérault, B.; Slik, F.; Bogaert, J.; De Cannière, C.; Marshall, A.R. Pan-tropical prediction of forest structure from the largest trees. Glob. Ecol. Biogeogr. 2018, 27, 1366–1383. [Google Scholar] [CrossRef]
- Lutz, J.A.; Furniss, T.J.; Johnson, D.J.; Davies, S.J.; Allen, D.; Alonso, A.; Anderson-Teixeira, K.J.; Andrade, A.; Baltzer, J.; Becker, K.M. Global importance of large-diameter trees. Glob. Ecol. Biogeogr. 2018, 27, 849–864. [Google Scholar] [CrossRef]
- Liang, P.; Wang, X.; Wu, Y.; Xu, K.; Wu, P.; Guo, X. Growth responses of broad-leaf and Korean pine mixed forests at different successional stages to climate change in the Shengshan Nature Reserve of Heilongjiang Province, China. Chin. J. Plant Ecol. 2016, 40, 425–435. [Google Scholar]
- Zhou, Y. Vegetation Geography in Northeast China; Sciense Press: Beijing, China, 1997. [Google Scholar]
- Wang, X.; Fang, J.; Zhu, B. Forest biomass and root–shoot allocation in northeast China. For. Ecol. Manag. 2008, 255, 4007–4020. [Google Scholar] [CrossRef]
- Fang, J.; Wang, X.; Shen, Z.; Tang, Z.; He, J.; Yu, D.; Jiang, Y.; Wang, Z.; Zheng, C.; Zhu, J. Methods and protocols for plant community inventory. Biodivers. Sci. 2009, 17, 533–548. [Google Scholar]
- Kang, X. Forest Management; Higher Education Press: Beijing, China, 2010. [Google Scholar]
- Tan, J. Quantitative relationship between age and mean diameter of Larix gmelinii natural forest. For. Sci. Technol. 1990, 8, 21–22. [Google Scholar]
- Zhang, C.; Ju, W.; Chen, J.M.; Li, D.; Wang, X.; Fan, W.; Li, M.; Zan, M. Mapping forest stand age in China using remotely sensed forest height and observation data. J. Geophys. Res. Biogeosci. 2014, 119, 1163–1179. [Google Scholar] [CrossRef]
- Fang, J. Changes in Forest Biomass Carbon Storage in China between 1949 and 1998. Science 2001, 292, 2320–2322. [Google Scholar] [CrossRef] [PubMed]
- Heikkinen, R.K.; Luoto, M.; Kuussaari, M.; Pöyry, J. New insights into butterfly–environment relationships using partitioning methods. Proc. R. Soc. B Biol. Sci. 2005, 272, 2203–2210. [Google Scholar] [CrossRef] [PubMed]
- Zhou, Y.-R.; Yu, Z.-L.; Zhao, S.-D. Carbon storage and budget of major Chinese forest types. Acta Phytoecol. Sin. 2000, 24, 518–522. [Google Scholar]
- Li, K.; Wang, S.; Cao, M. Vegetation and soil carbon storage in China. Sci. China Ser. D Earth Sci.-Engl. Ed. 2003, 47, 49–57. [Google Scholar] [CrossRef]
- Xie, X.; Sun, B.; Zhou, H. Soil carbon stocks and their influencing factors under native vegetations in China. Acta Pedol. Sin. 2004, 41, 699–705. [Google Scholar]
- Wei, Y.W.; Yu, D.-P.; Wang, Q.J.; Zhou, L.; Zhou, W.M.; Fang, X.M.; Gu, X.-P.; Dai, L.M. Soil organic carbon density and its influencing factors of major forest types in the forest region of Northeast China. Chin. J. Appl. Ecol. 2013, 24, 3333–3340. (In Chinese) [Google Scholar]
- Hooker, T.D.; Compton, J.E. Forest ecosystem carbon and nitrogen accumulation during the first century after agricultural abandonment. Ecol. Appl. 2003, 13, 299–313. [Google Scholar] [CrossRef]
- Ostertag, R.; Marín-Spiotta, E.; Silver, W.L.; Schulten, J. Litterfall and decomposition in relation to soil carbon pools along a secondary forest chronosequence in Puerto Rico. Ecosystems 2008, 11, 701. [Google Scholar] [CrossRef]
- Deng, L.; Wang, K.; Zhu, G.; Liu, Y.; Chen, L.; Shangguan, Z. Changes of soil carbon in five land use stages following 10 years of vegetation succession on the Loess Plateau, China. Catena 2018, 171, 185–192. [Google Scholar] [CrossRef]
- Zhang, K.; Cheng, X.; Dang, H.; Ye, C.; Zhang, Y.; Zhang, Q. Linking litter production, quality and decomposition to vegetation succession following agricultural abandonment. Soil Biol. Biochem. 2013, 57, 803–813. [Google Scholar] [CrossRef]
- Lü, X. Effects of Forest Litter Decomposition on Soil Properties in Maoershan Region; Northeast Forest University: Harbin, China, 2006. [Google Scholar]
- Wardle, D.A.; Nilsson, M.-C.; Zackrisson, O.; Gallet, C. Determinants of litter mixing effects in a Swedish boreal forest. Soil Biol. Biochem. 2003, 35, 827–835. [Google Scholar] [CrossRef]
- Hou, L.; Mao, Z.; Sun, T. Dynamic of litterfall in ten typical community types of Xiaoxing′an Mountain, China. Acta Ecol. Sin. 2013, 33, 1994–2002. [Google Scholar]
- Dixon, R.K.; Solomon, A.; Brown, S.; Houghton, R.; Trexier, M.; Wisniewski, J. Carbon pools and flux of global forest ecosystems. Science 1994, 263, 185–190. [Google Scholar] [CrossRef]
- Baskaran, P.; Hyvönen, R.; Berglund, S.L.; Clemmensen, K.E.; Ågren, G.I.; Lindahl, B.D.; Manzoni, S. Modelling the influence of ectomycorrhizal decomposition on plant nutrition and soil carbon sequestration in boreal forest ecosystems. New Phytol. 2017, 213, 1452–1465. [Google Scholar] [CrossRef]
- Wang, Y.; Deng, L.; Wu, G.; Wang, K.; Shangguan, Z. Large-scale soil organic carbon mapping based on multivariate modelling: The case of grasslands on the Loess Plateau. Land Degrad. Dev. 2018, 29, 26–37. [Google Scholar] [CrossRef]
- Wang, J.; Fan, X.; Fan, J.; Zhang, C.; Xia, F. Effects of Tree Competition on the Biomass Partitioning of Abies nephrolepis. Sci. Silvae Sin. 2012, 48, 14–20. [Google Scholar]
- Li, C. Biomass Partitioning of Lacebark Pine and It’s Tree-ring Growth in Relation to Climatic factors; Beijing Forestry University: Beijing, China, 2013. [Google Scholar]
- Peri, P.L.; Gargaglione, V.; Pastur, G.M. Dynamics of above-and below-ground biomass and nutrient accumulation in an age sequence of Nothofagus antarctica forest of Southern Patagonia. For. Ecol. Manag. 2006, 233, 85–99. [Google Scholar] [CrossRef]
- Lim, H.; Lee, K.-H.; Lee, K.H.; Park, I.H. Biomass expansion factors and allometric equations in an age sequence for Japanese cedar (Cryptomeria japonica) in southern Korea. J. For. Res. 2013, 18, 316–322. [Google Scholar] [CrossRef]
- McConnaughay, K.; Coleman, J. Biomass allocation in plants: Ontogeny or optimality? A test along three resource gradients. Ecology 1999, 80, 2581–2593. [Google Scholar] [CrossRef]
- Mokany, K.; Raison, R.J.; Prokushkin, A.S. Critical analysis of root: Shoot ratios in terrestrial biomes. Glob. Chang. Biol. 2005, 12, 84–96. [Google Scholar] [CrossRef]
- Shibistova, O.; Yohannes, Y.; Boy, J.; Richter, A.; Wild, B.; Watzka, M.; Guggenberger, G. Rate of belowground carbon allocation differs with successional habit of two afromontane trees. PLoS ONE 2012, 7, e45540. [Google Scholar] [CrossRef]
- Van Pelt, R.; Sillett, S.C.; Kruse, W.A.; Freund, J.A.; Kramer, R.D. Emergent crowns and light-use complementarity lead to global maximum biomass and leaf area in Sequoia sempervirens forests. For. Ecol. Manag. 2016, 375, 279–308. [Google Scholar] [CrossRef]
- Lei, P.; Scherer-Lorenzen, M.; Bauhus, J. The effect of tree species diversity on fine-root production in a young temperate forest. Oecologia 2012, 169, 1105–1115. [Google Scholar] [CrossRef] [PubMed]
- Brassard, B.W.; Chen, H.Y.; Cavard, X.; Laganière, J.; Reich, P.B.; Bergeron, Y.; Pare, D.; Yuan, Z. Tree species diversity increases fine root productivity through increased soil volume filling. J. Ecol. 2013, 101, 210–219. [Google Scholar] [CrossRef]
- Hodge, A. The plastic plant: Root responses to heterogeneous supplies of nutrients. New Phytol. 2004, 162, 9–24. [Google Scholar] [CrossRef]
- Rajaniemi, T.K. Root foraging traits and competitive ability in heterogeneous soils. Oecologia 2007, 153, 145–152. [Google Scholar] [CrossRef]
- Yang, Y.; Dou, Y.; An, S.; Zhu, Z. Abiotic and biotic factors modulate plant biomass and root/shoot (R/S) ratios in grassland on the Loess Plateau, China. Sci. Total Environ. 2018, 636, 621–631. [Google Scholar] [CrossRef]
- Campetella, G.; Botta-Dukát, Z.; Wellstein, C.; Canullo, R.; Gatto, S.; Chelli, S.; Mucina, L.; Bartha, S. Patterns of plant trait–environment relationships along a forest succession chronosequence. Agric. Ecosyst. Environ. 2011, 145, 38–48. [Google Scholar] [CrossRef]
- Lohbeck, M.; Poorter, L.; Lebrija-Trejos, E.; Martínez-Ramos, M.; Meave, J.A.; Paz, H.; Pérez-García, E.A.; Romero-Pérez, I.E.; Tauro, A.; Bongers, F. Successional changes in functional composition contrast for dry and wet tropical forest. Ecology 2013, 94, 1211–1216. [Google Scholar] [CrossRef] [PubMed]
- Landuyt, D.; Perring, M.P.; Seidl, R.; Taubert, F.; Verbeeck, H.; Verheyen, K. Modelling understorey dynamics in temperate forests under global change–Challenges and perspectives. Perspect. Plant Ecol. Syst. 2018, 31, 44–54. [Google Scholar] [CrossRef] [PubMed]
- Ling, L.; Wang, H.; Yang, X.; Xu, L.; Ren, L. Soil Organic Carbon and Nutrients in Natural Larix olgensis at Different Stand Densities. J. Northeast For. Univ. 2013, 41, 51–55. [Google Scholar]
- Hagen-Thorn, A.; Callesen, I.; Armolaitis, K.; Nihlgård, B. The impact of six European tree species on the chemistry of mineral topsoil in forest plantations on former agricultural land. For. Ecol. Manag. 2004, 195, 373–384. [Google Scholar] [CrossRef]
- Lü, F.-M.; Lü, X.-T.; Liu, W.; Han, X.; Zhang, G.-M.; Kong, D.-L.; Han, X.-G. Carbon and nitrogen storage in plant and soil as related to nitrogen and water amendment in a temperate steppe of northern China. Biol. Fertil. Soils 2011, 47, 187–196. [Google Scholar] [CrossRef]
- Lange, M.; Eisenhauer, N.; Sierra, C.A.; Bessler, H.; Engels, C.; Griffiths, R.I.; Mellado-Vázquez, P.G.; Malik, A.A.; Roy, J.; Scheu, S. Plant diversity increases soil microbial activity and soil carbon storage. Nat. Commun. 2015, 6, 6707. [Google Scholar] [CrossRef]
- De Kovel, C.F.; Wilms, Y.; Berendse, F. Carbon and nitrogen in soil and vegetation at sites differing in successional age. Plant Ecol. 2000, 149, 43–50. [Google Scholar] [CrossRef]
- Feldpausch, T.R.; Rondon, M.A.; Fernandes, E.C.; Riha, S.J.; Wandelli, E. Carbon and nutrient accumulation in secondary forests regenerating on pastures in central Amazonia. Ecol. Appl. 2004, 14, 164–176. [Google Scholar] [CrossRef]
- Hu, H.Q.; Luo, B.Z.; Wei, S.J.; Wei, S.W.; Sun, L.; Luo, S.S.; Ma, H.B. Biomass carbon density and carbon sequestration capacity in seven typical forest types of the Xiaoxing’an Mountains, China. Chin. J. Plant Ecol. 2015, 39, 140–158. [Google Scholar]
- Zhang, Y.; Cheng, M.C.; Zheng, T.; Li, N.N. Ecosystem carbon storage of natural secondary birch forests in Xiaoxing’an Mountains of China. J. Beijing For. Univ. 2015, 37, 38–47. [Google Scholar]
© 2020 by the authors. Licensee MDPI, Basel, Switzerland. This article is an open access article distributed under the terms and conditions of the Creative Commons Attribution (CC BY) license (http://creativecommons.org/licenses/by/4.0/).