Quantifying Ecosystem Service Trade-Offs to Inform Spatial Identification of Forest Restoration


1
State Key Laboratory of Urban and Regional Ecology, Research Center for Eco-Environmental Sciences, Chinese Academy of Science, Beijing 100085, China
2
University of Chinese Academy of Sciences, Beijing 100049, China
*
Author to whom correspondence should be addressed.
Forests 2020, 11(5), 563; https://doi.org/10.3390/f11050563
Submission received: 27 March 2020
/
Revised: 13 May 2020
/
Accepted: 14 May 2020
/
Published: 17 May 2020
(This article belongs to the Section Forest Ecology and Management)
Abstract
:Specific forest restoration aims to maximum ecosystem services (ESs); however, the complex trade-offs among ecosystem services pose considerable challenges for fulfilling such goals. Based on forest restoration on Hainan Island, China, we integrated spatially explicit models of ecosystem services and spatial prioritization techniques based on the efficiency frontier between habitat quality and plantation revenue to analyze the impacts of decision-makers’ preferences on optimal configurations of forest restoration. We then investigated the effects of different optimal restoration schemes on water purification, soil retention, carbon sequestration, and coastal hazard mitigation. Based on our results, plantation revenue and habitat quality exhibited an obvious trade-off during the process of restoration. Forest restoration patterns also varied with the degree of preference for plantation yield or habitat quality, indicating that understanding ecosystem service tradeoffs can support the optimal selection of forest restoration schemes under different preferences. However, when the values of multiple ecosystem services associated with forest restoration were considered (e.g., water purification, soil retention, carbon sequestration, and coastal hazard mitigation), the optimal solution choice varied. Our results suggest the application of the efficiency frontier can deepen quantitative understanding of ecosystem service trade-offs, and the addition of multi-benefit evaluation based on optimal solutions can provide a more detailed and broader picture of forest restoration plans. Integrated efficiency frontier assessment with the valuation of ecosystem services associated with forest restoration provides a quantitative approach for optimal forest restoration, which can be applied in broad forest restoration programs.
1. Introduction
To fulfill the growing needs of food, timber, fiber, and other goods, many natural habitats have been rapidly converted to human-dominated landscapes. With the rise in land-use intensification, trade-offs among ecosystem services (ESs) can intensify simultaneously [1]. Ecological restoration, as a major strategy to improve ecosystem services and reverse biodiversity losses, has been used worldwide [2]. For example, under the Bonn Challenge, a global effort to restore 350 million hectares of deforested and degraded land to national forest by 2030, over 30 countries have made commitments to undertake restoration activity [3]. However, the great challenges for restoration are the trade-offs between available land resources and increasing demands for better services and the trade-offs among ecosystem services [4,5]. Specifically, for the low-income regions or countries, balancing provision services that might strongly link to local poor livelihoods, and biodiversity and regulating services, is vital for a sustainable development [6]. How to utilize limited restoration resources (e.g., land, funding, labor) to maximize objectives and mitigate conflicts of interests is a key issue in land-use planning. To address these conflicts, the valuation of biodiversity and ecosystem services under different restoration schemes can help reveal the benefits and costs of a given ecological policy [7]. Moreover, a deeper understanding of these potential trade-offs is informative for land-use planning for forest restoration and could increase the comprehensive benefits and sustainability of restoration [8].
Among the many approaches used to depict trade-off relationships among objectives, spatially explicit optimization algorithms based on the efficiency frontier are among the most effective tools [9]. These optimization-based methods state that all services cannot be improved and thus demonstrate all possible solutions under all given constraints [10]. Such results highlight the marginal benefits or costs for any measure and illustrate the chances that largely improve the efficiency of service provision, superior to random plans [11] or even best management practices [12]. For example, Kennedy, et al. [13] applied the efficiency frontier to mitigate the trade-offs among agricultural production, biodiversity conservation, and fresh water purification. Optimization algorithms propose various optimal solutions by varying the preferences from decision-makers or up to more than 40 stakeholders among multiple competing services in forest management planning [14,15]. For example, Tóth and McDill [16] presented four modified bi-objective generating techniques to produce the set of Pareto optimal solutions to spatial forest planning problems with three or more competing objectives. Marto et al. [17] used a spatial multiple-criteria decision analysis to assess the aggregate performance of points on the Pareto frontier with respect to their utility for delivery of woods-dominated services. Although Pareto frontier method does not require stakeholders to state preferences in terms of ecosystem services target levels, to deeply and fully understand the potential consequences of each optimal solution in other terms is informative for decision-makers to choose a final scheme. Hence, some simple but powerful approaches to illustrate and visualize the potential performance of the optimal solutions are necessary.
Forest restoration focuses on concerned targets, such as suppression of global forest cover loss and degradation [18]. A multifunctional forest should also include multiple other values [15], like provision of ecosystem services and natural habitat for biodiversity, that are well reflected in the targets of the Sustainable Development Goals (SDGs), United Nations Framework of the Convention on Climate Change (UNFCCC), and United Nations Convention to Combat Desertification (UNCCD) [19]. For example, through a long-term investment in natural restoration, China has experienced significant improvement in food production, carbon sequestration, soil retention, sandstorm prevention, and flood mitigation [20]. Furthermore, effective assessment for the expected outcomes is also an important task to promote the success of restorations. There are two kinds of evaluation in current assessments of ecosystem services: biophysical and monetary evaluation [21]. The former reflects realistic contributions from ecosystems with fidelity and the latter offers comparable results among distinct services. The two-unit assessment is applied in evaluating the contribution of nature to human well-being to support sustainable decision-making, like Gross Ecosystem Product accounting [22]. Moreover, consideration of multiple ecosystem services combined with the two-unit evaluation method could facilitate the communication and negotiation across various stakeholders with explicit demands or interests. However, this multi-dimensional, quantified approach to explicitly account for trade-offs is not adequately reflected in current land-use planning [23].
Hainan Island, China, is a global biodiversity hotspot [24] and home to several national conservation areas. However, the region has experienced fast and large-scale plantation expansion over the past several decades [25,26]. On the one hand, these plantations support local rural livelihoods and the economy [27]; on the other hand, however, the vast land-use change has generated negative externalities, including detriments on biodiversity, water quality, soil retention, and coastal hazard defense [25,28,29]. Hainan Island hence is a typical case featured by ecological conservation intertwined with poverty reduction. To reverse the degraded ecosystems and enforce the ecological security, a natural forest restoration plan (a 359-km2 goal for afforestation by nature-oriented measures with indigenous vegetation by 2050) is about to initiate in Hainan [30]. However, it is still a key issue how to mitigate conflicts of interest and maximize the desired multiple objectives by the forest restoration program. To fill the aforementioned gaps, we used Hainan Island as an ideal study area, and attempted to answer two research questions: (1) How does forest restoration influence the relationship between plantation revenue and biodiversity conservation? and (2) How can multiple ecosystem service trade-offs be integrated to inform forest restoration implementation?
2. Materials and Methods
2.1. Study Area
Hainan Island (33,900 km2) is located along the southern coast of mainland China (Figure 1) and is the largest island in the Indo-Burma biodiversity hotspot [24]. The island is characterized by a tropical monsoon climate and is affected by perennial westward-moving storms from the South China Sea. Tropical typhoons can lead to dramatic loss and damage for local people and property, especially in areas along the north-east-south coastline, which experiences the highest frequency of typhoon landfall incidents [28,31].
The interior uplands of Hainan are defined as a national “Ecological Function Conservation Area” (EFCA; Figure 1). EFCAs focus on conservation and restoration in places with high biodiversity and ES. The interior areas are home to various rare species and provide critical regulation services (e.g., soil retention, water purification, and carbon sequestration) [29,32,33]. The EFCA covers headstreams of the three largest rivers (Nandu River, Changhua River, and Wanquan River), which supply the majority of water for drinking, irrigation, and other domestic and industrial uses.
Natural forest on the island experienced a considerable decrease from 41.4% in the 1950s to 24.2% in the 2010s [26]. Plantation expansions were identified as the most striking threat to natural forests [25]. Although plantations contribute considerably to the local economy and rural livelihoods [27], they have resulted in a marked reduction in the provision of ESs [29].
2.2. Identifying Potential Areas for Forest Restoration
To improve degraded biodiversity and ecosystem services, the National Forestry and Grassland Administration issued a 359-km2 goal for natural forest restoration on Hainan by 2050 [30].
Here, we projected potential opportunities for natural forest restoration based on three criteria, highlighting areas where natural forests are most likely to be restored: (i) where forest cover was lost for plantations (i.e., garden and rubber land) between 1998 and 2017 [4]; (ii) where plantation lands were of low-quality [34], that is, the relative biomass density (a quality index for forests) was lower than 25% within the same zone after forest site zoning [35]; and (iii) where plantations were planted on steep slopes (>25°) [36,37]. The potential areas deriving from each of above source for conversion of plantations to natural forests are 2457 km2, 4397 km2, and 336 km2, respectively. Despite some spatial coincidences among three sources, the total area is about 6466 km2.
We obtained a restoration pattern by converting these potential areas to natural forest based on land-use patterns in 2017. The potential ES values from forest restoration were the differences in ES values between restored and baseline patterns (i.e., land-use pattern in 2017). To classify land-use and land-cover (LULC) types, we used Landsat-8 images provided by the China Remote Sensing Satellite Ground Station, which has a pixel size of 30 m × 30 m [29].
2.3. Assessing Ecosystem Services
Based on the priorities of restoration and most prominent conflict [27,38], we first identified trade-offs based on the efficiency frontier between plantation revenue (the highest economic support for local households and the economy) and habitat of biodiversity (the most important biological concern for this tropical island). Furthermore, we included a broader set of valuable regulation services (i.e., water purification, soil retention, carbon sequestration, and coastal hazard mitigation) [28,29] and assessed their values in both biophysical and monetary terms under different optimal solutions.
2.3.1. Plantation Revenue
Plantations are the most supportive source of income for 74% of households and provide 46% of their total income in the EFCA of Hainan Island [27]. In terms of household livelihood surveys and land-use data, average forestry profits from garden land and rubber plantations were 3.3 × 10⁴ CNY/ha and 2.1 × 10⁴ CNY/ha (US $1 = 6.6 CNY in 2016), respectively. We summed the revenue of garden land and rubber plantations as plantation revenue.
In reality, plantation revenue varies with location (e.g., slope, soil), hence we spatially adjusted plantation revenue loss (PRL) by soil organic matter (provided by the Environmental Science Institute of Hainan) using the following equation. According to the effect of site condition on revenue, we assumed the range of revenue change to be 10% [39].
where PRLi is the plantation revenue loss of each grid i, PRi is the plantation revenue for grid i, SOMi is the SOM content of each grid i, and SOMmin and SOMmax are the minimum and maximum values of the SOM content across the whole island, respectively.
2.3.2. Habitat Quality
We adopted the spatially explicit habitat quality module of the Integrated Valuation of Ecosystem Services and Tradeoffs (InVEST) v3.5.0 [40] to estimate habitat quality of biodiversity in Hainan, considering the effects of anthropogenic threats on terrestrial habitat. This model, which is based on the hypothesis that areas with higher habitat quality support higher richness of native species, has been successfully applied to estimate the impact of different scenarios of land-use change on terrestrial habitats for biodiversity [41].
Habitat quality in the InVEST model is estimated as a function of: (1) the different anthropogenic threats likely impairing habitat quality, (2) the possible maximum influential distance of threats, (3) the relative power of each threat (i.e., weight), (4) the suitability of each LULC type for providing habitat for biodiversity, and (5) the sensitivity of each LULC type to each threat [41]. All of the parameters for the module are listed in Table 1 and Table 2 [42].
2.3.3. Water Purification
Biophysical Value
We used the Nutrient Delivery Ratio (NDR) module in InVEST v3.5.0 [40] to estimate nitrogen (N) and phosphorus (P) export reductions to address water purification concerns under different land-use scenarios [29]. Since the main pollutant matters of water purification for the local are nitrogen and phosphorus [29]. The NDR model provides results of nutrient export to streams and nutrients retained by each parcel on the landscape.
Monetary Value
We used the average pollutant purification cost for total nitrogen and total phosphorus in China to reflect the value of N and P reduction (1.5 CNY N kg−1 and 2.5 CNY P kg−1, respectively) [43]. The economic value of nutrient reduction under alternative optimal land-use patterns was found by multiplying the difference of annual nutrient export amount between restored pattern and baseline pattern by the unit value of nutrient reduction.
2.3.4. Soil Retention
Biophysical value
Sediment export is a proxy of soil retention, and the sediment delivery ratio model (SDR) in InVEST v3.5.0 generates grid files for sediment export to streams and sediment retained by each pixel on the landscape [29]. We used the reduction in the rate of sediment export to represent the soil retention service. The parameters derived from local studies are provided as follows (Table 4) [29].
Monetary Value
Based on the pattern of sediment movement in China, 24% of sediment from soil loss is deposited in rivers, reservoirs, and lakes [44]. Hence, we used the cost of cleaning sediment for lower sediment siltation in rivers, reservoirs, and lakes to represent the economic value of sediment export reduction (15.2 CNY t−1) [43,45]. The economic value of sediment reduction under an alternative optimal land-use pattern was found by multiplying the difference of annual sediment export amount between restored pattern and baseline pattern by the price of cleaning sediment.
2.3.5. Carbon Sequestration
Biophysical Value
Monetary Value
We used the standard value of US$18.0 tC−1 (119.0 CNY tC−1) as the price of carbon credits, cited as an average of the value of forest carbon transactions in major global markets [46]. The economic value of carbon sequestration under an alternative optimal land-use pattern was found by multiplying the difference of annual carbon sequestration amount between restored pattern and baseline pattern by the price of carbon.
2.3.6. Coastal Hazard Mitigation
Biophysical Value
Tropical storms, as the most destructive natural hazard, directly and seriously damage offshore areas. Coastal protection forests, as one of the most effective bio-shelters, can help reduce damage to people and property and lower investments for engineered defenses [47]. Based on the special regulations of coastal management, a basal forest coastal shelterbelt should reach a width of 200 m [48]. Here, the length of the restored forest belt with a 200-m width along the coastline (LB) was taken as a proxy index for the coastal disaster prevention and mitigation service.
Monetary Value
In Hainan, the most vulnerable areas are located along the north-east-south coastline, i.e., typhoon-prone areas [28,31]. Hence, we considered the mitigation effect of the coastal forest belt within this region. A coastal vegetation belt should encompass a 1 km protective distance [49]; hence, here we used a 1-km inland buffer radius from the 200-m belt as the potential protective area. As restored forests along the coastline may be relatively scattered, we conservatively used the lower threshold contribution rate of coastal shelterbelts to natural disaster reduction [50], based on the following equation:
where VCHM is the economic value of coastal hazard mitigation and Af is the potential protective area (km2). Here, Vf was derived from the average economic loss (7.9 × 10⁶ CNY km−2) by storm hazards (2011–2016) from the Bulletin of Flood and Drought Disasters in Hainan (2017), and Kf was set as 10%.
2.4. Prioritizing Spatial Location for Restoration and Identifying Trade-Off Relationships
Here, the goal of efficiency frontier analysis was to find whole island-level land-use patterns that minimize the loss in plantation revenue for given levels of habitat quality change, and vice versa. We delineated the trade-off between habitat quality and plantation revenue loss based on a two-dimensional graph. We considered two objectives when creating frontiers: (1) maximize improvement of habitat quality, and (2) minimize reductions in plantation revenue compared to baseline (LULC in 2017). The constraint for the optimization algorithm was the 359-km2 restoration area.
Linear programming was running by the Restoration Opportunities Optimization Tool (ROOT), which runs a number of optimization analyses corresponding with different potential prioritizations of each objective [51]. Each of optimization running assigns a different level of prioritization (w) to each objective, so the full set of analyses generates a production possibility frontier. The optimization formula is listed as Equation (3). As w varies from 0 to 1, this objective function shifts from preferring solutions that minimize plantation revenue loss to intermediate solutions and finally to solutions that prefer to maximize habitat quality. For example, when w = 0.25, it means 25% of the maximum habitat quality value.
Taken utility efficiency and general size of compartment into consideration, we set a 1200 m × 1200 m square as a decision unit (d) to optimization. The decision variable for the optimization is xd—the fraction of available area for restoration to allocate in decision unit d [51]. ROOT would determine which decision unit should be chosen for implementation of restoration activity, with the assumption that all potential pixels within a decision unit are either chosen or not (except for the “last” decision unit chosen to fill an area-oriented constraint (i.e., 359 km2 area), which will have a fractional allocation) [51].
where w represents prioritization, and starts from 0 to 1; HQd is the score of improved habitat quality expected from decision unit d under weights w when the potential area within decision unit d is restored, and PRLd is the value of plantation revenue loss expected from unit d under weights (1-w) when the potential area within decision unit d is restored; xd is the fraction of potential area within a decision unit that is for restoration implementation, and Ad is potential area per decision unit d.
3. Results
3.1. Trade-Off between Habitat Quality and Plantation Revenue
Figure 2 exhibits the trade-off relationships between habitat quality and plantation revenue loss under optimal forest restoration. Point A shows the land-use pattern that generated minimum plantation revenue loss. Point B shows that a 13.4% total possible increase in habitat quality reduced plantation revenue by less than 2%. Point C shows that a further increase in the habitat quality score from 141,712 to 197,913, i.e., 81.4% of the total possible increase in habitat quality score, reduced economic revenue by 54.5%. The process of moving point D to point E shows that a small increase in habitat quality score comes at a large cost of plantation revenue. Thus, these results suggest that, at least in Hainan, one-sided pursuit for maximum single benefit could be costly.
3.2. Spatial Configuration for Different Optimal Scenarios
In terms of spatial configuration, when minimizing plantation revenue loss, restoration is mainly clustered in rubber plantation areas in the western plain and scatters in the north and southeast EFCA, and less along the eastern coastline (point A in Figure 2). With the increase in the weight on habitat quality, restoration gradually shifts around the EFCA and partly transfers to western offshore areas. The restoration location for point C in Figure 2 is relatively more scattered around the west, southwest, and east EFCA, and circles the coastline along the whole island. When maximizing habitat quality, restoration areas are concentrated in the east EFCA and west and southwest boundaries of the EFCA (point E in Figure 2).
3.3. Effects of Forest Restoration on other ES under Different Optimal Scenarios
We further compared both the biophysical and monetary values of other regulation services produced under five optimal landscapes (Table 5). In biophysical terms, the landscape with minimum plantation revenue loss generates the highest level of water purification improvement relative to the baseline, whereas the landscape with 25% of the maximum habitat quality results in the greatest soil retention relative to the baseline. The land-use patterns with at least 50% of the maximum habitat quality value are all beneficial for carbon sequestration, but the landscape with the maximum habitat quality value contributes least to coastal hazard mitigation. In terms of economic outcomes, besides the two extreme scenarios (points A and E), the other scenarios all create more than 100 million CNY (Table 5).
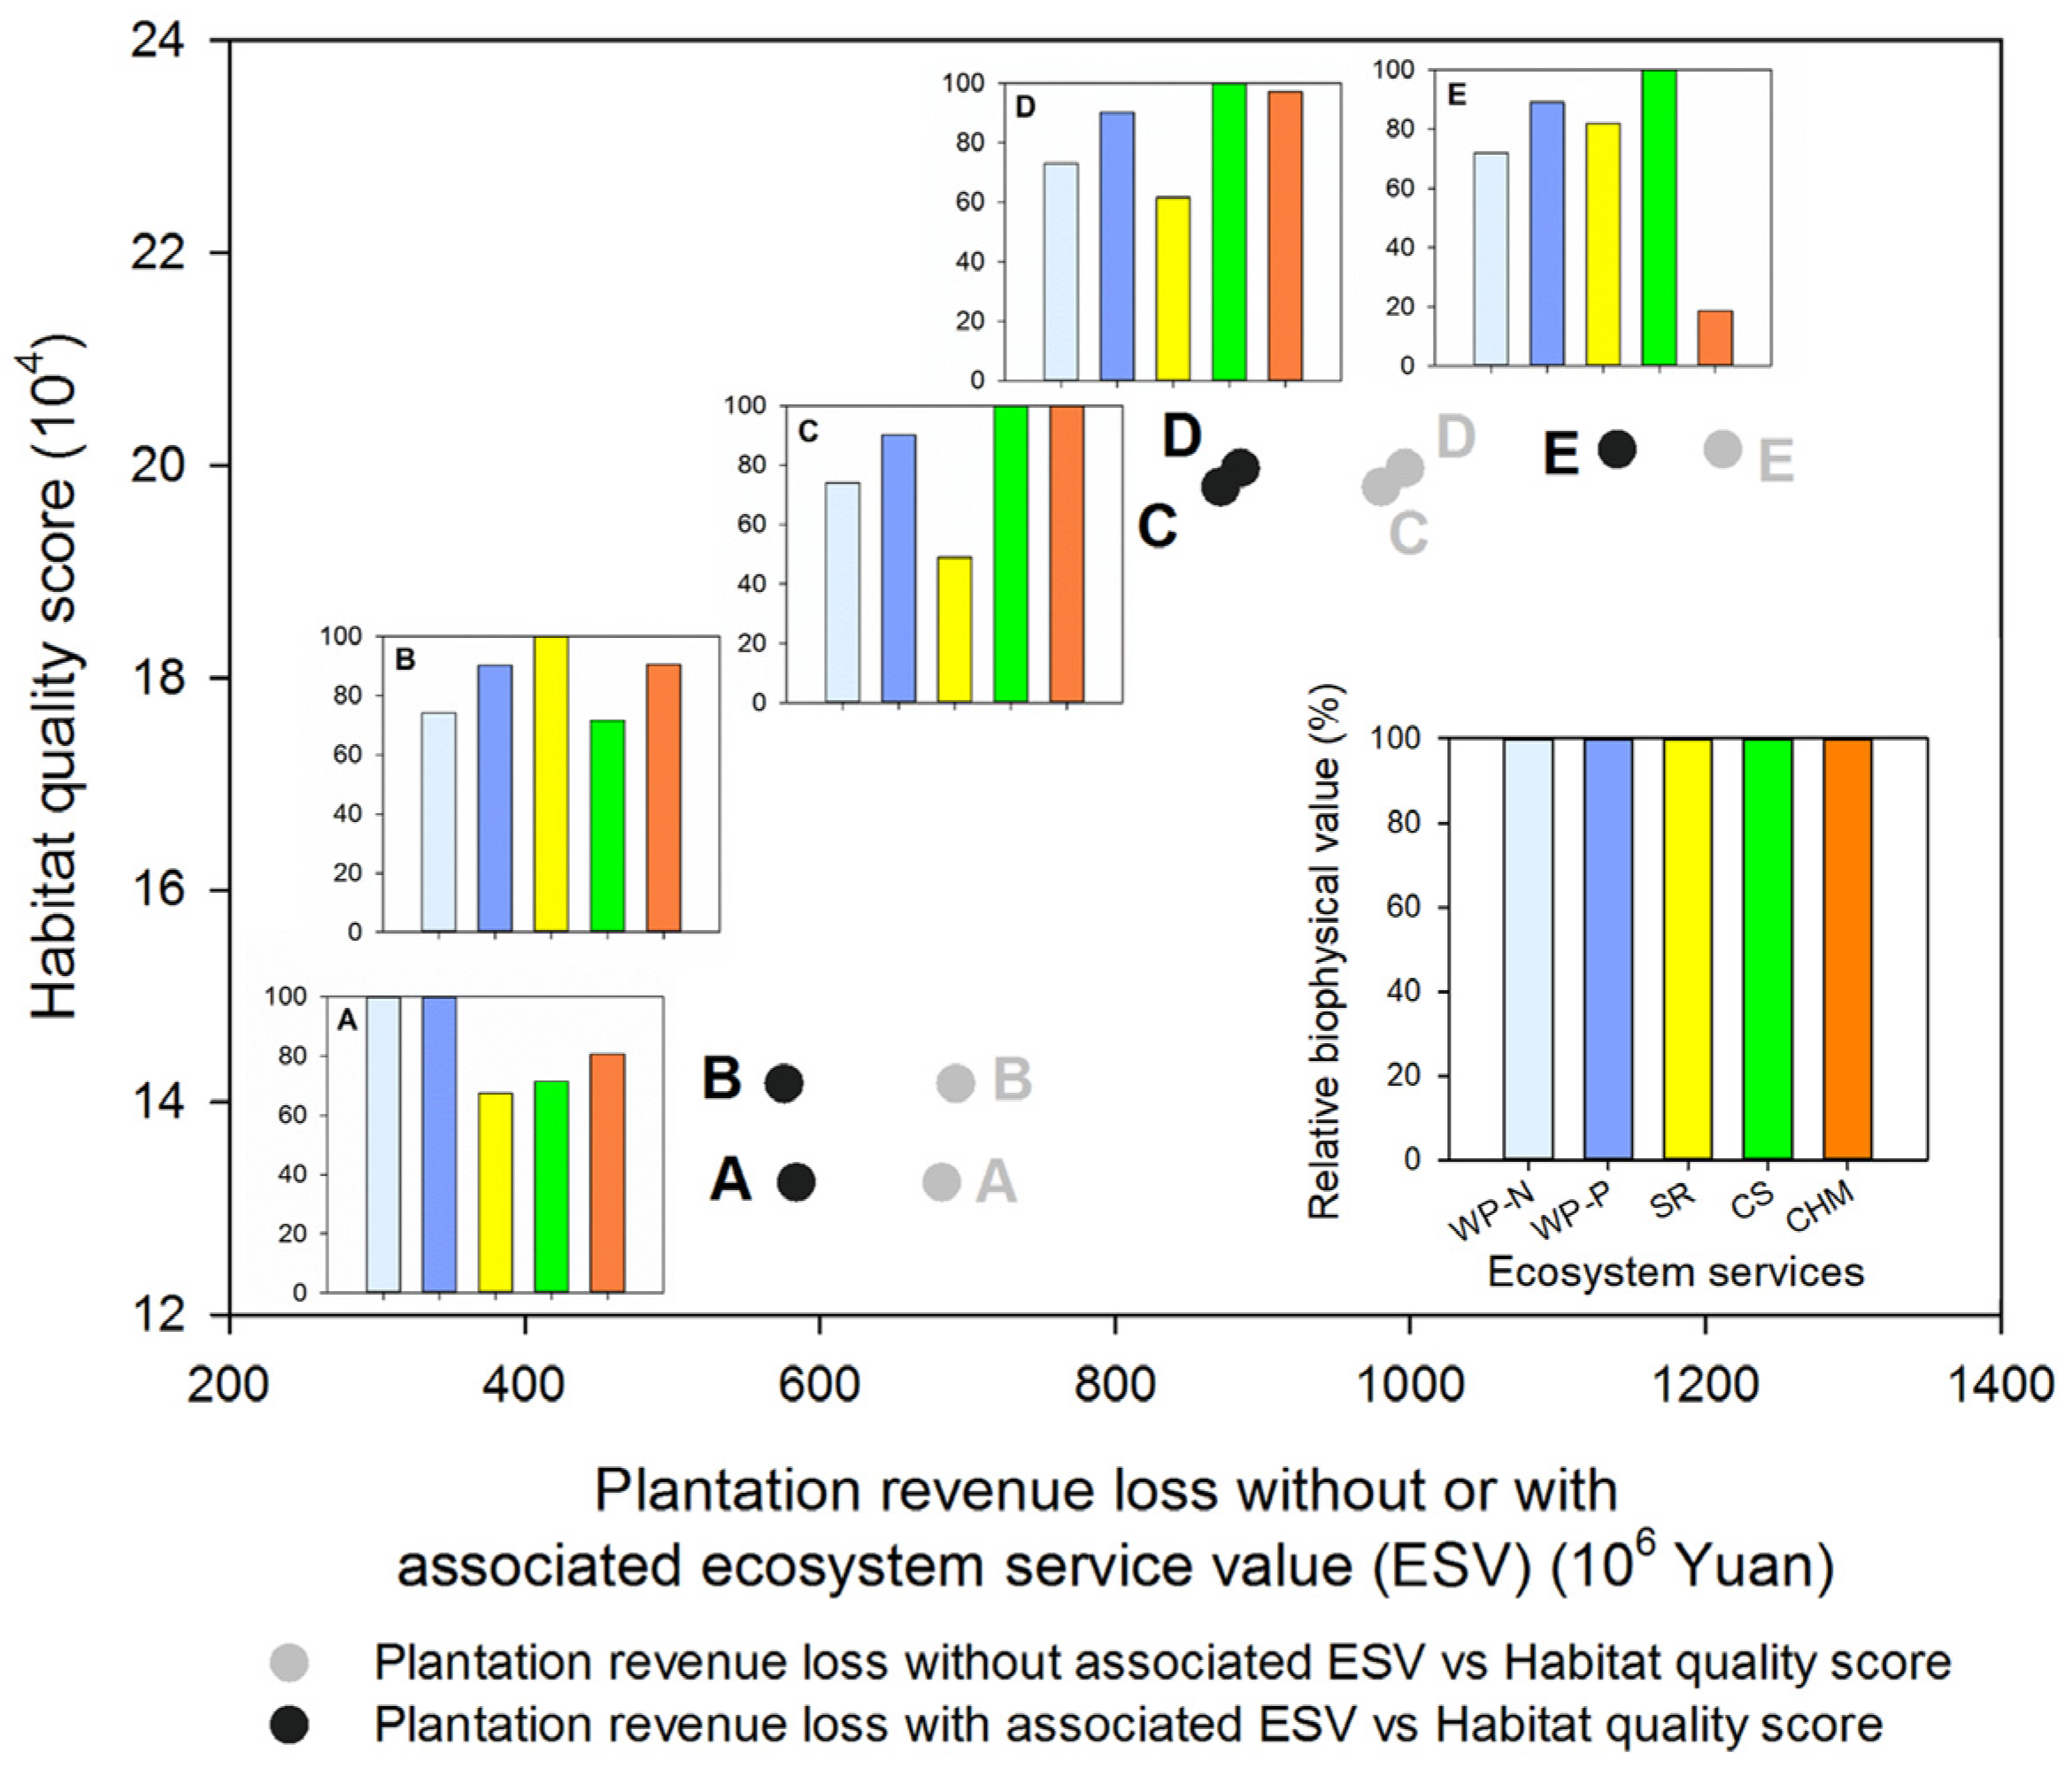
The differences in relative biophysical values under the five optimal scenarios in descending order are coastal hazard mitigation, soil retention, carbon sequestration, water purification (N), and water purification (P), as shown in Figure 3. Thus, relative to water purification, coastal hazard mitigation and soil retention are more sensitive to changes in the optimal configuration of forest restoration. As also seen in Figure 3, no single optimal solution shows all services at maximum levels, i.e., the optimal location for each service is generally not spatially coincided. Hence, optimization is helpful under such conditions to compromise the conflicts of interest. Moreover, trade-offs among regulation services under optimal solutions were also identified (Table 5 and Figure 3).
We did not explicitly consider the monetary value of other regulation services on the landscape, with the relationship between habitat quality and plantation revenue loss represented as gray circles in Figure 3. When we added the monetary value of water purification improvements, soil retention, carbon sequestration, and coastal hazard mitigation to the net loss from plantation conversion, the relative locations of these points shift to some extent. The medium points moved further left than the extreme points (point A and E with dark circles in Figure 3) due to higher economic values after adding other regulation services (Table 5).
4. Discussion
Our results showed a clear trade-off between plantation revenue and habitat quality. The shape of an efficiency frontier curve is indicative to the potential relationship and threshold among objectives. In our study, the curve displays a rapid increase in habitat quality with a small loss in plantation revenue. Afterwards, a relative linear relationship is shown between the two objectives, getting closer to maximum habitat quality, with a tiny increase in habitat quality accompanied by a large decrease in planation revenue (Figure 2). This differs from the curve reported in a case in Minnesota, the US [12], which showed a flat curve between agricultural production with high crop price and water purification, indicating a small chance to gain a “small loss-big win” scenario. In contrast, our study showed the possibility that a small loss in plantation revenue could be accompanied by a large improvement in habitat quality (Figure 2). This highlights what can be optimally achieved with elaborate spatial configuration under the same land sources. Since plantation revenue is strongly linked to local livelihoods [27], minimizing plantation revenue loss for a given biodiversity improvement would be vital as a cost-effective and equitable strategies to achieve a dual-goal of poverty alleviation and environmental conservation, which are fundamental factors for sustainable development [6]. Furthermore, several studies have shown that extremely high costs can be incurred when maximizing one goal [4,52], a pattern confirmed in our study, thus supporting the concept that multifunctionality in land-use planning can result in less costly outcomes.
Spatial configurations of forest restoration can be organized in various ways to meet specific preferences. The EFCA in Hainan plays a critical role in conservation of biodiversity and multiple ecosystem services, such as soil retention and freshwater provision [29]. Our results confirmed that the EFCA and its surroundings are still prioritized areas with regard to large improvements in habitat quality and ecosystem services, but the highest values for each ecosystem service are concentrated in different regions. For example, the highest value parcels for improved habitat quality surround the Jianfengling National Forest Park in the western EFCA (point E in Figure 2), whereas the highest value parcels for nutrient export reduction are located on the steep slopes of the southwest and northern EFCA (point A in Figure 2) [29]. O’Connell et al. [23] also found the highest values for agricultural production, carbon storage, biophysical climate regulation and biodiversity were concentrated in different regions. These spatial disparities indicate that balancing multiple ecosystem services must be explicit, and identifying potential solutions that balance priorities is critical as land resources become increasingly valuable [23]. Unlike Verhagen, et al. [53], who found that fruit yield, endangered species habitat, and landscape aesthetics were sensitive to landscape configuration, we found that not all ecological objectives are sensitive to restoration configurations, e.g., carbon sequestration and phosphorus export reduction. This suggests that we should consider more sensitive factors when ranking optimal solutions.
We also evaluated the benefits from water purification, soil retention, carbon sequestration, and coastal hazard mitigation, which are critical in securing local people and assets. Such evaluation accounts for multiple environmental goods and their values, which not only builds on the contribution of restoration to multifunctionality [54], but also provides a fuller assessment of the trade-off land-use alternatives [55]. With the provision of both biophysical and monetary values, our results should be more indicative for different stakeholders to recognize the benefits and costs among various options. Although the economic value of nutrient reduction is far lower than that of other services, drinking water is highly tied with local life needs [56]. Hence, it would be risky to merely consider a one-sided evaluation. Qualified coastal protection forests are also critical for islands, especially for offshore areas susceptible to tropical storms [47]. Our study enriches the insufficient assessment on the value of coastal forest restoration in the local, and the result shows that the economic value to restore coastal bio-shelters contributes largely to total ecosystem service value resulted from ecosystem restoration (Table 5). Many other studies [15,16,17] also reported the approaches to generate Pareto frontiers and analyze trade-offs of multiple ecosystem services. However, the analyses integrating complex trade-offs of more than two ecosystem services lead to challenges for different stakeholders to state their preferences. To emphasize the prior objectives of decision makers, our study firstly focused on two prior objectives (plantation revenue and habitat quality) and visualized the trade-offs by using the Pareto frontier. Then we presented the potential outcomes in terms of both biophysical and monetary values with some key points on the Pareto frontier. The results clearly clarify the changes of different ecosystem services that different stakeholders concern. Based on efficiency frontier the process of land-use planning could be iterated to involve all the important stakeholders and could be more unbiased to generate a more detailed implementation plan. Our approach reduces the difficulty for stakeholders to state their preferences in terms of target levels for objectives.
Although we mostly adopted local parameters and study results as our input data, there are still some limitations and uncertainties in our study. First, limited by plantation harvest and sales data, the spatial distribution of plantation revenue was only adjusted by site condition. Second, the interaction between natural habitat quality and biodiversity is a very complicated process. Here, habitat quality in InVEST was estimated as a function of the suitability of each land-use type for providing habitat, including anthropogenic threats and sensitivities of each land-use type to each threat, without considering other external factors [40]. Habitat quality was treated as a relative impact of different land use scenarios on natural habitat for biodiversity [41]. Third, like many studies in data-poor areas, our models are not well calibrated and the costs of forest restoration are not considered. The monetary values of other ecosystem services also exist uncertainty due to the differences in pricing methods. To further reduce the uncertainty of models, we adopted relative values rather than absolute values, which are more tenable in representing variations in ES along with land-use changes [57]. Fourth, the optimal solutions are statically constructed between habitat quality and plantation revenue, which are the top priorities in tropical areas [15]. In fact, the optimal allocation of forest restoration would be different with the changes of stakeholders’ preferences and restoration time [58]. Fifth, the optimization tool we used in the study simply provides a limited number of points that featured by given prioritization along the efficiency frontier. Although this could fulfill our initial goal that generates the general relationship, to identify the accurate position of threshold might be solved by other algorithms [15]. Our study only provides an approach to systematically quantify the trade-offs under different forest restoration scenarios and to incorporate them into future forest restoration schemes in other areas. Periodical adjustment and re-planning might be necessary in terms of the changes in stakeholders’ preferences and long-term restoration process.
5. Conclusions
The trade-offs between plantation revenue and habitat quality, as well as among multiple ecosystem services, under different forest restoration scenarios were systematically quantified by using the efficiency frontier-based methods. Forest restoration patterns vary with the degree of preference for plantation yield or habitat quality, indicating that understanding ecosystem service tradeoffs can support the optimal selection of forest restoration schemes under different preferences. Moreover, integrating other important ES (water purification, soil conservation, carbon sequestration, and coastal hazard mitigation) into the efficiency frontier between habitat quality and plantation revenue, provides the optimal solutions for various preferences on habitat quality, plantation revenue and multiple regulating ES. The application of the efficiency frontier deepens quantitative understanding of ecosystem service trade-offs, and the addition of multi-benefit evaluation based on optimal solutions provides a more detailed and broader picture of forest restoration plans. Our results suggest integrated efficiency frontier assessment with the valuation of ecosystem services associated with forest restoration provides a quantitative approach for optimal forest restoration, which can be applied in broad forest restoration programs.
Author Contributions
Conceptualization, R.L. and H.Z.; methodology, R.L. and R.L.; writing—original draft preparation, R.L.; writing—review and editing, R.L. and H.Z.; visualization, Y.Y.; funding acquisition, R.L., H.Z. and Z.O. All authors have read and agreed to the published version of the manuscript.
Funding
This work was supported by the National Natural Science Foundation of China (41925005; 41871217) and the National Key Research and Development Program of China (No. 2016YFC0503401).
Acknowledgments
Great thanks to the teachers and students at State Key Laboratory of Urban and Regional Ecology, Research Center for Eco-Environmental Sciences of Chinese Academy of Sciences. We specially thank Peter L. Hawthorne, Adrian L. Vogl, Yuan Chai, the editors and two anonymous reviewers for helpful comments and suggestions.
Conflicts of Interest
The authors declare no conflict of interest.
References
- Scholes, R.; Montanarella, L.; Brainich, E.; Barger, N.; ten Brink, B.; Cantele, M.; Erasmus, B.; Fisher, J.; Gardner, T.; Holland, T.G. Ipbes (2018): Summary for Policymakers of the Assessment Report on Land Degradation and Restoration of the Intergovernmental Science-Policy Platform on Biodiversity and Ecosystem Servicesintensity of Aroma, Taste, Aftertaste, Mouthfeel and Colour in Tea Samples; IPBES Secretariat: Bonn, Germany, 2018. [Google Scholar]
- Bullock, J.M.; Aronson, J.; Newton, A.C.; Pywell, R.F.; Rey-Benayas, J.M. Restoration of ecosystem services and biodiversity: Conflicts and opportunities. Trends Ecol. Evol. 2011, 26, 541–549. [Google Scholar] [CrossRef] [PubMed]
- Bonn Challenge. Available online: http://www.bonnchallenge.org (accessed on 15 August 2019).
- Gourevitch, J.D.; Hawthorne, P.L.; Keeler, B.L.; Beatty, C.R.; Greve, M.; Verdone, M.A. Optimizing investments in national-scale forest landscape restoration in Uganda to maximize multiple benefits. Environ. Res. Lett. 2016, 11, 114027. [Google Scholar] [CrossRef] [Green Version]
- Yang, Z. Watershed ecology and its applications. Engineering 2018, 4, 582–583. [Google Scholar] [CrossRef]
- Sachs, J.D.; Reid, W.V. Investments toward sustainable development. Science 2006, 312, 1002. [Google Scholar] [CrossRef] [PubMed] [Green Version]
- Wang, J.; Peng, J.; Zhao, M.; Liu, Y.; Chen, Y. Significant trade-off for the impact of Grain-for-Green Programme on ecosystem services in North-western Yunnan, China. Sci. Total Environ. 2017, 574, 57–64. [Google Scholar] [CrossRef]
- Deng, X.; Li, Z.; Gibson, J. A review on trade-off analysis of ecosystem services for sustainable land-use management. J. Geogr. Sci. 2016, 26, 953–968. [Google Scholar] [CrossRef] [Green Version]
- Zheng, H.; Wang, L.; Wu, T. Coordinating ecosystem service trade-offs to achieve win–win outcomes: A review of the approaches. J. Environ. Sci. 2019, 82, 103–112. [Google Scholar] [CrossRef]
- Seppelt, R.; Lautenbach, S.; Volk, M. Identifying trade-offs between ecosystem services, land use, and biodiversity: A plea for combining scenario analysis and optimization on different spatial scales. Curr. Opin. Environ. Sustain. 2013, 5, 458–463. [Google Scholar] [CrossRef]
- Niemeyer, J.; Barros, F.S.M.; Silva, D.S.; Crouzeilles, R.; Vale, M.M. Planning forest restoration within private land holdings with conservation co-benefits at the landscape scale. Sci. Total Environ. 2019, 135262. [Google Scholar] [CrossRef]
- Pennington, D.N.; Dalzell, B.; Nelson, E.; Mulla, D.; Taff, S.; Hawthorne, P.; Polasky, S. Cost-effective land use planning: Optimizing land use and land management patterns to maximize social benefits. Ecol. Econ. 2017, 139, 75–90. [Google Scholar] [CrossRef]
- Kennedy, C.M.; Hawthorne, P.L.; Miteva, D.A.; Baumgarten, L.; Sochi, K.; Matsumoto, M.; Evans, J.S.; Polasky, S.; Hamel, P.; Vieira, E.M.; et al. Optimizing land use decision-making to sustain Brazilian agricultural profits, biodiversity and ecosystem services. Biol. Conserv. 2016, 204, 221–230. [Google Scholar] [CrossRef] [Green Version]
- Williams, K.; Biedenweg, K.; Cerveny, L. Understanding ecosystem service preferences across residential classifications near Mt. Baker Snoqualmie National Forest, Washington (USA). Forests 2017, 8, 157. [Google Scholar] [CrossRef] [Green Version]
- Borges, J.G.; Marques, S.; Garcia-Gonzalo, J.; Rahman, A.U.; Bushenkov, V.; Sottomayor, M.; Carvalho, P.O.; Nordström, E.-M. A multiple criteria approach for negotiating ecosystem services supply targets and forest owners’programs. For. Sci. 2016, 63, 49–61. [Google Scholar] [CrossRef]
- Tóth, S.F.; McDill, M.E. Finding efficient harvest schedules under three conflicting objectives. For. Sci. 2009, 55, 117–131. [Google Scholar] [CrossRef]
- Marto, M.; Reynolds, K.M.; Borges, J.G.; Bushenkov, V.A.; Marques, S. Combining decision support approaches for optimizing the selection of bundles of ecosystem services. Forests 2018, 9, 438. [Google Scholar] [CrossRef] [Green Version]
- Mansourian, S.; Stanturf, J.A.; Derkyi, M.A.A.; Engel, V.L. Forest Landscape Restoration: Increasing the positive impacts of forest restoration or simply the area under tree cover? Restor. Ecol. 2017, 25, 178–183. [Google Scholar] [CrossRef]
- Wolff, S.; Schrammeijer, E.A.; Schulp, C.J.E.; Verburg, P.H. Meeting global land restoration and protection targets: What would the world look like in 2050? Global Environ. Change 2018, 52, 259–272. [Google Scholar] [CrossRef]
- Ouyang, Z.; Zheng, H.; Xiao, Y.; Polasky, S.; Liu, J.; Xu, W.; Wang, Q.; Zhang, L.; Xiao, Y.; Rao, E.; et al. Improvements in ecosystem services from investments in natural capital. Science 2016, 352, 1455–1459. [Google Scholar] [CrossRef]
- Ouyang, Z.; Zhu, C.; Yang, G.; Xu, W.; Zheng, H.; Zhang, Y.; Xiao, Y. Gross ecosystem product: Concept framework and case study. Acta Ecol. Sin. 2013, 33, 6747–6761, (In Chinese with English abstract). [Google Scholar] [CrossRef]
- Ouyang, Z.; Song, C.; Wong, C.; Daily, G.C.; Liu, J.; Salzman, J.; Kong, L.; Zheng, H.; Li, C. China: Designing policies to enhance ecosystem services. In Green Growth That Works: Natural Capital Policy and Finance Mechanisms from Around the World; Mandle, L., Ouyang, Z., Salzman, J.E., Daily, G., Eds.; Island Press/Center for Resource Economics: Washington, DC, USA, 2019; pp. 177–194. [Google Scholar]
- O’Connell, C.S.; Carlson, K.M.; Cuadra, S.; Feeley, K.J.; Gerber, J.; West, P.C.; Polasky, S. Balancing tradeoffs: Reconciling multiple environmental goals when ecosystem services vary regionally. Environ. Res. Lett. 2018, 13, 064008. [Google Scholar] [CrossRef]
- Francisco-Ortega, J.; Wang, Z.-S.; Wang, F.-G.; Xing, F.-W.; Liu, H.; Xu, H.; Xu, W.-X.; Luo, Y.-B.; Song, X.-Q.; Gale, S.; et al. Seed plant endemism on Hainan Island: A framework for conservation actions. Bot. Rev. 2010, 76, 346–376. [Google Scholar] [CrossRef]
- Zhang, M.; Fellowes, J.R.; Jiang, X.; Wang, W.; Chan, B.P.L.; Ren, G.; Zhu, J. Degradation of tropical forest in Hainan, China, 1991–2008: Conservation implications for Hainan Gibbon (Nomascus hainanus). Biol. Conserv. 2010, 143, 1397–1404. [Google Scholar] [CrossRef]
- Lin, S.; Jiang, Y.; He, J.; Ma, G.; Xu, Y.; Jiang, H. Changes in the spatial and temporal pattern of natural forest cover on Hainan Island from the 1950s to the 2010s: Implications for natural forest conservation and management. PeerJ 2017, 5, e3320. [Google Scholar] [CrossRef] [PubMed] [Green Version]
- Li, R.; Zheng, H.; Zhang, C.; Keeler, B.; Samberg, L.H.; Li, C.; Polasky, S.; Ni, Y.; Ouyang, Z. Rural household livelihood and tree plantation dependence in the central mountainous region of Hainan Island, China: Implications for poverty alleviation. Forests 2020, 11, 248. [Google Scholar] [CrossRef] [Green Version]
- Sun, X. The Research of Compound Typhoon Prevention Strategy in Eastern Urban Belt Around Hainan Island. Ph.D. Thesis, Tianjin University, Tianjin, China, 2012. [Google Scholar]
- Zheng, H.; Wang, L.; Peng, W.; Zhang, C.; Li, C.; Robinson, B.E.; Wu, X.; Kong, L.; Li, R.; Xiao, Y.; et al. Realizing the values of natural capital for inclusive, sustainable development: Informing China’s new ecological development strategy. Proc. Natl. Acad. Sci. USA 2019, 116, 8623–8628. [Google Scholar] [CrossRef] [PubMed] [Green Version]
- NFGA. National Forest Management Plan (2016–2050). Available online: http://www.forestry.gov.cn/uploadfile/main/2016-7/file/2016-7-27-5b0861f937084243be5d17399f5f5f71.pdf (accessed on 15 December 2019).
- Wang, H.; Lu, H.; Yu, X.; Liang, H. Analysed storm surges characteristics along the coast of Hainan Island. Mar. Forecast. 1998, 15, 34–41. (In Chinese) [Google Scholar]
- Wang, L.; Zheng, H.; Wen, Z.; Liu, L.; Robinson, B.E.; Li, R.; Li, C.; Kong, L. Ecosystem service synergies/trade-offs informing the supply-demand match of ecosystem services: Framework and application. Ecosyt. Serv. 2019, 37, 100939. [Google Scholar] [CrossRef]
- Wen, Z.; Zheng, H.; Smith, J.R.; Zhao, H.; Liu, L.; Ouyang, Z. Functional diversity overrides community-weighted mean traits in linking land-use intensity to hydrological ecosystem services. Sci. Total Environ. 2019, 682, 583–590. [Google Scholar] [CrossRef]
- Aide, T.M.; Zimmerman, J.K.; Pascarella, J.B.; Rivera, L.; Marcano-Vega, H. Forest regeneration in a chronosequence of tropical abandoned pastures: Implications for restoration ecology. Restor. Ecol. 2000, 8, 328–338. [Google Scholar] [CrossRef]
- Dong, T.; Xu, W.; Zheng, H.; Xiao, Y.; Kong, L.; Ouyang, Z. A framework for regional ecological risk warning based on ecosystem service approach: A case study in Ganzi, China. Sustainability 2018, 10, 2699. [Google Scholar] [CrossRef] [Green Version]
- Wang, C.; Yang, Y.; Zhang, Y. Economic development, rural livelihoods, and ecological restoration: Evidence from China. Ambio 2011, 40, 78–87. [Google Scholar] [CrossRef] [PubMed] [Green Version]
- Sun, P.; Wu, Y.; Yang, Z.; Sivakumar, B.; Qiu, L.; Liu, S.; Cai, Y. Can the Grain-for-Green Program really ensure a low sediment load on the Chinese Loess Plateau? Engineering 2019, 5, 855–864. [Google Scholar] [CrossRef]
- Zhai, D.-L.; Xu, J.-C.; Dai, Z.-C.; Cannon, C.H.; Grumbine, R.E. Increasing tree cover while losing diverse natural forests in tropical Hainan, China. Reg. Environ. Chang. 2014, 14, 611–621. [Google Scholar] [CrossRef]
- Lin, Z.; Wu, C.; Hong, W.; Hong, T. Economic benefits analysis of carbon sequestration and timber and determination of optimal rotation period for a Cunninghamia lanceolata plantation -based on Time Series Model. Sci. Silvae Sin. 2016, 52, 134–145, (In Chinese with English abstract). [Google Scholar] [CrossRef]
- Sharp, R.; Chaplin-Kramer, R.; Wood, S.; Guerry, A.; Tallis, H.; Ricketts, T. InVEST 3.5.0 User Guide [internet]; Integrated Valuation of Ecosystem Services and Tradeoffs: Stanford, CA, USA, 2018; Available online: http://data.naturalcapitalproject.org/nightly-build/invest-users-guide/html/ (accessed on 15 August 2019).
- Terrado, M.; Sabater, S.; Chaplin-Kramer, B.; Mandle, L.; Ziv, G.; Acuña, V. Model development for the assessment of terrestrial and aquatic habitat quality in conservation planning. Sci. Total Environ. 2016, 540, 63–70. [Google Scholar] [CrossRef] [Green Version]
- Wu, J. Ecological Comprehensive Evaluation of Bamenwan Bay in Hainan Based on CA-Markov and Invest Model. Master’s Thesis, Hainan University, Haikou, China, 2012. [Google Scholar]
- Zhang, X.-F.; Zheng-Wen, L.; Yi-Fa, X.; Chen, G.-R. Evaluation on the changes of ecosystem service of urban lakes during the degradation process: A case study of Xiannǜ Lake in Zhaoqing, Guangdong Province. Acta Ecol. Sin. 2007, 27, 2349–2354, (In Chinese with English abstract). [Google Scholar]
- Ouyang, Z.; Zhao, T.; Zhao, J.; Xiao, H.; Wang, X. Ecological regulation services of Hainan Island ecosystem and their valuation. Chin. J. Appl. Ecol. 2004, 15, 1395–1402, (In Chinese with English abstract). [Google Scholar] [CrossRef]
- Yang, M.; Yi, X.; Zhiyun, O.; Hong, Y.; Maotao, D.; Ai, L. Ecosystem regulation services accounting of gross ecosystem product (GEP) in Sichuan Province. J. Southwest Minzu Univ. (Nat. Sci. Ed.) 2019, 45. [Google Scholar] [CrossRef]
- Medeiros, R.; Young, C.E.F. Contribuição das unidades de conservação brasileiras para a economia nacional: Relatório Final. Brasília: UNEP-WCMC 2011, 120, 78–94. [Google Scholar]
- Arkema, K.K.; Guannel, G.; Verutes, G.; Wood, S.A.; Guerry, A.; Ruckelshaus, M.; Kareiva, P.; Lacayo, M.; Silver, J.M. Coastal habitats shield people and property from sea-level rise and storms. Nat. Clim. Chang. 2013, 3, 913–918. [Google Scholar] [CrossRef]
- Hu, X.; Wen, C. The study of coastal protection forest in Hainan Province. Prot. For. Sci. Tech. 2009, 63–64, 93. (In Chinese) [Google Scholar]
- Zhang, Y.; Ruckelshaus, M.; Arkema, K.K.; Han, B.; Lu, F.; Zheng, H.; Ouyang, Z. Synthetic vulnerability assessment to inform climate-change adaptation along an urbanized coast of Shenzhen, China. J. Environ. Manag. 2020, 255, 109915. [Google Scholar] [CrossRef] [PubMed]
- Li, Y. Quantitative on Comprehensive Benefit of Guandong Coastal Shelterbelt and Implementation Research. Ph.D. Thesis, Beijing Forestry University, Beijing, China, 2010. [Google Scholar]
- Hawthorne, P.L.; Beatty, C.R.; Vogl, A.L. Available online: https://naturalcapitalproject.stanford.edu/root/ (accessed on 15 December 2019).
- Polasky, S.; Nelson, E.; Camm, J.; Csuti, B.; Fackler, P.; Lonsdorf, E.; Montgomery, C.; White, D.; Arthur, J.; Garber-Yonts, B.; et al. Where to put things? Spatial land management to sustain biodiversity and economic returns. Biol. Conserv. 2008, 141, 1505–1524. [Google Scholar] [CrossRef] [Green Version]
- Verhagen, W.; van der Zanden, E.H.; Strauch, M.; van Teeffelen, A.J.A.; Verburg, P.H. Optimizing the allocation of agri-environment measures to navigate the trade-offs between ecosystem services, biodiversity and agricultural production. Environ. Sci. Policy 2018, 84, 186–196. [Google Scholar] [CrossRef]
- Benz, J.P.; Chen, S.; Dang, S.; Dieter, M.; Labelle, E.R.; Liu, G.; Hou, L.; Mosandl, R.M.; Pretzsch, H.; Pukall, K.; et al. Multifunctionality of forests: A white paper on challenges and opportunities in China and Germany. Forests 2020, 11, 266. [Google Scholar] [CrossRef] [Green Version]
- Fischer, J.; Abson, D.J.; Butsic, V.; Chappell, M.J.; Ekroos, J.; Hanspach, J.; Kuemmerle, T.; Smith, H.G.; von Wehrden, H. Land sparing versus land sharing: Moving forward. Conserv. Lett. 2014, 7, 149–157. [Google Scholar] [CrossRef] [Green Version]
- Hou, L. Creating smart waterworks to produce healthy drinking water. Engineering 2019, 5, 826–827. [Google Scholar] [CrossRef]
- Redhead, J.W.; May, L.; Oliver, T.H.; Hamel, P.; Sharp, R.; Bullock, J.M. National scale evaluation of the InVEST nutrient retention model in the United Kingdom. Sci. Total Environ. 2018, 610–611, 666–677. [Google Scholar] [CrossRef]
- Li, R.; Zheng, H.; Polasky, S.; Hawthorne, P.L.; O’Connor, P.; Wang, L.; Li, R.; Xiao, Y.; Wu, T.; Ouyang, Z. Ecosystem restoration on Hainan Island: Can we optimize for enhancing regulating services and poverty alleviation? Environ. Res. Lett. 2020. [Google Scholar] [CrossRef]
Figure 1.
Land-use/land-cover map of Hainan Island in 2017.
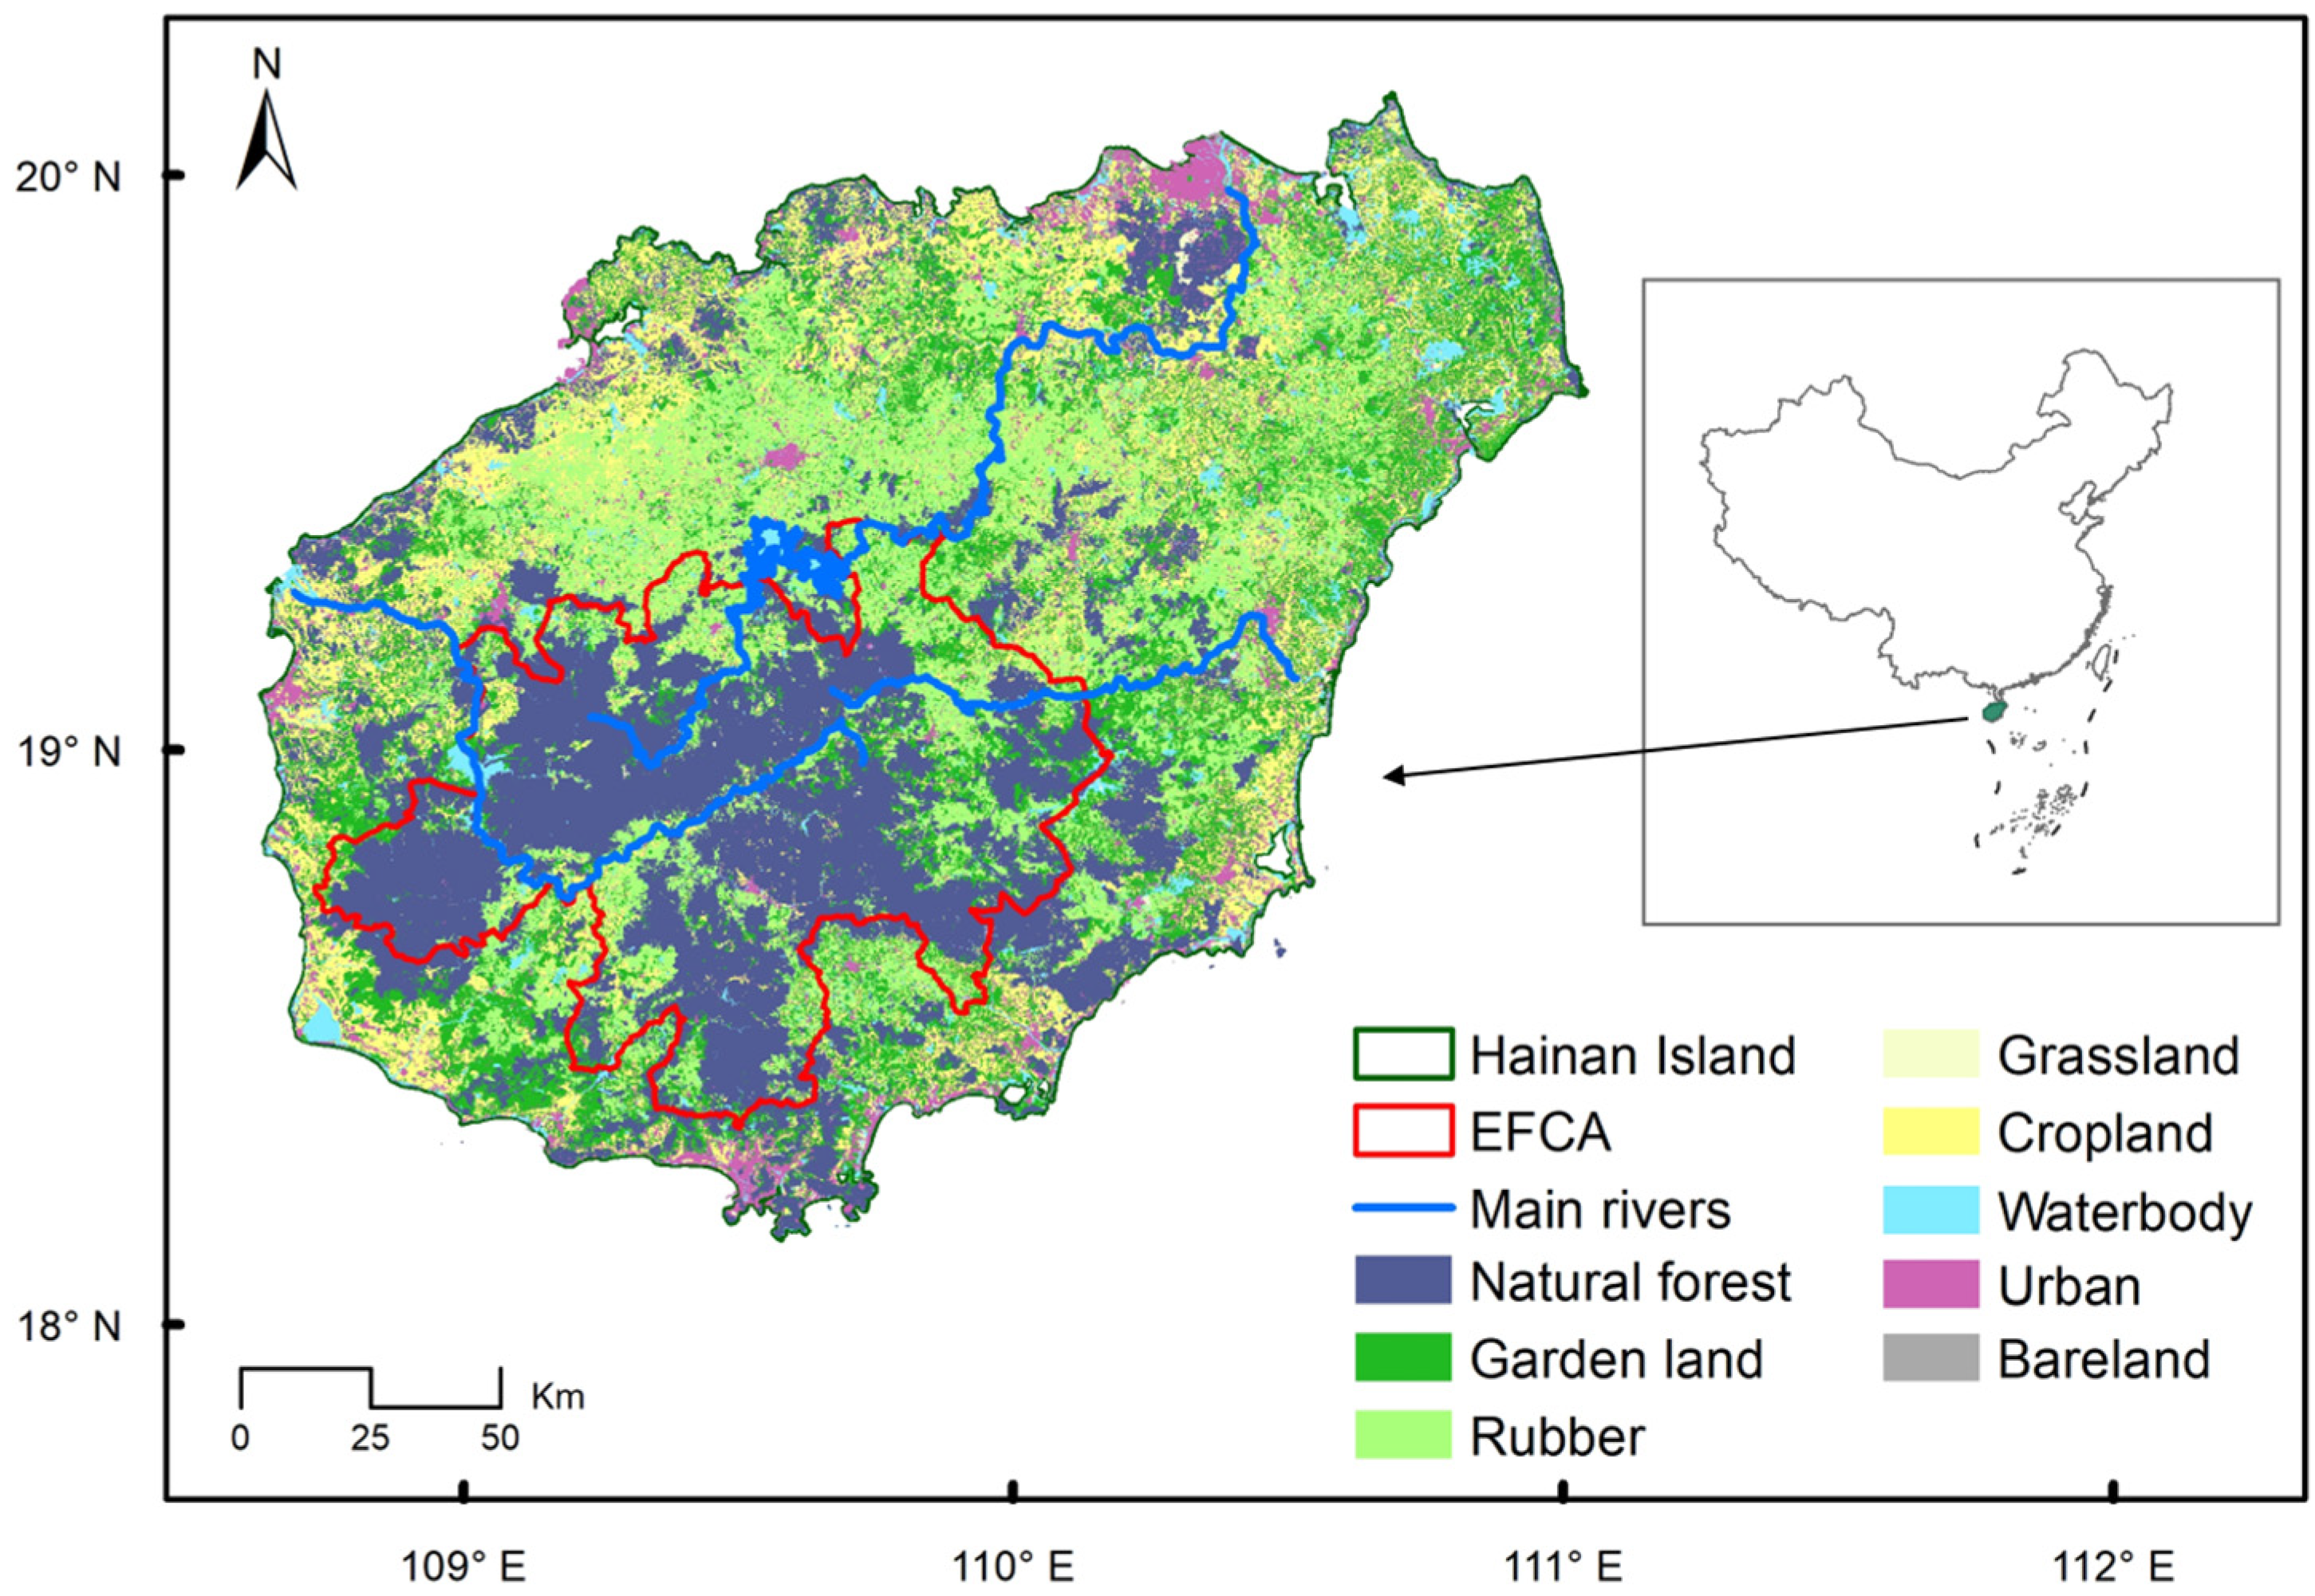
Figure 2.
Efficiency frontier between plantation revenue loss and habitat quality. Present value of plantation revenue loss generated by forest restoration is shown on horizontal axis. Value of habitat quality is shown on vertical axis. The potential ES values from forest restoration were the differences in ES values between restored and baseline patterns (i.e., LULC pattern in 2017). Efficiency frontier is outlined by gray circles. Dark points on frontier associated with letter have corresponding land-use patterns. A = minimum plantation revenue loss, B = 25% of maximum habitat quality value, C = 50% of maximum habitat quality value, D = 75% of maximum habitat quality value, and E = maximum value of habitat quality.
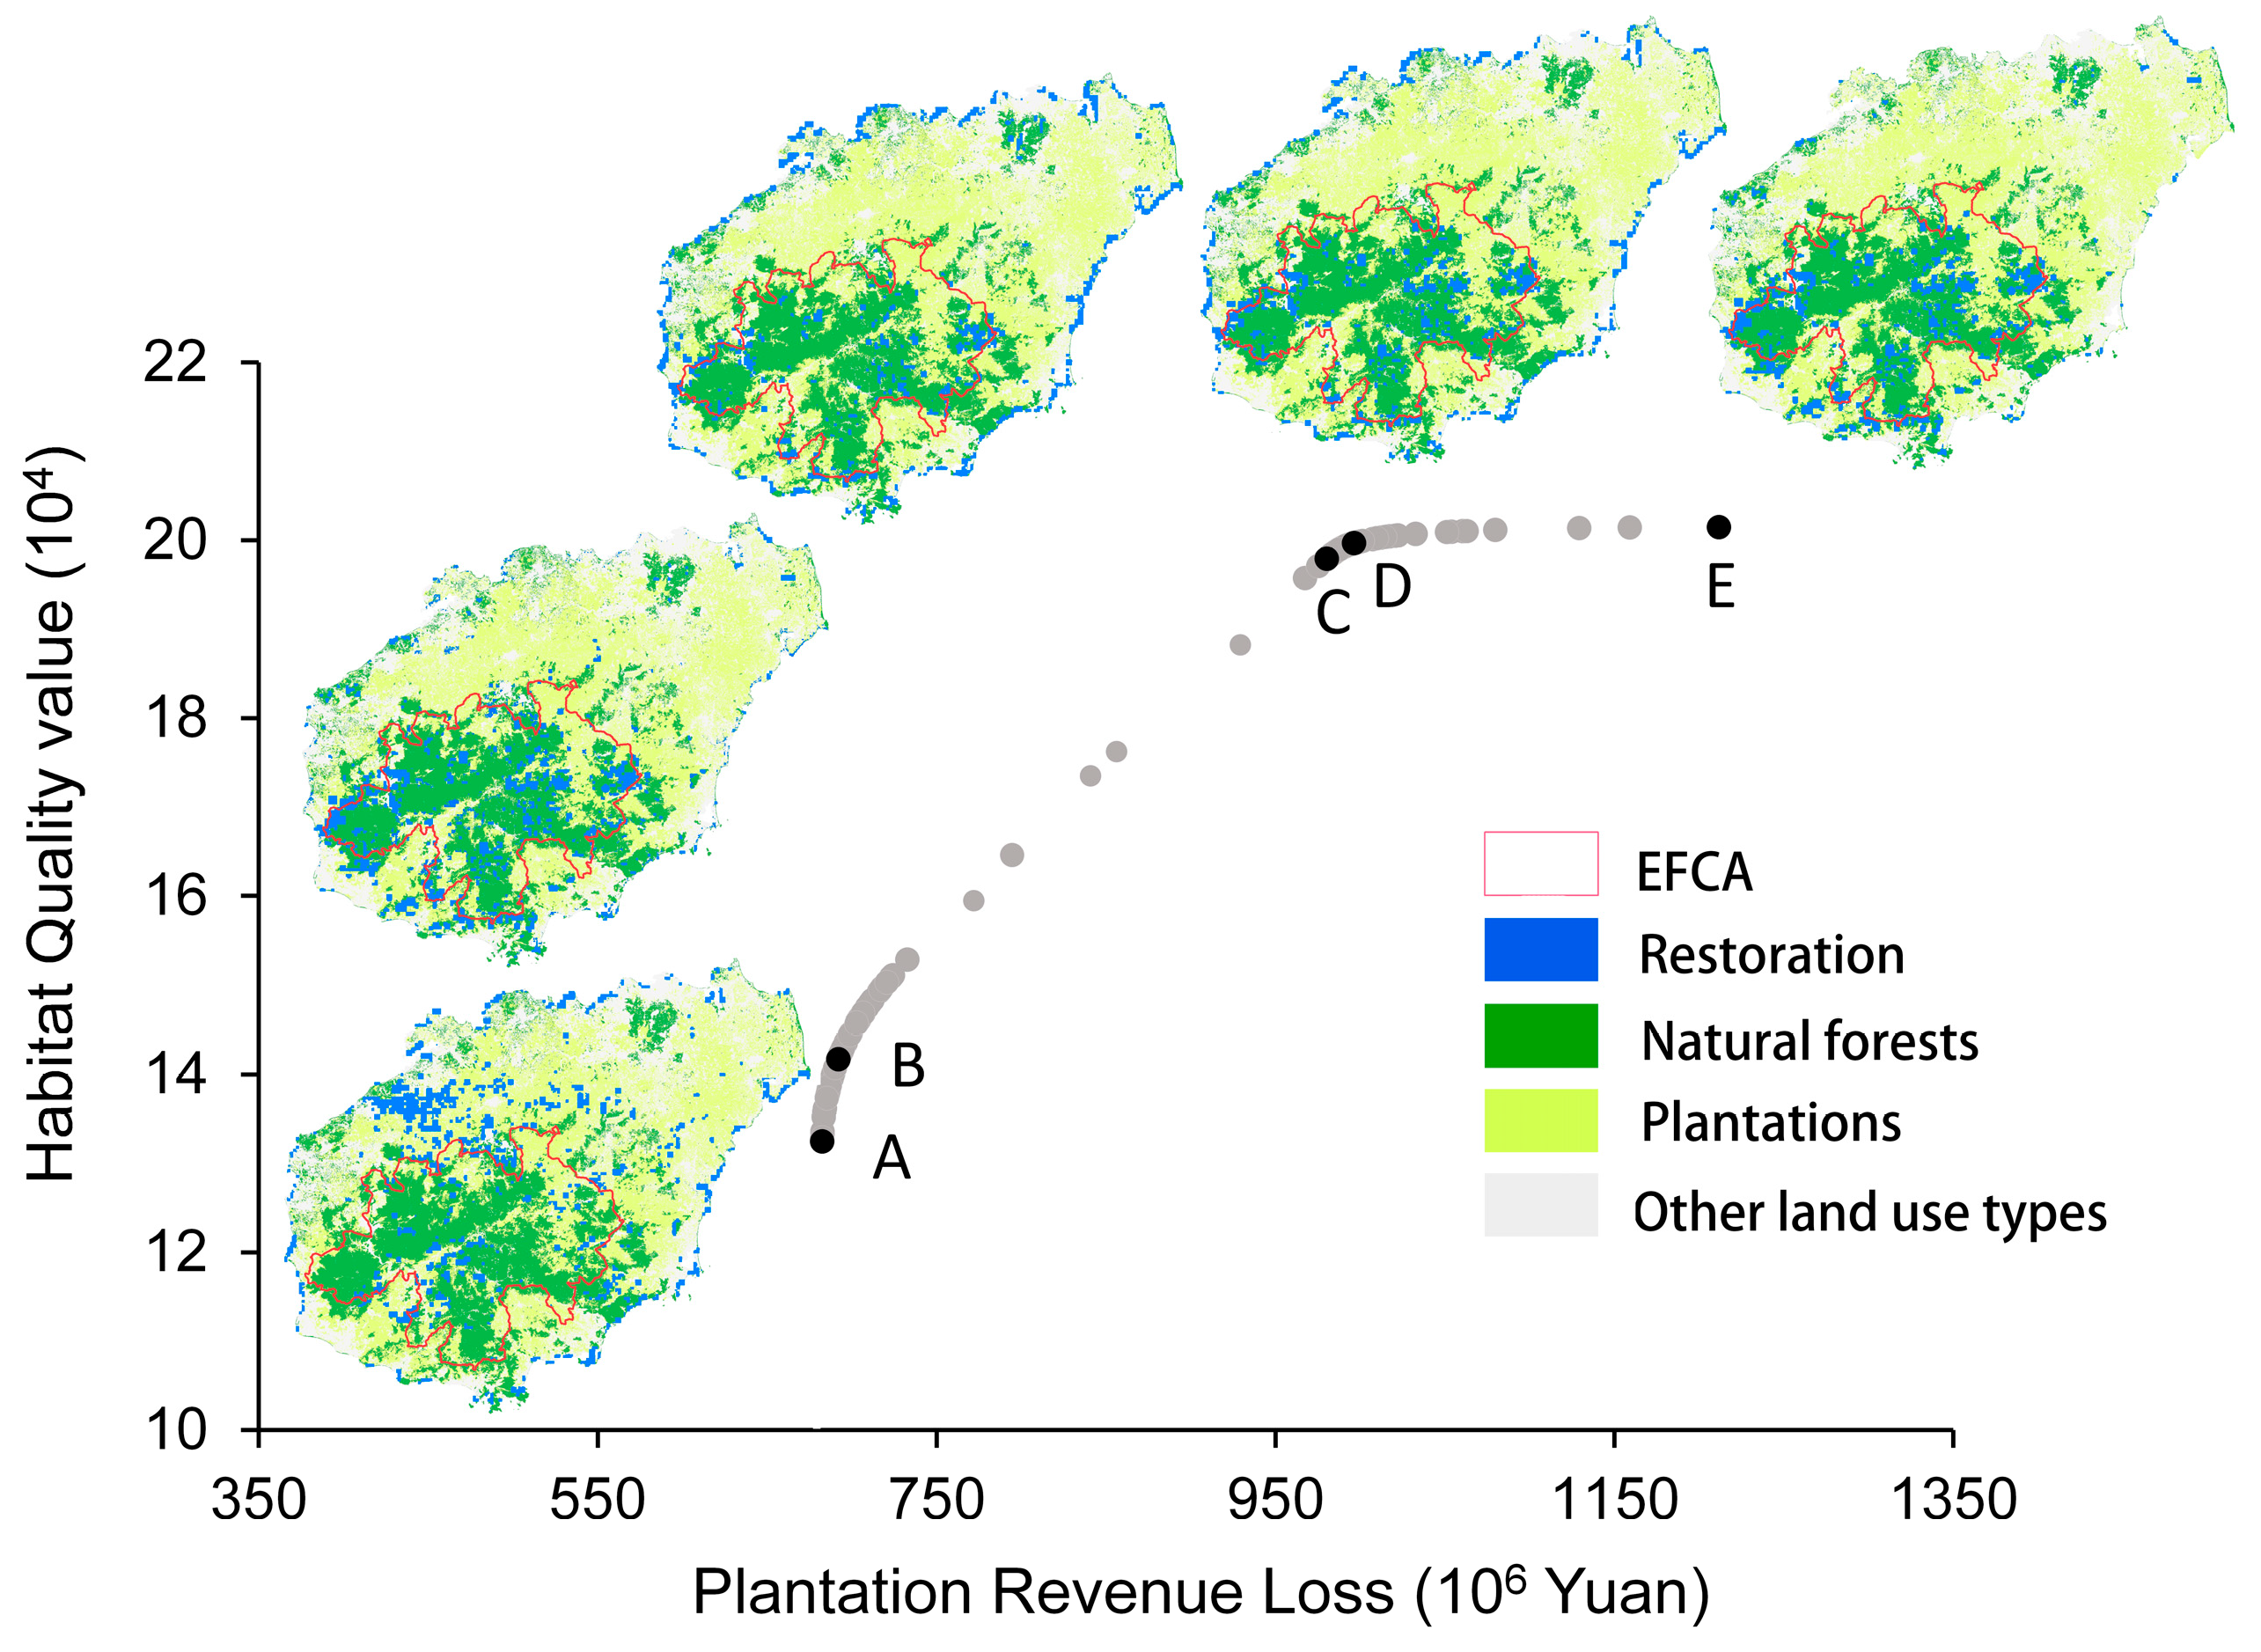
Figure 3.
Relationship between habitat quality and plantation revenue loss (gray circles) or plantation revenue loss plus economic values of ecosystem services (dark circles). The potential ES values from forest restoration were the differences in ES values between restored and baseline patterns (i.e., land-use pattern in 2017). WP-N, water purification (nitrogen reduction); WP-P, water purification (phosphorus reduction); SR, sediment reduction; CS, carbon sequestration; CHM, coastal hazard mitigation. A = minimum plantation revenue loss, B = 25% of maximum habitat quality value, C = 50% of maximum habitat quality value, D = 75% of maximum habitat quality value, and E = maximum value of habitat quality. Bar charts represent proportion of biophysical value relative to maximum value within each category of service.

Table 1.
Characteristics of threats to habitat quality in Hainan Island, China.
| Threat | Maximum Distance of Effect (km) | Weight [0,1] | Distance-Decay Function |
|---|---|---|---|
| Garden land | 1 | 0.5 | Linear |
| Rubber plantation | 1 | 0.5 | Linear |
| Cropland | 0.5 | 0.5 | Linear |
| Urban | 2 | 0.7 | Linear |
| Roads | 1 | 1 | Exponential |
Table 2.
Mean value for habitat suitability (HABITAT) and relative sensitivity of habitat types to threats.
Table 2.
Mean value for habitat suitability (HABITAT) and relative sensitivity of habitat types to threats.
| Habitat Type | HABITAT [0,1] | Relative Sensitivity of Habitat Types to Threats | ||||
|---|---|---|---|---|---|---|
| Garden Land | Rubber Plantation | Cropland | Urban | Roads | ||
| Natural forest | 1 | 0.8 | 0.8 | 0.8 | 0.9 | 0.9 |
| Garden land | 0.5 | 0.1 | 0.1 | 0.1 | 0.8 | 0.8 |
| Rubber plantation | 0.7 | 0.1 | 0.1 | 0.1 | 0.5 | 0.2 |
| Grassland | 0.5 | 0.3 | 0.3 | 0.3 | 0.3 | 0.6 |
| Cropland | 0.5 | 0 | 0 | 0 | 0.4 | 0.2 |
| Water body | 0.8 | 0.9 | 0.9 | 0.8 | 0.9 | 0.8 |
Table 3.
Biophysical coefficients for Nutrient Delivery Ratio (NDR) module in InVEST.
| LULC Types | Nutrient Loading (kg ha−1 year−1) | Maximum Retention Efficiency [0,1] | Maximum Retaining Capacity of Nutrient (m) | Proportion of Dissolved Nutrients [0,1] | |
|---|---|---|---|---|---|
| N | P | N and P | N and P | N and P | |
| Natural forest | 3 | 0.15 | 0.8 | 300 | 0.5 |
| Garden land | 10.21 | 3.1 | 0.45 | 30 | 0 |
| Rubber plantation | 79.05 | 2.85 | 0.35 | 30 | 0 |
| Grassland | 7 | 0.9 | 0.4 | 150 | 0 |
| Cropland | 53.5 | 2.9 | 0.25 | 30 | 0 |
| Water body | 15 | 0.36 | 0.05 | 15 | 0 |
| Urban | 13.8 | 1.8 | 0.05 | 15 | 0 |
| Bare land | 0.88 | 0.01 | 0.05 | 10 | 0 |
Table 4.
Biophysical coefficients for sediment delivery ratio (SDR) module in InVEST and carbon sequestration rate.
Table 4.
Biophysical coefficients for sediment delivery ratio (SDR) module in InVEST and carbon sequestration rate.
| LULC Types | Cover-Management Factor [0,1] | Practice Factor [0,1] | Vegetation [0/1] | Carbon Sequestration Rate (t ha−1 year−1) |
|---|---|---|---|---|
| Natural forest | 0.003 | 1 | 1 | 7.1 |
| Garden land | 0.06 | 1 | 1 | 3.1 |
| Rubber plantation | 0.06 | 1 | 1 | 4.53 |
| Grassland | 0.015 | 1 | 1 | 0.74 |
| Cropland | 0.04 | 0.15 | 1 | 0.5 |
| Water body | 0.001 | 1 | 0 | 0 |
| Urban | 0.001 | 1 | 0 | 0 |
| Bare land | 0.2 | 1 | 0 | 0 |
Table 5.
Summary of differences in ecosystem services in terms of biophysical amount and economic value from baseline using efficiency frontier.
Table 5.
Summary of differences in ecosystem services in terms of biophysical amount and economic value from baseline using efficiency frontier.
| Water Purification (N) | Water Purification (P) | Soil Retention | Carbon Sequestration | Coastal Hazard Mitigation | SUM | ||||||
|---|---|---|---|---|---|---|---|---|---|---|---|
| 106 kg | 106 CNY | 106 kg | 106 CNY | 106 t | 106 CNY | 106 t | 106 CNY | Km * | 106 CNY | 106 CNY | |
| A | 3.0 | 4.5 | 0.15 | 0.38 | 2.0 | 30 | 0.10 | 12 | 23 | 52 | 99 |
| B | 2.2 | 3.3 | 0.13 | 0.33 | 2.9 | 44 | 0.10 | 12 | 26 | 57 | 116 |
| C | 2.2 | 3.3 | 0.13 | 0.33 | 1.4 | 22 | 0.14 | 17 | 29 | 67 | 109 |
| D | 2.2 | 3.3 | 0.13 | 0.33 | 1.8 | 27 | 0.14 | 17 | 28 | 64 | 112 |
| E | 2.2 | 3.3 | 0.13 | 0.33 | 2.4 | 36 | 0.14 | 17 | 5 | 15 | 72 |
Note: *: length of restored forest belt with 200-m width along coastline (LB). A = minimum plantation revenue loss, B = 25% of maximum habitat quality value, C = 50% of maximum habitat quality value, D = 75% of maximum habitat quality value, and E = maximum value of habitat quality.
© 2020 by the authors. Licensee MDPI, Basel, Switzerland. This article is an open access article distributed under the terms and conditions of the Creative Commons Attribution (CC BY) license (http://creativecommons.org/licenses/by/4.0/).
Share and Cite
MDPI and ACS Style
Li, R.; Li, R.; Zheng, H.; Yang, Y.; Ouyang, Z. Quantifying Ecosystem Service Trade-Offs to Inform Spatial Identification of Forest Restoration. Forests 2020, 11, 563. https://doi.org/10.3390/f11050563
AMA Style
Li R, Li R, Zheng H, Yang Y, Ouyang Z. Quantifying Ecosystem Service Trade-Offs to Inform Spatial Identification of Forest Restoration. Forests. 2020; 11(5):563. https://doi.org/10.3390/f11050563
Chicago/Turabian StyleLi, Ruida, Ruonan Li, Hua Zheng, Yanzheng Yang, and Zhiyun Ouyang. 2020. "Quantifying Ecosystem Service Trade-Offs to Inform Spatial Identification of Forest Restoration" Forests 11, no. 5: 563. https://doi.org/10.3390/f11050563
Note that from the first issue of 2016, this journal uses article numbers instead of page numbers. See further details here.