
Live Crown Ratio as an Indicator for Tree Vigor and Stability of Turkey Oak (Quercus cerris L.): A Case Study


1
Department of Silviculture, Faculty of Silviculture and Forest Engineering, Transilvania University of Brasov, Sirul Beethoven 1, 500123 Brașov, Romania
2
Department of Sustainability, Buckinghamshire New University, Queen Alexandra Rd, High Wycombe HP11 2JZ, UK
*
Author to whom correspondence should be addressed.
Forests 2021, 12(12), 1763; https://doi.org/10.3390/f12121763
Submission received: 31 October 2021
/
Revised: 4 December 2021
/
Accepted: 10 December 2021
/
Published: 13 December 2021
(This article belongs to the Section Forest Ecology and Management)
Abstract
:Stability of forests represents a significant objective for climate change mitigation. As stand stability is influenced by the stability of individual trees, promoting stable trees is vital for a sustainable forest management. However, inside stands, trees experience intense competition. As a result, the crown recedes and diameter growth is affected, the trees becoming slender and more susceptible to biotic and abiotic disturbances. Finding effective indicators for tree vigor and stability is therefore important. This study aimed to assess the performance of the live crown ratio as an indicator in deciding the timing of tending operations for obtaining and maintaining vigorous Turkey oak trees. Live crown ratio (LCR) and height to diameter ratio (HDR) were determined for 80 sampled Turkey oak trees. A threshold of 100 for HDR was chosen to classify trees as slender or not slender. Next, conditional inference tree and logistic regression were used to determine the LCR threshold value where trees become slender. As the sample included small trees, using breast height to measure diameter may have affected the results. Therefore, small and large trees were also analyzed separately. For the entire dataset, the methods reached quite different results (LCR threshold of 0.371 for conditional inference tree and of 0.434 for the logistic regression), and relatively high values compared to the literature. For tall trees (height > 12.5 m), the methods reached similar results: 0.386 for the conditional inference tree and 0.382 for the logistic regression. For small trees (height < 12.5 m), the conditional inference tree method could not calculate any LCR threshold estimate, while the one from the logistic regression was unrealistically large (0.628). This confirms that using DBH for small trees to compute slenderness brings systematic errors. The live crown ratio was a good indicator of growth vigor for Turkey oak trees. Therefore, for stable trees (HDR < 100), a LCR of 0.36–0.39 must be maintained and could be used to decide the timing for thinning in Turkey oak stands.
1. Introduction
In the context of an increasing demand for wood under the new concept of bioeconomy, forest ecosystems play a crucial role for society. Moreover, as forests are considered important carbon sinks, the forested landscapes are sought as an effective tool in mitigation of climate change. The changing climate is known to alter the pattern, frequency, intensity, and risk of natural disturbances [1,2,3,4]. Therefore, it can affect the stability of current and future forest ecosystems that are important carbon pools, and may otherwise emit significant amounts of carbon if disturbed. As such, the stability of forests remains a very important objective for management, but is also a challenging task required under a “climate-adapted forest management” [5] and for sustainable mitigation. As stand stability is influenced by the stability of individual trees, obtaining and maintaining such trees is required.
Tree vigor can be explained by the allocation pattern of carbon produced by photosynthesis, with leaves, fine roots, and primary growth being a higher priority compared to secondary growth and defense [6,7,8,9,10,11]. Vigorous trees having enough growing space would be able to fulfill all needs (not only for growth, but also for defense), and therefore will be more resistant to biotic factors such as diseases and insects [6,12,13,14,15]. However, in closed canopy stands, competition for resources is the rule, and trees will allocate more resources to the organ that acquires the most limiting resource [16]. Poorter et al. [17] showed that irradiance had the strongest effect on allocation, among considered environmental factors. Therefore, the competition for light would stimulate trees to invest more in height growth. Moreover, inside stands, trees experience side shading, and natural pruning takes place. The crown size therefore decreases while the size of the tree continues to increase. Thus, the ratio between the photosynthetic ability of the tree (the crown as a source) and the size of the tissue respiration (the whole tree as a sink) is decreasing. As a result, the secondary growth (being a lower priority in carbon allocation) is affected, and trees become slender (tall but thin stems) and more susceptible to abiotic disturbances such as wind and snow [7,11,18,19,20,21,22,23,24,25,26,27].
As crown size influences stem growth, slenderness (calculated as the ratio of tree height and diameter at breast height, HDR, where both variables are expressed in similar units) and the live crown ratio (computed as the ratio between the length of the living crown and tree height) should be correlated. The existing literature [8,9,11] recommends a general live crown ratio (LCR) threshold of approximately 30%–40% for vigorous growth. Therefore, trees having long crowns (LCR above the threshold) are expected to have tapered stems (low HDR), while those with live crown ratios under the threshold should become slender (high HDR), and therefore susceptible to damage by biotic and abiotic factors.
In terms of slenderness, a value of 100 is proposed in general as a threshold for tree stability (trees with slenderness index higher would be more susceptible than those with lower values) [7,8,11,19,20,21,22,23,24]. However, for good stability, some authors recommend lower thresholds, such as 60 [22] or 80 [21,28]. Moreover, stability could differ for different species, deciduous trees seeming to be, at least in some cases, more resistant than conifers [23].
As species adaptations to shade tolerance and climate have been shown to influence the amount of leaves per conducting tissue [8,29] and growth efficiency is also different for different taxa [6], it is expected that the threshold of LCR for a vigorous growth would be different among species. As an example, for the light demanding pines from North America, an LCR of 30% is considered the appropriate threshold, and therefore recommended for deciding the intervention with another thinning (to maintain vigorous growth) [30]. Therefore, a species-specific threshold for the two indices (slenderness and LCR) should be determined for the forest tree species of interest. Moreover, as the two are correlated, the threshold of LCR where the transition from vigorous trees to slender ones occurs would be of high interest. Such a threshold is useful for deciding the timing of tending operation aiming at keeping forest stands stable.
Intense competition starts soon after the canopy closure of a young regenerated stand. Therefore, maintaining vigorous trees by tending operations should start from the early stages of development [21,28,31]. Once the trees become slender with small crowns (low LCRs), the recovery of diameter growth is difficult [28]. Moreover, after the height of the tree is stabilized, the slenderness decreases as trees continue to grow in diameter [21], while the crown remains constant or could even decrease further due to competition. As a result, the relationship between LCR and slenderness is affected, and becomes an irrelevant indicator for the threshold of live crown that ensures vigorous growth. Moreover, as mentioned above, the chance for adult trees with small crowns to regain a vigorous growth (and taper stems) after tending operations is lower. In this case, crown expansion (regrowth, increasing the LCR) is possible only by water sprouts (affecting economic value of the lower bole), and not by adding new crown at the upper part of the tree (more productive and not decreasing the economic value of the bole). This is why the interpretation of LCR as a guide for avoiding slenderness should be used in young forest stands, with trees still actively growing in height.
Turkey oak (Quercus cerris L.) is well represented across Europe, especially in the Balkan and Italian Peninsulas [32]. In Romania, it is among the top ten tree species, covering roughly 4% of the entire forestland [33]. It can make pure stands or mixtures with other oaks (Q. frainetto Ten., Q. petraea (Matt.) Liebl.) and various broadleaves from the hilly region [34]. The species is adapted to diverse site conditions (it can grow on a wide range of soils), being relatively tolerant to drought and air pollution [32]. The resilience of Turkey oak makes it an important tree species for sustainable and climate smart forest management in the future.
Taking into account those stated above, the present study aimed to assess the performance of the live crown ratio as an indicator in deciding the timing of tending operations for obtaining and maintaining vigorous Turkey oak trees.
2. Materials and Methods
2.1. Study Site
The research was carried out in the western part of Romania (Figure 1), in a mixed deciduous forest from a hilly region (300–400 m a.s.l.) close to the city of Deva. The forest is state owned and managed by the National Forest Administration, Romsilva (Hunedoara County Branch, Simeria Forest District). The slope is gentle (10 deg. in the first stand, and 15 deg. in the second) with a northern aspect. Climate is temperate-continental, with average annual temperatures around 9.9 °C and average annual precipitations of around 620 mm [35]. For data collection, two neighboring young and relatively even aged stands from Production Unit I Deva were selected [36]:
- (1)
- stand 28A (covering 18.5 ha): a naturally regenerated (seed and sprouts) mixture of 50% sessile oak (Quercus petraea (Matt.) Liebl.), 30% Turkey oak, 10% hornbeam (Carpinus betulus L.), and 10% planted red oak (Quercus rubra L.);
- (2)
- stand 28B (covering 50 ha): a naturally regenerated (seed and sprouts) mixture of 50% sessile oak, 40% Turkey oak, and 10% planted European larch (Larix decidua Mill.).
Both stands have originated from natural regeneration obtained after group shelterwood using a 20-year regeneration period. Therefore, although the structure is relatively uniform, the age of individual trees inside the stand can vary. According to the forest management plan [36], the average age in stand 28A is around 20 years while in stand 28B is around 30 years.
2.2. Methods
2.2.1. Data
Trees were selected using a stratified random sampling. In order to detect a trend between LCR and HDR, trees as different as possible in terms of the parameters used for analysis (diameter, height, crown length) should be sampled. In relatively uniform canopy stands (even aged, as those included here), these parameters are correlated to the social status of the tree (i.e., the crown class: dominant, codominant, intermediate, suppressed). However, while the large diameter trees are usually tall, and typically belong to upper crown classes (i.e., codominant or dominant trees), the small diameter trees could be either tall (e.g., the slender ones, belonging to intermediate or codominant classes), or short (the general case of the slender suppressed trees). Therefore, trees from all crown classes and of different diameters (inside a class) were included in the sample. A total of 80 trees were selected and measured in both stands (35 in stand 28B and 45 in stand 28A). The height (H) ranged from 6.2 m to 17.5 m, and diameter at breast height (DBH) from 4.0 cm to 23.2 cm. For each tree total height and height to the base of the live crown were measured with an ultrasound clinometer (Vertex IV—Haglöf Sweden AB). Diameter at breast height was measured to the nearest millimeter using a caliper (Mantax precision—Haglöf Sweden AB). As stems are not perfectly cylindrical, two measurements were taken for each tree in two perpendicular directions, and the average of these two measurements was further used in analysis. The base of the live crown was considered the point on the stem determined by a line parallel to the ground, drawn from the lowest live foliage of the lowest living branch (a branch of similar size to those from the main crown; any water sprouts below this point were ignored). When the vertical cross-section showed an asymmetric base of the crown, the base was considered at half distance between the upper and lower limit.
2.2.2. Calculation of Height-Diameter Ratio and Live Crown Ratio
The height-to-diameter ratio (HDR), alternatively referred to as the slenderness coefficient, was computed as the ratio of total tree height to diameter at breast height and the live crown ratio (LCR—computed as the ratio between the length of the living crown and the total height of the tree) were computed for each tree using the following formulae:
where HDR is the H-D ratio or the slenderness coefficient; Htot is total tree height; and DBH is diameter at breast height (both Htot and DBH are expressed in similar units, therefore HDR is dimensionless).
The live crown ratio (LCR) was computed as the ratio between the length of the living crown and the total height of the tree, both in meters:
where LCR is the live crown ratio; CL is the crown length (m); and Htot is the total tree height (m).
2.2.3. Determining the HDR Threshold for Slenderness
The computed LCR ranged from 0.19 to 0.61, while the HDR from 63.50 to 192.86. The two variables (i.e., HDR and LCR) were plotted to decide which HDR value would be more appropriate to be considered as a threshold for slenderness (tree instability) (Figure 2). Two threshold values (80 and 100) were used for HDR, while for LCR the limits of the interval proposed by the existing literature were used (i.e., 0.3 and 0.4). Trees with crowns shorter than the threshold but not slender and those with longer crowns than the threshold but having slender stems would be exceptions from the rule (falling inside the grey quadrats from Figure 2).
Next, in order to choose the most appropriate HDR threshold, we used an expedite approach: the size of the triangle determined by the threshold lines for HDR and LCR and the line of the linear regression run through the data. As can be observed in Figure 2 (green triangles), the triangle area was smaller for HDR = 100 than for HDR = 80, regardless of LCR value. Therefore, to classify trees as slender and not slender for further analysis, we used a HDR threshold of 100.
2.2.4. Statistical Analysis
The expedite analysis presented in the previous section suggests that the LCR threshold for slenderness would be closer to 0.4 than to 0.3 (Figure 2d). To determine the LCR for which Turkey oak trees become slender, we used two complementary approaches proposed by Müller and Bütler [37]:
- (1)
- conditional inference tree method [38] combined with resampling by bootstrapping, to obtain not only the threshold value, but also a confidence interval. The bootstrapping approach to obtain the confidence interval of the threshold LCR is preferred to analytical approach since it is easily implemented and can deal with potential skewed distributions. Furthermore, reporting an interval instead of a single estimate value makes the results more applicable into practice [37];
- (2)
- the logistic regression model [39]. After selecting the HDR threshold (Section 2.2.3), the trees were classified as slender (HDR > 100) and not slender (HDR < 100). The logistic regression model was:
Analyses were performed in the R [40] using an adapted script from Müller and Bütler [37]. Since DBH is measured at a fixed tree height (i.e., 1.3 m) for trees of various heights (including rather short ones), the calculated HDR may be negatively impacted. A stem diameter measurement at a relative tree height (e.g., 0.1*H) may be more appropriate [41]. Therefore, to investigate whether the measurement of DBH at 1.3 m would affect our results, after analyzing all trees together, we have split the dataset in two: (i) trees taller than 12.5 m (i.e., trees for which 1.3 m represents roughly 10% of the total height or more), and (ii) trees shorter than 12.5 m. The analysis was then repeated.
3. Results
The conditional inference tree method detected a threshold between slender and not slender trees at a LCR value of 0.3710 (Figure A1), significant at p < 0.001. This confirms the trend in the data from Figure 2d (which indicates a threshold closer to 0.4 rather than 0.3 for LCR). Moreover, the 95% confidence interval obtained by bootstrapping resampling method (based on 1000 replicates) was between 0.3457 and 0.3980, relatively, close to the detected threshold.
The logistic regression led to a threshold value for LCR of 0.4342. Despite the regression coefficients being statistically significant (Table A1), this value was not included in the 95% confidence interval of conditional inference method (Figure 3), which suggests that the LCR estimates derived from the two complementary methods used in this study may be significantly different.
The LCR estimate from logistic regression approach (i.e., LCR = 0.434) was very close to the LCR value that corresponded to the intersection of linear regression line with HDR = 100 (i.e., LCR = 0.439, Figure 2b,d). However, this value is larger than the maximum threshold reported by the literature (i.e., 0.4) which may nevertheless be more appropriate for very shade tolerant species, not the case of Turkey oak.
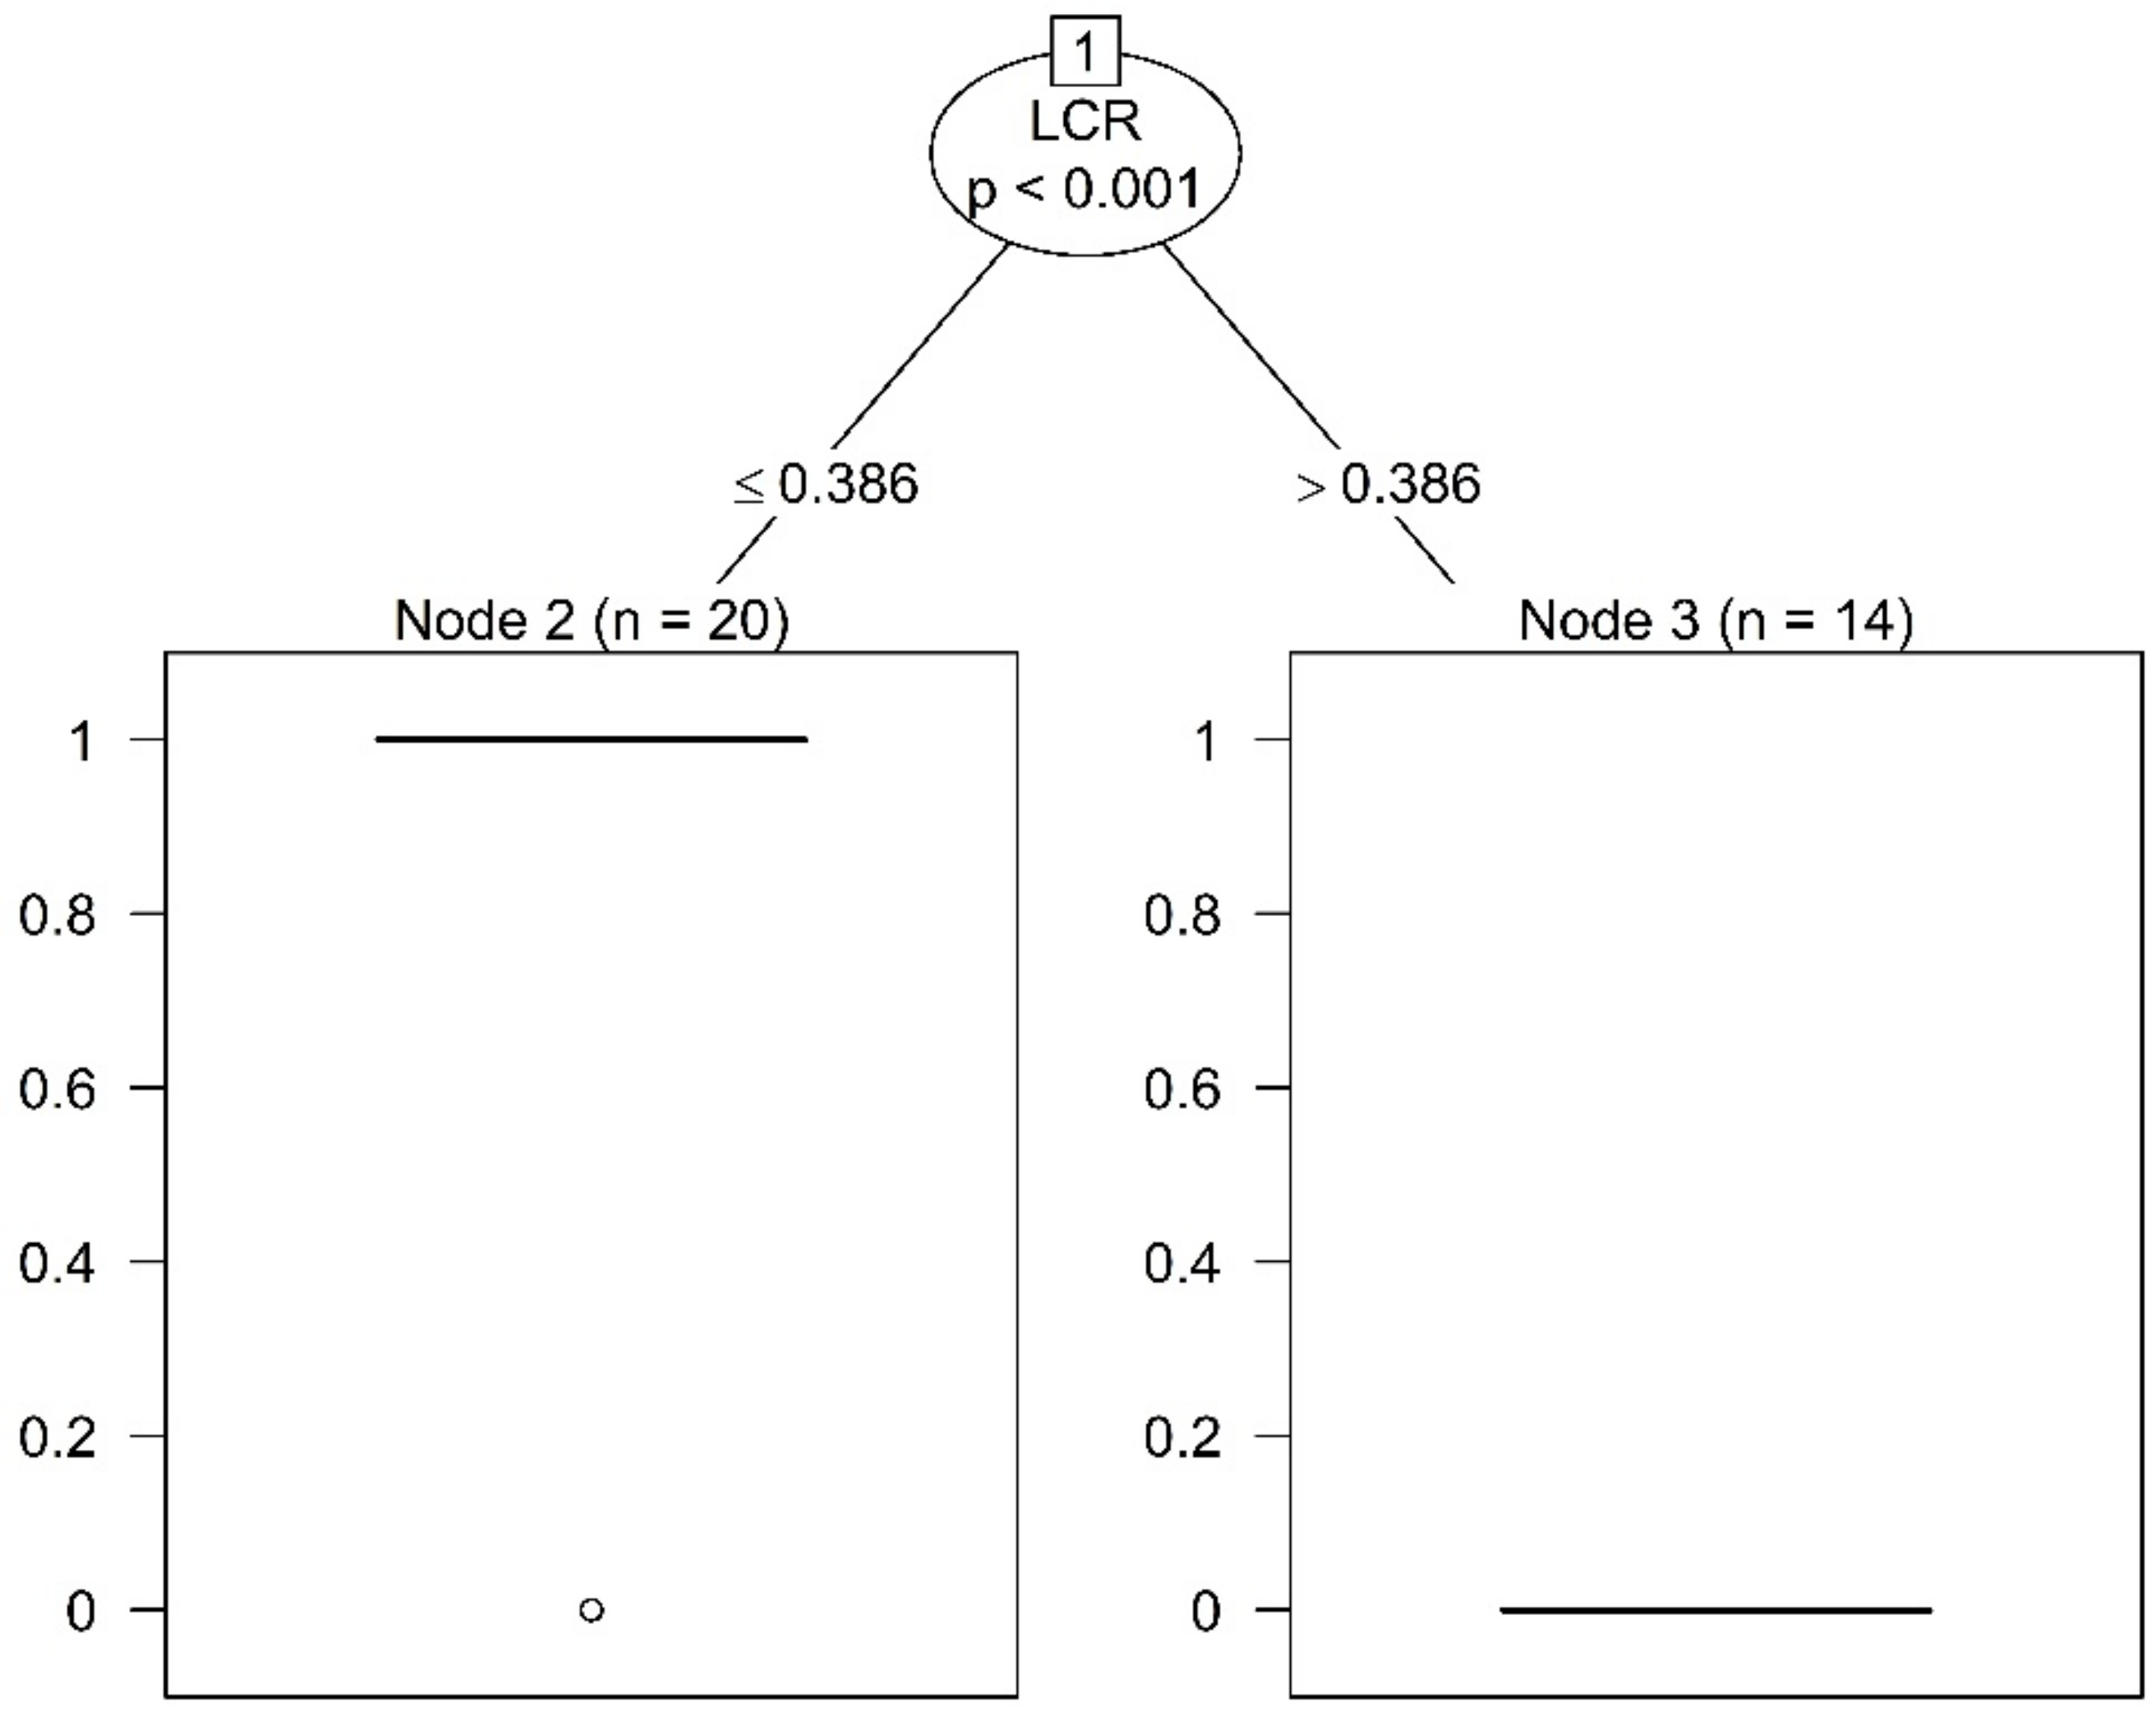
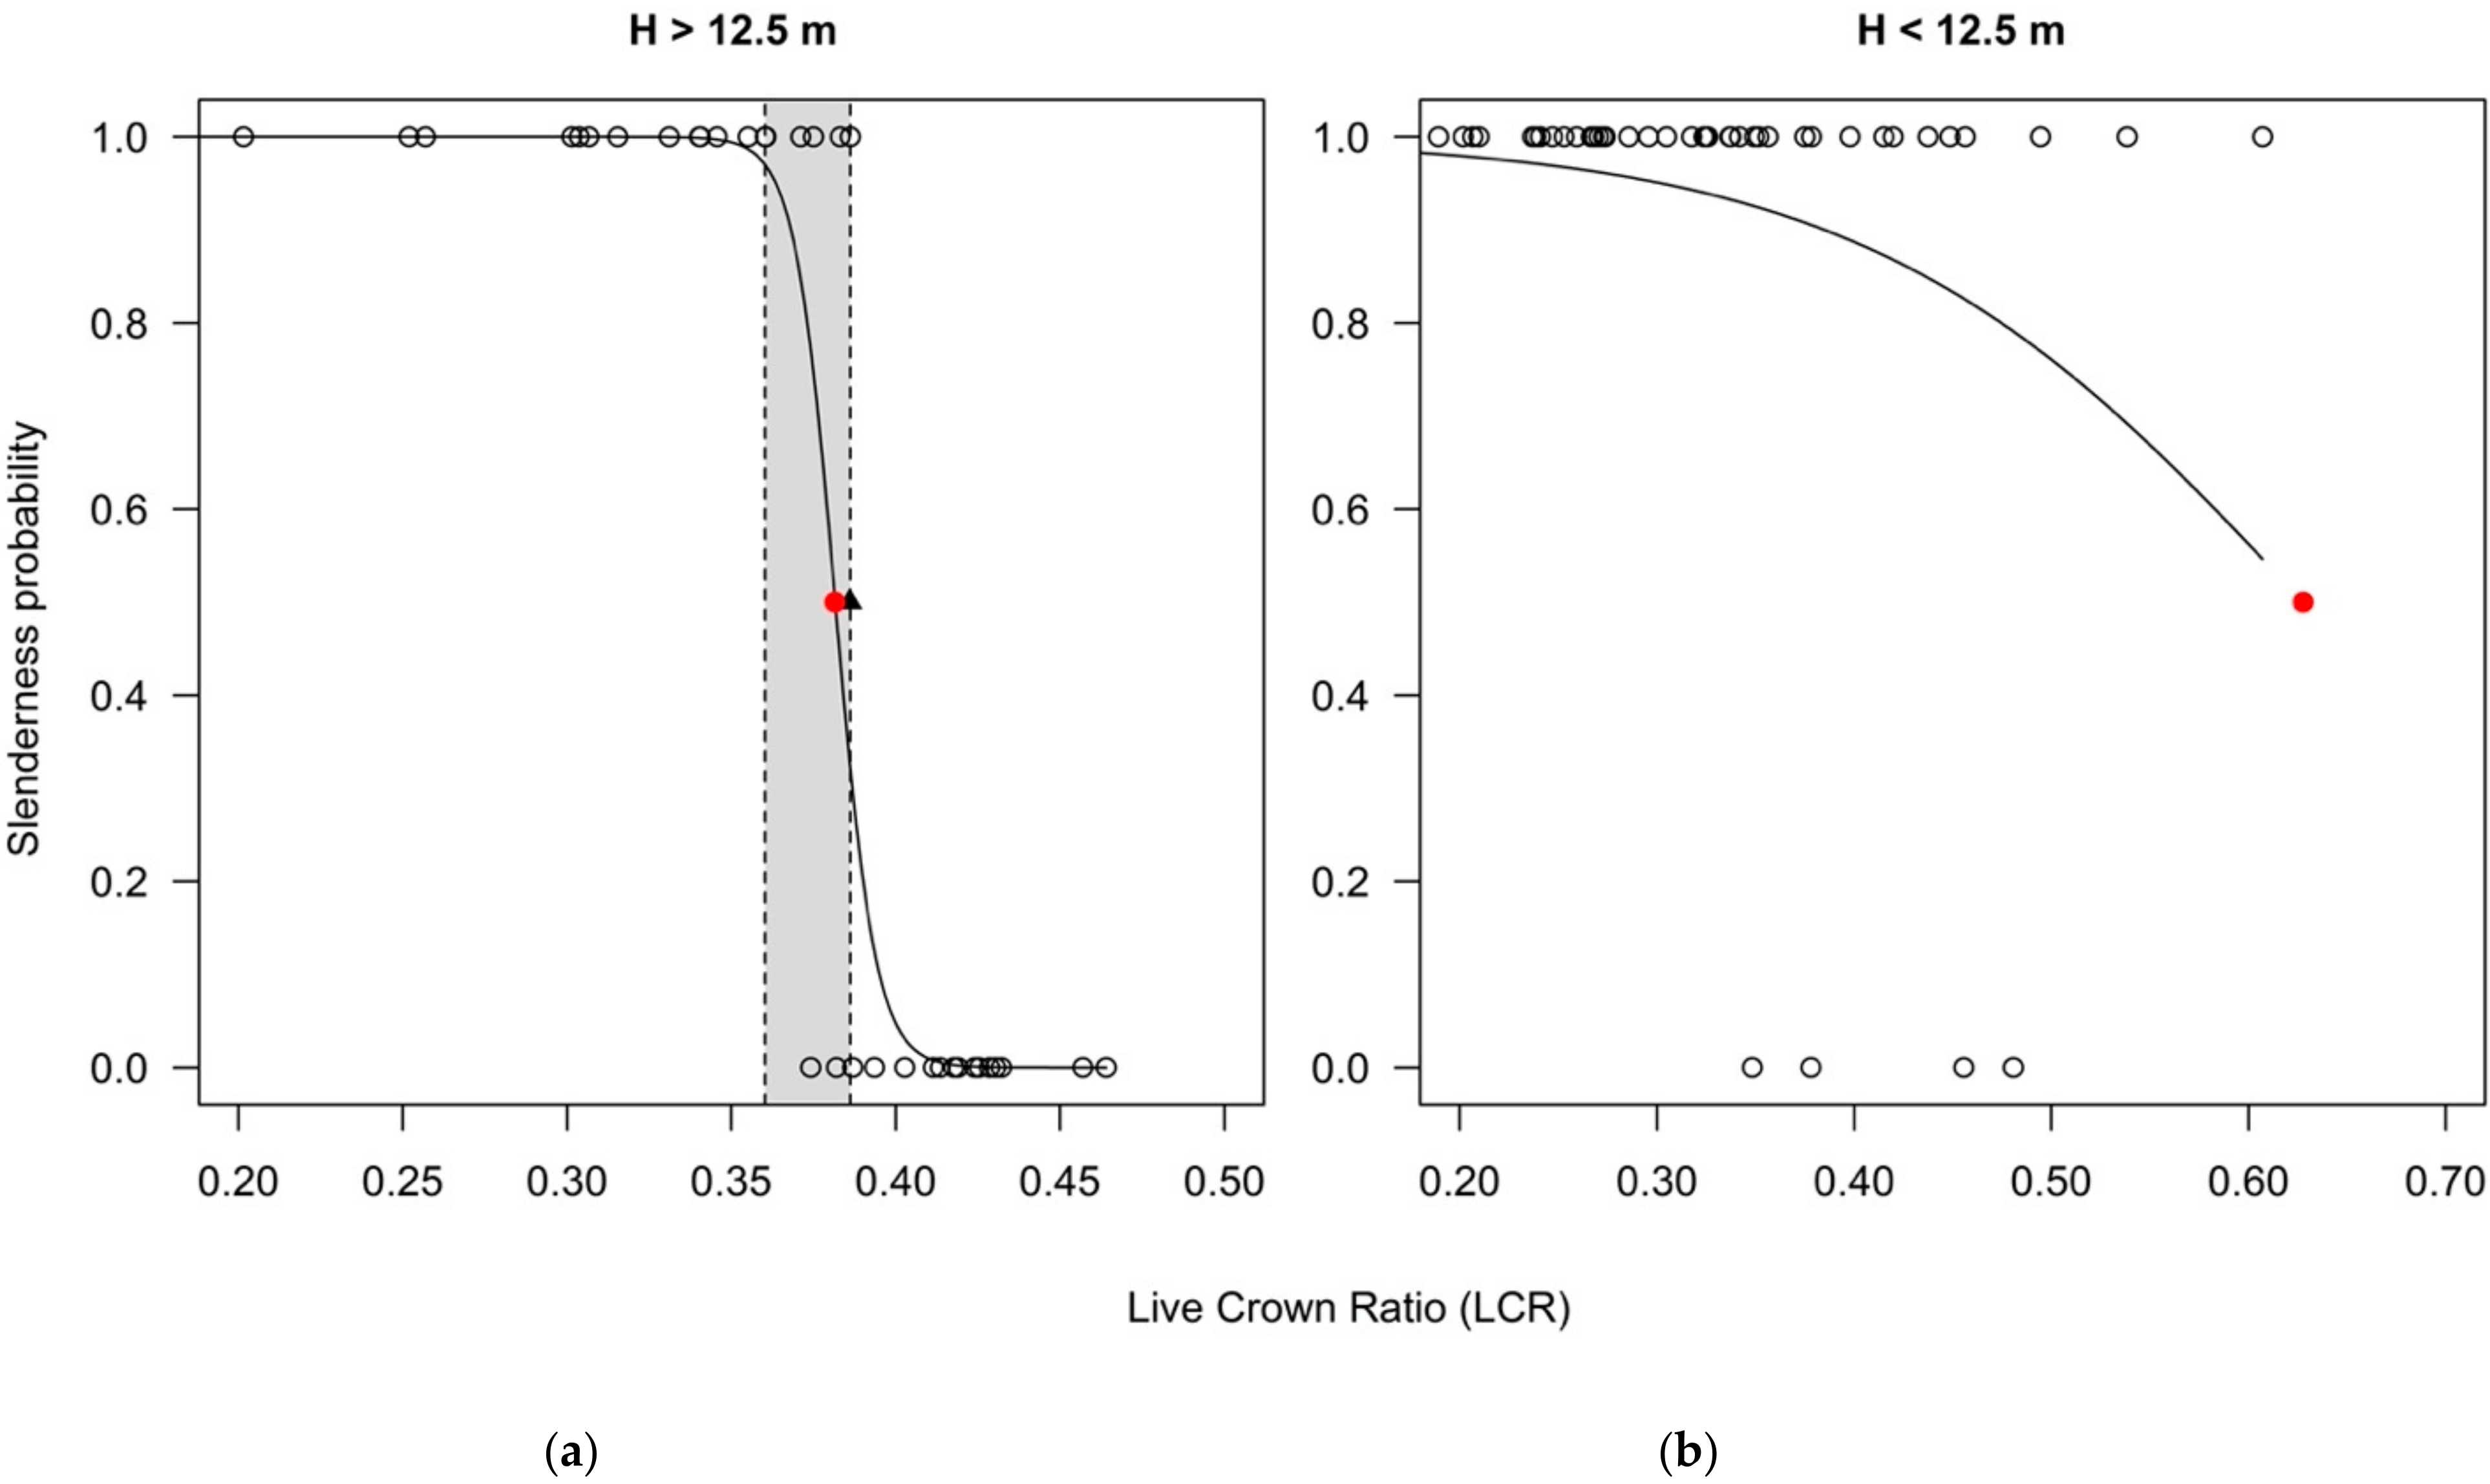
The analyses on the segregated data showed important differences between the two categories (trees taller vs. shorter than 12.5 m). For the 34 trees taller than 12.5 m (for which the calculated HDR is less likely affected by the fixed height where the DBH is measured), the conditional inference tree method detected a threshold between slender and not slender trees at a LCR value of 0.3860 (Figure A2), statistically significant for p = 0.001. The value is slightly larger than for the entire data set. Moreover, the bootstrapping resampling method (based on 1000 replicates) led to a narrower 95% confidence interval, between 0.3603 and 0.3862.
The corresponding LCR estimate from the logistic regression was 0.3815, with coefficients not statistically significant (although close to the significance threshold of 0.05- Table A2). Nevertheless, for trees taller than 12.5 m, the LCR estimate from logistic regression was included within the 95% confidence interval of the LCR estimate from the conditional inference tree method (Figure 4a). This suggests the LCR estimates from logistic regression and conditional inference tree methods may not be statistically different in this case.
For the 46 trees shorter than 12.5 m, the conditional inference tree method could not calculate any LCR threshold estimate, while the one from the logistic regression was 0.6277. The intercept was statistically significant for a 0.05 threshold, while the LCR was not (Table A3). The estimated LCR was outside of the range of the dataset, as no tree had such a long crown. (Figure 4b), and also much higher compared to the upper limit of the interval recommended by the literature.
4. Discussion
Measuring trees with high precision inside closed canopy stands could be a difficult task. Although modern tools (using ultrasound or laser) assist researchers and practitioners in measuring tree height with quite adequate precision, the determination of the base of the live crown, although theoretically an easy task, could bring many challenges (and associated errors) in practice. Identifying the lowest living branch (of a comparable size to the rest of the crown) can be difficult for trees with decurrent crown forms (having upright branches of various sizes along the stem). Moreover, crown length does not always express accurately the crown volume (more relevant for the leaf area and therefore the photosynthetic capacity of the tree). Since, most of the time (except in regular plantations), spacing in stands is uneven, crown width is expected to vary considerably. In addition, both the asymmetric vertical crown profiles and the irregular shapes (more prevalent in trees with decurrent growth forms, such as oaks) can affect greatly the crown volume. Therefore, trees with similar LCR might indeed have quite different crown volumes and leaf areas. Last but not least, ignorance of water sprouts (which sometimes are numerous) could overlook the analysis an important leaf area (and therefore underestimates the real crown size). Despite all these challenges, the results in the case of the Turkey oak in this study showed a good correlation between the two variables, especially in the case of trees taller than 12.5 m.
The slenderness threshold chosen for this case (HDR = 100) is not only supported by the expedite analysis from this research (shown in Figure 2), but also due to an expected higher resistance of the stems compared to other species (especially conifers, for which a lower threshold was proposed: 60 by [22], or 80 by [21,28]). This would be the result of the fast early growth and development of a taproot system with deep lateral roots [42], making the species windfirm. Moreover, being deciduous, it is less affected by the cumulated effects of snow and wind during the winter (one of the main causes for stem breakage and uprooting in conifers).
Although similar to other oak species the Turkey oak is light demanding, it can withstand partial shade from a light stand canopy [43]. It was therefore expected to behave differently than the very shade intolerant pines (for which a threshold of 0.3 was proposed—[30]), and have a LCR threshold value larger than the one of these species. However, for both datasets (the one with all trees and the one only with trees taller than 12.5 m), the conditional inference tree method has detected relatively large values for the LCR threshold (0.371 and 0.386, respectively). Moreover, the confidence interval obtained by bootstrap (95% CI: 0.3457 to 0.3980 for all trees; 0.3603 to 0.3862, for trees taller than 12.5 m) was in the upper part of the range mentioned by existing literature (0.3–0.4). The logistic regression produced similarly high threshold values (0.3815) for the set with trees taller than 12.5 m, and even higher for the entire dataset (0.4342). Such significantly high threshold LCR values would have been expected for more shade tolerant species.
Comparing the two methods, for the entire dataset, the threshold estimate obtained from the logistic regression was not only rather unrealistic, but also very different from the one produced by the conditional inference tree (even falling far outside of the confidence interval of this threshold). One explanation for this high value obtained for the entire tree dataset with the logistic regression could be the presence of many trees with rather long crowns but classified as slender (Figure 3). This has determined not only a very small number of trees classified as not slender (i.e., only four cases), but also a very large LCR interval for slender trees (which completely included the four ‘not slender’ cases, hindering the detection of segregation, if present—see Figure 3). Most of such abnormal cases (high LCR but also high HDR) proved to be small size trees for which the calculation of slenderness using DBH (instead of a diameter at 10% of height) could have been affected by errors, as mentioned previously. Therefore, shorter trees (despite having a long crown) might have been erroneously classified as slender while being vigorous. The separate analysis confirmed this, since for trees below 12.5 m height it did not identify a threshold (the conditional inference tree) or the one identified was highly unrealistic (the logistic regression). Therefore, the results obtained for the subset of trees taller than 12.5 m is considered to give more accurate results, since they are less likely affected by the lack of representativeness of the fixed height where DBH is measured. Moreover, other future research on this topic involving small size trees should take into account this potentially important source of errors during the field measurements and measure diameter at 0.1*H, as recommended by literature [41].
Therefore, between the two different methods used for analysis, the conditional inference tree method appears more robust than the logistic regression, being less likely affected by the use of breast height (1.3 m) in measuring diameter of small trees. Additionally, this method allows for the calculation of the confidence interval by bootstrapping (a range of potential thresholds), which is more valuable in practice than a single value [37]. However, after eliminating the small trees from the analysis, both methods led to similar and more realistic results (and a narrower confidence interval). Even though for this case the coefficients of the logistic regression were statistically not significant (but very close to statistical significance thresholds), the value of the LCR threshold was close to the one detected by the conditional inference tree (with statistical significance). Moreover, it fell well inside the confidence interval calculated around the threshold. Therefore, the simultaneous use of both methods on the same dataset (as proposed by [37]) appears efficient in determining the LCR threshold of the transition from vigorous to slender trees.
This case study has included a limited number of trees growing on similar site conditions. Therefore, for general applicability in practice, future work should analyze more trees growing on diverse sites. Moreover, although age is not expected to influence the relationship between LCR and HDR, the sample could be expanded to include trees of various ages but still having active height growth.
5. Conclusions
The live crown ratio (determined as a ratio between the length of the living crown and the total height of the tree) proves to be an effective indicator for vigor of growth in Turkey oak trees. A slenderness threshold of HDR = 100 appears appropriate for ensuring vigorous trees from this species. To acquire such stable trees, a LCR of around 0.36–0.39 must be maintained. This threshold could be therefore used for deciding the timing for thinning of young Turkey oak stands. However, thinning should start early (i.e., maintenance of appropriate LCRs to prevent slenderness) rather than late in the stand development, in order to ensure an appropriate stand stability and resilient forests. This approach might not follow precisely the natural development of young stands (i.e., not very close-to-nature). However, in the present context of climate change, could be more “climate-adapted forest management” [5]. Therefore, for a “climate-smart-forestry”, forest policies should consider intense precommercial thinning of young regenerated stands to ensure a proper live crown ratio.
Author Contributions
Conceptualization, P.T.S.; methodology, P.T.S. and A.A.Ș.; software, P.T.S. and I.D.; writing—original draft preparation, P.T.S.; writing—review and editing, P.T.S., A.A.Ș. and I.D. All authors have read and agreed to the published version of the manuscript.
Funding
This research received no external funding.
Institutional Review Board Statement
Not applicable.
Informed Consent Statement
Not applicable.
Acknowledgments
Data was collected during the fieldwork for the dissertation thesis of the last author, presented for the bachelor’s degree at the Faculty of Silviculture and Forest Engineering (Transilvania University of Brasov, Romania) in 2020. Access granted by the National Forest Administration ROMSILVA (Hunedoara County Branch, Simeria Forest District) to field sites and data from forest management plans is greatly appreciated.
Conflicts of Interest
The authors declare no conflict of interest.
Appendix A

Table A1.
Coefficients of the logistic regression equation for the entire data set.
| Estimate | Std. Error | z Value | p Value | |
|---|---|---|---|---|
| Intercept | 7.580 | 1.907 | 3.975 | 7.03 × 10⁻⁵ |
| LCR | −17.456 | 4.881 | −3.577 | 0.000348 |
Table A2.
Coefficients of the logistic regression equation for trees taller than 12.5 m.
| Estimate | Std. Error | z Value | p Value | |
|---|---|---|---|---|
| Intercept | 62.24 | 32.09 | 1.939 | 0.0525 |
| LCR | −163.11 | 84.15 | −1.938 | 0.0526 |
Table A3.
Coefficients of the logistic regression equation for trees shorter than 12.5 m.
| Estimate | Std. Error | z Value | p Value | |
|---|---|---|---|---|
| Intercept | 5.685 | 2.203 | 2.581 | 0.00986 |
| LCR | −9.058 | 5.338 | −1.697 | 0.08974 |
Figure A1.
Results of the conditional inference tree method for the entire dataset (n—number of trees in one category—33 not slender, 47 slender).
Figure A1.
Results of the conditional inference tree method for the entire dataset (n—number of trees in one category—33 not slender, 47 slender).
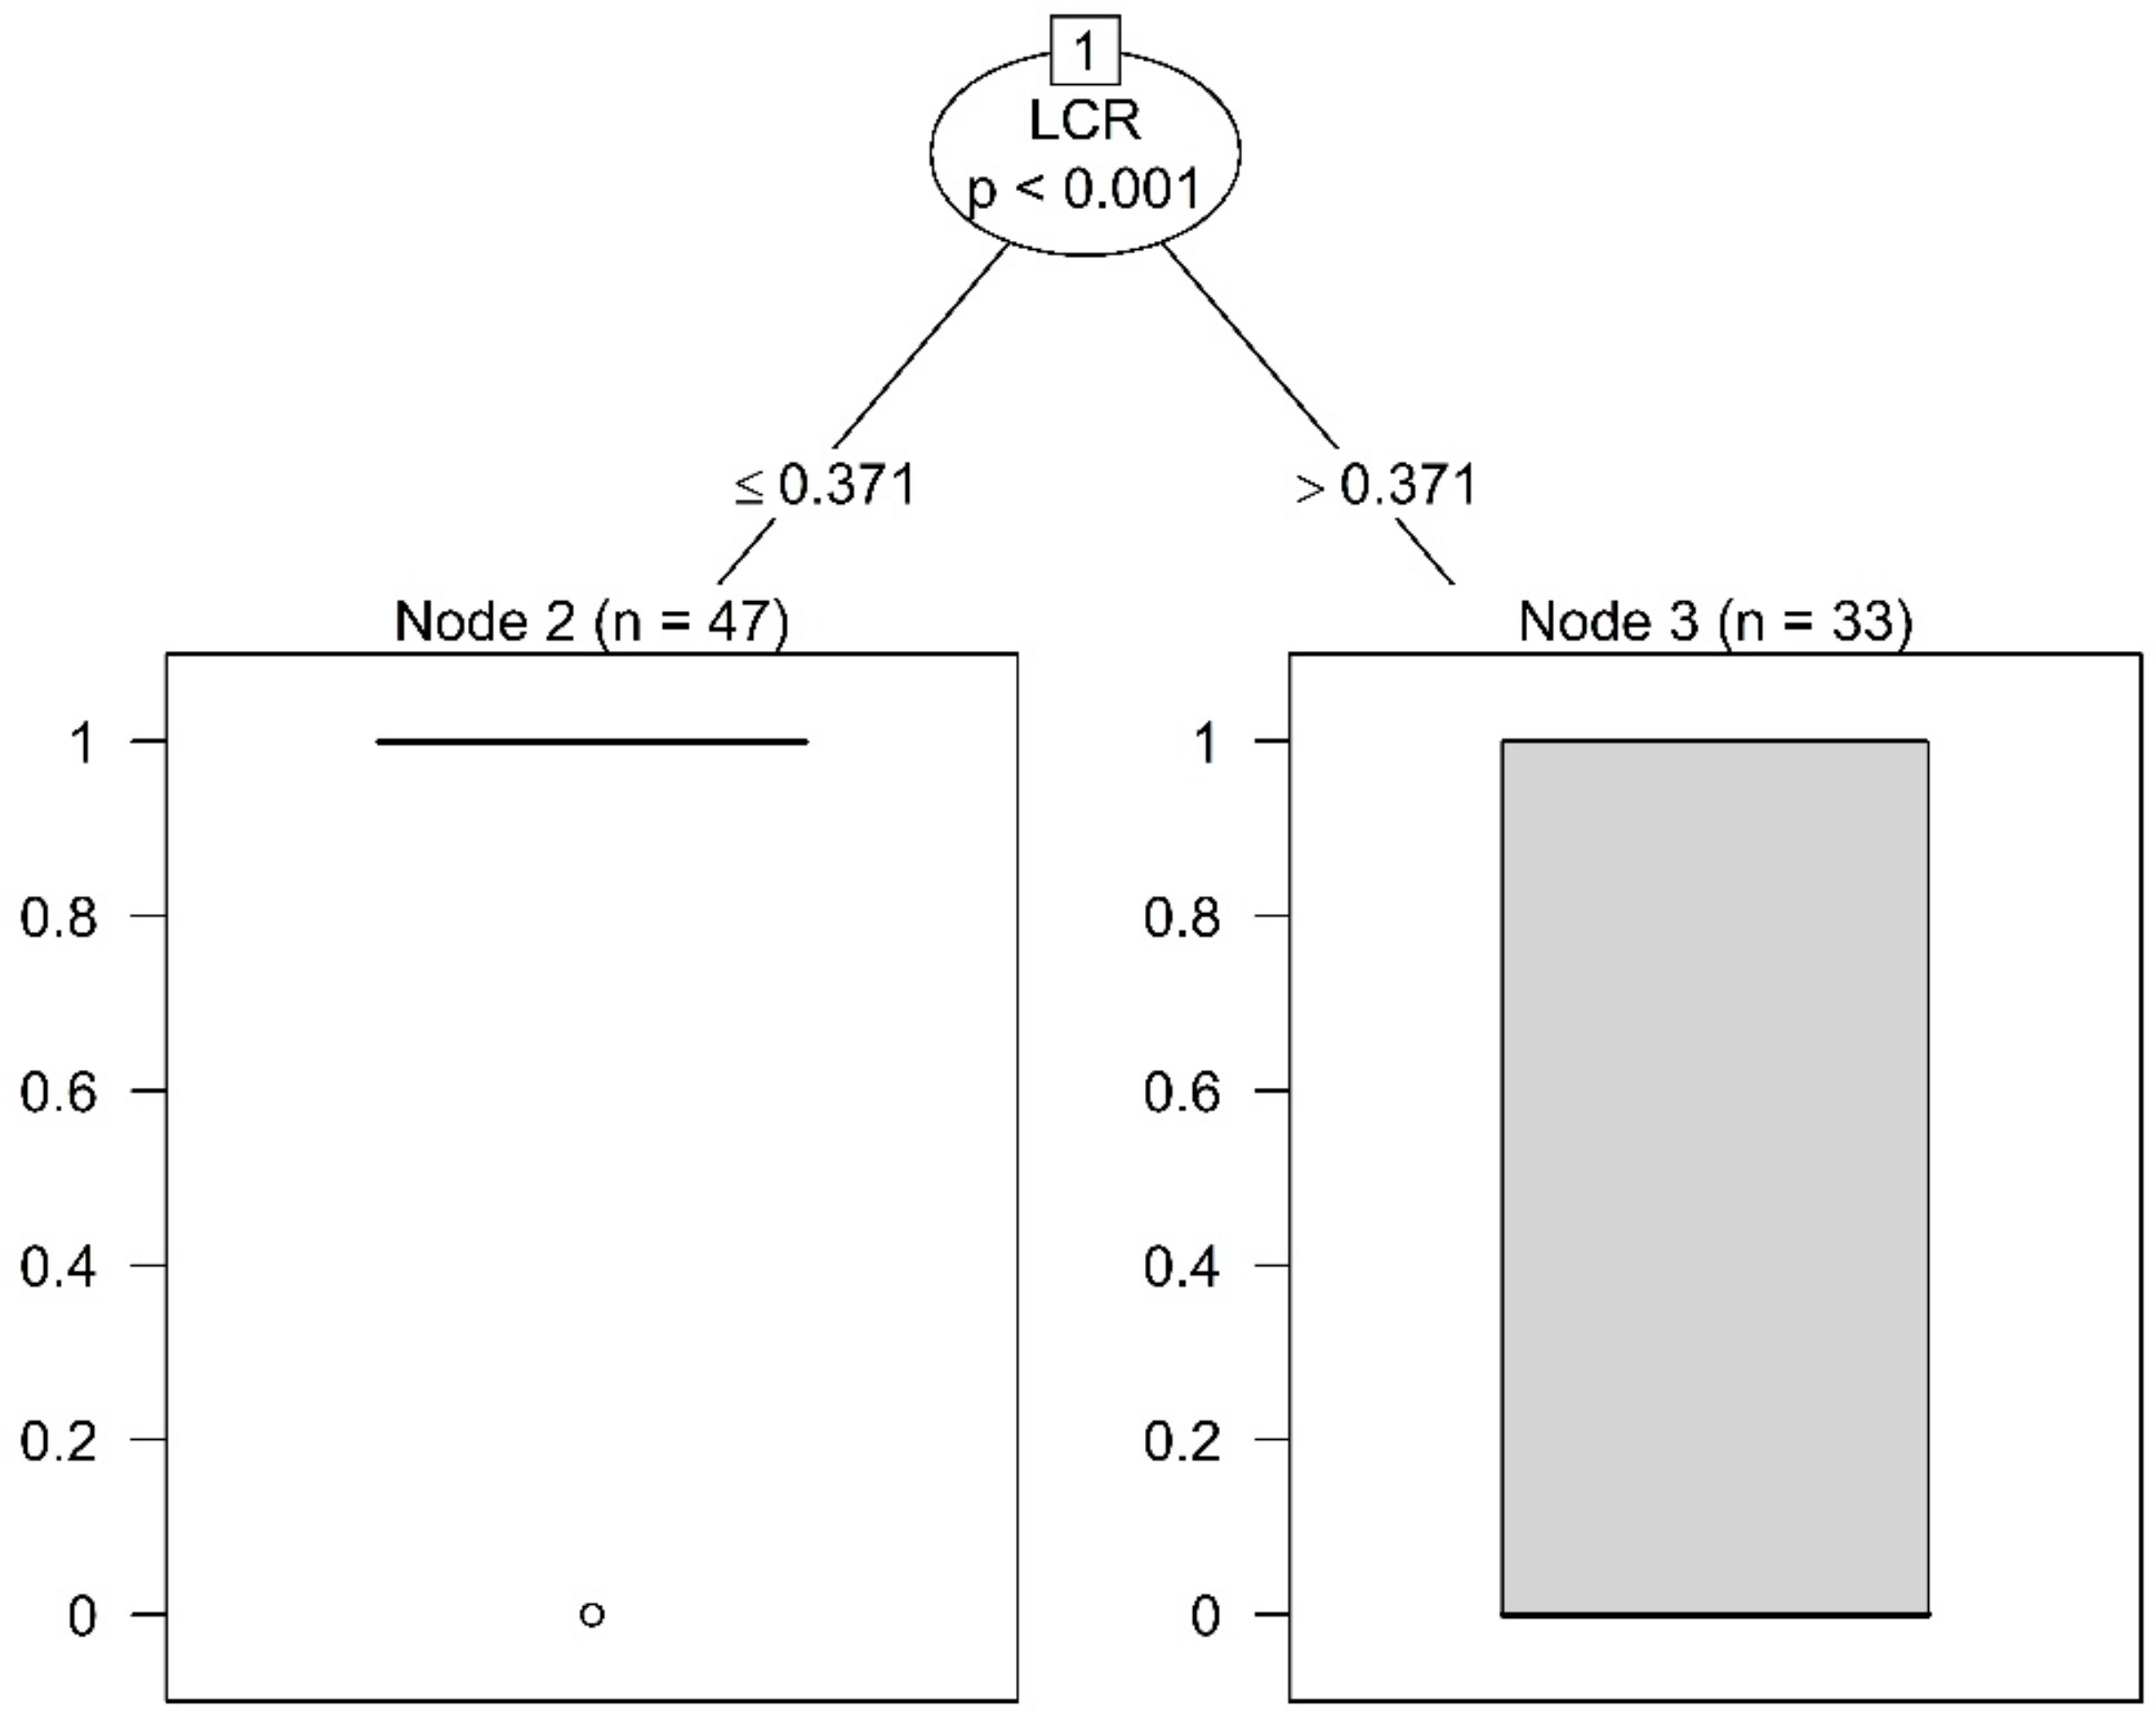
Figure A2.
Results of the conditional inference tree method for trees taller than 12.5 m (n—number of trees in one category—33 not slender, 47 slender).
Figure A2.
Results of the conditional inference tree method for trees taller than 12.5 m (n—number of trees in one category—33 not slender, 47 slender).
References
- Blennow, K.; Olofsson, E. The probability of wind damage in forestry under a changed wind climate. Clim. Change 2008, 87, 347–360. [Google Scholar] [CrossRef]
- Donat, M.G.; Leckebusch, G.C.; Pinto, J.G.; Ulbrich, U. European storminess and associated circulation weather types: Future changes deduced from a multi-model ensemble of GCM simulations. Clim. Res. 2010, 42, 27–43. [Google Scholar] [CrossRef]
- Moriondo, M.; Good, P.; Durao, R.; Bindi, M.; Giannakopoulos, C.; Corte-Real, J. Potential impact of climate change on fire risk in the Mediterranean area. Clim. Res. 2006, 31, 85–95. [Google Scholar] [CrossRef]
- Seidl, R.; Thom, D.; Kautz, M.; Martin-benito, D.; Peltoniemi, M.; Vacchiano, G.; Wild, J.; Ascoli, D.; Petr, M.; Honkaniemi, J. Forest disturbances under climate change. Nat. Clim. Chang. 2017, 7, 395–402. [Google Scholar] [CrossRef] [Green Version]
- Brang, P.; Spathelf, P.; Larsen, J.B.; Bauhus, J.; Bončína, A.; Chauvin, C.; Drössler, L.; García-Güemes, C.; Heiri, C.; Kerr, G.; et al. Suitability of close-to-nature silviculture for adapting temperate European forests to climate change. Forestry 2014, 87, 492–503. [Google Scholar] [CrossRef] [Green Version]
- Waring, R.H.; Thies, W.G.; Muscato, D. Stem growth per unit of leaf area: A measure of tree vigor. For. Sci. 1980, 26, 112–117. [Google Scholar]
- Oliver, C.D.; Larson, B.C. Forest Stand Dynamics: Updated Edition; John Wiley and Sons: Hoboken, NJ, USA, 1996. [Google Scholar]
- Ashton, M.S.; Kelthy, M.J. The Practice of Silviculture: Applied Forest Ecology, 10th ed.; John Wiley & Sons: Hoboken, NJ, USA, 2018. [Google Scholar]
- Daniel, T.W.; Helms, J.A.; Baker, F.S. Principles of Silviculture; McGraw-Hill: New York, NY, USA, 1979. [Google Scholar]
- Kozlowski, T.T. Growth and Development of Trees. Volume I: Seed Germination, Ontogeny, and Shoot Growth; Academic Press: New York, NY, USA, 1971. [Google Scholar]
- Smith, D.M.; Larson, B.G.; Kelty, M.J.; Ashton, P.M.S. The Practice of Silviculture: Applied Forest Ecology, 9th ed.; John Wiley and Sons Ltd.: New York, NY, USA, 1997. [Google Scholar]
- Larsson, S.; Oren, R.; Waring, R.H.; Barrett, J.W. Attacks of mountain pine beetle as related to tree vigor of ponderosa pine. For. Sci. 1983, 29, 395–402. [Google Scholar]
- Mitchell, R.G.; Waring, R.H.; Pitman, G.B. Thinning lodgepole pine increases tree vigor and resistance to mountain pine beetle. For. Sci. 1983, 29, 204–211. [Google Scholar]
- Waring, R.H.; Pitman, G.B. Modifying lodgepole pine stands to change susceptibility to mountain pine beetle attack. Ecology 1985, 66, 889–897. [Google Scholar] [CrossRef]
- Wenk, M.; Apel, K.H. Die Regenerationsfähigkeit von durch Fraß des Kiefernspinners (Dendrolimus pini L.) und der Nonne (Lymantria monacha L.) geschädigten Kiefernbeständen in Brandenburg. Eberswalder Forstl. Schr. 2007, 32, 280–287. [Google Scholar]
- Ledo, A.; Paul, K.I.; Burslem, D.F.R.P.; Ewel, J.J.; Barton, C.; Battaglia, M.; Brooksbank, K.; Carter, J.; Eid, T.H.; England, J.R.; et al. Tree size and climatic water deficit control root to shoot ratio in individual trees globally. New Phytol. 2018, 217, 8–11. [Google Scholar] [CrossRef] [PubMed]
- Poorter, H.; Niklas, K.J.; Reich, P.B.; Oleksyn, J.; Poot, P.; Mommer, L. Biomass allocation to leaves, stems and roots: Meta-analyses of interspecific variation and environmental control. New Phytol. 2012, 193, 30–50. [Google Scholar] [CrossRef] [PubMed]
- Tavankar, F.; Lo Monaco, A.; Nikooy, M.; Venanzi, R.; Bonyad, A.; Picchio, R. Snow damages on trees of an uneven age in mixed broadleaf forests: Effects of topographical conditions and tree characteristics. J. For. Res. 2019, 30, 1383–1394. [Google Scholar] [CrossRef]
- Wallentin, C.; Nilsson, U. Storm and snow damage in a Norway spruce thinning experiment in southern Sweden. Forestry 2014, 87, 229–238. [Google Scholar] [CrossRef] [Green Version]
- Petty, J.A.; Worrell, R. Stability of coniferous tree stems in relation to damage by snow. Forestry 1981, 54, 115–128. [Google Scholar] [CrossRef]
- Cremer, K.; Borough, C.; Mckinnell, F.; Carter, A. Effects of stocking and thinning on wind damage in plantations. N. Z. J. For. Sci. 1982, 12, 244–268. [Google Scholar]
- Petty, J.A.; Swain, C. Factors influencing stem breakage of conifers in high winds. Forestry 1985, 58, 75–84. [Google Scholar] [CrossRef]
- Nykänen, M.L.; Peltola, H.; Quine, C.; Kellomäki, S.; Broadgate, M. Factors affecting snow damage of trees with particular reference to European conditions. Silva Fenn. 1997, 31, 193–213. [Google Scholar] [CrossRef] [Green Version]
- Peltola, H.; Nykänen, M.L.; Kellomäki, S. Model computations on the critical combination of snow loading and windspeed for snow damage of Scots pine, Norway spruce and Birch sp. at stand edge. For. Ecol. Manag. 1997, 95, 229–241. [Google Scholar] [CrossRef]
- Cameron, A.D. Importance of early selective thinning in the development of long-term stand stability and improved log quality: A review. Forestry 2002, 75, 25–35. [Google Scholar] [CrossRef]
- Sellier, D.; Fourcaud, T. Crown structure and wood properties:Influence on tree sway and response to high winds. Am. J. Bot. 2009, 96, 885–896. [Google Scholar] [CrossRef] [PubMed]
- Kitenberga, M.; Šņepsts, G.; Vuguls, J.; Elferts, D.; Jaunslaviete, I.; Jansons, Ā. Tree-and stand-scale factors shape the probability of wind damage to birch in hemiboreal forests. Silva Fenn. 2021, 55, 1–15. [Google Scholar] [CrossRef]
- Wonn, H.T.; O’Hara, K.L. Height:diameter ratios and stability relationships for four northern Rocky Mountain tree species. West. J. Appl. For. 2001, 16, 87–94. [Google Scholar] [CrossRef] [Green Version]
- Waring, R.H.; Schroeder, P.E.; Oren, R. Application of the pipe model theory to predict canopy leaf area. Can. J. For. Res. 1982, 12, 556–560. [Google Scholar] [CrossRef]
- Alabama Cooperative Extension Service. Thinning Pine Stands for Top Returns. Forest Management Fact Sheet (Circular ANR-396); Alabama Cooperative Extension Service: La Fayette, AL, USA, 1983. [Google Scholar]
- Schmidt, W.C.; Seidel, K.W. Western larch and space: Thinning to optimize growth. In Proceedings-Future Forests of the Mountain West: A Stand Culture Symposium; Gen. Tech. Rep. INT-243; US Department of Agriculture, Forest Service, Intermountain Research Station: Ogden, UT, USA, 1988. [Google Scholar]
- de Rigo, D.; Enescu, C.M.; Houston Durrant, T.; Caudullo, G. Quercus cerris in Europe: Distribution, habitat, usage and threats. In European Atlas of Forest Tree Species; San-Miguel-Ayanz, J., de Rigo, D., Caudullo, G., Houston Durrant, T., Mauri, A., Eds.; Publishing Office European: Luxembourg, 2016; pp. 148–149. [Google Scholar]
- NFI Forest Resources Assessment in Romania, Cycle II. Available online: http://roifn.ro/site/rezultate-ifn-2/ (accessed on 15 September 2021).
- Șofletea, N.; Curtu, L. Dendrologie; Editura Universităţii Transilvania din Brasov: Brasov, Romania, 2007. [Google Scholar]
- Fick, S.E.; Hijmans, R.J. WorldClim 2: New 1-km spatial resolution climate surfaces for global land areas. Int. J. Climatol. 2017, 37, 4302–4315. [Google Scholar] [CrossRef]
- FMP. Forest Management Plan for the Production Unit No. I Deva, Forest District Simeria; FMP: Bucharest, Romania, 2012. [Google Scholar]
- Müller, J.; Bütler, R. A review of habitat thresholds for dead wood: A baseline for management recommendations in European forests. Eur. J. For. Res. 2010, 129, 981–992. [Google Scholar] [CrossRef]
- Hothorn, T.; Hornik, K.; Zeileis, A. Ctree: Conditional inference trees. Compr. R Arch. Netw. 2015, 8, 1–34. [Google Scholar]
- Quinn, G.P.; Keough, M.J. Experimental Design and Data Analysis for Biologists; Cambridge University Press: Cambridge, UK, 2002. [Google Scholar]
- R Core Team. R: A Language and Environment for Statistical Computing; R Foundation for Statistical Computing: Vienna, Austria, 2017. [Google Scholar]
- Fehrmann, L.; Kleinn, C. General considerations about the use of allometric equations for biomass estimation on the example of Norway spruce in central Europe. For. Ecol. Manag. 2006, 236, 412–421. [Google Scholar] [CrossRef]
- Praciak, A.; Pasiecznik, N.; Sheil, D.; Van Heist, M.; Sassen, M.; Correia, C.S.; Dixon, C.; Fyson, G.; Rushford, K.; Teeling, C. The CABI Encyclopedia of Forest Trees; CABI: Oxford, UK, 2013. [Google Scholar]
- Savill, P.S. The Silviculture of Trees Used in British Forestry, 3rd ed.; CABI: Wallingford, UK, 2019. [Google Scholar]
Figure 1.
Location of the study site within Romania.
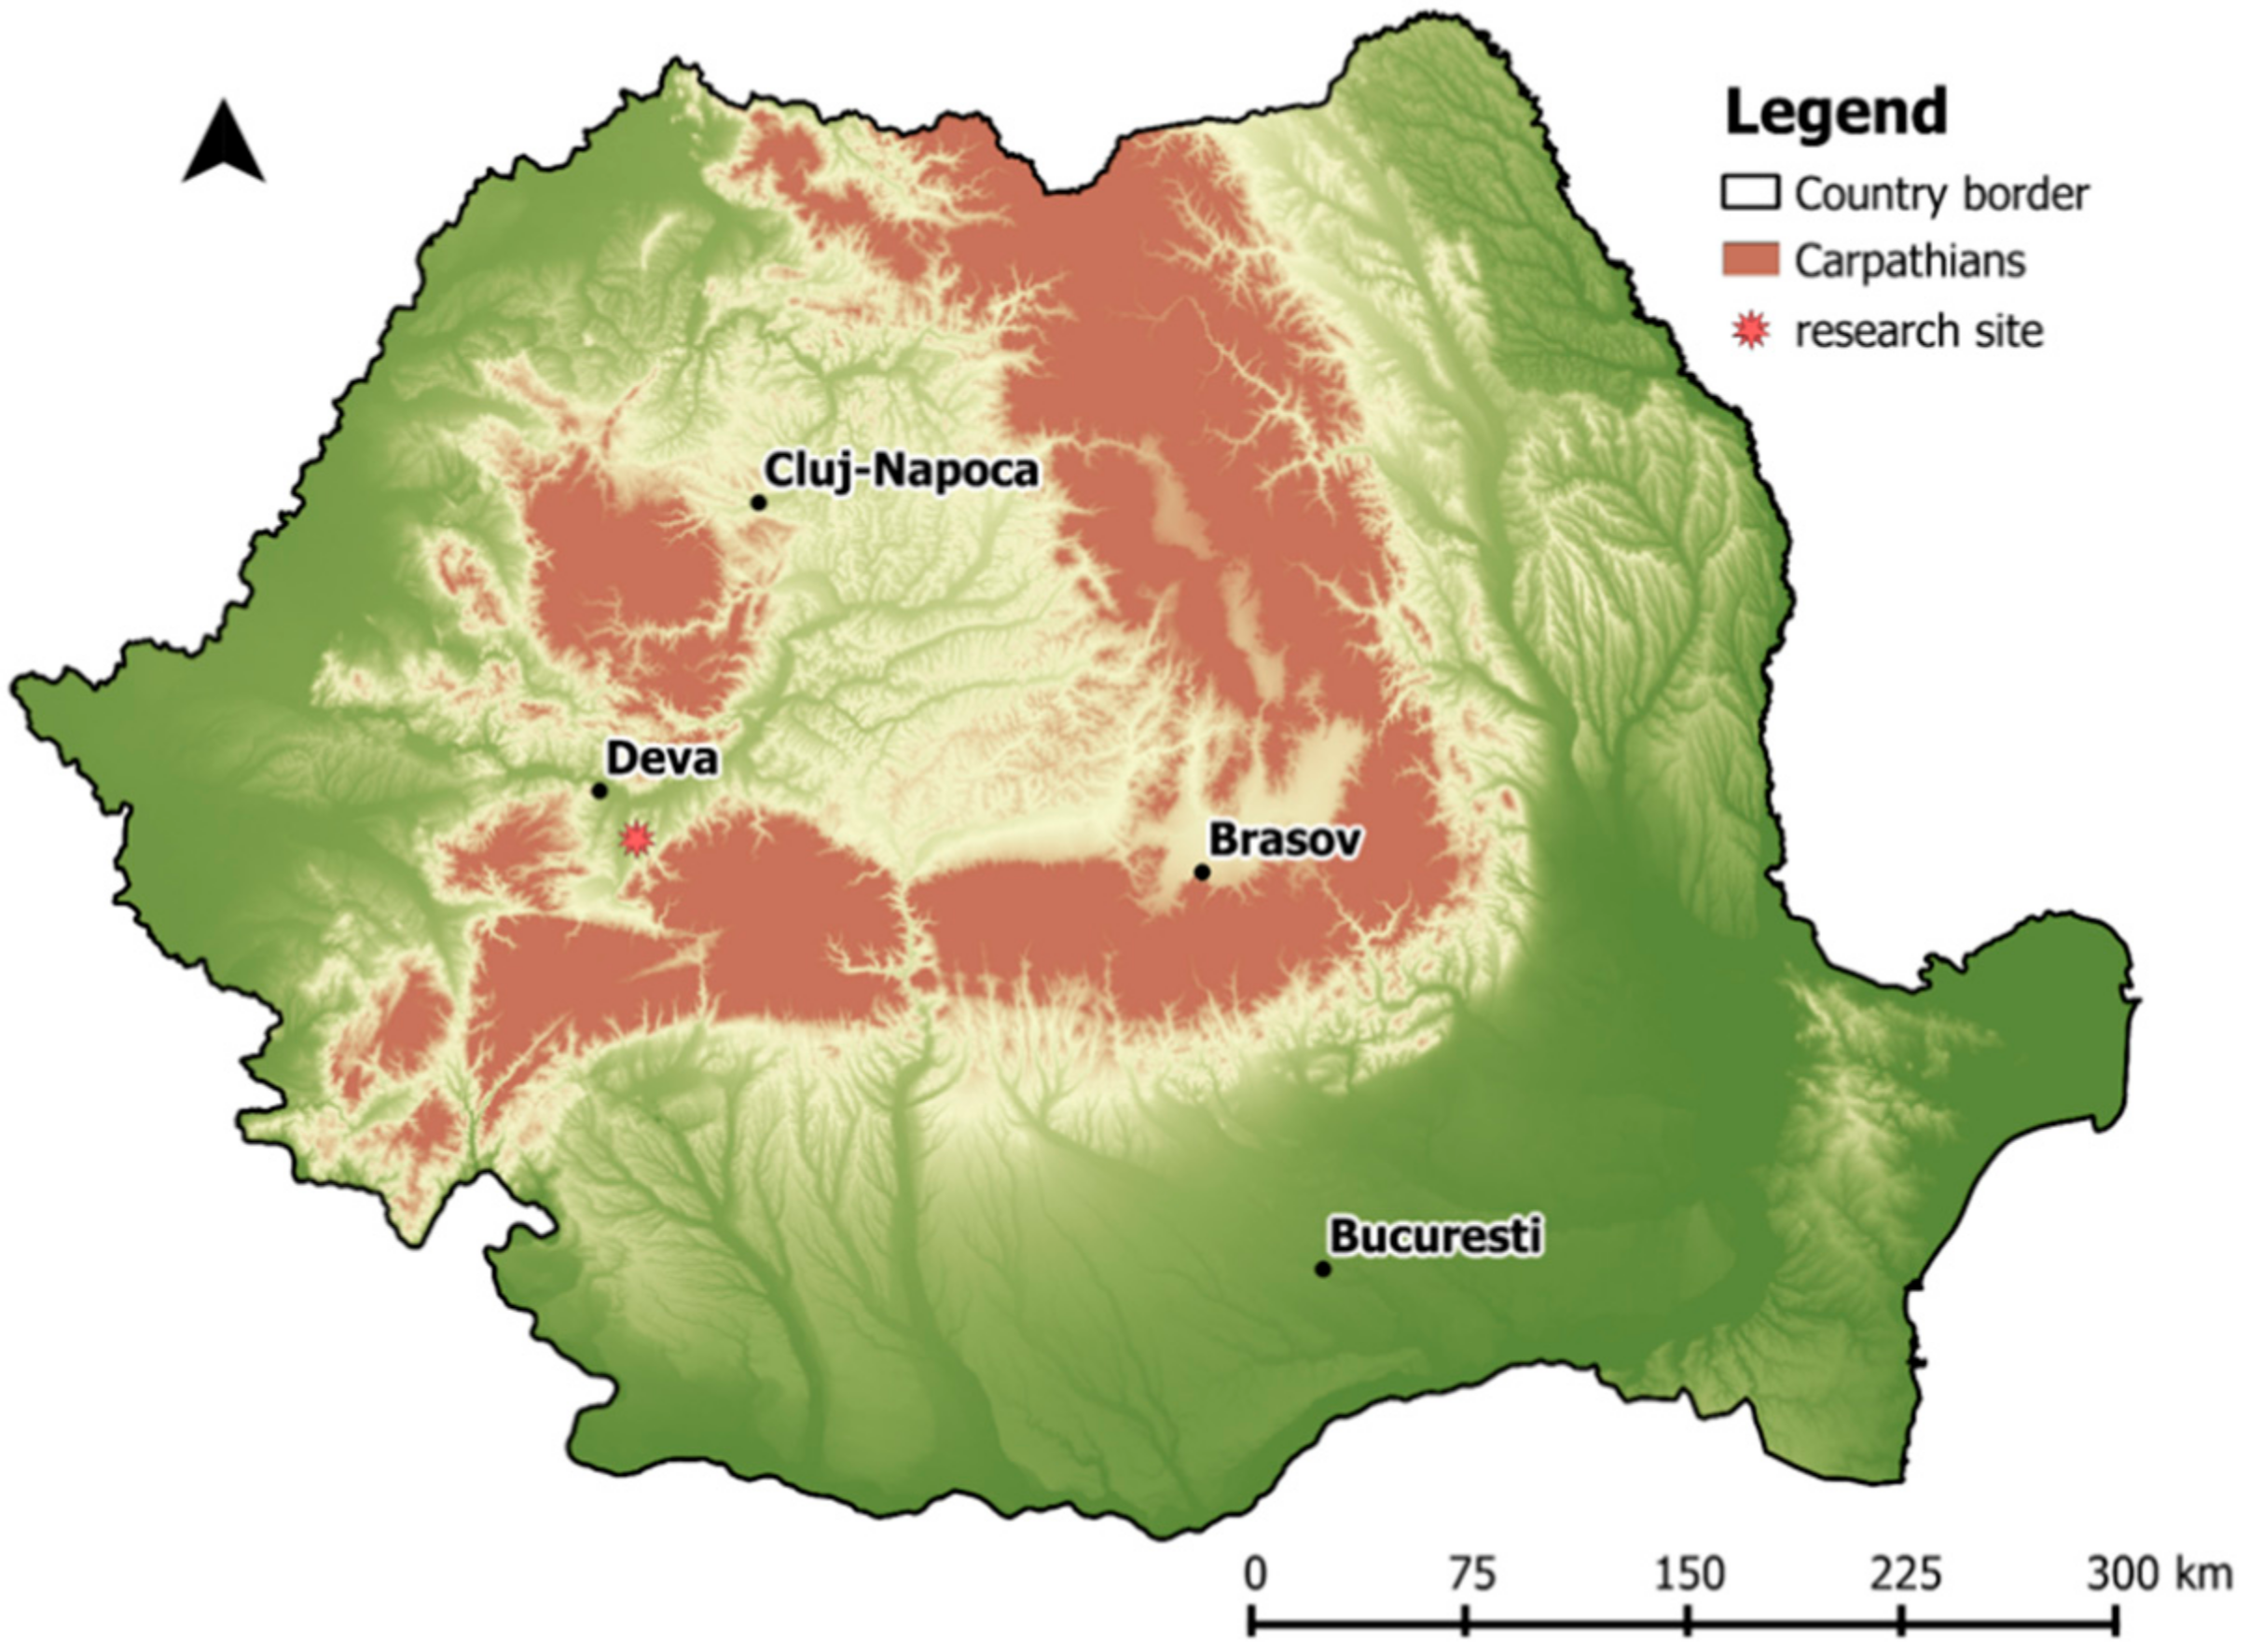
Figure 2.
The relationship between height-diameter ratio (HDR) and live crown ratio (LCR). (a) LCR threshold at 0.3, HDR threshold at 80; (b) LCR threshold at 0.3, HDR threshold at 100; (c) LCR threshold at 0.4, HDR threshold at 80; (d) LCR threshold at 0.4, HDR threshold at 100. Note: The dotted red line represents the regression line between HDR and LCR; the green triangle represents the area obtained by intersection of threshold lines (for HDR and LCR) with the linear regression line that predicts HDR as a function of LCR. In gray color—quadrants where, theoretically, according to the rule, no trees should be positioned.
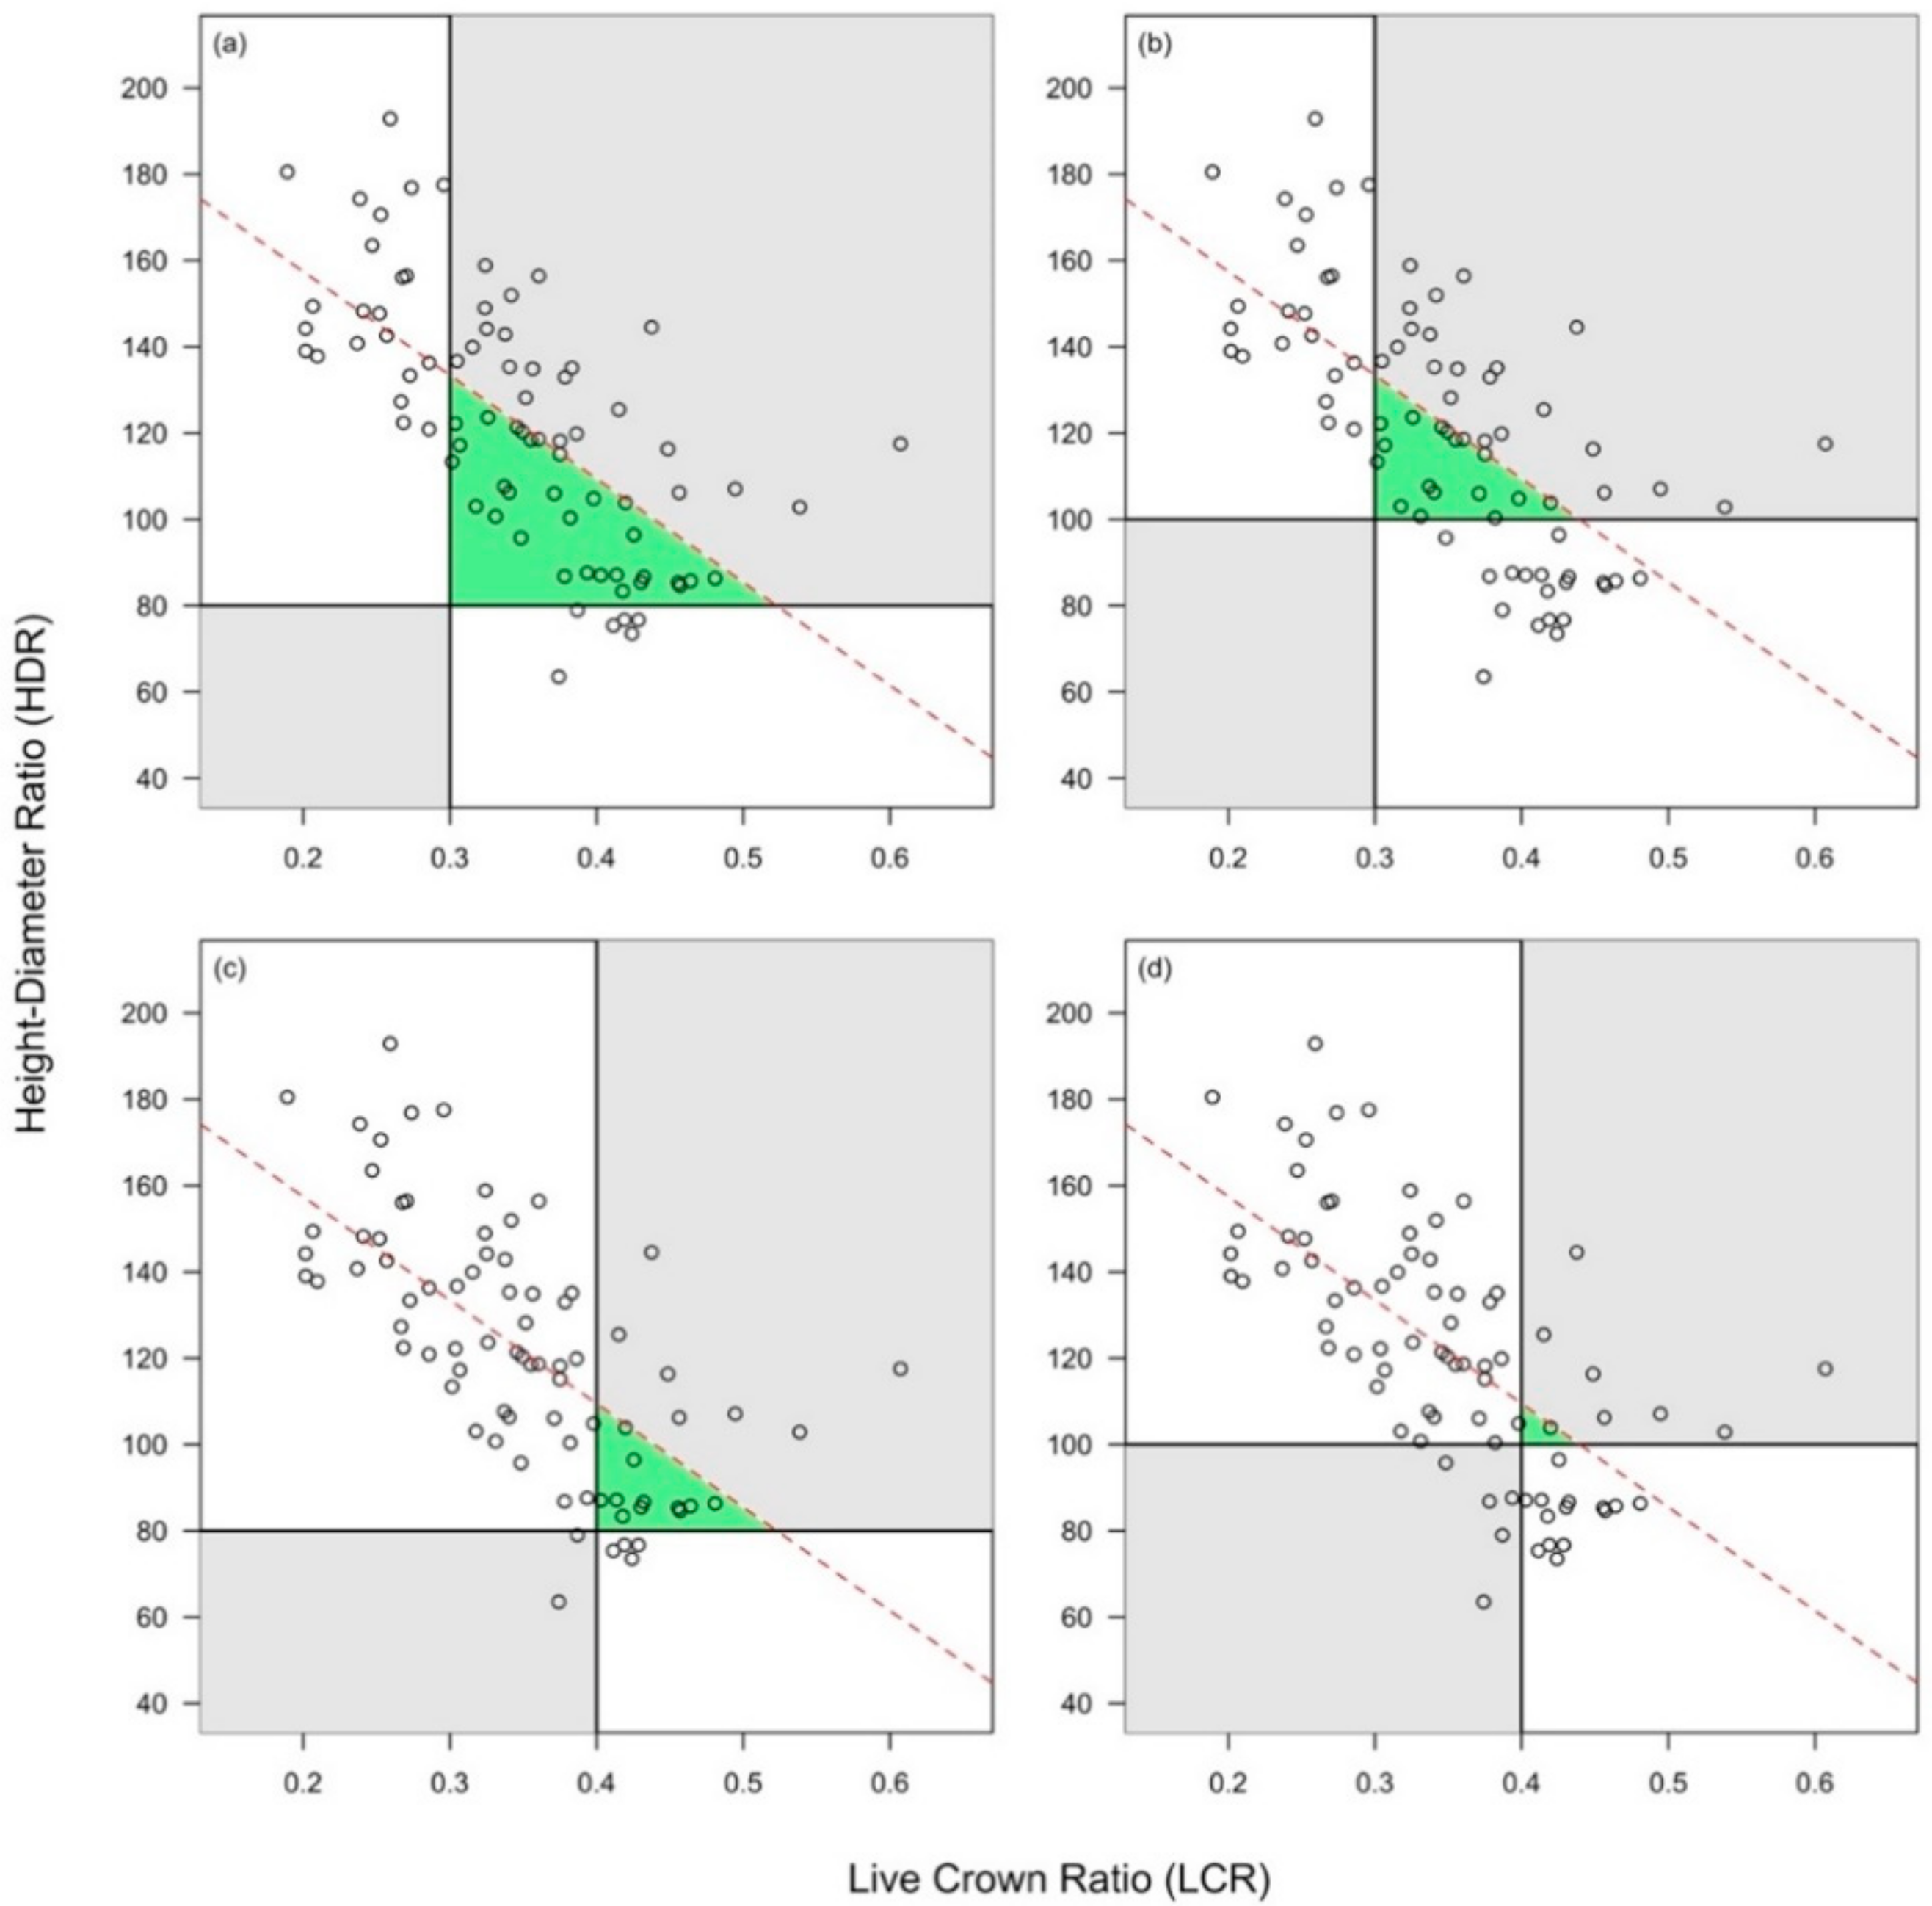
Figure 3.
The logistic regression for the entire dataset (red dot—inflexion point of the logistic curve; empty circles—sampled trees; observations at y = 1 represent trees classified as slender (HDR > 100), while the observations at y = 0 are trees classified as not slender (HDR < 100); black triangle—LCR estimate from conditional inference tree method = 0.371; gray rectangle—the 95% confidence interval for the threshold obtained by conditional tree method; dashed vertical lines—the limits of the 95% confidence interval).
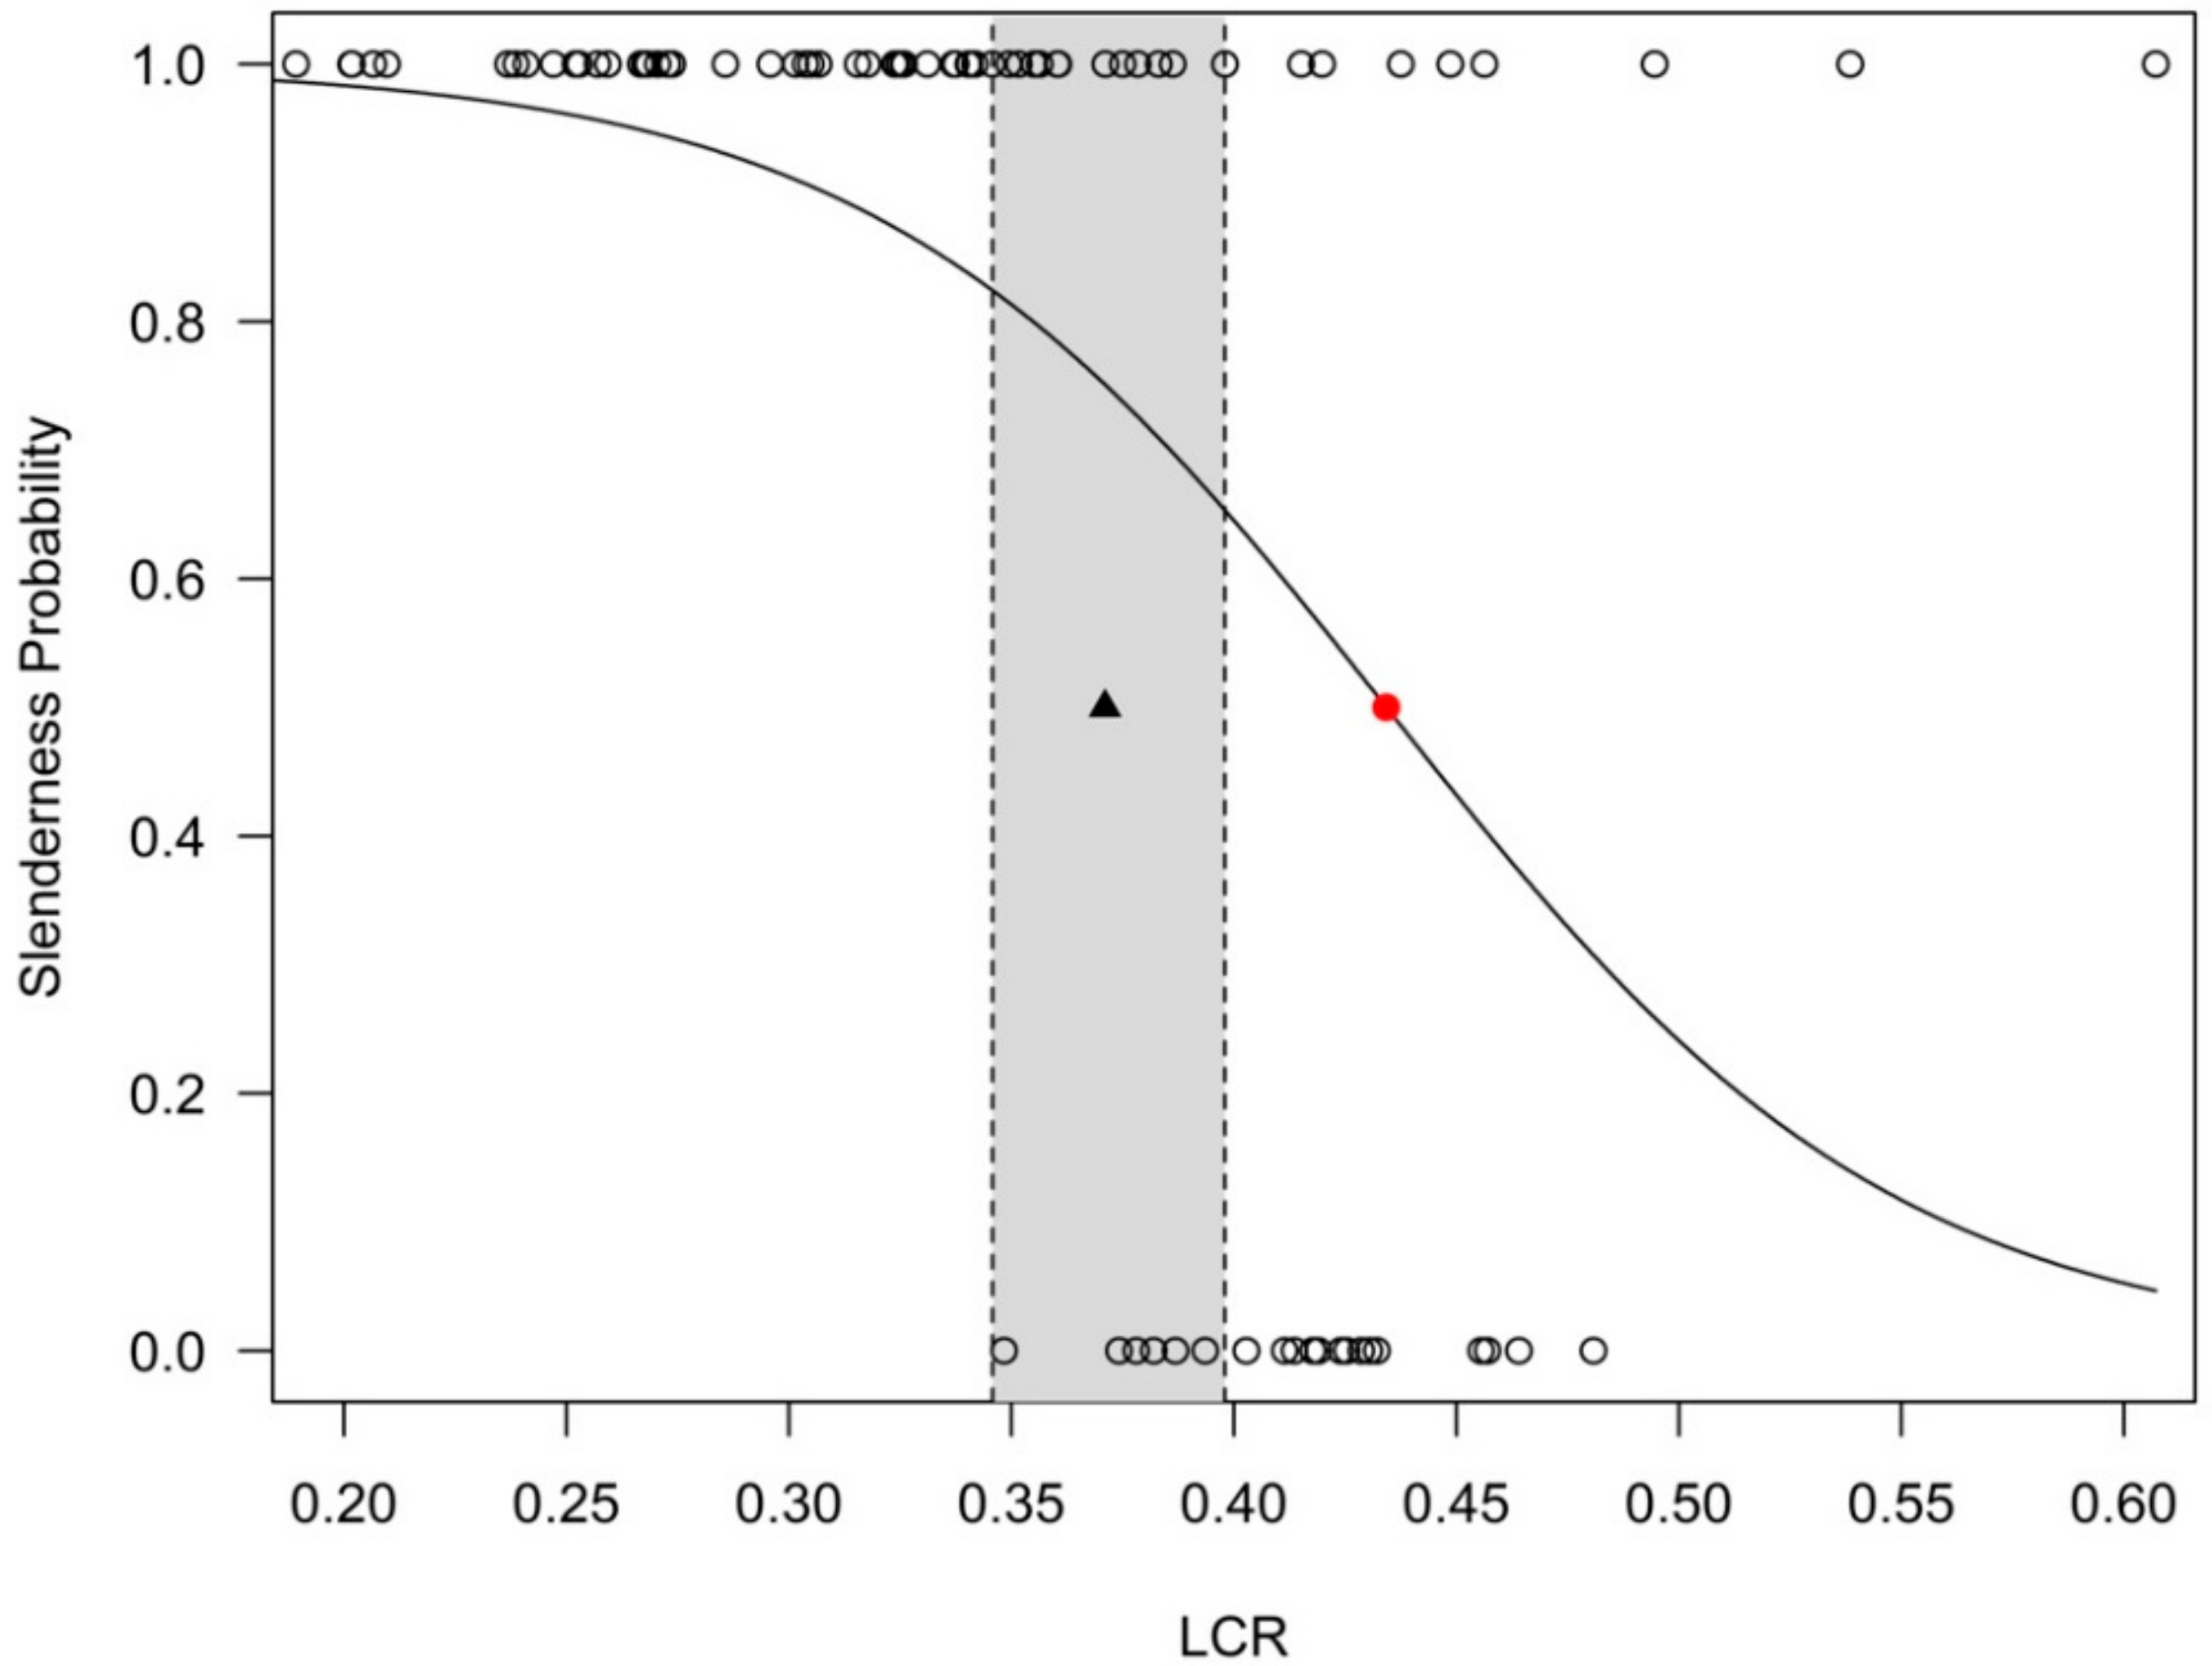
Figure 4.
The logistic regression for (a) trees taller than 12.5 m and (b) shorter than 12.5 m (red dot is the inflexion point of the logistic curve; observations at y = 1 represent trees classified as slender (HDR > 100), while the observations at y = 0 are trees classified as not slender (HDR < 100); black triangle is the LCR estimate from conditional inference tree method = 0.371; gray rectangle is the 95% confidence interval for the threshold obtained by conditional tree method; dashed vertical lines are the limits of the 95% confidence interval).
Publisher’s Note: MDPI stays neutral with regard to jurisdictional claims in published maps and institutional affiliations. |
© 2021 by the authors. Licensee MDPI, Basel, Switzerland. This article is an open access article distributed under the terms and conditions of the Creative Commons Attribution (CC BY) license (https://creativecommons.org/licenses/by/4.0/).
Share and Cite
MDPI and ACS Style
Stăncioiu, P.T.; Șerbescu, A.A.; Dutcă, I. Live Crown Ratio as an Indicator for Tree Vigor and Stability of Turkey Oak (Quercus cerris L.): A Case Study. Forests 2021, 12, 1763. https://doi.org/10.3390/f12121763
AMA Style
Stăncioiu PT, Șerbescu AA, Dutcă I. Live Crown Ratio as an Indicator for Tree Vigor and Stability of Turkey Oak (Quercus cerris L.): A Case Study. Forests. 2021; 12(12):1763. https://doi.org/10.3390/f12121763
Chicago/Turabian StyleStăncioiu, Petru Tudor, Alexandru Alin Șerbescu, and Ioan Dutcă. 2021. "Live Crown Ratio as an Indicator for Tree Vigor and Stability of Turkey Oak (Quercus cerris L.): A Case Study" Forests 12, no. 12: 1763. https://doi.org/10.3390/f12121763
Note that from the first issue of 2016, this journal uses article numbers instead of page numbers. See further details here.