
Understanding the Representativeness of Tree Rings and Their Carbon Isotopes in Characterizing the Climate Signal of Tajikistan


1
Institute of Desert Meteorology, China Meteorological Administration, Urumqi 830002, China
2
Key Laboratory of Tree-Ring Physical and Chemical Research of China Meteorological Administration, Urumqi 830002, China
3
Xinjiang Key Laboratory for Tree Ring Ecology, Urumqi 830002, China
4
State Key Laboratory of Desert and Oasis Ecology, Xinjiang Institute of Ecology and Geography, Chinese Academy of Sciences, Urumqi 830011, China
*
Author to whom correspondence should be addressed.
Forests 2021, 12(9), 1215; https://doi.org/10.3390/f12091215
Submission received: 26 June 2021
/
Revised: 30 August 2021
/
Accepted: 31 August 2021
/
Published: 7 September 2021
(This article belongs to the Special Issue Stable Isotope Applications in Forest Ecosystems)
Abstract
:The juniper tree forest is a critical component of the carbon, water, and energy cycles of Tajikistan. However, to date, long-term information about tree-ring isotopes is limited in this region. Here, we developed tree-ring width (TRW) and tree-ring 13C chronologies for juniper trees (Juniperus seravschanica (Juniperus excelsa subsp.polycarpos (K. Koch) Takht.) and Juniperus turkestanica (Juniperus pseudosabina Fisch. & C. A. Mey)) and investigated their dendroclimatic signals in the northwest of the Pamir-Alay (NWPA) mountains in Tajikistan. Tree-ring ∆13C and TRW of juniper presented different sensitivities to monthly precipitation. Moreover, ∆13C in juniper showed consistently significant relationships with climatic factors in larger seasonal windows than TRW did. Dendroclimatological analysis demonstrates that precipitation has significant effects on tree growth and isotope enrichment. Late summer to early winter temperature is one limiting factor for the TRW chronologies, but previous spring, summer, and autumn temperature and precipitation from the previous July to the current May were the dominant climatic factors accounting for inter-annual variations in the ∆13C chronologies. This verified that the multi tree-ring parameters of juniper in Tajikistan are a promising tool for investigating inter-annual climate variations. Furthermore, the stable carbon isotopes of tree rings have proven to be powerful evidence of climatic signals. The moisture-sensitive tree-ring isotope provides opportunities for complex investigations of changes in atmospheric circulation patterns and timing of seasonal rainfall. Our results highlight the need for more detailed studies of tree growth responses to changing climate and tree-ring isotopes to understand source water variations (especially baseflow) of the juniper tree forest.
1. Introduction
Central Asia is characterized by an extreme continental climate associated with its high-altitude zone, geography, orography, and distance from large water bodies [1]. Climate change and related drought events have significant influences on socioeconomic and human well-being, particularly in Tajikistan, one of the most seismically active areas in Central Asia [2]. A huge number of glaciers surround the high mountains of the northwest of the Pamir-Alay (NWPA) and the meltwater from these glaciers is Tajikistan’s main available water resource [3]. A recent study showed an increase in summer temperatures from 1979 to 2018 in instrumental data records in the western part of the Tajik Pamirs [1]. Meanwhile, local communities perceived increasing temperatures in autumn and winter and decreasing amounts of snow and rain [4]. Such changes may result in an increase in flash floods during the winter and the early spring [5]. Therefore, it is important to investigate climatic variation specific to this region. Environmental information and its proxy records for this region are of critical significance for evaluating the variability in regional resources. Moreover, they are fundamental to understanding how regional resources will respond to a changing climate [6].
Among the available types of paleoclimatic proxies, tree rings offer a great advantage in the study of paleoclimatic information archives, with the benefits of accurate annual resolution, a large number of replications, and easy access [7]. In recent years, a multitude of studies have evaluated the responses of juniper trees to the climate. Due to their exact dating and annual resolution, climate-sensitive juniper trees play an important role in providing information about past climate variability and changes in many regions of the world [8,9,10,11,12,13]. There are many dendroclimatic studies of reconstructions of temperature, precipitation, and drought associated with the width of the rings of juniper trees in Central Asia [1,6,9,10,11,12,14,15,16]. These rings reveal drought signals and wetting trends, retain common signals and capture regional dry/wet periods, hence proving that moisture-sensitive juniper trees are a reliable proxy for investigating climate variability. Central Asian paleoclimatic studies are mainly concentrated in the Tibetan Plateau region [17,18,19,20,21,22] and Tien Shan Mountains [23,24,25,26,27,28,29,30,31,32,33], and the majority of these studies are based on tree-ring width (TRW) data. The Pamir-Alay Mountain region is among those that have been investigated for past climate variations in arid central Asia to a lesser extent, not to mention tree-ring isotopes.
The stable isotope compositions of tree rings have become a powerful proxy for the study of paleoclimate and source water environment changes due to their well understood physiological controls, a lower required number of samples in dendroclimatological analysis, and high sensitivity to climate variations [34,35,36,37,38]. The characteristics of the carbon isotope ratios of tree rings can be used to study the physiological and ecological responses of trees to past environmental changes, in addition to their ability to reflect past climate changes [39,40,41,42,43,44]. The composition of tree-ring carbon isotopes is sensitive to seasonal temperature, precipitation, and relative humidity, with a lag effect [45,46,47]. In order to better understand the dynamics of forests and their interaction with climate, TRW and stable isotopes are insightful traits that provide information on climatic and hydrological fluctuations. In Tajikistan, interest in dendrochronology was briefly introduced by A.V. Gursky in the 1930s, but the variability of TRW and tree-ring stable isotopes from Tajikistan has not been fully explored. In the present study, the main aims were: (i) to develop the TRW and stable isotope chronologies for representative sites of juniper forests; (ii) to obtain a chronology that best represented the climate signal of the region, and (iii) to assess the similarities and differences between the two tree-ring variables in response to climatic factors.
2. Materials and Methods
2.1. Study Area and Meteorological and Hydrological Conditions
The sampling area is located in the NWPA mountains, which are characterized by typical high-mountain relief with U-shaped valleys, glaciers, and steep slopes with active mass movements [12]. Geographic factors of the Pamir-Alay region, including latitudinal mountain barriers surrounded by vast deserts, influence the high value of atmospheric aerosol accumulation [48]. Precipitation concentrates in boreal winter seasons, and its variability is mainly influenced by the location and intensity of the westerlies [49], with very high local contrasts depending on altitude and landforms [50]. Typical conditions are presented in the climate diagram for the study area (see the bottom of Figure 1). The average temperature varies from −10.1 °C in the coldest month (January) to 15.8 °C in the warmest month (July). The average annual precipitation reaches 470 mm. Most precipitation occurs in the spring and the minimum precipitation occurs in August. Precipitation showed a significantly increasing trend for May and July covering the period of 1901–2014. The summer months, along with September, are very dry (seasons are defined as spring (March–May), summer (June–August), autumn (September–November), and winter (December–February)). Due to the lack of long-term meteorological observations collected at the sampling site, we used interpolated monthly climate data to represent the historical climate of the region covering the period of 1901–2014. Mean monthly temperature and monthly total precipitation were extracted from the gridded dataset (Climate Research Unit, CRU TS4.02 with the resolution of 0.5° × 0.5°, https://crudata.uea.ac.uk/cru/data/hrg/cru_ts_4.02/, accessed on 20 September 2017) in closest proximity to our sampling site (Figure 1). Abundant glacier and snow resources feed the runoff of many rivers in Tajikistan, such as the Zeravshan, Panchi, Sirr, and Vahsh rivers. These rivers have different glacial origins. Baseflow is an important part of river runoff and is recharged by meltwater, becoming the primary source of runoff in the dry season. Variations in baseflow in Tajikistan would therefore greatly affect the quantity and quality of the water resources of the study area, and considerably impact the natural ecological environment in the region, particularly trees along the lower reaches of the river.
Junipers, the only forest-forming species in the Pamir-Alay, grow from 1100 m asl and reach up to 3500 m asl (the growing season typically starts in April and ends in October). Because of changes in the growth environment that might be expected to occur as a result of possible future changes in climate, it is important to identify the responses of the tree-ring parameters (e.g., tree-ring width, density, and isotopes) of juniper trees to climate variables.
2.2. Sample Collection and TRW Chronology Building
The tree cores were collected following the Sveriges Lantbruksuniversitet (SLU, the Swedish national forest inventory, Department of Forest Resource Management) standards for tree core collection. Two cores per tree were extracted using an increment borer (Swedish Haglof, 12 mm) during July (the tree rings of the year 2014 were complete). Sampling was only conducted on isolated, mature, and healthy individuals to avoid competition-influenced plant structures. For the present study, we collected increment core samples from 298 cores of 148 juniper trees (Cupressaceae), contains Juniperus seravschanica (Juniperus excelsa subsp. polycarpos (K. Koch) Takht.) and Juniperus turkestanica (Juniperus pseudosabina Fisch. & C. A. Mey) from seven sites growing on the steep scree slopes along the NWPA, Tajikistan, with an altitude between 1175 and 3249 m. The information for sampling sites is summarized in Table 1.
All cores were analyzed in the Key Laboratory of Tree Ring Physical and Chemical Research of China Meteorological Administration, Institute of Desert Meteorology, China Meteorological Administration. Following standard dendrochronological techniques [7], the sampled tree-ring cores were experimentally pretreated and measured: (i) the sampled tree-ring cores were dried naturally, (ii) mounted on a wooden plank with grooves, and (iii) sanded to a high polish in preparation for ring-width measurements. Then, each core was marked under a microscope. The cores were first visually cross-dated with reference to prominent pointer or marker years [42]. After a rigorous visual cross-dating of the tree-ring cores, TRW was measured with a LINTAB measuring table with a precision of 0.001 mm. Final cross-dating of samples was done both visually and using the TSAP-Win™ dendrochronological software (http://www.rinntech.de, accessed on 25 July 2015). Dating quality was controlled using COFECHA [51], a quality control computer program used to detect irregularities in the TRW chronologies developed by Richard Holmes, and converted to standardized ring width indices using the ARSTAN_41d program [52]. We used the flexible cubic spline method to detrend the natural trend of tree radial growth. The mean TRW chronologies computed by ARSTAN were visualized using plotting functions in the dplR package for R [53]. We calculated the inter-series correlation (Rbar) and the expressed population signal (EPS) to evaluate the quality of the master (regional) TRW chronology. Values of EPS ≥ 0.85 are generally considered to be the threshold for reliable TRW chronology development [54]. Ultimately, 221 cores from seven sites were successfully dated and used to establish the master TRW chronology. The average single series length was 191 years (Figure 2).
2.3. Stable Carbon Isotope Analysis and Chronology Building
In order to develop a carbon isotope chronology, sample cores with no apparent differences in width, normal growth, few missing rings, and clear ring boundaries were selected for the isotope analysis [55]. Combining several cross-dated tree rings of identical age from different tree individuals prior to isotopic analysis is one of the techniques that provides a possibility to increase the replication of an isotope chronology without increasing the number of isotope analyses [56]. Studies suggest that 4–6 trees are sufficient to establish a reliable local isotope chronology providing a representative site signal [7,8,9]. In our study, tree cores were selected from different trees at the JEJ site (six), the LMT site (five), the TWL site (six), and the SBD site (five) for isotope measurements. Isotope samples were individually prepared at an annual resolution for each site [57]. Our criteria to choose samples included cores with rings not close to the pith, avoiding the potential juvenile effects on the tree-ring δ13C [58]. Based on many tree-ring isotope studies [41,59,60,61,62,63], the results from mixed multi-core and whole wood analysis could yield climate information. The inter-tree pooling approach was verified to be the best alternative to individual-tree isotope measurements [56]. Considering the often very narrow tree ring of ca. 0.1 mm and the small proportions of latewood, tree rings of all individuals of exactly dated trees (1950–2014) were calendar synchronously pooled prior to isotopic analysis. Samples of different cores for the same year were packed into the same centrifuge tube and dried at 75 °C for 24 h. The dried samples were crushed to 60 mesh (300 Lm) using a high centrifugal force ball mill.
The stable carbon isotope compositions of the samples (whole wood) were determined using an IsoPrime 100 elemental analyzer/Elemental Analyzer in combination with continuous flow isotope ratio mass spectrometer (Iso-Prime100 mass spectrometer) at the State Key Laboratory of Desert and Oasis Ecology, Chinese Academy of Sciences. In order to determine the δ13C values, the samples were encapsulated in tin capsules. The samples were combusted at temperatures of 1120 and 850 °C in the elemental analyzer. δ13C values were calibrated relative to C–3 and C–5 international standards, and the results are reported in values relative to Vienna Pee Dee Belemnite (VPDB). The isotopic values are reported in standard notation as delta:
where R represents the ratio of the heavy to light isotopes in the sample and in the standard.
Quality control was needed in the process of isotope analysis. Each sample was tested more than twice. At the same time, every laboratory standard sample with a known isotopic composition was inserted in 10-sample intervals. A retest was required when the difference between the two measurements became large. The correction for changes in δ13C should also account for the response of trees to the increase in the atmospheric concentration of CO2 due to the fossil fuel combustion. The δ13C of plant matter (δ13Cp) is fundamentally controlled by the isotopic composition of atmospheric CO2 (δ13Ca) and modified by isotopic discrimination occurring during CO2 uptake and photosynthesis as described by Farquhar et al. [64]. By using annual values for atmospheric δ13C, tree-ring δ13C values can be translated into values that represent discrimination against 13C (∆) using the following equation:
where δ13Ca is the carbon isotopic composition of the air (the source) and δ13Cp is the raw carbon isotopic composition of the tree ring. Annual resolution atmospheric δ13C data were determined by taking the yearly values of the sixth order polynomial curve fit of measurements and Antarctic ice cores [65,66,67].
2.4. Meteorological Data and Climate Response Analysis
Standard dendrochronological statistical parameters were computed for each chronology. In this regard, we calculated the chronology statistical parameters such as mean sensitivity (MS), standard deviation (Std. Dev), first-order autocorrelation (AC1), a signal-to-noise ratio (SNR), expressed population signal (EPS), and mean correlation between all trees or series (MC).
The CRU database (TS4.02) was used to collect long-term variations and average monthly variations in temperature and precipitation over the period of 1901–2015 for Tajikistan (Figure 1). To explore the common variance of the site chronologies and obtain the composite (master) chronologies (both TRW and carbon isotopes), Principal component analysis (PCA) was performed using a covariance matrix (first two principal components scores were kept).
To investigate correlations between TRW chronology, tree-ring isotope chronology (∆13C) and climate data, Pearson correlation coefficients were calculated between climate variables and TRW values of the master chronology for the period 1823–2014, as well as tree-ring isotope values of the master chronology for the period 1950–2014. A 95% confidence level (p < 0.05) was used to determine the statistical significance of the correlations. In order to identify extreme events, we defined the intensity of enrichment/depletion years as follows. The highest isotopic values (depletion) were defined as higher than the mean + σ (standard deviation), and the lowest isotopic values (enrichment) were defined as lower than the mean − σ. The wet season was defined as the period of precipitation higher than the annual mean + σ (standard deviation), and dry season was defined as the period of precipitation lower than the annual mean − σ.
To explore the associations of tree growth with climate variables, Moving window correlations and Seascorr correlations, as well as the transfer function model, were calculated using treeclim Package in R). Seascorr correlations were defined using the dendroclimatic window as follows. We used four season-lengths (1, 3, 9, and 12 months) and a dendroclimatic window of 14 months that ends in September of the current year [68]. The correlation of the primary variable (temperature) with tree-growth was computed as Pearson’s linear correlation coefficient. Then this correlation was removed, and the partial correlation of the secondary variable (precipitation) with the predictand was computed [69,70].
In addition, the Morlet wavelet [71] was used for decomposing the series to explore the relationships between them. Both the cross-wavelet transform (XWT) and the wavelet coherence (WTC) analyses can reveal the resonance signals of two time series. The XWT exposes regions with high common power and further reveals information about the phase relationship. Hence, we conducted additional wavelet analyses to identify significant periodicities and explored the spectral characteristics of tree-ring parameters and climatic signals [72]. The relative phase relationships are shown as arrows (with in-phase pointing right and antiphase pointing left).
3. Results
3.1. TRW and Stable Isotope Ratio Chronologies of Juniper Trees
Seven TRW chronologies from Tajikistan, consisting of 221 tree-ring series, were combined into a composite TRW chronology (STD, average of PCA-based), with a reliable length for the 1823–2014 period (Table 2, Figure 2). Statistical results indicated that over the common period, the juniper chronology was valid for dendroclimatic study. The mean sensitivity (MS = 0.48) indicated high potential of the present TRW chronology in climatic studies. The high expressed population signal (EPS > 0.85) indicates good representation of the hypothetical population from the constructed TRW chronology. The mean correlation (MC = 0.37) between series represents the strength of the common signal among the series of these cores. In addition, the MS and Std. Dev of the TRW chronology were similar to other TRW chronologies near these seven sample sites in Tajikistan [74]. Besides MS and EPS, the common variance of all the detrended series accounted for 40.6% of the total variance, indicating that juniper tree growth at the seven sites was influenced by similar factors. The mean signal-to-noise ratio (SNR = 5.61) suggested relevant responses in tree growth to the variation of climate. Statistically significant first-order autocorrelation (AC1 = 0.68) showed the important effect of the previous year’s growth conditions on the current year’s growth ring.
For stable isotope analysis, all of the sample cores that met test conditions were selected from four sites (JEJ, LMT, TWL, and SBD) to develop tree-ring iso-series (Table 2). Table 3 shows that significant positive correlations were detected between the regional iso-series of the four sites. These are hypothesized to reflect a common monthly response to hydrologic and climatic factors. Due to the high correlation coefficient and nearly identical trend of chronology curves, the stable isotope chronologies of the tree rings from all four sites were combined to construct a regional standard carbon isotope chronology (Figure 3).
Differing from the high-frequency fluctuations of the TRW chronologies, the composite tree-ring ∆13C chronology exhibited a decreasing rate of −0.65%/year (R2 = 0.52). AC1 values of 0.42–0.56 indicated that the tree-ring isotope chronologies from both high and low elevation sites contained low-frequency variance generated by climatic and tree-physiological lag effects. The correlations among ∆13C chronologies from different sites and the mean correlations among iso-series (δ13C) from each sample site are shown in Table 3. The higher values of the regional tree-ring δ13C series correlation with individual series (0.605 ** and 0.547 **) and higher values of mean tree-ring ∆13C chronologies correlation with individual sites (0.680 ** and 0.545 **) revealed that the coherence of the isotope enrichment of juniper trees at low elevation was better than that at high elevation. Inter-annual variations in tree-ring isotopes of trees within the region could better represent common environmental forcing together with TRW chronologies.
3.2. Miscellaneous Responses of TRW and ∆13C to Climate
In order to explore the associations of tree growth with climate variables, moving correlation analyses (Figure 4) and seasonal partial correlations (Figure 5) were conducted.
For TRW chronology and temperature, the monthly temperature was significantly negatively correlated with TRW in the six months between October preceding the growth year and June of the growth year. The negative correlation with May (r ≤ −0.6) and June (r ≤ −0.6) temperatures was the most stable one found in the 1950s and 1980s. In addition, the previous July (r ≥ 0.4, 1993–2014) and August (r ≥ 0.6, 1973–1994) temperatures had a positive influence on the middle decades (Figure 4a). Warmer current growing seasons were associated with reduced growth, while warmer previous growing seasons were associated with greater growth. Overall, the regional TRW chronology was negatively correlated with the temperature from April through June, but the association was only significant for the June temperature, as depicted in Figure 5a.
Concerning TRW chronology and precipitation, there was limited statistical evidence that climate–growth correlations have changed during the past half-century for juniper, and the majority of correlations tested displayed temporal fluctuations. Increased July precipitation was associated with greater growth throughout the climate record prior to 2000 (r ≥ 0.5), and increased May precipitation was associated with greater growth after 2000 (r ≥ 0.5). Our analysis showed no significant correlations between tree growth and precipitation of the previous growing season (Figure 4b). However, the impact of climate on tree growth can be complex, as tree ring formation can be influenced by both precipitation and temperature [75], making it difficult to separate precipitation signals from temperature signals. Analyses of delayed seasonal combination could be more representative of climatic conditions than focusing on only one month. Thus, we screened TRW chronologies in the correlation analyses, which was repeated for each of the 56 seasons specified by the ending month of tree ring growth and four-season lengths (from August of the previous year to December of the current year, Figure 5). Figure 5a shows a statistically significant relationship between TRW and late summer precipitation (current July to current September). Significant seasonal (12-month) correlations were consistently identified for the current growing season.
Regarding tree-ring ∆13C chronology and temperature, the month with the largest number of individual significant negative correlations with temperature (r ≥ 0.6) was the previous October, current May, and September over recent decades (Figure 4c). Seascorr correlation was analyzed for tree-ring ∆13C as well. As shown in Figure 5b, the Seascorr correlation of tree-ring ∆13C and temperature increased with increasing length of the averaging period, at least through six months. A maximum correlation was reached for the 9-month period ending with September of the previous growth year. Correlation with temperature preceding the growth year increased slightly as the season length extended from 9–12 months.
For tree-ring ∆13C chronology and precipitation, the negative correlation with the previous August precipitation was the most stable correlation identified (r ≤ −0.6). The tree-ring ∆13C chronology showed greater negative sensitivity to abundant previous September precipitation (r ≤ −0.6) in recent decades than in the early part of the Tajikistan climate record, whereas current May precipitation (r > 0.6, from 1983 on) exhibited the opposite pattern (Figure 4d). Figure 5b shows a statistically significant relationship between ∆13C chronology and summer precipitation, with the strongest correlations in May and July. Significant seasonal (9-month and 12-month) correlations were also consistently identified for the previous growing season (previous August to previous October).
In general, the majority of the results of correlation between TRW and temperature represent temporal fluctuations. In addition, the highest correlation coefficient between TRW and precipitation occurred in season length of 12 months with variable ending months (July, August, and September). Smaller seasonal windows, however, did not exhibit consistently significant relationships. Positive-sign partial correlations of ∆13C with temperature and precipitation amount were detected by Seascorr in the prior late summer to early winter (previous August to previous December), possibly indicating that baseflow and snowfall can have a secondary influence on subsequent summer growth. Comparison between climate–growth correlations and climate-stable isotope correlations revealed significant differences in temperature and precipitation sensitivity. Both tree growth and tree-ring ∆13C showed much stronger negative sensitivity to growing season temperature in the current year than the previous year. Interestingly, tree-ring ∆13C showed greater negative sensitivity to precipitation than tree growth for several months of the previous year.
3.3. Lag Effect of Isotopes in Different Seasons
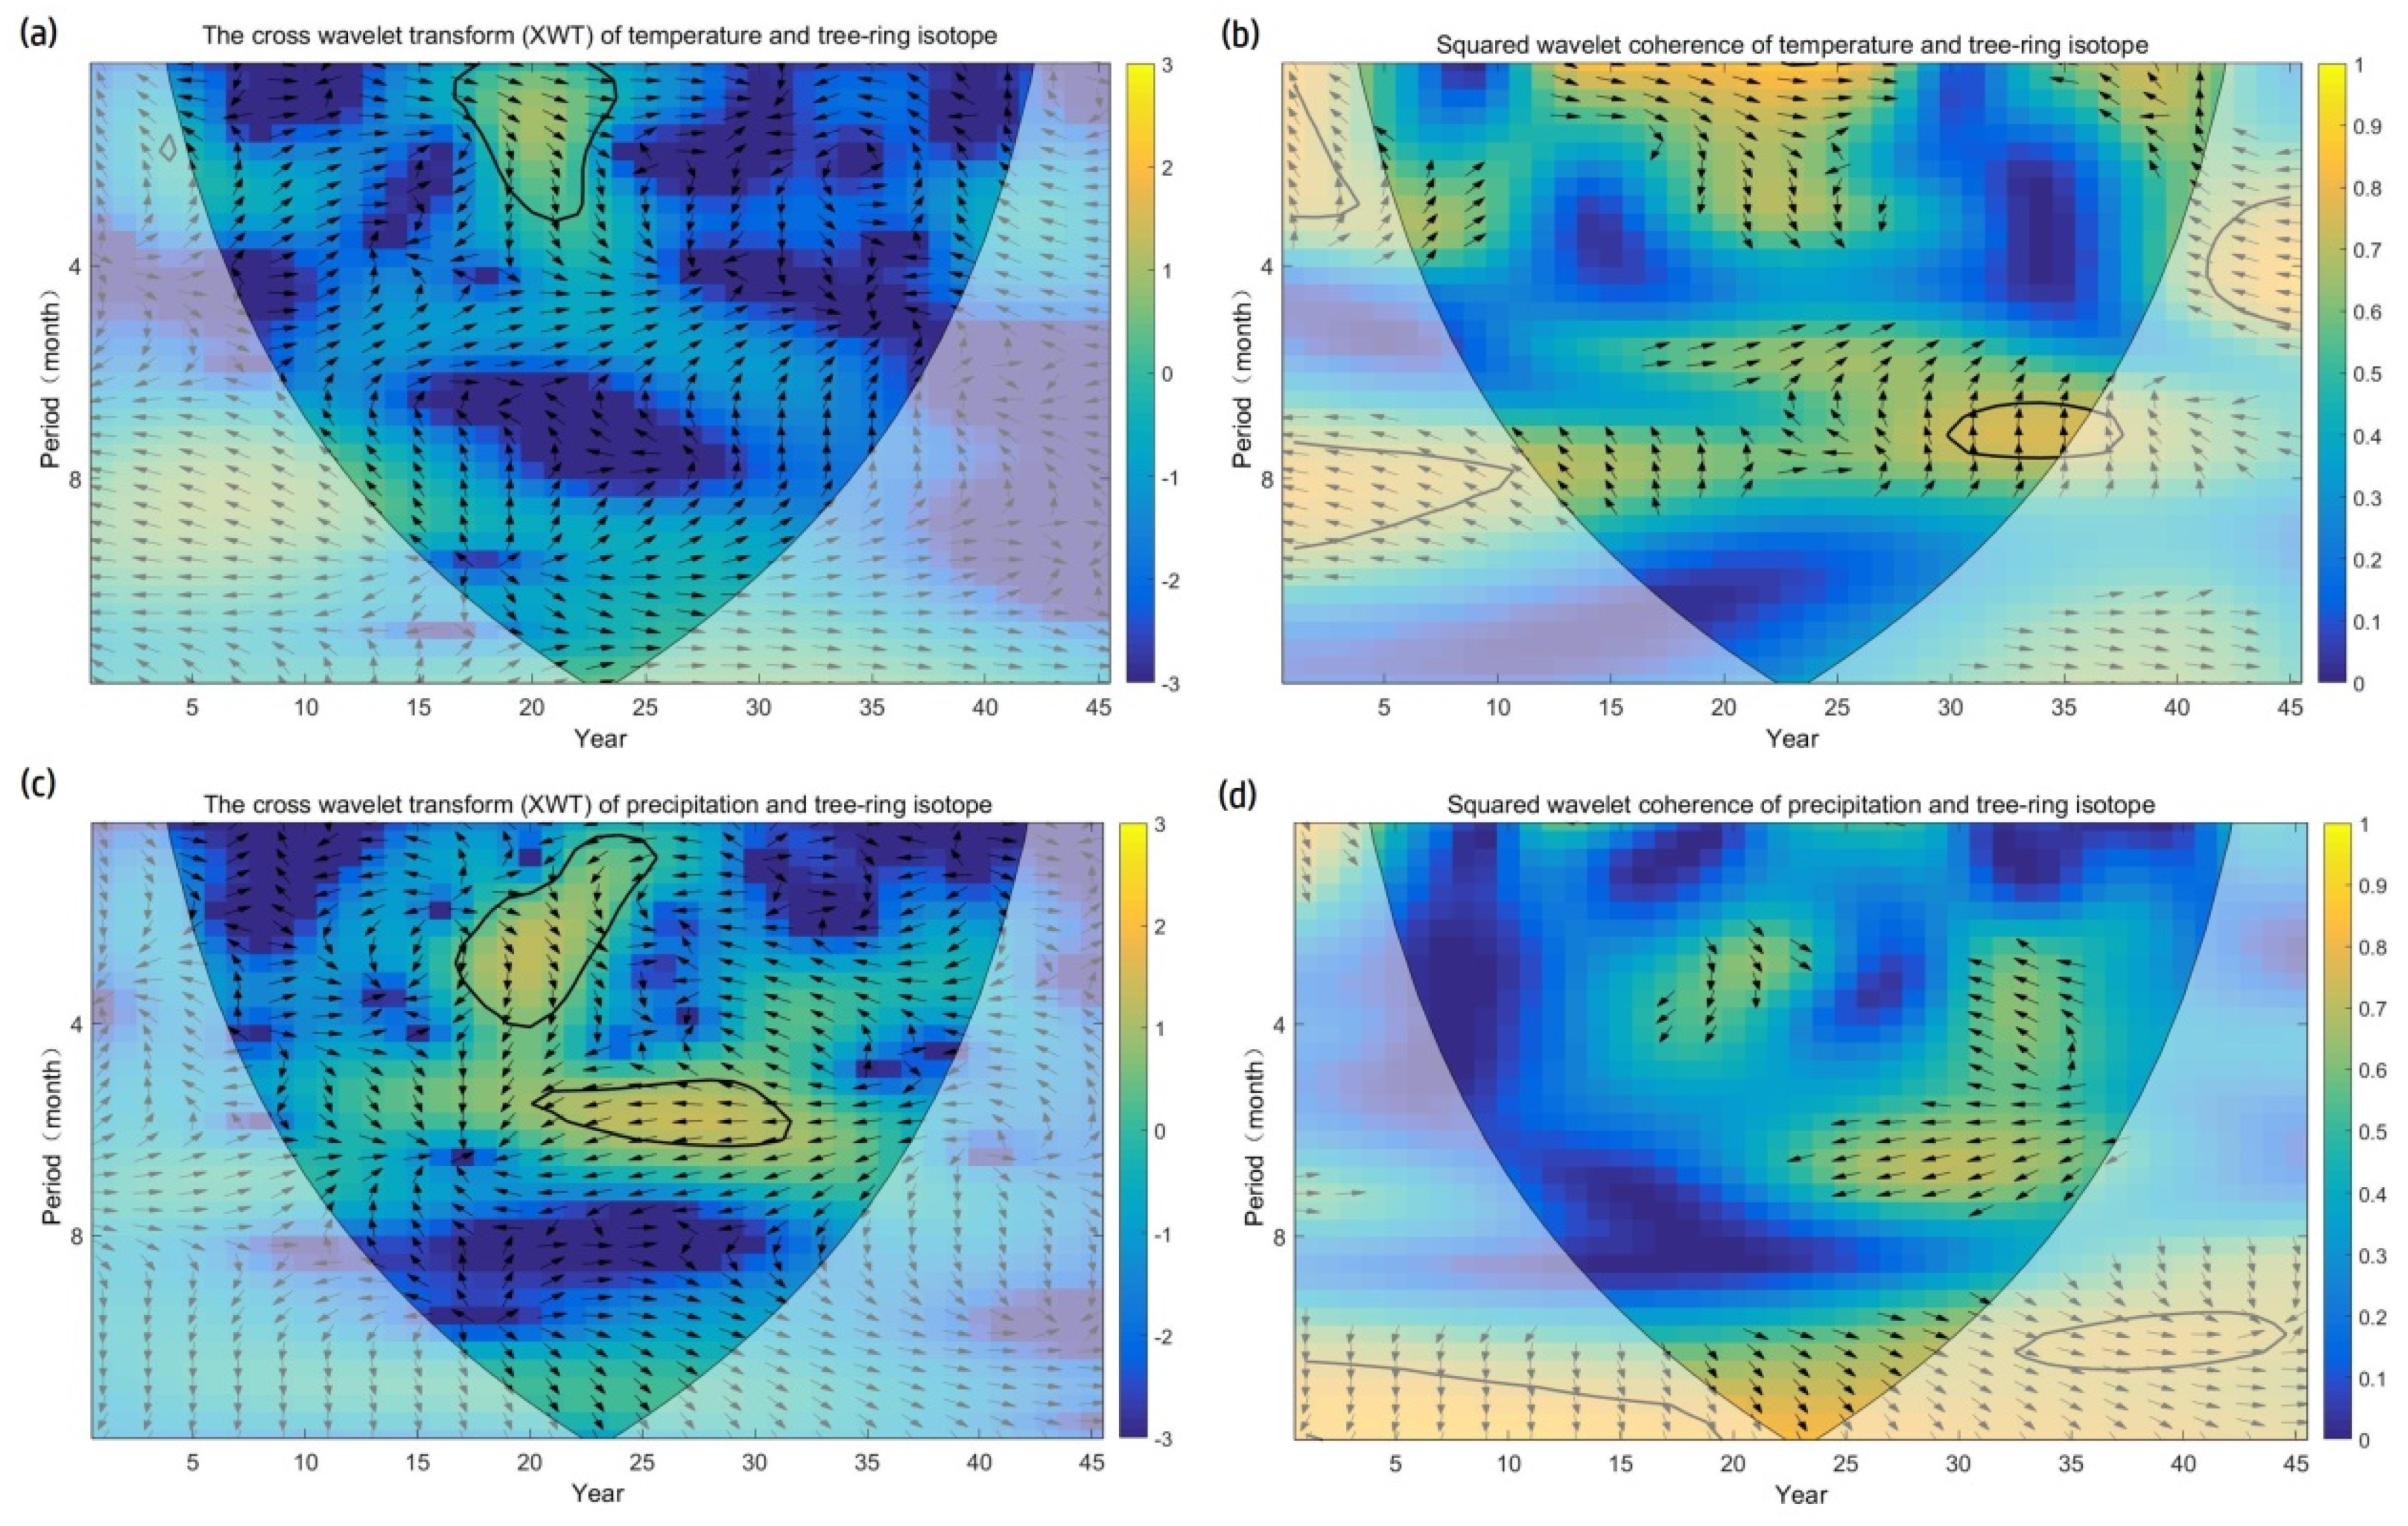
There were significant decadal periodicities in the cross-wavelet transform (XWT) and the wavelet coherence (WTC) of the climate variables and tree-ring ∆13C at different time scales (Figure 6). We note that significant regions showed both in-phase and antiphase relationships, which supports the notion that there may be a complex cause and effect relationship between the two phenomena of both in-phase and antiphase. The XWT shows that the ∆13C chronology and temperature were in in-phase in all of the sectors with a significant common power (one significant resonance period, Figure 6a), but the ∆13C chronology and precipitation were in in-phase and antiphase with a significant common power (two significant resonance periods, Figure 6c). The WTC showed a significant common power between temperature and tree-ring ∆13C in the 6–8 year band from 1989 to 1996 (Figure 6b). There was a significant positive correlation between the two, with a correlation factor of approximately 0.8. This shows that the resonance cycle changed around 1990 and 1997. It further indicates that this region experienced a transformation of periods from “dry season to wet season” and from “wet season to dry season” before and after these two time nodes, respectively.
Based on the previous results (Figure 4c,d, Figure 5b and Figure 6), we chose four periods of high correlation between tree-ring ∆13C and climatic variables to calculate the lag correlation (Table 4). The results indicated that temperature in both the growing season and snowmelt season exhibited significant and negative correlations with ∆13C chronology. Precipitation in both the late summer and the winter exhibited significant and positive correlations with ∆13C chronology. The variation of ∆13C chronology exhibited the same lag of one year with growing season temperature and late summer precipitation, lag of two years with the growing season temperature, and lag of three years with the winter precipitation.
4. Discussion
4.1. Differences between the Two Tree-Ring Variables in Response to Climatic Factors
Theoretically, similar growing conditions regarding light, temperature, humidity, and soil moisture could lead to similar characteristics of TRW and tree-ring isotopes. Nevertheless, in this study the tree-ring ∆13C chronology is a better proxy of precipitation occurring from prior late summer to current spring than TRW. This finding agrees with studies that stable isotopes can provide additional information about climate during the growth of trees compared to TRW [76,77].
Studies have shown that high-elevation plants may be more CO2-limited than those at lower elevations [41]. However, our results of iso-series correlation showed that inter-annual variation in tree-ring δ13C series among trees and ∆13C chronologies among sites at low elevation was more consistent than that at high elevation. Previous evidence has shown that the carbon isotope compositions of tree rings may be related to source (CO2 and water) changes and physiological aging effects such as increasing hydraulic resistance and concomitantly lower stomatal conductance [78]. In addition, forests in semiarid or arid conditions could benefit from increased water use efficiency to enhance growth due to drought stress. We assume that dominant climatic controls on tree-ring ∆13C chronology in the growing season are probably related to the moisture limitation occurring during July to September (Figure 1c). The number of days for which the monthly maximum temperature was higher than 15 °C increased substantially in the study area each year, together with the frequency of extreme temperature values, likely leading to reduced stomatal conductance and altering the environmental conditions and physiological functions of juniper trees. In our study region, trees growing in low elevation receive more drought-stress than high-elevation, which may result in more consistent tree responses at low elevations.
Even though the δ13C tree ring data were corrected for the decrease in atmospheric δ13C values (due to the rise in CO2 caused by fossil fuel combustion), there remained a decreasing trend of −0.65%/year in tree-ring ∆13C chronology. This is further evidence that tree ring ∆13C responds to factors, including increasing temperature and precipitation (our study) and declining water availability [79], which control the tree-ring ∆13C variations in our study site. Carbon isotope fractionation is significantly correlated with plant water use efficiency due to leaf transpiration and photosynthetic carbon assimilation [80]. Hence this decreasing trend could also be correlated with long-term changes in plant water use efficiency [81]. The plant transpiration of trees is strengthened in summer, resulting in the loss of water from the soil and trunk, leading to formation of narrow tree rings that affect the isotope, which refers to the high value years of the tree-ring ∆13C chronology, for example, 1951, 1957, 1961–1964, 1972, and 1982 (Figure 2). High cold-season precipitation or/and summer drought that affect source changes and physiological aging effects in trees are the main causes of narrow rings [82]. This phenomenon is because variations in temperature, the relative humidity of the air, and the local availability of soil moisture may affect the transport rate of water from the soil to the evaporative sites in leaves, thereby impacting stomatal conductance and the diffusion rate of CO2 into leaves, resulting in changes of the ci/ca (ratio of intercellular to ambient CO2 concentrations) [83].
In summary, we found that while TRW can reflect single-month or seasonal precipitation changes, isotopes are further informative of other temporal windows, which indicated that multi-parameter proxy data have the potential to characterize climate change.
4.2. Potential Links between Tree-Ring Carbon Isotopes and Melting Season
There were significant correlations between tree-ring variables (TRW chronologies, tree-ring carbon isotopes) and the previous October to current March (Figure 4 and Figure 5). In addition, the influence of spring temperature was observed for both TRW and iso-series (Figure 4). Tree-ring ∆13C chronology exhibited statistically significant negative correlations with snowmelt season temperature (r = −0.675, Table 4). Studies have supported the hypothesis that snowmelt from the non-growing season makes up a large portion of the moisture for the early growing season [9,47,77,84,85]. Therefore, the continuous positive influence of precipitation during several months of winter and spring and the negative effect of temperatures during several months of spring and summer on the tree-ring variables suggest that glaciers or snowpacks could meet the need for moisture in juniper forests. The complex impact of climate on tree ring formation caused a variety of effects in tree growth and isotope enrichment. The ∆13C chronology was correlated with seasonal climate, particularly with the previous late summer to early winter at a 6-month resolution (Figure 5). This could be because cool and wet conditions during spring or early summer of the previous year recharge soil moisture, which can benefit the trees by enhancing cambial activity during the current growing season [22]. Many recent studies have demonstrated that forests in dry regions adapt to extreme living conditions by using water sources throughout the hydrological year (snowmelt from the non-growing season) [84,86,87,88,89].
Baseflow is an important part of river runoff, and is the primary source of runoff in the dry season [90]. The results of significant correlation between ∆13C and temperature confirm that previous spring, summer, and autumn temperature are the most important climate signals recorded in the carbon isotope records. The effect of precipitation on TRW and ∆13C chronologies has an obvious lag, and the lag effect of precipitation on tree rings is generally greater than that of temperature. The temperature of the current growing season can affect the growth of tree rings in the next year, and in some regions, it can even affect the growth of the tree rings many years thereafter. A similar correlation with non-growing season precipitation was identified for juniper forests in moisture-stressed locations [9,16,19,22,91,92,93,94]. A warming climate results in less precipitation falling as snow and an earlier onset of snowmelt, and these changes in turn influence the timing of the intra-annual streamflow distribution [95,96]. Cross-correlation results demonstrated that lags between ∆13C chronology and snowmelt season temperature and winter precipitation were 2 and 3 years, respectively (Table 3). Thawing permafrost and deepening active layer (the soil layer above the permafrost that thaws during the summer and refreezes during the winter) may raise, increasing soil filtration, deeper baseflow path, and increasing retention time, which strongly affect the catchment hydrology [97,98]. In our study area, the increases in baseflow are likely related to enhanced groundwater storage and winter groundwater discharge caused by permafrost thaw and are potentially also due to increased wet season rainfall. These findings confirm that water supply during the spring season is crucial for tree growth in arid and semiarid regions of Central Asia. More detailed studies of tree growth responses to changing climate and tree-ring isotopes in representation of baseflow in the juniper tree forest are needed.
5. Conclusions
Here, we present the first stable isotope chronology of tree rings from juniper trees for the NWPA mountains of Tajikistan. In total, 221 cores from seven sites were successfully dated and used to establish the master chronology (reliable length of 1823–2014), and stable isotope chronologies of the tree rings from four sites were combined to construct a new regional standard isotope chronology (reliable length of 1950–2014). The results indicated that the juniper TRW and ∆13C chronologies faithfully capture climate variability, and the tree-ring isotope chronologies from both high and low elevation sites contained a low-frequency signal generated by climatic and tree-physiological lag effects. Thus, stable isotopes of juniper tree rings in Tajikistan may be considered to be an important proxy for investigating climate variability. Moreover, we found major differences in the effect of temperature and precipitation on tree-ring indexes. Temperature from late summer to early winter is a pronounced limiting factor for tree growth. However, precipitation from the previous July to the current May is the dominant climatic factor accounting for inter-annual variations in the ∆13C chronology. Tree-ring isotopes could successfully complement the information on environmental forcing provided by TRW chronologies. By investigating the seasonal effect and lagging time, the correlation results confirmed that snowmelt season temperature and winter precipitation are greatly important factors for tree growth and physiology of juniper in Tajikistan. Thus, we need to expand the assessments of the mechanisms determining the baseflow over longer time periods. Future studies should extend the stable isotope chronology by collecting cores from old trees and by developing spatial tree-ring isotope chronologies in conjunction with other tree-ring indexes to reveal the long-term spatiotemporal climatic variations of Central Asia.
Author Contributions
Y.F., H.S. and S.Y. conceived and designed the experiments; Y.F. performed the experiments; Y.W. analyzed the data; Y.F. and Q.L. contributed materials; Y.F. wrote the manuscript. All authors have read and agreed to the published version of the manuscript.
Funding
This research was funded by “Tianshan Youth Talents (Xinjiang)” Plan Project (no. 2018Q085), the Natural Science Foundation of Xinjiang (no. 2018D01B07), and the open project of key laboratory of Xinjiang (no. 2021D04004).
Data Availability Statement
Data will be made available upon reasonable request to the corresponding author.
Acknowledgments
We thank the anonymous reviewers for useful comments that helped improve this manuscript.
Conflicts of Interest
The authors declare that the research was conducted in the absence of any commercial or financial relationships that could be construed as a potential conflict of interest.
References
- Opała-Owczarek, M.; Niedźwiedź, T. Last 1100 yr of precipitation variability in western central Asia as revealed by tree-ring data from the Pamir-Alay. Quat. Res. 2019, 91, 81–95. [Google Scholar] [CrossRef] [Green Version]
- Evans, S.G.; Roberts, N.J.; Ischuk, A.; Delaney, K.B.; Morozova, G.S.; Tutubalina, O. Landslides triggered by the 1949 Khait earthquake, Tajikistan, and associated loss of life. Eng. Geol. 2009, 109, 195–212. [Google Scholar] [CrossRef]
- Aizen, V.; Aizen, E.; Melack, J.; Martma, T. Isotopic measurements of precipitation on central Asian glaciers (southeastern Tibet, northern Himalayas, central Tien Shan). J. Geophys. Res. Atmos. 1996, 101, 9185–9196. [Google Scholar] [CrossRef] [Green Version]
- Haag, I.; Kassam, K.A.; Senftl, T.; Zandler, H.; Samimi, C. Measurements meet human observations: Integrating distinctive ways of knowing in the Pamir Mountains of Tajikistan to assess local climate change. Clim. Chang. 2021, 165, 1–22. [Google Scholar] [CrossRef]
- Kure, S.; Jang, S.; Ohara, N.; Kavvas, M.L.; Chen, Z.Q. Hydrologic impact of regional climate change for the snow-fed and glacier-fed river basins in the republic of tajikistan: Statistical downscaling of global climate model projections. Hydrol. Process. 2013, 27, 4071–4090. [Google Scholar] [CrossRef]
- Opała-Owczarek, M. Warm-season temperature reconstruction from high-elevation juniper tree rings over the past millennium in the Pamir region. Palaeogeogr. Palaeoclim. Palaeoecol. 2019, 532, 109248. [Google Scholar] [CrossRef]
- Fritts, H.C. Dendrochronology and Dendroclimatology. In Tree Rings and Climate; Academic Press: Cambridge, MA, USA, 1976; Chapter 1. [Google Scholar]
- Jones, P.D.; Briffa, K.R.; Osborn, T.J.; Lough, J.M.; Van Ommen, T.D.; Vinther, B.M.; Luterbacher, J.; Wahl, E.R.; Zwiers, F.W.; Mann, M.E.; et al. High-resolution palaeoclimatology of the last millennium: A review of current status and future prospects. Holocene 2009, 19, 3–49. [Google Scholar] [CrossRef]
- Opała, M.; Niedźwiedź, T.; Rahmonov, O.; Owczarek, P.; Małarzewski, Ł. Towards improving the Central Asian dendrochronological network—New data from Tajikistan, Pamir-Alay. Dendrochronologia 2017, 41, 10–23. [Google Scholar] [CrossRef]
- Chen, F.; Zhang, T.; Seim, A.; Yu, S.; Zhang, R.; Linderholm, H.W.; Kobuliev, Z.V.; Ahmadov, A.; Kodirov, A. Juniper tree-ring data from the Kuramin Range (Northern Tajikistan) reveals changing summer drought signals in Western Central Asia. Forests 2019, 10, 505. [Google Scholar] [CrossRef] [Green Version]
- Chen, F.; Yu, S.; He, Q.; Zhang, R.; Kobuliev, Z.V.; Mamadjonov, Y.M. Comparison of drought signals in tree-ring width records of juniper trees from Central and West Asia during the last four centuries. Arab. J. Geosci. 2016, 9, 1–10. [Google Scholar] [CrossRef]
- Owczarek, P.; Opała-Owczarek, M.; Rahmonov, O.; Mendecki, M. 100 Years of earthquakes in the Pamir region as recorded in juniper wood: A case study of Tajikistan. J. Asian Earth Sci. 2017, 138, 173–185. [Google Scholar] [CrossRef]
- Chen, F.; He, Q.; Bakytbek, E.; Yu, S.-L.; Zhang, R.-B. Climatic signals in tree rings of Juniperus turkestanica in the Gulcha River Basin (Kyrgyzstan), reveals the recent wetting trend of high Asia. Dendrobiology 2015, 74, 35–42. [Google Scholar] [CrossRef] [Green Version]
- Opała-Owczarek, M.; Owczarek, P.; Rahmonov, O.; Niedźwiedź, T. The first dendrochronological dating of timber from Tajikistan—Potential for developing a millennial tree-ring record. Tree-Ring Res. 2018, 74, 50–62. [Google Scholar] [CrossRef]
- Esper, J.; Frank, D.C.; Wilson, R.J.S.; Büntgen, U.; Treydte, K. Uniform growth trends among central Asian low- and high-elevation juniper tree sites. Trees 2007, 21, 141–150. [Google Scholar] [CrossRef] [Green Version]
- Seim, A.; Omurova, G.; Azisov, E.; Musuraliev, K.; Aliev, K.; Tulyaganov, T.; Nikolyai, L.; Botman, E.; Helle, G.; Liñan, I.D.; et al. Climate change increases drought stress of juniper trees in the mountains of central Asia. PLoS ONE 2016, 11, e0153888. [Google Scholar] [CrossRef]
- Chen, F.; Yuan, Y.; Fan, Z.; Yu, S. A Winter Precipitation Reconstruction (CE 1810–2012) in the Southeastern Tibetan Plateau and Its Relationship to Salween River Streamflow Variations. Pure Appl. Geophys. 2018, 175, 2279–2291. [Google Scholar] [CrossRef]
- Duan, J.; Wu, P.; Ma, Z. Reconciling the discrepancy of post-volcanic cooling estimated from tree-ring reconstructions and model simulations over the tibetan plateau. Atmosphere 2019, 10, 738. [Google Scholar] [CrossRef] [Green Version]
- Qin, C.; Yang, B.; Melvin, T.M.; Fan, Z.; Zhao, Y.; Briffa, K.R. Radial growth of qilian juniper on the northeast tibetan plateau and potential climate associations. PLoS ONE 2013, 8, e79362. [Google Scholar] [CrossRef] [Green Version]
- Yang, B.; He, M.; Shishov, V.; Tychkov, I.; Vaganov, E.; Rossi, S.; Ljungqvist, F.C.; Bräuning, A.; Grießinger, J. New perspective on spring vegetation phenology and global climate change based on Tibetan Plateau tree-ring data. Proc. Natl. Acad. Sci. USA 2017, 114, 6966–6971. [Google Scholar] [CrossRef] [Green Version]
- Chen, F.; Wang, H.; Yuan, Y. Two centuries of temperature variation and volcanic forcing reconstructed for the northern Tibetan Plateau. Phys. Geogr. 2017, 38, 248–262. [Google Scholar] [CrossRef]
- Gou, X.; Zhou, F.; Zhang, Y.; Chen, Q.; Zhang, J. Forward modeling analysis of regional scale tree-ring patterns around the northeastern Tibetan Plateau, Northwest China. Biogeosci. Discuss. 2013, 10, 9969–9988. [Google Scholar] [CrossRef] [Green Version]
- Chen, F.; Yuan, Y.; Yu, S. Tree-ring indicators of rainfall and streamflow for the Ili-Balkhash Basin, Central Asia since CE 1560. Palaeogeogr. Palaeoclim. Palaeoecol. 2017, 482, 48–56. [Google Scholar] [CrossRef]
- Yuan, Y.; Shao, X.; Wei, W.; Yu, S.; Gong, Y.; Trouet, V. The potential to reconstruct Manasi River streamflow in the Northern Tien Shan Mountains (NW China). Tree-Ring Res. 2007, 63, 81–93. [Google Scholar] [CrossRef] [Green Version]
- Zhang, R.; Yuan, Y.; Gou, X.; Yang, Q.; Wei, W.; Yu, S.; Zhang, T.; Shang, H.; Chen, F.; Fan, Z.; et al. Streamflow variability for the Aksu River on the southern slopes of the Tien Shan inferred from tree ring records. Quat. Res. 2016, 85, 371–379. [Google Scholar] [CrossRef]
- Chen, F.; Shang, H.; Yuan, Y. Dry/wet variations in the eastern Tien Shan (China) since AD 1725 based on Schrenk spruce (Picea schrenkiana Fisch. et Mey) tree rings. Dendrochronologia 2016, 40, 110–116. [Google Scholar] [CrossRef]
- Chen, F.; Mambetov, B.; Maisupova, B.; Kelgenbayev, N. Drought variations in Almaty (Kazakhstan) since AD 1785 based on spruce tree rings. Stoch. Environ. Res. Risk Assess. 2017, 31, 2097–2105. [Google Scholar] [CrossRef]
- Zhang, T.; Diushen, M.; Bakytbek, E.; Shang, H.; Gao, Y.; Huang, L.; Zhang, R.; Chen, F.; Yu, S.; Yin, Z.; et al. Tree ring record of annual runoff for Issyk Lake, Central Asia. J. Water Clim. Chang. 2019, 10, 610–623. [Google Scholar] [CrossRef]
- Chen, F.; Yuan, Y.-J.; Wei, W.-S.; Yu, S.-L.; Zhang, T.-W.; Shang, H.-M.; Zhang, R.-B.; Qin, L.; Fan, Z.-A. Tree-ring recorded hydroclimatic change in Tienshan mountains during the past 500 years. Quat. Int. 2015, 358, 35–41. [Google Scholar] [CrossRef]
- Chen, F.; Yuan, Y.; Yu, S.; Shang, H.; Zhang, T. Tree-ring based reconstruction of precipitation in the Urumqi region, China, since AD 1580 reveals changing drought signals. Clim. Res. 2016, 68, 49–58. [Google Scholar] [CrossRef]
- Esper, J.; Treydte, K.; Gärtner, H.; Neuwirth, B. A tree ring reconstruction of climatic extreme years since 1427 AD for Western Central Asia. Paleobotanist 2001, 50, 141–152. [Google Scholar]
- Zhang, T.-W.; Yuan, Y.-J.; Liu, Y.; Wei, W.-S.; Yu, S.-L.; Chen, F.; Fan, Z.-A.; Shang, H.-M.; Zhang, R.-B.; Qin, L. A tree-ring based precipitation reconstruction for the Baluntai region on the southern slope of the central Tien Shan Mountains, China, since A.D. 1464. Quat. Int. 2013, 283, 55–62. [Google Scholar] [CrossRef]
- Chen, F.; Yuan, Y.-J. Streamflow reconstruction for the Guxiang River, eastern Tien Shan (China): Linkages to the surrounding rivers of Central Asia. Environ. Earth Sci. 2016, 75, 1049. [Google Scholar] [CrossRef]
- Lipp, J.; Trimborn, P.; Fritz, P.; Moser, H.; Becker, B.; Frenzel, B. Stable isotopes in tree ring cellulose and climatic change. Tellus B Chem. Phys. Meteorol. 1991, 43, 322–330. [Google Scholar] [CrossRef] [Green Version]
- Offermann, C.; Ferrio, J.P.; Holst, J.; Grote, R.; Siegwolf, R.; Kayler, Z.; Gessler, A. The long way down—Are carbon and oxygen isotope signals in the tree ring uncoupled from canopy physiological processes? Tree Physiol. 2011, 31, 1088–1102. [Google Scholar] [CrossRef] [Green Version]
- Xu, G.; Liu, X.; Trouet, V.; Treydte, K.; Wu, G.; Chen, T.; Sun, W.; An, W.; Wang, W.; Zeng, X.; et al. Regional drought shifts (1710–2010) in East Central Asia and linkages with atmospheric circulation recorded in tree-ring δ 18 O. Clim. Dyn. 2019, 52, 713–727. [Google Scholar] [CrossRef] [Green Version]
- Johnstone, J.A.; Roden, J.S.; Dawson, T.E. Oxygen and carbon stable isotopes in coast redwood tree rings respond to spring and summer climate signals. J. Geophys. Res. Biogeosci. 2013, 118, 1438–1450. [Google Scholar] [CrossRef]
- Young, G.H.F.; Demmler, J.C.; Gunnarson, B.E.; Kirchhefer, A.J.; Loader, N.J.; Mccarroll, D. Age trends in tree ring growth and isotopic archives: A case study of Pinus sylvestris L. from northwestern Norway. Glob. Biogeochem. Cycles 2011, 25. [Google Scholar] [CrossRef]
- Bert, D.; Leavitt, S.W.; Dupouey, J.L. Variations of wood δ13C and water-use efficiency of Abies alba during the last century. Ecology 1997, 78, 1588. [Google Scholar] [CrossRef]
- Sullivan, P.F.; Pattison, R.R.; Brownlee, A.H.; Cahoon, S.M.P.; Hollingsworth, T.N. Limited evidence of declining growth among moisture-limited black and white spruce in interior Alaska. Sci. Rep. 2017, 7, 15344. [Google Scholar] [CrossRef]
- Treydte, K.; Schleser, G.H.; Schweingruber, F.H.; Winiger, M. The climatic significance of δ13C in subalpine spruces (Lötschental, Swiss Alps). Tellus B Chem. Phys. Meteorol. 2001, 53, 593–611. [Google Scholar] [CrossRef]
- Fan, Y.; Shang, H.; Wu, Y.; Li, Q. Tree-Ring Width and Carbon Isotope Chronologies Track Temperature, Humidity, and Baseflow in the Tianshan Mountains, Central Asia. Forests 2020, 11, 1308. [Google Scholar] [CrossRef]
- Monserud, R.A.; Marshall, J.D. Time-series analysis of δ13C from tree rings. I. Time trends and autocorrelation. Tree Physiol. 2001, 21, 1087–1102. [Google Scholar] [CrossRef] [PubMed] [Green Version]
- Liu, Y.; Ta, W.; Li, Q.; Song, H.; Sun, C.; Cai, Q.; Liu, H.; Wang, L.; Hu, S.; Sun, J.; et al. Tree-ring stable carbon isotope-based April–June relative humidity reconstruction since ad 1648 in Mt. Tianmu, China. Clim. Dyn. 2018, 50, 1733–1745. [Google Scholar] [CrossRef]
- Jin, X.; Xu, Q.; Liu, S.R.; Jiang, C.Q. Relationships of stable carbon isotope of Abies faxoniana tree-rings to climate in sub-alpine forest in Western Sichuan. Acta Ecol. Sin. 2014, 34, 1831–1840. [Google Scholar] [CrossRef] [Green Version]
- Liu, X.Y.; Duan, A.G.; Zhang, J.G.; Zhang, X.Q.; Zhu, A.M. Responses of δ13C Value of Cellulose in Tree Ring of Chinese Fir Provenances to Annual Climate Factors. For. Res. 2020, 33, 9–18. [Google Scholar] [CrossRef]
- Nakatsuka, T.; Ohnishi, K.; Hara, T.; Sumida, A.; Mitsuishi, D.; Kurita, N.; Uemura, S. Oxygen and carbon isotopic ratios of tree-ring cellulose in a conifer-hardwood mixed forest in northern Japan. Geochem. J. 2004, 38, 77–88. [Google Scholar] [CrossRef]
- Finaev, A.F. The Model of Dust Aerosol Accumulation in Tajikistan. Geogr. Environ. Sustain. 2014, 7, 97–107. [Google Scholar] [CrossRef] [Green Version]
- Wang, X.; Carrapa, B.; Sun, Y.; Dettman, D.L.; Chapman, J.B.; Caves Rugenstein, J.K.; Clementz, M.T.; DeCelles, P.G.; Wang, M.; Chen, J.; et al. The role of the westerlies and orography in Asian hydroclimate since the late Oligocene. Geology 2020, 48, 728–732. [Google Scholar] [CrossRef]
- Li, H.L.; He, Q.; Liu, X.C.; Zhao, Q.W. Analysis of transport pathways and potential source regions of PM10 in the eastern Pamirs. China Environ. Sci. 2020, 40, 4660–4668. [Google Scholar]
- Holmes, R. Computer-Assisted Quality Control in Tree-Ring Dating and Measurement. Tree-Ring Bull. 1983, 43, 51–67. [Google Scholar]
- Cook, E.R.; Kairiukstis, L.A. Methods of dendrochronology: Applications in the environmental sciences. Artic Alp. Res. 1991, 23, 120. [Google Scholar] [CrossRef]
- Team, R.C. R: A Language and Environment for Statistical Computing. R Foundation for Statistical Computing. 2016. Available online: http://www.R-project.org/ (accessed on 6 June 2021).
- Wigley, T.M.L.; Briffa, K.R.; Jones, P.D. On the average value of correlated time series with applications in dendroclimatology and hydrometeorology. J. Clim. Appl. Meteorol. 1984, 23, 201–213. [Google Scholar] [CrossRef]
- McCarroll, D.; Loader, N.J. Stable isotopes in tree rings. Quat. Sci. Rev. 2004, 23, 771–801. [Google Scholar] [CrossRef]
- Foroozan, Z.; Grießinger, J.; Pourtahmasi, K.; Bräuning, A. Evaluation of different pooling methods to establish a multi-century δ18O chronology for paleoclimate reconstruction. Geosciences 2019, 9, 270. [Google Scholar] [CrossRef] [Green Version]
- Leavitt, S.W.; Long, A. Sampling strategy for stable carbon isotope analysis of tree rings in pine. Nature 1984, 311, 145–147. [Google Scholar] [CrossRef]
- Leavitt, S.W. Tree-ring C-H-O isotope variability and sampling. Sci. Total Environ. 2010, 408, 5244–5253. [Google Scholar] [CrossRef]
- Leavitt, S.W. Tree-ring isotopic pooling without regard to mass: No difference from averaging δ13C values of each tree. Chem. Geol. 2008, 252, 52–55. [Google Scholar] [CrossRef]
- Barbour, M.M.; Andrews, T.J.; Farquhar, G.D. Correlations between oxygen isotope ratios of wood constituents of Quercus and Pinus samples from around the world. Aust. J. Plant Physiol. 2001, 28, 335. [Google Scholar] [CrossRef]
- Liu, Y.; Ma, L.; Leavitt, S.W.; Cai, Q.; Liu, W. A preliminary seasonal precipitation reconstruction from tree-ring stable carbon isotopes at Mt. Helan, China, since AD 1804. Glob. Planet. Chang. 2004, 41, 229–239. [Google Scholar] [CrossRef]
- Tao, F.; Liu, Y.; An, N. On the necessity of organic solvent extraction for carbon isotopic analysis of a-cellulose: Implications for environmental reconstructions. Int. J. Environ. Anal. Chem. 2010, 90, 605–619. [Google Scholar] [CrossRef]
- Foroozan, Z.; Pourtahmasi, K.; Bräuning, A. Stable oxygen isotopes in juniper and oak tree rings from northern Iran as indicators for site-specific and season-specific moisture variations. Dendrochronologia 2015, 36, 33–39. [Google Scholar] [CrossRef]
- Farquhar, G.D.; O’Leary, M.H.; Berry, J.A. On the Relationship Between Carbon Isotope Discrimination and the Intercellular Carbon Dioxide Concentration in Leaves. Funct. Plant Biol. 1982, 9, 121–137. [Google Scholar] [CrossRef]
- Eyer, M. Highly Resolved δ13C Measurements on CO2 in Air from Antarctic Ice Cores. Ph.D. Thesis, University of Bern, Bern, Switzerland, 4 November 2004. [Google Scholar]
- Zhang, R.; Wei, W.; Shang, H.; Yu, S.; Gou, X.; Qin, L.; Bolatov, K.; Mambetov, B.T. A tree ring-based record of annual mass balance changes for the TS.Tuyuksuyskiy Glacier and its linkages to climate change in the Tianshan Mountains. Quat. Sci. Rev. 2019, 205, 10–21. [Google Scholar] [CrossRef]
- Rubino, M.; Etheridge, D.M.; Trudinger, C.M.; Allison, C.E.; Battle, M.O.; Langenfelds, R.L.; Steele, L.P.; Curran, M.; Bender, M.; White, J.W.C.; et al. A revised 1000 year atmospheric δ13 C-CO2 record from Law Dome and South Pole, Antarctica. J. Geophys. Res. Atmos. 2013, 118, 8482–8499. [Google Scholar] [CrossRef]
- Meko, D.M.; Touchan, R.; Anchukaitis, K.J. Seascorr: A MATLAB program for identifying the seasonal climate signal in an annual tree-ring time series. Comput. Geosci. 2011, 37, 1234–1241. [Google Scholar] [CrossRef]
- Vicente-Serrano, S.M.; Camarero, J.J.; Azorin-Molina, C. Diverse responses of forest growth to drought time-scales in the Northern Hemisphere. Glob. Ecol. Biogeogr. 2015, 23, 1019–1030. [Google Scholar] [CrossRef] [Green Version]
- Zang, C.; Biondi, F. Treeclim: An R package for the numerical calibration of proxy-climate relationships. Ecography 2015, 38, 431–436. [Google Scholar] [CrossRef]
- Torrence, C.; Compo, G.P. A Practical Guide to Wavelet Analysis. Bull. Am. Meteorol. Soc. 1998, 79, 61–78. [Google Scholar] [CrossRef] [Green Version]
- Grinsted, A.; Moore, J.C.; Jevrejeva, S. Application of the cross wavelet transform and wavelet coherence to geophysical time series. Nonlinear Process. Geophys. 2004, 11, 561–566. [Google Scholar] [CrossRef]
- Bunn, A.G. A dendrochronology program library in R (dplR). Dendrochronologia 2008, 26, 115–124. [Google Scholar] [CrossRef]
- Bakhtiyorov, Z.; Yu, R.; Monoldorova, A.; Ta, Z.; Aminov, J. Tree-ring-based summer temperature minimum reconstruction for Taboshar, Sogd Province, Tajikistan, since AD 1840: Linkages to the Oceans. Preprints 2018, 2018060312. [Google Scholar] [CrossRef] [Green Version]
- Dyer, T.G.J.; Fritts, H.C. Tree Rings and Climate. J. Appl. Ecol. 1978, 15, 339. [Google Scholar] [CrossRef]
- Levanič, T.; Jevšenak, J.; Hafner, P. Stable isotopes reveal climate signal hidden in tree rings of endemic Balkan pines. Atmosphere 2020, 11, 135. [Google Scholar] [CrossRef] [Green Version]
- Holzkämper, S.; Kuhry, P.; Kultti, S.; Gunnarson, B.; Sonninen, E. Stable isotopes in tree rings as proxies for winter precipitation changes in the Russian Arctic over the past 150 years. Geochronometria 2009, 32, 37–46. [Google Scholar] [CrossRef] [Green Version]
- McDowell, N.G.; Phillips, N.; Lunch, C.; Bond, B.J.; Ryan, M.G. An investigation of hydraulic limitation and compensation in large, old Douglas-fir trees. Tree Physiol. 2002, 22, 763–774. [Google Scholar] [CrossRef] [Green Version]
- Bobojonov, I.; Aw-Hassan, A. Impacts of climate change on farm income security in Central Asia: An integrated modeling approach. Agric. Ecosyst. Environ. 2014, 188, 245–255. [Google Scholar] [CrossRef]
- Farquhar, G.D.; Lloyd, J. Carbon and Oxygen Isotope Effects in the Exchange of Carbon Dioxide between Terrestrial Plants and the Atmosphere. Stable Isotopes and Plant Carbon-Water Relations; Ehleringer, J.R., Hall, A.E., Farquhar, G.D., Eds.; Academic Press: Cambridge, MA, USA, 1993. [Google Scholar]
- Gupta, R.; Kienzler, K.; Martius, C.; Mirzabaev, A.; Oweis, T.; De Pauw, E.; Qadir, M.; Shideed, K.; Sommer, R.; Thomas, R.; et al. A Vision for Sustainable Land Management Research in Central Asia; ICARDA Central Asia and Caucasus Program; CGIAR-PFU: Ashkent, Uzbekistan, 2009. [Google Scholar]
- Panyushkina, I.P.; Meko, D.M.; Macklin, M.G.; Toonen, W.H.J.; Mukhamadiev, N.S.; Konovalov, V.G.; Ashikbaev, N.Z.; Sagitov, A.O. Runoff variations in Lake Balkhash Basin, Central Asia, 1779–2015, inferred from tree rings. Clim. Dyn. 2018, 51, 3161–3177. [Google Scholar] [CrossRef]
- Cernusak, L.A.; Ubierna, N.; Winter, K.; Holtum, J.A.M.; Marshall, J.D.; Farquhar, G.D. Environmental and physiological determinants of carbon isotope discrimination in terrestrial plants. New Phytol. 2013, 200, 950–965. [Google Scholar] [CrossRef] [PubMed]
- Leonelli, G.; Pelfini, M.; Battipaglia, G.; Saurer, M.; Siegwolf, R.T.W.; Cherubini, P. First detection of glacial meltwater signature in tree-ring δ18O: Reconstructing past major glacier runoff events at Lago Verde (Miage Glacier, Italy). Boreas 2014, 43, 600–607. [Google Scholar] [CrossRef]
- Treydte, K.S.; Schleser, G.H.; Helle, G.; Frank, D.C.; Winiger, M.; Haug, G.H.; Esper, J. The twentieth century was the wettest period in northern Pakistan over the past millennium. Nature 2006, 440, 1179–1182. [Google Scholar] [CrossRef]
- Vuaridel, M.; Cherubini, P.; Mettra, F.; Vennemann, T.; Lane, S.N. Climate-driven change in the water sourced by trees in a de-glaciating proglacial fore-field, Torres del Paine, Chile. Ecohydrology 2019, 12. [Google Scholar] [CrossRef]
- Zeng, X.; Liu, X.; Wang, W.; Xu, G.; An, W.; Wu, G. No altitude-dependent effects of climatic signals are recorded in Smith fir tree-ring δ18O on the southeastern Tibetan Plateau, despite a shift in tree growth. Boreas 2014, 43, 588–599. [Google Scholar] [CrossRef]
- Leonelli, G.; Battipaglia, G.; Cherubini, P.; Saurer, M.; Siegwolf, R.T.W.; Maugeri, M.; Stenni, B.; Fumagalli, M.L.; Pelfini, M.; Maggi, V. Tree-ring δ18O from an alpine catchment reveals changes in glacier stream water inputs between 1980 and 2010. Arctic Antarct. Alp. Res. 2019, 51, 250–264. [Google Scholar] [CrossRef] [Green Version]
- Kaiser, K.F. Two Creeks Interstade Dated through Dendrochronology and AMS. Quat. Res. 1994, 42, 288–298. [Google Scholar] [CrossRef]
- Fan, Y.; Chen, Y.; Liu, Y.; Li, W. Variation of baseflows in the headstreams of the Tarim River Basin during 1960–2007. J. Hydrol. 2013, 487, 98–108. [Google Scholar] [CrossRef]
- Liu, X.; Yin, Z.Y.; Shao, X.; Qin, N. Temporal trends and variability of daily maximum and minimum, extreme temperature events, and growing season length over the eastern and central Tibetan Plateau during 1961–2003. J. Geophys. Res. Atmos. 2006, 111, D19109. [Google Scholar] [CrossRef] [Green Version]
- Esper, J.; Großjean, J.; Camarero, J.J.; García-Cervigón, A.I.; Olano, J.M.; González-Rouco, J.F.; Domínguez-Castro, F.; Büntgen, U. Atlantic and Mediterranean synoptic drivers of central Spanish juniper growth. Theor. Appl. Clim. 2015, 121, 571–579. [Google Scholar] [CrossRef]
- Yadav, R.R.; Singh, J.; Dubey, B.; Misra, K.G. A 1584-year ring width chronology of juniper from Lahul, Himachal Pradesh: Prospects of developing millennia-long climate records. Curr. Sci. 2006, 90, 1122–1126. [Google Scholar]
- Yang, B.; Qin, C.; Wang, J.; He, M.; Melvin, T.M.; Osborn, T.J.; Briffa, K.R. A 3500-year tree-ring record of annual precipitation on the northeastern Tibetan Plateau. Proc. Natl. Acad. Sci. USA 2014, 111, 2903–2908. [Google Scholar] [CrossRef] [Green Version]
- Gulahmadov, N.; Chen, Y.; Gulakhmadov, A.; Rakhimova, M.; Gulakhmadov, M. Quantifying the Relative Contribution of Climate Change and Anthropogenic Activities on Runoff Variations in the Central Part of Tajikistan in Central Asia. Land 2021, 10, 525. [Google Scholar] [CrossRef]
- Olsson, O.; Gassmann, M.; Wegerich, K.; Bauer, M. Identification of the effective water availability from streamflows in the Zerafshan river basin, Central Asia. J. Hydrol. 2010, 390, 190–197. [Google Scholar] [CrossRef]
- Evans, S.G.; Yokeley, B.; Stephens, C.; Brewer, B. Potential mechanistic causes of increased baseflow across northern Eurasia catchments underlain by permafrost. Hydrol. Process. 2020, 34. [Google Scholar] [CrossRef]
- Song, C.; Wang, G.; Mao, T.; Chen, X.; Huang, K.; Sun, X.; Hu, Z. Importance of active layer freeze-thaw cycles on the riverine dissolved carbon export on the Qinghai-Tibet Plateau permafrost region. PeerJ 2019, 2019, e7146. [Google Scholar] [CrossRef] [PubMed] [Green Version]
Figure 1.
(a) Location of the juniper tree-ring sampling sites in Tajikistan; (b) long-term variations of temperature and precipitation cover the period of 1901–2015. Bars indicate annual precipitation anomaly (in mm), and curves with red color represent annual temperature anomaly (in °C).; (c) monthly variations in temperature and precipitation change in a year.
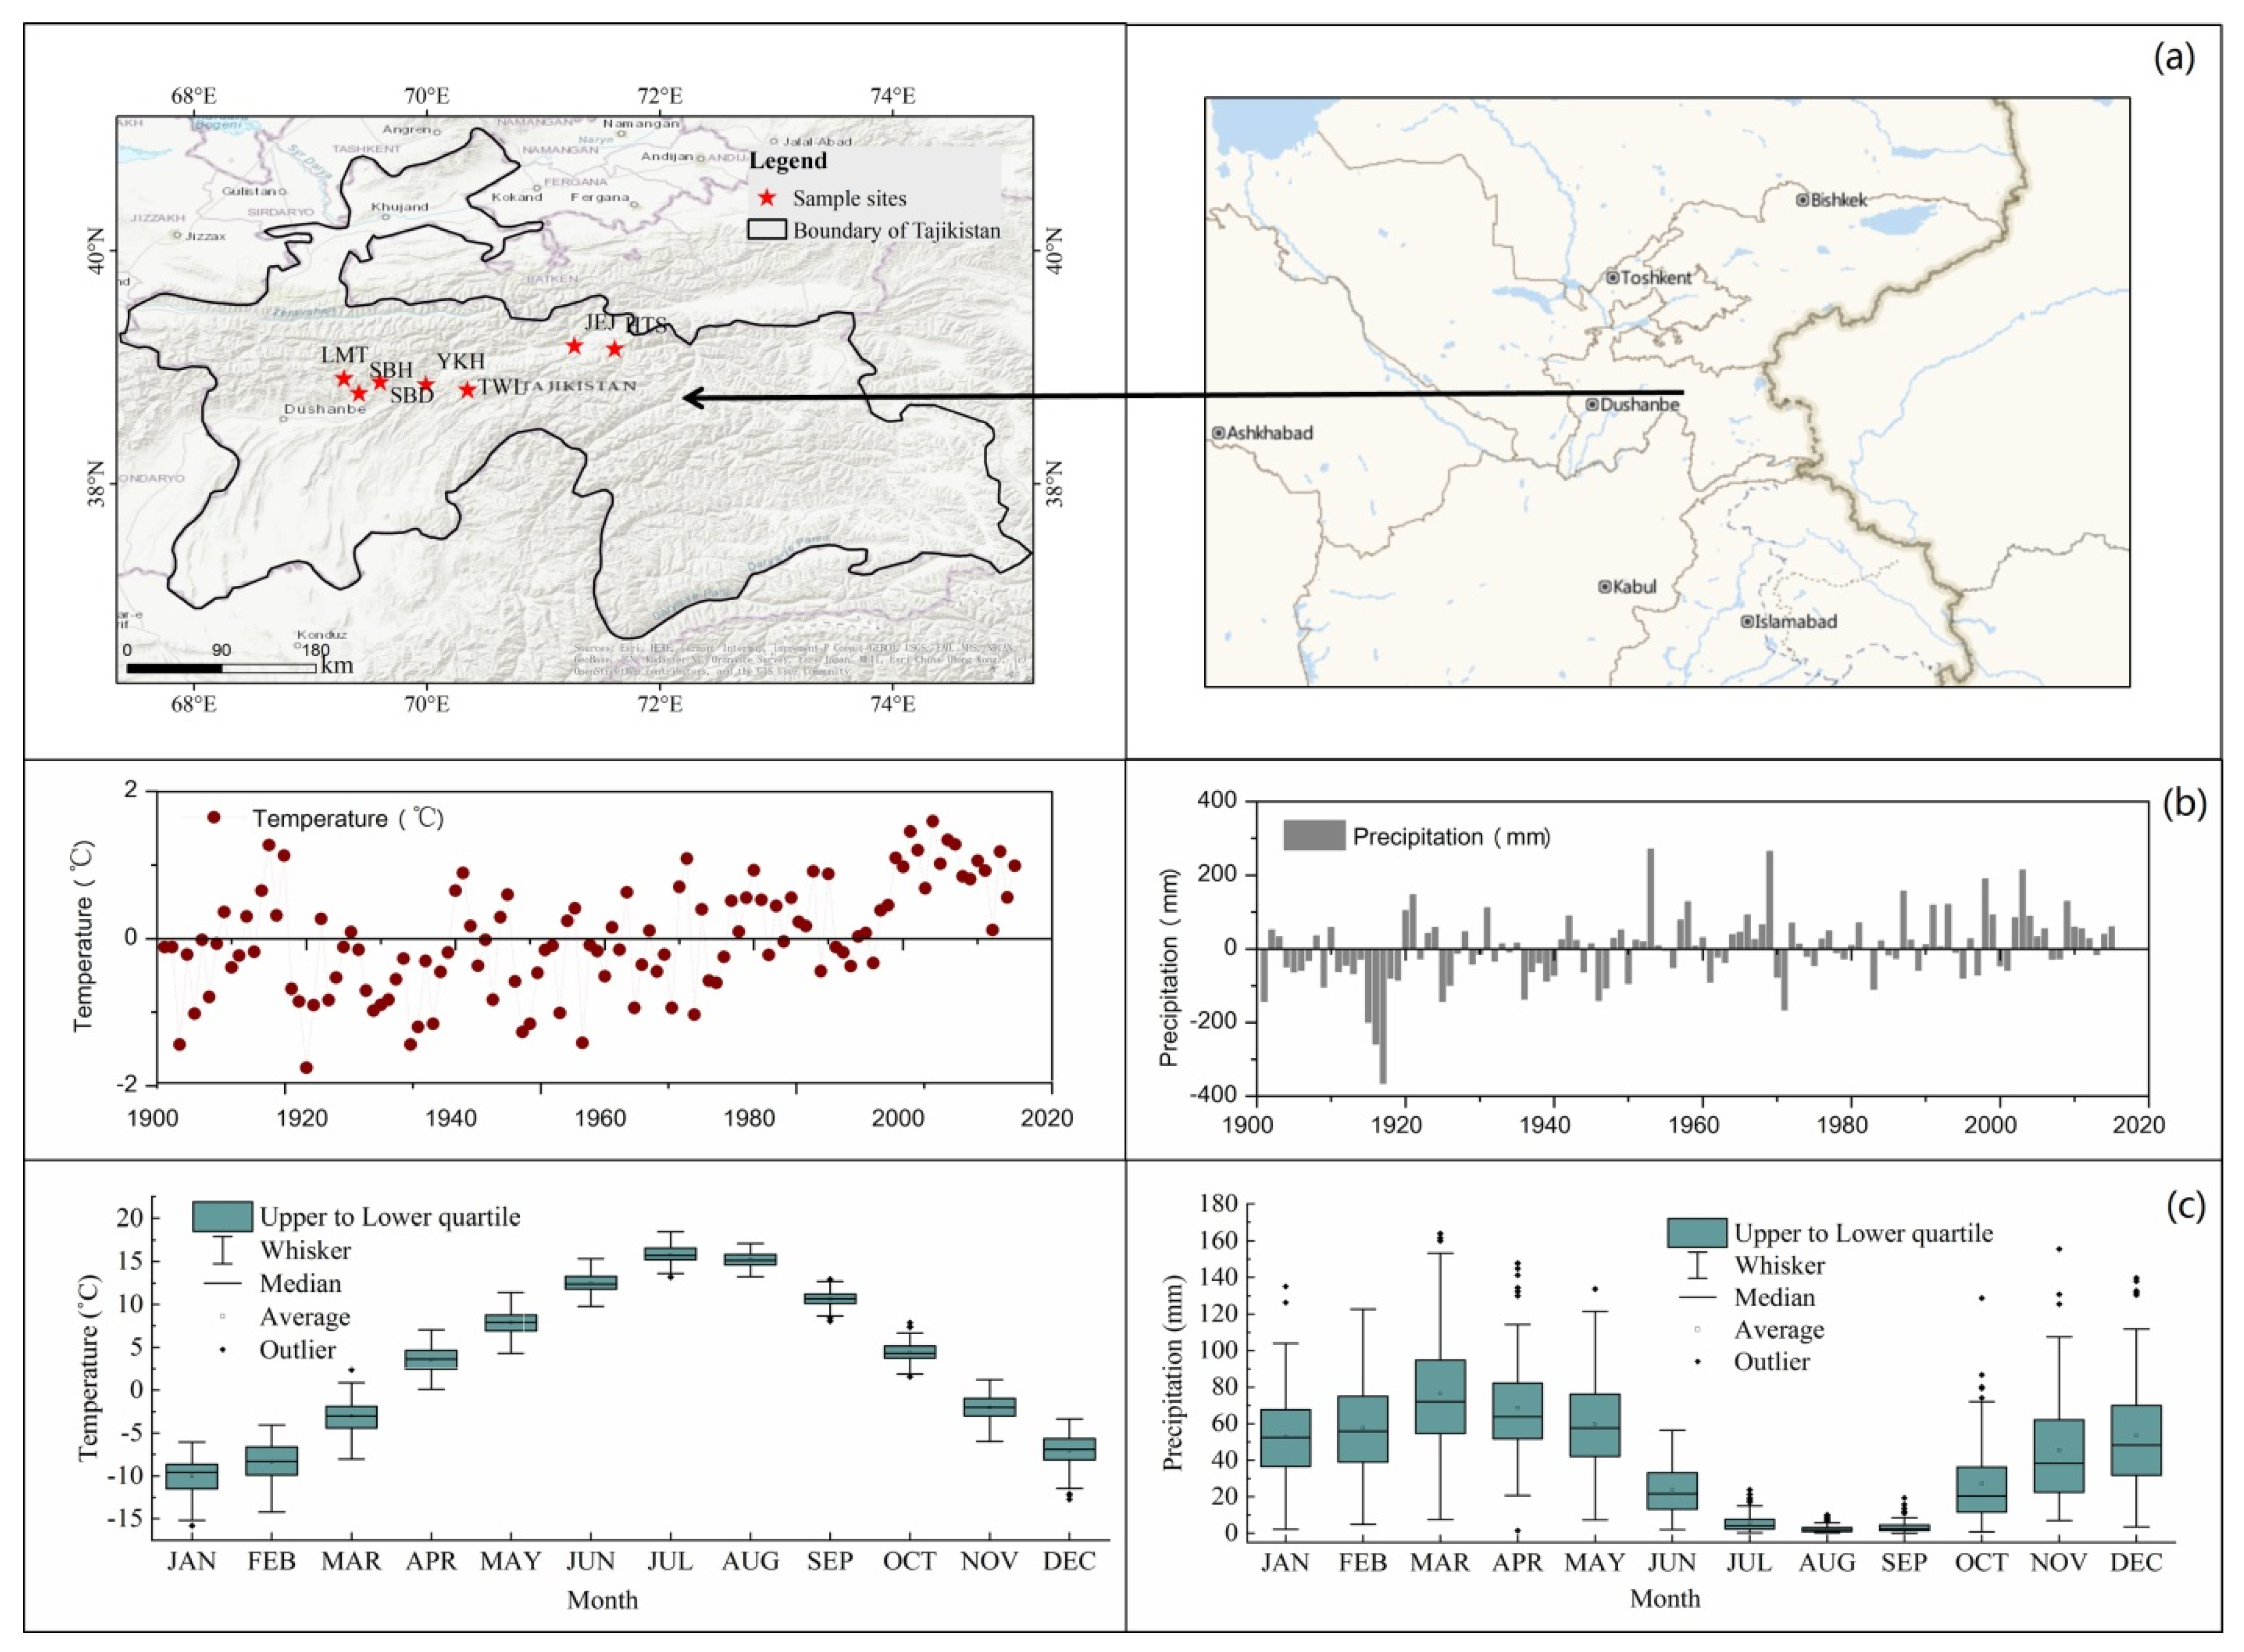
Figure 2.
(a) Plot of running expressed population signal (EPS) and mean inter-series correlation (Rbar) of tree-ring width (TRW) chronology; (b) Tajikistan TRW chronology (standard (STD)) detrended using a 10-year smoothing spline curve (red line) and the sample depths (gray shaded area) with respect to time; (c) Wavelet power spectrum. The contour levels were chosen so that 75, 50, 25, and 5% of the wavelet power was above each level. The black contour represents the 1% significance level with a red noise (autoregressive lag1) background spectrum. RWI refers to the ring width index.
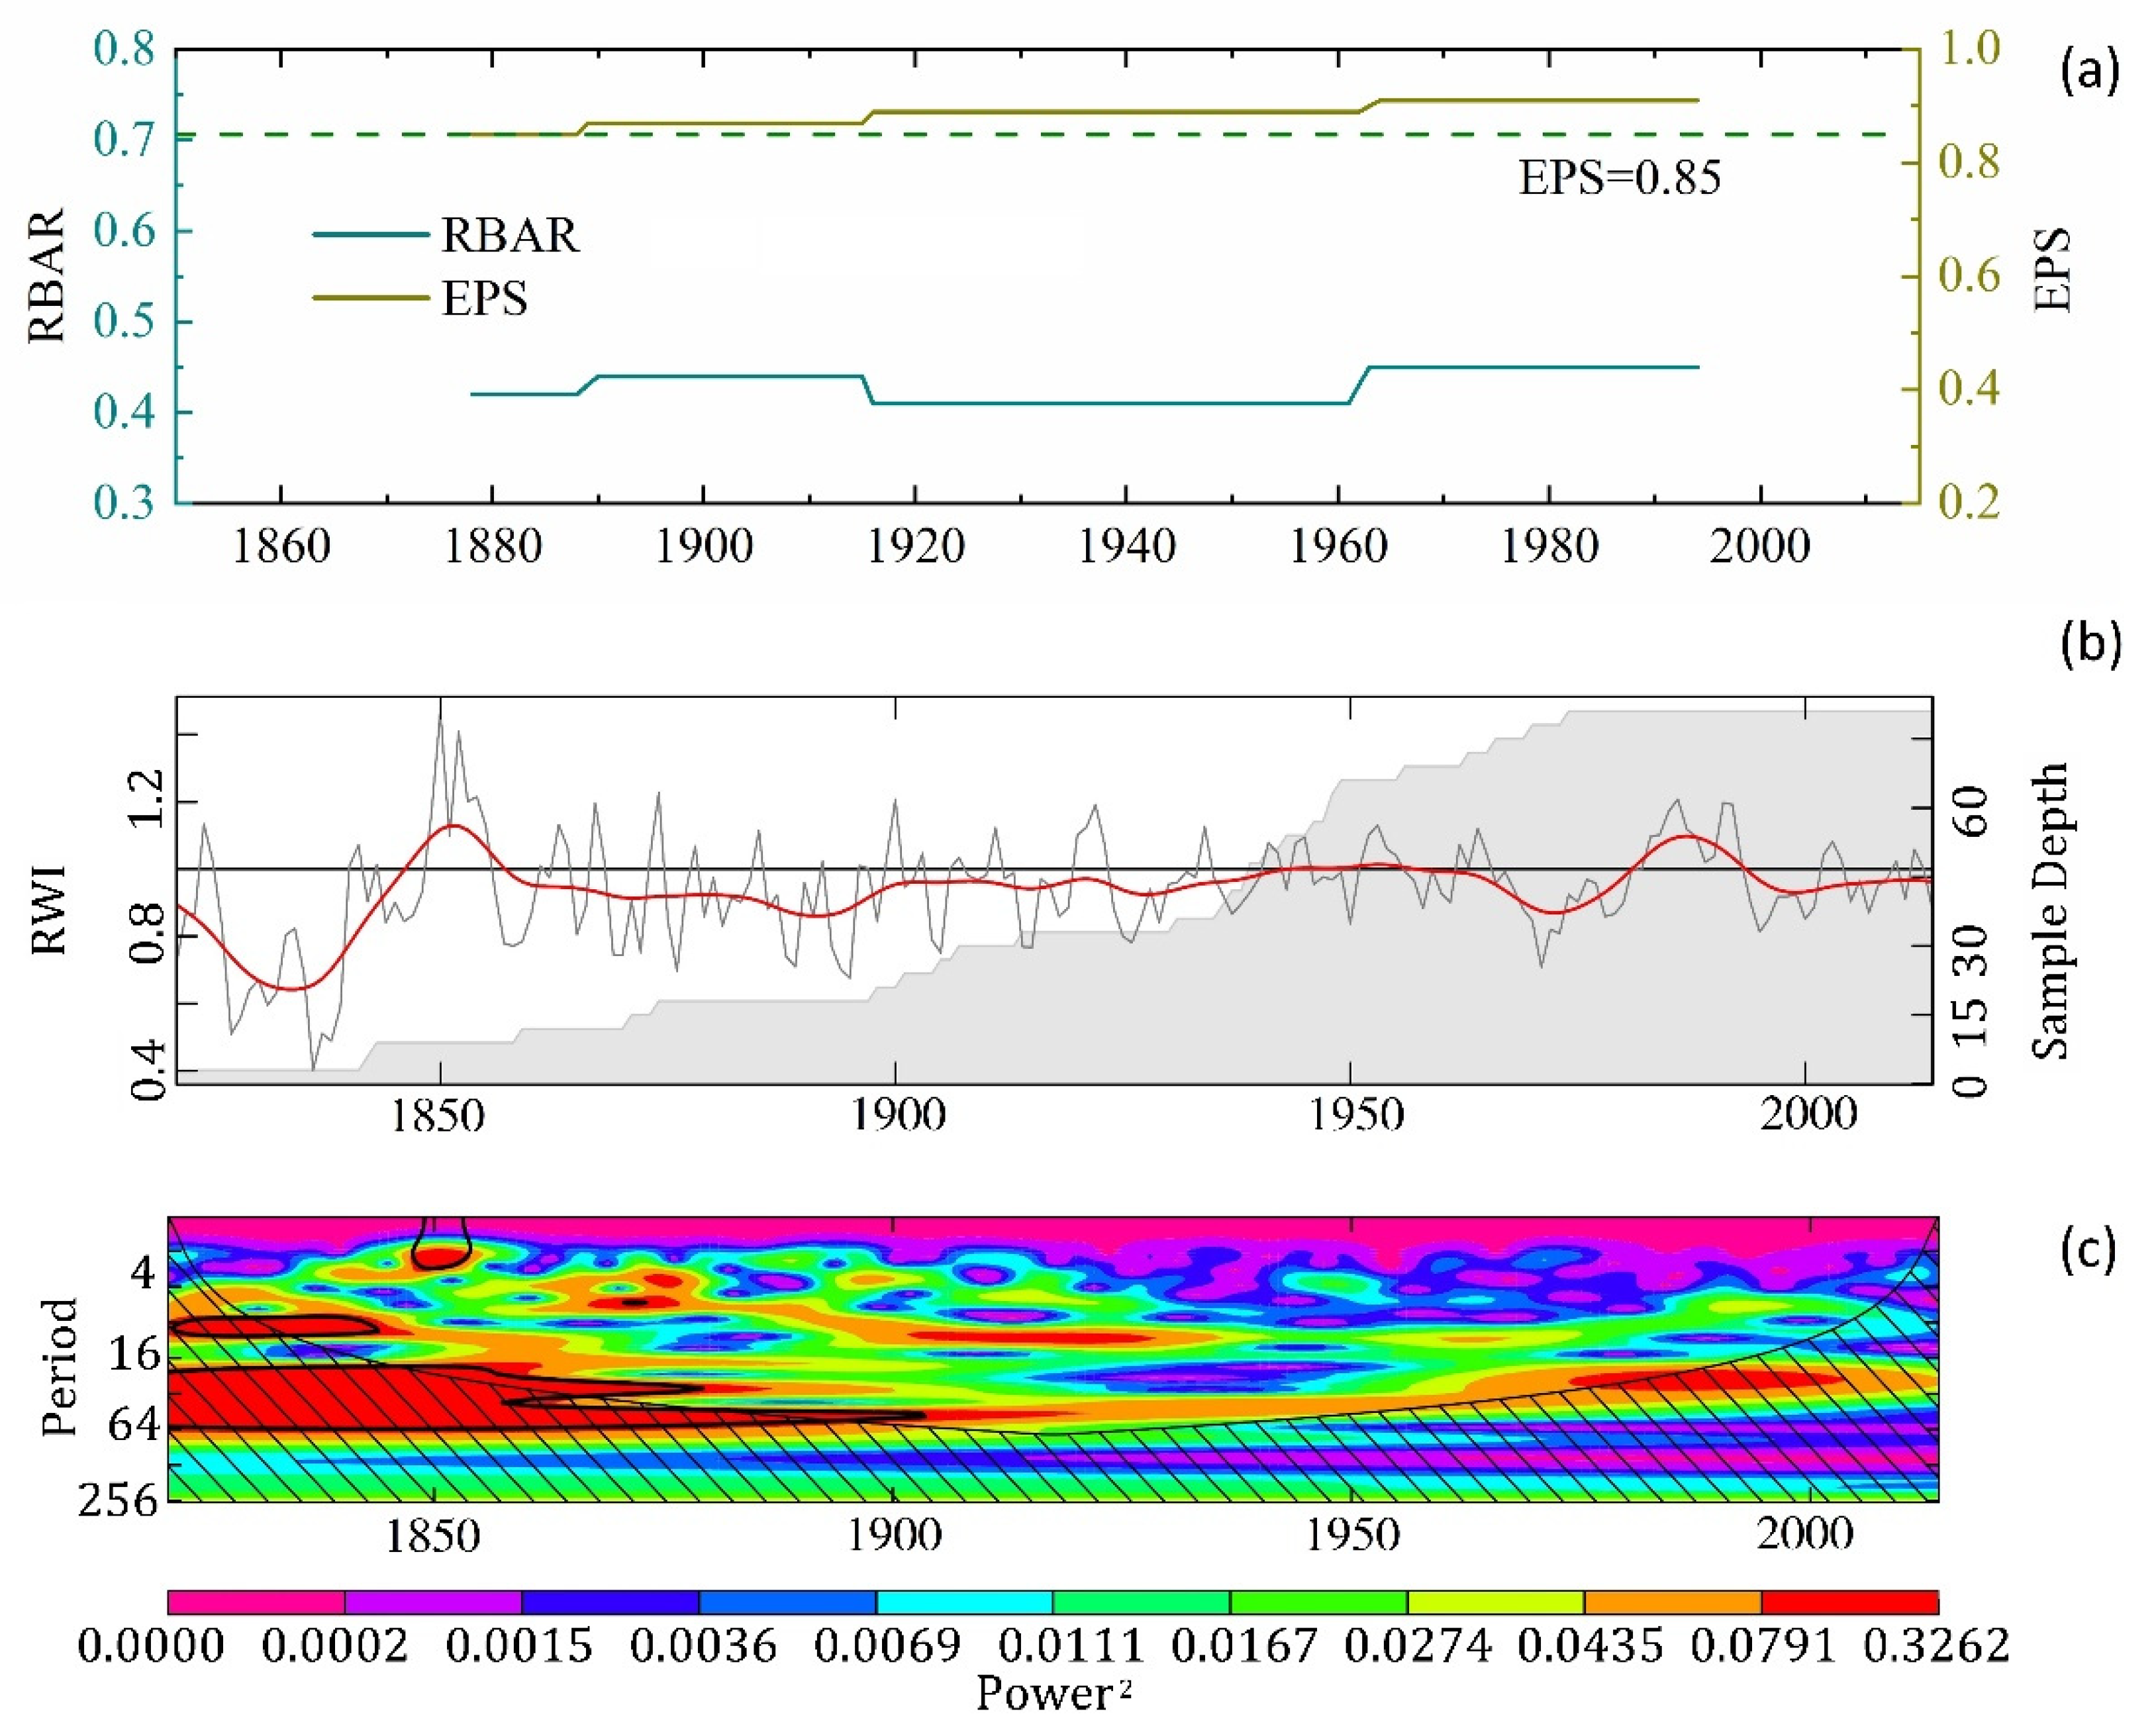
Figure 3.
(a) The composite tree-ring ∆13C chronology of Tajikistan. The thick red dotted line represents the 10-year moving average. The rufous and khaki dots represent the highest and lowest values, respectively; (b) Interannual patterns of ∆13C chronologies from the different sites. All the chronologies were centered to zero.

Figure 4.
Moving window correlations between the (a) TRW chronology of Tajikistan and temperature; (b) TRW chronology of Tajikistan and precipitation; (c) ∆13C chronology of Tajikistan and temperature; (d) ∆13C chronology of Tajikistan and precipitation of the previous March to the current November. The moving correlation was conducted in windows of 18 year, offset by 2 a. Blue shading indicates a positive correlation; red shading indicates a negative correlation. The asterisk (*) indicates a statistically significant correlation.

Figure 5.
Seascorr result summary of seasonal climatic signals in (a) TRW chronology of juniper and (b) Seascorr summary of seasonal climatic signals in the ∆13C chronology, showing responses of the tree-ring variable with monthly, 3-month total, and 6-month total for ending months from August preceding the growth (99% confidence limit). Previous year months are in lowercase letters, current year ones in uppercase letters. Simple correlations with the primary climate variable, temperature (top), and partial correlations with the secondary climate variable, precipitation (bottom).
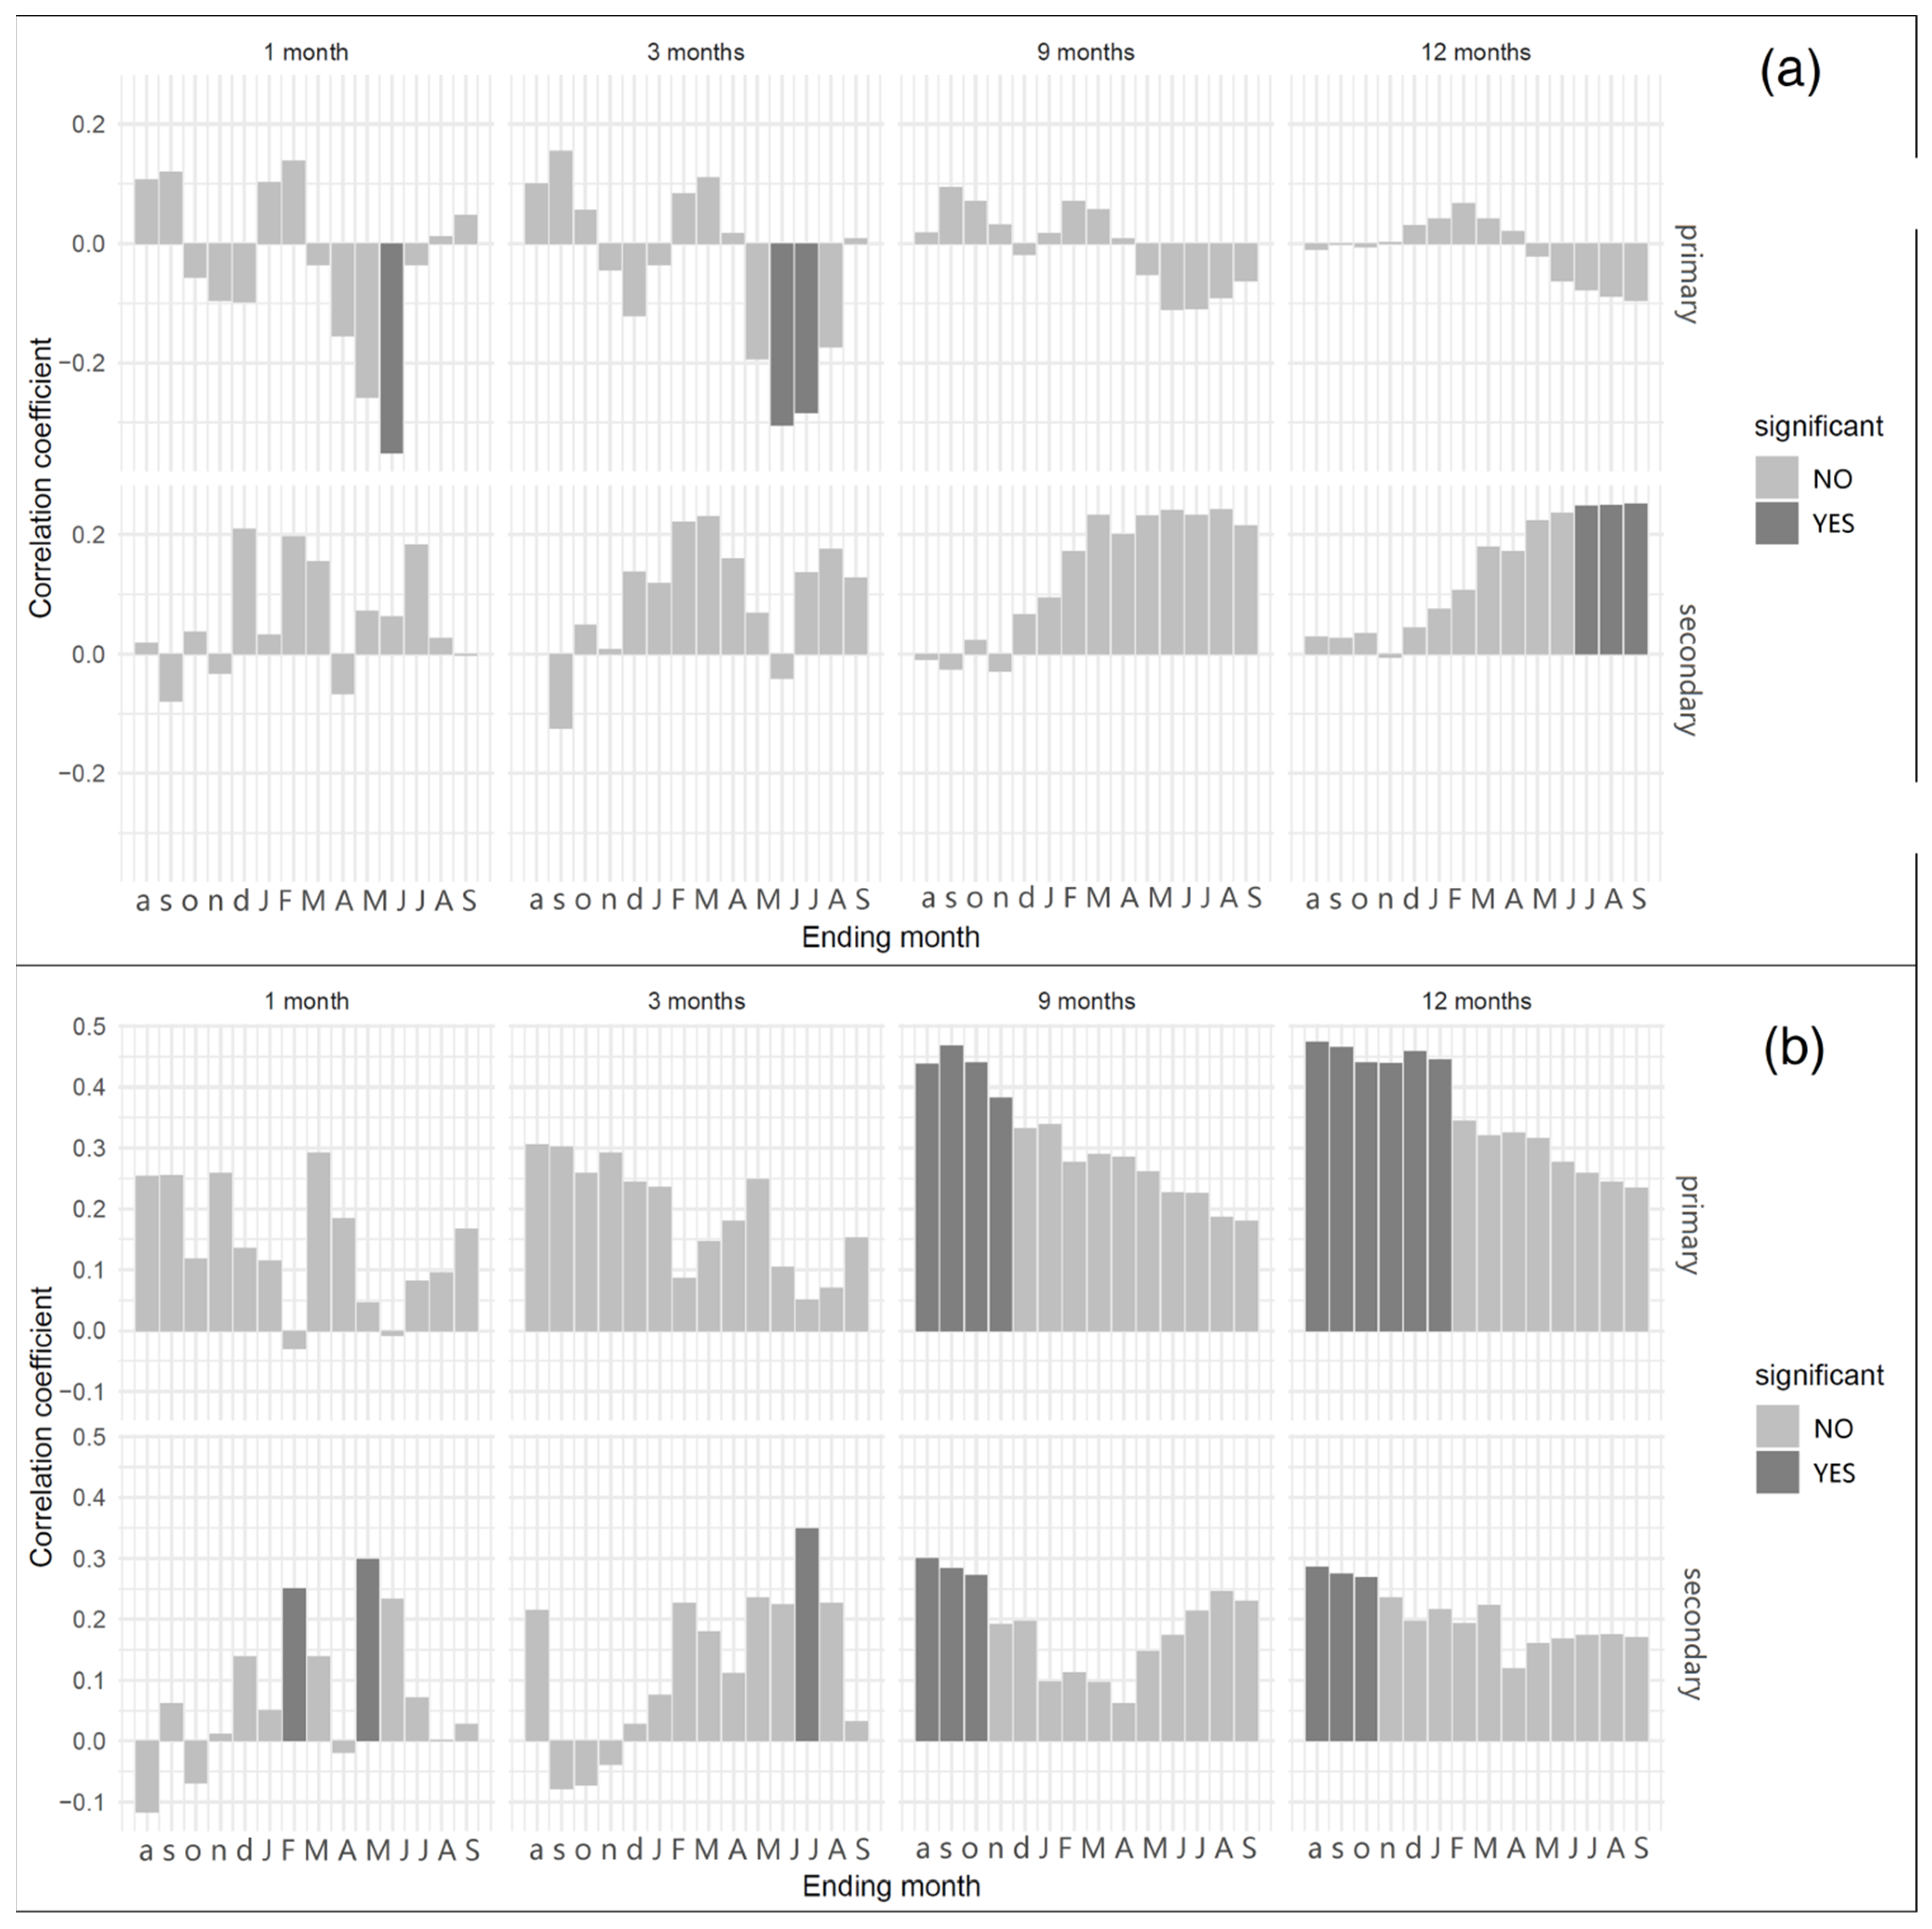
Figure 6.
(a) Cross-wavelet transform of the temperature and tree-ring isotopes; (b) wavelet coherence between temperature and tree-ring isotopes; (c) cross-wavelet transformation of the precipitation and tree-ring isotopes; (d) wavelet coherence between precipitation and tree-ring isotopes. The 5% significance level against the yellow noise is shown as a thick contour. The relative phase relationship is shown as arrows (with in-phase pointing right and antiphase pointing left). Arrows indicate the phase of the coherence, where the right is in-phase and the left is antiphase.

Table 1.
Information for juniper (Tajikistan) sampling sites of in Central Asia.
| Species | Site | Longitude | Latitude | Elevation | Aspect | Slope | Core/Tree No. |
|---|---|---|---|---|---|---|---|
| Juniperus seravschanica | JEJ | 39°11′18.35″ | 71°16′08.72″ | 1801 | NNE | 33 | 46/23 |
| TWL | 38°48′41.01″ | 70°20′58.05″ | 2149 | EES | 45 | 26/13 | |
| SBD | 38°52′44.57″ | 69°35′56.1″ | 1894 | S | 55 | 54/26 | |
| LMT | 38°54′28.34″ | 69°17′21.55″ | 1596 | EES | 40 | 44/22 | |
| SBH | 38°46′51.97″ | 69°25′11.46″ | 1361 | SSE | 44 | 34/17 | |
| YKH | 38°51′15.64″ | 69°59′35.72″ | 1175 | NNW | 30 | 40/20 | |
| Juniperus turkestanica | HTS | 39°09′46.11″ | 71°36′50.36″ | 3249 | S | 40 | 54/27 |
S, south; NNE, north to northeast; EES, east to southeast; SSE, south to southeast; NNW, north to northwest. Site name refers to the code name of sample sites; No., numbers of cores or trees.
Table 2.
Descriptive statistics for the composite TRW chronology and ∆13C chronology.
| Descriptive Statistics | NO. | MC | Std. Dev | MS | SNR | EPS | AC1 |
|---|---|---|---|---|---|---|---|
| TRW chronology | 221 | 0.37 | 0.33 | 0.48 | 5.61 | 0.93 | 0.68 |
| ∆13C chronology | 22 | 0.82 | 0.66 | 0.49 | 4.91 | / | 0.50 |
Note: NO., number of sample cores; MC, mean correlation between series; Std. Dev, standard deviation; MS, mean sensitivity; SNR, signal to noise ratio; EPS, the expressed population signal; AC1, first-order autocorrelation; TRW, tree-ring width.
Table 3.
Site information and Pearson correlation coefficients for tree-ring ∆13C chronologies among sites and tree-ring δ13C series within sites.
Table 3.
Site information and Pearson correlation coefficients for tree-ring ∆13C chronologies among sites and tree-ring δ13C series within sites.
| No. | Site | Time Span | Mean (‰) | Std. Dev | AC1 | Correlation Coefficients | |||
|---|---|---|---|---|---|---|---|---|---|
| LMT | TWL | SBD | Regional Iso-Series (Mean δ13C) | ||||||
| 1 | JEJ | 1946–2014 | −23.20 | 0.65 | 0.42 | 0.680 ** | 0.370 * | 0.475 ** | 0. 547 ** |
| 2 | LMT | 1950–2014 | −23.52 | 0.72 | 0.45 | 0.545 ** | 0.481 ** | 0.605 ** | |
| 3 | TWL | 1935–2014 | −23.45 | 0.65 | 0.56 | 0.390 * | 0.345 ** | ||
| 4 | SBD | 1948–2014 | −23.66 | 0.66 | 0.54 | 0. 455 ** | |||
Note: Std. Dev, standard deviation; AC1, first-order autocorrelation; * p < 0.05, two-tailed test; ** p < 0.01, two-tailed test.
Table 4.
Cross-correlation between ∆13C chronology and climatic factors (temperature and precipitation) and lags between them.
Table 4.
Cross-correlation between ∆13C chronology and climatic factors (temperature and precipitation) and lags between them.
| Growing Season Temp | Snowmelt Season Temp | Late Summer Prec | Winter Prec | |||||
|---|---|---|---|---|---|---|---|---|
| C–C r | Lag/Years | C–C r | Lag/Years | C–C r | Lag/Years | C–C r | Lag/Years | |
| ∆13C chronology | −0.482 ** | −1 | −0.675 * | −2 | 0.480 ** | −1 | 0.506 ** | −3 |
* p < 0.05, two-tailed test. ** p < 0.01, two-tailed test. C–C r is the cross-correlation coefficient. The autoregressive integrated moving average (ARIMA) models pre-whitened time series data of flows.
Publisher’s Note: MDPI stays neutral with regard to jurisdictional claims in published maps and institutional affiliations. |
© 2021 by the authors. Licensee MDPI, Basel, Switzerland. This article is an open access article distributed under the terms and conditions of the Creative Commons Attribution (CC BY) license (https://creativecommons.org/licenses/by/4.0/).
Share and Cite
MDPI and ACS Style
Fan, Y.; Shang, H.; Yu, S.; Wu, Y.; Li, Q. Understanding the Representativeness of Tree Rings and Their Carbon Isotopes in Characterizing the Climate Signal of Tajikistan. Forests 2021, 12, 1215. https://doi.org/10.3390/f12091215
AMA Style
Fan Y, Shang H, Yu S, Wu Y, Li Q. Understanding the Representativeness of Tree Rings and Their Carbon Isotopes in Characterizing the Climate Signal of Tajikistan. Forests. 2021; 12(9):1215. https://doi.org/10.3390/f12091215
Chicago/Turabian StyleFan, Yuting, Huaming Shang, Shulong Yu, Ye Wu, and Qian Li. 2021. "Understanding the Representativeness of Tree Rings and Their Carbon Isotopes in Characterizing the Climate Signal of Tajikistan" Forests 12, no. 9: 1215. https://doi.org/10.3390/f12091215
Note that from the first issue of 2016, this journal uses article numbers instead of page numbers. See further details here.